use of population viability analysis and reserve...
TRANSCRIPT

Ecological Applications, 13(6), 2003, pp. 1773-1789 ? 2003 by the Ecological Society of America
USE OF POPULATION VIABILITY ANALYSIS AND RESERVE SELECTION ALGORITHMS IN REGIONAL CONSERVATION PLANS
CARLOS CARROLL,1'5 REED E Noss,2 PAUL C. PAQUET,3 AND NATHAN H. SCHUMAKER4
'Klamath Center for Conservation Research, Orleans, California 95556 USA 2Department of Biology, University of Central Florida, Orlando, Florida 32816 USA
3Faculty of Environmental Design, University of Calgary, Calgary, Alberta, T2N 1N4 Canada 4U.S. Environmental Protection Agency, Western Ecology Division, Corvallis, Oregon 97333 USA
Abstract. Current reserve selection algorithms have difficulty evaluating connectivity and other factors necessary to conserve wide-ranging species in developing landscapes. Conversely, population viability analyses may incorporate detailed demographic data, but often lack sufficient spatial detail or are limited to too few taxa to be relevant to regional conservation plans. We developed a regional conservation plan for mammalian carnivores in the Rocky Mountain region using both a reserve selection algorithm (SITES) and a spatially explicit population model (PATCH). The spatially explicit population model in- formed reserve selection and network design by producing data on the locations of pop- ulation sources, the degree of threat to those areas from landscape change, the existence of thresholds to population viability as the size of the reserve network increased, and the effect of linkage areas on population persistence. A 15% regional decline in carrying capacity for large carnivores was predicted within 25 years if no addition to protected areas occurred. Increasing the percentage of the region in reserves from the current 17.2% to 36.4% would result in a 1-4% increase over current carrying capacity, despite the effects of landscape change. The population model identified linkage areas that were not chosen by the reserve selection algorithm, but whose protection strongly affected population vi- ability. A reserve network based on carnivore conservation goals incidentally protected 76% of ecosystem types, but was poor at capturing localized rare species. Although it is unlikely that planning for focal species requirements alone will capture all facets of bio- diversity, when used in combination with other planning foci, it may help to forestall the effects of loss of connectivity on a larger group of threatened species and ecosystems. A better integration of current reserve selection tools and spatial simulation models should produce reserve designs that are simultaneously biologically realistic and taxonomically inclusive.
Key words: carnivores; conservation planning; focal species; population viability analysis; re- gional conservation plans; reserve selection; Rocky Mountains.
INTRODUCTION
As the extent of human alteration of natural habitats
grows, efforts to conserve biodiversity increasingly fo- cus on land use planning on a regional scale. Because
gathering detailed information on regional species dis- tributions is difficult, reserve selection algorithms pri- marily use generalized species range maps or surro- gates derived from more easily collected data such as
vegetation, climate, and topography (Scott et al. 1993, Pressey et al. 2000). Information on the relative de- mographic roles of differing portions of a species's range (i.e., source and sink habitat; Pulliam [1988]), and their relative levels of demographic linkage in a
metapopulation, is seldom available. Simple reserve
design rules ("bigger is better," "connected is better than fragmented") may be used to adjust the output of reserve selection algorithms to create a more coherent
reserve design (Diamond 1975). Conversely, when
planning is focused on a single high-profile species, most population viability analyses (PVAs) provide only a composite evaluation of viability across a region be- cause of the difficulty of linking spatial data to de-
mographic processes (Boyce 1992, Beissinger and
McCullough 2002). Such simplification is defensible in the face of pressing needs to address the conser- vation of multiple species. Nevertheless, integrating tools used in single-species population viability anal-
ysis, such as spatially explicit population models
(SEPMs), with reserve selection tools can add biolog- ical realism to regional reserve designs and make them more effective at conserving wide-ranging species in
developing landscapes (Kareiva and Wennergren 1995, Noss et al. 2002).
We developed predictive models of distribution for
eight mammalian carnivore species across a study re-
gion in the Rocky Mountains of Canada and the United States extending from the Yukon/British Columbia bor- der to the Greater Yellowstone Ecosystem (GYE) (Fig.
Manuscript received 10 June 2002; revised 13 January 2003; accepted 24 February 2003. Corresponding Editor: M. G. Turner.
5 E-mail: [email protected]
1773

1774 CARLOS CARROLL ET AL. Ecological Applications Vol. 13, No. 6
M
HKWA-KE HIKA
S UDY REG
BRITIS LBE RTA
LUMBIA
I \ kLBERTA
NA MOUNTAI PARKS
ADIAN ROCKIE OR GION CA
NORTHERN CONTIN DIVIDE ECOSYS
TAN
CENTRAL IDO
GR
ER YEL
ONE COSYSTEM
150 km ,1 150 km
FIG. 1. Map of the study area in the Rocky Mountains of Canada and the United States. Protected area complexes referred to in the text, as well as the proposed Southern Rocky Mountains Conservation Area (SRMCA), are identified. The subregion used for comparison of carnivore and noncarnivore reserve designs is shown with light gray shading.
1). This region links boreal populations of several car- nivore species with smaller and more isolated popu- lations at their southern range margin (Carroll et al. 2001a). Therefore, conservation groups have focused attention on retaining landscape connectivity in this region (Paquet and Hackman 1995, Chadwick 2000). The species considered here (grizzly bear, Ursus arc- tos); black bear, Ursus americanus; gray wolf, Canis lupus; lynx, Lynx canadensis; mountain lion, Puma concolor; wolverine, Gulo gulo; fisher, Martes pen- nanti; and marten, Martes americana) include most of the large and medium-sized mammalian carnivores na- tive to the region. Such carnivores are often proposed as focal species because of their low population density
and sensitivity to human-induced landscape change (Weaver et al. 1996, Lambeck 1997; see Plate 1).
The predictive habitat models for these eight species, which we call the static models, combine data on var- ious habitat components to provide a snapshot of hab- itat quality and potential population distribution (Car- roll et al. 2001a). In contrast, SEPMs combine infor- mation on habitat characteristics with demographic data to evaluate area and connectivity factors that in- fluence the probability that a patch of suitable habitat will remain occupied by a species over time (Dunning et al. 1995, Kareiva and Wennergren 1995). Dynamic models such as SEPMs can add information in three areas: the response of a population to future landscape

December 2003 RESERVE SELECTION AND PVA 1775
PLATE 1. Much of the Rocky Mountain region of the United States and Canada is still characterized by ecological processes and species assemblages typical of wildland ecosystems, but these are increasingly impacted by development and resource extraction. (A) A gray wolf (Canis lupus) and grizzly bear (Ursus arctos) feed on a winter-killed bison (Bison bison) carcass in Yellowstone National Park, USA. Photograph by Doug Smith. (B) A development in the Bow Valley, Banff National Park, Canada. Photograph by Paul Paquet.
change, including areas of highest vulnerability to pop- ulation decline or extirpation; the locations of popu- lation source areas, which may differ from the areas of highest predicted habitat suitability or density (Van Horne 1983); and the response of a population to al- ternative conservation strategies. These models can be applied to only the best studied species because of their stringent data requirements. Even in these cases, results may be sensitive to variation in poorly known param- eters (Kareiva et al. 1996). Given the level of data typically available for mammalian carnivores, we sought to determine whether information from SEPMs is robust to data gaps and relevant to a wider suite of species to an extent that can justify their use in re- gional-scale planning. A better integration of current reserve selection tools and spatial simulation models should produce reserve designs that are simultaneously biologically realistic and taxonomically inclusive.
METHODS
Static models
The type of static model selected for this study varied among the eight species, based on the availability of regional occurrence data sets, e.g., tracks or sightings (Table 1) (Carroll et al. 2001a). We created empirical models, or resource selection functions, RSF (Manly et al. 1993), for the four species for which we had detailed survey data: black bear, lynx, wolverine, and fisher (Table 1). The empirical models for fisher, lynx, and wolverine, although similar to those described in Carroll et al. (2001a), differed in that the source of the satellite imagery was the Moderate Resolution Imaging Spectroradiometer (MODIS) sensor rather than the old- er Landsat Thematic Mapper sensor (Huete et al. 1997). We used regional-scale survey data for black bear (Mo- wat and Strobeck 2000) to create an empirical model for that species (Carroll et al. 2002).
TABLE 1. Summary of static habitat suitability models by species, showing type of model and input variables. Coefficients of variables are shown as positive (+), negative (-), or quadratic convex up (cx).
Conceptual model Empirical model (RSF)t Mountain
Variable Grizzly bear Wolf lion Marten Wolverine Lynx Fisher Black bear
Brightness Greenness + + + + + + Wetness - + Precipitation cx Snowfall + + Road density Human population Topography - + Tree closure + Protected area status + Elevation/latitude +
t RSF = resource selection functions.
1776 CARLOS CARROLL ET AL. Ecological Applications Vol. 13, No. 6
Species InitialOptimization Occurrence RSFDynamic Model
DataModels Model Results
Initial Static
Evaluation of Reserve Thresholds Selection
Results Results
Conceptual Models for
Fecundity and
Mortality
Dynamic Evaluation of Final
Corridors ese (PATC H) Design
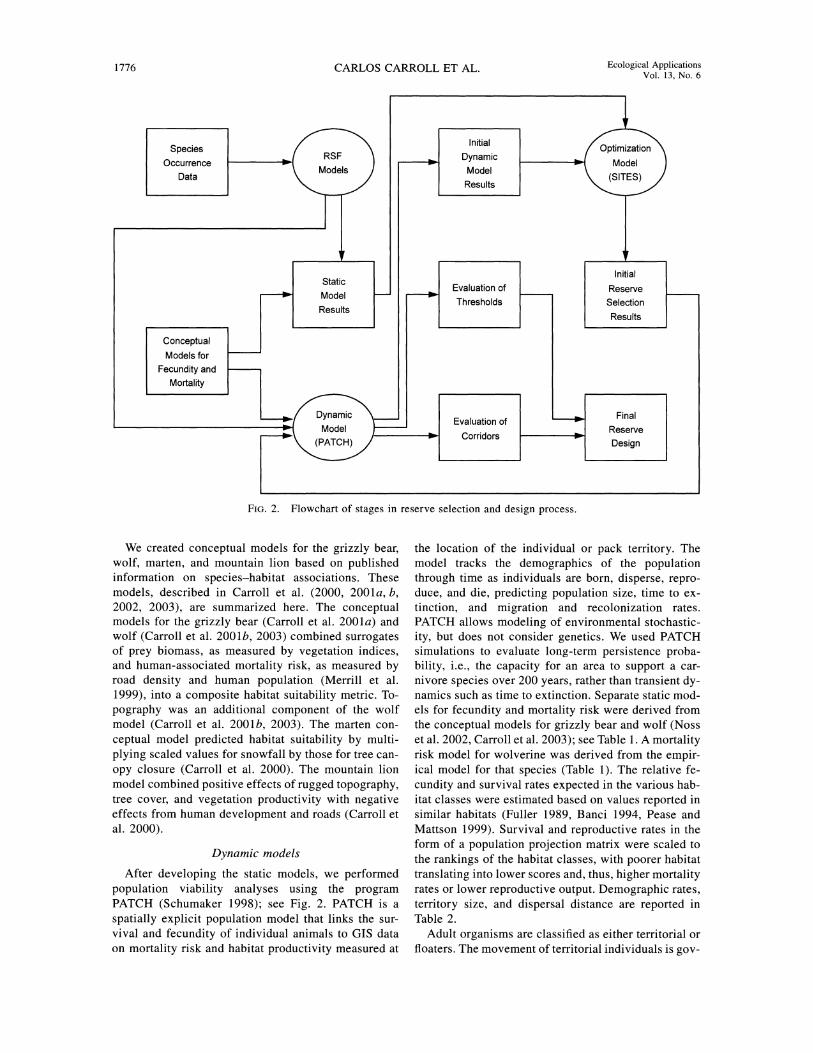
FIG. 2. Flowchart of stages in reserve selection and design process.
We created conceptual models for the grizzly bear, wolf, marten, and mountain lion based on published information on species-habitat associations. These models, described in Carroll et al. (2000, 2001a, b, 2002, 2003), are summarized here. The conceptual models for the grizzly bear (Carroll et al. 2001a) and wolf (Carroll et al. 2001b, 2003) combined surrogates of prey biomass, as measured by vegetation indices, and human-associated mortality risk, as measured by road density and human population (Merrill et al. 1999), into a composite habitat suitability metric. To- pography was an additional component of the wolf model (Carroll et al. 2001b, 2003). The marten con- ceptual model predicted habitat suitability by multi- plying scaled values for snowfall by those for tree can- opy closure (Carroll et al. 2000). The mountain lion model combined positive effects of rugged topography, tree cover, and vegetation productivity with negative effects from human development and roads (Carroll et al. 2000).
Dynamic models
After developing the static models, we performed population viability analyses using the program PATCH (Schumaker 1998); see Fig. 2. PATCH is a spatially explicit population model that links the sur- vival and fecundity of individual animals to GIS data on mortality risk and habitat productivity measured at
the location of the individual or pack territory. The model tracks the demographics of the population through time as individuals are born, disperse, repro- duce, and die, predicting population size, time to ex- tinction, and migration and recolonization rates. PATCH allows modeling of environmental stochastic- ity, but does not consider genetics. We used PATCH simulations to evaluate long-term persistence proba- bility, i.e., the capacity for an area to support a car- nivore species over 200 years, rather than transient dy- namics such as time to extinction. Separate static mod- els for fecundity and mortality risk were derived from the conceptual models for grizzly bear and wolf (Noss et al. 2002, Carroll et al. 2003); see Table 1. A mortality risk model for wolverine was derived from the empir- ical model for that species (Table 1). The relative fe- cundity and survival rates expected in the various hab- itat classes were estimated based on values reported in similar habitats (Fuller 1989, Banci 1994, Pease and Mattson 1999). Survival and reproductive rates in the form of a population projection matrix were scaled to the rankings of the habitat classes, with poorer habitat
translating into lower scores and, thus, higher mortality rates or lower reproductive output. Demographic rates, territory size, and dispersal distance are reported in Table 2.
Adult organisms are classified as either territorial or floaters. The movement of territorial individuals is gov-

December 2003 RESERVE SELECTION AND PVA 1777
TABLE 2. Parameters used in the PATCH model. Mean values are averaged over the entire region under current landscape conditions, including territories that did not support the species in the subsequent simulations.
Parameter Grizzly bear Wolf Wolverine
Territory size (km2) 270 504 270 Maximum dispersal distance (km) 56 254 92 Survival rates (maximum/mean)
Young, year 0 0.82/0.70 0.46/0.40 0.75/0.66 Subadult, year 1 0.92/0.78 0.86/0.76 0.95/0.84 Adult, year 2+ 0.94/0.80 0.96/0.84 0.95/0.84 At senescence (year in brackets) NA 0.69/0.61[8] 0.85/0.75[8]
Fecundity ratest (maximum/mean) Subadult, year 1 0/0 0/0 0.22/0.17 Adult, year 2 0/0 2.29/1.26 0.34/0.27 Adult, year 3+ 0.55/0.44 3.21/1.77 0.34/0.27
t Fecundity is given as the number of female offspring per adult female or pack.
erned by a site fidelity parameter, but floaters must
always search for available breeding sites. Source-sink behavior is tracked during a PATCH simulation as the difference between a hexagon's emigration and im-
migration rates. Movement decisions use a directed random walk that combines varying proportions of ran- domness, correlation (tendency to continue in the di- rection of the last step), and attraction to higher quality habitat. However, there is no knowledge of habitat
quality beyond the immediately adjacent territories (Schumaker 1998).
Because the model allows the landscape to change through time, we could quantify the consequences of
landscape change for population viability and examine
changes in vital rates and occupancy patterns that might result from habitat loss or restoration, both at the scale of the individual territory and for larger regions. The landscape change scenarios estimated potential change in human-associated impact factors (e.g., roads and hu- man population) by proportionately increasing road density (except within protected areas) and increasing human population based on recent trends derived from a time series of human census data. Census data were available for the period 1990-2000 (U.S. Census Bu- reau 1991) or 1990-1996 (Statistics Canada 1997). We
predicted human population growth from 2000 to 2025 based on growth rates from 1990 to 1996/2000, but adjusted the predicted 2025 population to match state- and subprovince-level predictions based on more com-
plex socioeconomic models (U.S. Census Bureau, un-
published data; British Columbia Ministry of Finance, unpublished data). Although landscape change was
predicted at a resolution of -I 1 km2, responses of car- nivore populations were predicted at the resolution of an individual territory and above (270-504 km2; Table 2). Because the rate of human-caused habitat change is generally faster than the rate of response of an af- fected carnivore population, a contrast exists between the time scale over which landscape change could be accurately predicted (25 years) and the time necessary
for carnivore populations to equilibrate to that change (up to 200 years).
Reserve selection
A principal tool of modern conservation planning is the reserve selection algorithm (Margules and Pressey 2000). The objective is to conserve biodiversity effi-
ciently within a network of reserves. An efficient re- serve design meets conservation objectives with a min- imal investment of area by building a network from
complementary sites. Early conservation assessments and reserve designs used manual mapping to delineate sites and simple scoring procedures to compare and rank sites (Noss 1993). Larger numbers of conservation
targets require the use of a more systematic and effi- cient site selection procedure. Increases in the number of targets or potential conservation sites result in an exponential increase in the computational time needed to find an exact solution (Pressey et al. 1996). There- fore, many current tools, such as the SITES model used here (Andelman et al. 1999, Possingham et al. 2000), employ heuristic algorithms to identify one or more "near-optimal" solutions that fulfill the selected goals efficiently. SITES uses a simulated annealing algorithm to reduce "cost" while maximizing attainment of con- servation goals in a compact set of sites. The function that SITES seeks to minimize is Cost + Species Penalty + Boundary Length, where Cost is the total monetary or area cost of all planning units selected for the net- work, Species Penalty is a cost imposed for failing to meet target goals, and Boundary Length is a cost de- termined by the total boundary length of the network (Andelman et al. 1999). Hence, SITES attempts to se- lect the smallest overall area needed to meet stated
goals and to select clustered rather than dispersed plan- ning units.
SITES performed 1 000 000 iterative attempts to find the minimum cost solution per run and performed 100 such runs for each alternative conservation scenario that we explored. The best (lowest cost) solution from

1778 CARLOS CARROLL ET AL. Ecological Applications Vol. 13, No. 6
each run of 1 000 000 iterations is reported, as well as which out of those 100 top candidates has the lowest cost. Besides identifying this latter solution, the "best run," SITES also rates areas by how often they were selected in the best solutions of the 100 alternate runs. An area that scored highly in this "summed runs" out-
put might not be included in the best solution, but could be considered a suitable alternative site.
Goals for the carnivore focal species were expressed as a percentage of the total habitat "value" in the re-
gion. This is more realistic than the common approach of classifying areas into two classes of unsuitable and suitable habitat (Scott et al. 1993). Habitat value was measured by the output of either the RSF model (Car- roll et al. 2001a) or conceptual model, depending on the species (Table 1). Habitat values from the concep- tual models cannot be directly linked to population size. Because RSF value is proportional to the number of animals that could be supported in an area (Boyce and McDonald 1999), conserving a set percentage of the RSF value might be expected to conserve that propor- tion of the potential regional population, if we ignore factors such as connectivity that may cause isolated habitat to remain unoccupied. Some additional portion of a population also will be present on nonreserve lands.
Ecoregions are commonly considered an appropriate scale at which to plan biodiversity conservation (Groves et al. 2000). However, a large ecoregion may encompass a wide range of ecosystems and levels of human impact, and our study area spans several ecore-
gions. Not surprisingly, the northern portion of the
study region shows higher carnivore habitat quality for most species than areas in the more developed trans-
boundary (U.S./Canada border) region. SITES may most efficiently achieve such goals as carnivore habitat
protection by locating reserves entirely in the northern
portion of the study region. However, this solution
poorly meets the goal of maintaining well-distributed and connected populations. Therefore, we stratified
goals by subdividing the study area into 88 sections derived from subregional ecosection classifications
(e.g., Demarchi and Lea 1992), which we modified to
produce a system of sections of similar size across the
study region. To balance the need for a well-distributed reserve network with the need for efficiency, we set the overall regional goal higher than the local section- level goal. For example, with a 40% regional/30% local
goal, SITES sought to capture 30% of the habitat value in each section, and added another 10% of habitat value wherever in the region this could be achieved at least cost. SITES requires an estimate of the cost of includ- ing each new site in the conservation network. This can be the monetary cost of the land, if known. This information is rarely available on an ecoregional scale, however, especially where most of the land base is in public ownership. We used the area of a site as a mea- sure of cost in all SITES runs.
Initial SITES runs used the static habitat suitability models for the eight species. Our design built upon the existing protected area network (Fig. 1) by locking ex- isting protected areas into the SITES solution, so that the program only added planning units with targets that were missing from the current park system. Locking in protected areas recognizes that, from a practical standpoint, achieving conservation goals within pro- tected areas is easier than adding currently unprotected areas.
Using dynamic model results to refine the reserve selection process
In the second stage of SITES modeling, we added
goals derived from the PATCH models for grizzly bear, wolf, and wolverine. These goals can be conceptualized as representing information on two characteristics of
potential reserve locations: their irreplaceability and
vulnerability (Margules and Pressey 2000). Irreplace- ability provides a quantitative measure of the relative contribution that different areas make to reaching con- servation goals, thus helping planners to choose among alternative sites. Irreplaceability can be defined in two
ways: (1) the likelihood that a particular area is needed to achieve an explicit conservation goal; or (2) the extent to which the options for achieving an explicit goal are narrowed if an area is not conserved (Pressey et al. 1994, Margules and Pressey 2000). Irreplace- ability in this context is the relative value of an area as source habitat (lambda, or population growth rate, from the PATCH model). Although measured at the scale of an individual territory, it can also be sum- marized at the scale of a region or of the planning units used in the SITES model. Source habitat is an appro- priate metric because it is the key to population per- sistence (Pulliam 1988). Vulnerability is measured here as the predicted decline in demographic value (lambda) over the next 25 years.
An approach that sets priority areas for conservation action based on both their irreplaceability and vulner-
ability is practical because it acknowledges that a com-
pleted reserve network will not be achieved immedi-
ately. Therefore, we must minimize the loss to con- servation during an interim period when new reserves are being established in some areas while habitat loss continues elsewhere (Pressey and Taffs 2001). Ideally, we would directly interface optimization models and SEPMs to choose the reserve design that most effi-
ciently maximizes viability for all target species. Due to computational limits, however, it is not possible to evaluate the transient population dynamics resulting from landscape change for each of the million iterative solutions produced in a single SITES run. Therefore, we attempted to build sensitivity to population dynam- ics and landscape change into SITES by assessing ir- replaceability on a site-by-site basis, using our dynamic population model output. Because in this step we eval- uate irreplaceability separately for each species, our

December 2003 RESERVE SELECTION AND PVA 1779
use of the term is not entirely equivalent to previous definitions that simultaneously considered multiple conservation goals (e.g., Margules and Pressey 2000). Values were plotted on a graph of irreplaceability (y- axis) vs. vulnerability (x-axis) and the graph was di- vided into four quadrants, following the procedure of
Margules and Pressey (2000). The upper right quadrant, which includes areas with high irreplaceability and
high vulnerability, comprises the highest priority sites for conservation. This top tier is followed by the upper left and lower right quadrants, not necessarily in that order. The upper left quadrant contains areas of rela-
tively secure source habitat. Areas in the lower right quadrant include sink habitats whose protection would enhance population viability by reducing mortality rates of animals dispersing from adjacent high-quality sources. Finally, the lower left quadrant comprises ar- eas that are putatively replaceable (low source value) and face less severe threats. We used two PATCH-based
goals per species. One goal targeted areas with a high source value and high threat (the upper right quadrant of the graph). A second goal targeted highest value source habitats (the upper portions of both upper quad- rants). By capturing both types of habitat, short-term
range contraction could be halted by protecting the most vulnerable sources while protecting enough se- cure sources to maintain viability over the long term. No goals were set for representing the lower right quad- rant (threatened sinks) within reserves, as theseareas, which often include human settlements, may benefit more from alternate management strategies that reduce conflicts between humans and carnivore species.
Setting conservation goals in a reserve selection al- gorithm is often difficult because information is un- available on the threshold amount of habitat necessary to insure population viability. To address this question and factors such as connectivity that are ignored by SITES, we used PATCH to evaluate the incremental gain from adding areas selected in the SITES modeling. These results differed from adding PATCH-derived data to the SITES model itself, because we evaluated how the potential new reserves function as a network to conserve viable populations as the landscape chang- es over time. We performed this evaluation for the griz- zly bear and wolf, the species for which we had the most developed and accurate PATCH models, as val- idated by independent data (Carroll et al. 2002). Ad-
ditionally, the general results from the PATCH mod- eling suggest how reserve design rules may differ be- tween species regarding connectivity and patterns of threat. We built an overall conservation design by start- ing from the best run solution from SITES and adding additional areas to serve as linkages, based on infor- mation on regional population structure derived from the PATCH models. Once information on the general location of linkages was derived from PATCH, the ex- act location was determined using the SITES summed runs results, which identify areas that are nearly as
important as those included in the best run. We describe here one such corridor addition in the area between the Canadian Mountain Parks and the Northern Continental Divide Ecosystem (NCDE; see Fig. 1). This area in- cludes the proposed Southern Rocky Mountains Con- servation Area (SRMCA; Fig. 1), which is currently (2002) being reviewed for inclusion in the protected areas system. We evaluated whether this area was se- lected in the SITES solutions, and if not, whether its inclusion affected carnivore distribution as predicted by the PATCH model.
Comparing networks for carnivores and other conservation goals
The use of particular focal species in developing regional conservation plans (Carroll et al. 2001a), com-
plements two other major tracks of conservation plan- ning: special elements and ecosystem representation (Noss and Cooperrider 1994, Noss et al. 2002). The
special elements approach concentrates on occurrences of imperiled species, plant communities, and other rare natural features, as are found in conservation data cen- ter databases (Groves et al. 2000). The representation approach seeks to capture examples of all geoclimatic or vegetation types in a network of protected areas. We could assess the ability of carnivore-based reserve de- signs to serve other conservation goals in the central portion of our study region (Fig. 1), with the help of data on noncarnivore goals developed in The Nature
Conservancy/Nature Conservancy of Canada (TNC)'s planning process for the Canadian Rockies ecoregion. Five of the carnivore species from the larger analysis (grizzly bear, wolf, lynx, wolverine, and fisher) were identified as conservation targets for the Canadian Rockies region by TNC's planning team. We used the values from the static models for these five species as targets in the SITES analysis. TNC identified special element targets by considering species with Heritage ranks of G (critically imperiled globally) to G3 (vul- nerable globally), and then added other species of con- cern due to factors including declining populations or status as an endemic, disjunct, or vulnerable population (Rumsey et al. 2003). Element occurrence data were assembled for several types of conservation targets, including rare vascular and nonvascular plant species, rare plant communities, terrestrial animals that are ei- ther rare (six gastropods) or declining (four amphibi- ans, one butterfly, and two mammals), and breeding sites for eight bird species that are declining or of spe- cial concern. The special element goals for the SITES runs sought to capture a set proportion of the known occurrences of each species or community type. All occurrences of the rarest elements were targeted. For more common species, the goal was the proportion of the known occurrences thought to be sufficient to insure viability of the population (Groves et al. 2000).
Ecosystem-based conservation strategies include the goal of representing all major environmental gradients.

1780 CARLOS CARROLL ET AL. Ecological Applications Vol. 13, No. 6
This "coarse filter" is hypothesized to capture occur- rences of species about which little is known and there- fore would not be captured by the special elements or focal species approaches (Groves et al. 2000). In the absence of good maps of how plant communities are distributed in response to environmental gradients, TNC developed representation goals based on Ecolog- ical Land Units (ELUs) derived from abiotic variables such as elevation, landform, slope, aspect, hydrologic regime, and surficial geology (Rumsey et al. 2003). The coarse-scale map of potential vegetation type or bio-
geoclimatic zone (Demarchi and Lea 1992) was then overlaid on the ELUs across the entire ecoregion. Rep- resentation targets were set at 10% of each ELU/veg- etation type combination, and at least 30% of each
vegetation type. SITES scenarios that build reserve networks by first
including existing protected areas are generally the most informative for practical planning. For this com-
parison, however, we did not lock in protected areas, in order to assess the distribution of biodiversity across the landscape without regard to political boundaries. We compared two contrasting networks based on car- nivore goals or noncarnivore goals.
RESULTS
Static models
Comparison of management categories with predic- tions of habitat suitability from the static models sug- gests that current protected areas hold a higher than
expected amount of habitat for the wolverine, lower than expected for the lynx and fisher, and a percentage similar to its proportion of the region (17.2%) for the other species. Nonreserved public lands, which make up 58.2% of the region, tend to be more valuable than
expected based on area, but especially so for lynx and marten, and also for wolf, wolverine, and mountain lion. Private lands are less valuable than expected by their percentage of the region (24.6%), but have dis-
proportionately high value for wolf, fisher, and black bear. Areas of high biological productivity and rela- tively low human influence between Jasper and Musk- wa Parks and in northcentral Idaho (Fig. 1) were most
frequently selected in the SITES runs.
Dynamic models
The results of the dynamic models support many conclusions from the static models, but add information on the likely reduction in occupancy due to landscape change and on the distribution of sources and sinks. Predicted changes in occupancy for grizzly bear show semi-disjunct refugia in the northern United States threatened on their margins by habitat loss (Fig. 3). More extensive range contraction and fragmentation are evident in southern Canada, where higher elevation core areas are fragmented by localized strong sinks, and fringed on the southern edge by a retreating range
margin of extensive sink habitat. The pattern of source and sink distribution indicates that even where the spe- cies persists, we will see the early stages of extirpation, in which previously continuous habitat is fragmented by development along road corridors and river valleys. Although the results for the wolf suggest that the po- tential currently exists for recolonizing animals to ex-
.pand into much of the Rocky Mountains of the northern United States, these areas are threatened over the long- term with the prospect of becoming sinks (Fig. 3). Sink habitat for the wolf is more concentrated in productive lowlands than in rugged southeastern British Columbia. The wolverine has greater dispersal ability than the
grizzly bear (Weaver et al. 1996). This allows smaller southern wolverine populations to remain demograph- ically connected to the more continuous northern pop- ulations (Kyle and Strobeck 2001). Nevertheless, areas of demographic vulnerability exist even in the core of wolverine range in the larger study area (Fig. 3).
Using dynamic model results to refine the reserve selection process
In the second stage of the SITES modeling, we added two PATCH-based goals per species (Fig. 2). A map of habitat that meets the two goals for grizzly bear (Fig. 4) shows the contrast between areas scoring highly for the two goals. SITES solutions that considered only the three carnivore species (grizzly bear, wolf, and wol- verine) for which we had PATCH-based goals allowed a detailed comparison of static and dynamic model- based priorities. The static model-based sites are more concentrated at the edges of existing parks and in core areas in northern British Columbia, whereas the PATCH-based sites are found in vulnerable areas in the southern portion of the study region and in buffer zones in northern British Columbia. SITES solutions for the three species using the PATCH-based goals are slightly more efficient than those based on static models. A network based on PATCH goals requires 26.7% of the
region to achieve the same level of potential grizzly bear population size shown by a static model-based network covering 30.8% of the region (n = 198, t =
-495, P < 0.0001 for two-sample t test for significant difference between the two means). This is equivalent to a reduction in size of the necessary reserve network
by -30 000 km2. Because networks based on both the eight static mod-
els and the PATCH results appear more efficient than those using the static models alone (Table 3), we used the former approach for all of our final SITES runs. The best run for the lowest set of goals (30% regional/ 20% local) encompasses 27% of the region, that is, existing protected areas (17%) plus an additional 10% of the region. For the 40%/30% and 50%/30% goals, network size increases to 36% and 45% of the region, respectively, with --10% on private land. Therefore, the percentage of the networks that is on currently non-

December 2003 RESERVE SELECTION AND PVA 1781
A
ALBERTA
MONTANA
DECREASE IN OCCUPANCY (%)
5-18
a
18-35 S35-50
50-100 ALBERTA ALBERTA No Data
M NMO
MONTANA MONTANA " el
l,
~ri~o'
FIG. 3. Reduction in equilibrium probability of occupancy, or potential carrying capacity, due to landscape change from 2000 to 2025 for (A) grizzly bear, (B) gray wolf, and (C) wolverine, as predicted by the PATCH model.

1782 CARLOS CARROLL ET AL. Ecological Applications Vol. 13, No. 6
SORC
<
5 i taw
THREATENED SINK
.... .'•:•••VULNERAE p•ILITY
q ~ ~ , ,q
a O
. 'IL
1 .,
?
?~\ .-. -
,[ "
?
FIG. 4. Example of SEPM-based goals used in reserve selection (SITES) runs. Areas shown in black lie in Quadrant 1 (top right) of the irreplaceability/vulnerability graph for grizzly bear, that is, areas with both high value as source habitats and high threat. Areas shown in gray are the highest value source habitats, that is, the upper portions of quadrants 1 and 2 (top left) of the irreplaceability/vulnerability graph for grizzly bear. Areas that meet both goals are shown in black.
TABLE 3. Summary of SITES networks and results of evaluation of networks using the PATCH model.
Network goals (%) Total of Percentage by category? RSF habitat value (%)
Regional Local region (%) 1 2 3 4 Grizzly bear Wolf Wolverine
30 20 27.3 34 22 35 9 30.1 31.0 34.8 40 30 36.4 26 18 44 12 40.1 41.1 44.6 50 30 44.6 22 15 52 11 50.1 52.1 57.0 Current areas 17.2 59 41 NA NA 19.2 19.8 23.6
t Management categories are defined according to the GAP Analysis program system: 1, strictly protected; 2, moderately protected; 3, general public lands; 4, general private lands.

December 2003 RESERVE SELECTION AND PVA 1783
reserved public lands grows in size from 34% to 52% as goals increase (Table 3).
We found that a landscape with no additional pro- tected areas would lose 13.8% (wolf), 14.4% (grizzly bear), and 15.8% (wolverine) of its long-term carrying capacity within 25 years (Table 3). Losses in scenarios in which only private lands were developed were 7.3% for the wolf and 6.1% for the grizzly bear. However, range loss is unevenly distributed. Protecting sites identified using a 30% regional/20% local goal would reduce the expected loss due to landscape change to 4.6% (grizzly bear) and 2.6% (wolf) from current car-
rying capacity. Protecting sites identified using a 40%
regional/30% local goal would result in a 1.3% (grizzly bear) to 3.7% (wolf) gain over current carrying capacity (Table 3).
Networks of increasing size capture a linearly in-
creasing percentage of static habitat value.. This rela-
tionship is similar for the three species (Table 3). These results offer no surprises. However, when we projected current development trends to 2025 and used the PATCH model to assess how the alternative networks function in an increasingly developed matrix, we ob- tained results that would not have been anticipated from the static model. The results suggest the existence of thresholds in the effect of increased habitat protection on population viability (Fig. 5, Table 3). Increasing network size has the greatest effects on population vi-
ability up to -37% of the study region (Fig. 5A). When we contrasted the future distribution of grizzly
bear and wolf under current levels of protected areas to that under the 40% regional/30% local SITES net- work (Fig. 6), we found that adding sites in the trans-
boundary region prevented the loss of connectivity be- tween the NCDE and the Canadian Rocky Mountain Parks and sustained smaller grizzly bear subpopula- tions in southeastern British Columbia and the northern United States. Larger networks also may restore con- nectivity between the Greater Yellowstone Ecosystem (GYE) and central Idaho for grizzly bear. The wolf showed similar, but more broadly distributed, increases in distribution (Fig. 6). Although sites in the northern
portion of the study area would help to increase pop- ulations there, much of the increase in wolf distribution (as opposed to abundance) would be in the U.S. north-
ern Rockies, especially between the GYE and central Idaho (Fig. 6).
The vulnerability of the NCDE to isolation supported the addition of a corridor linking it to northern carni- vore populations. Our potential corridor, the Southern
Rocky Mountains Conservation Area (SRMCA; see
Fig. 1), was not selected in the SITES solutions due to moderate levels of human-associated development. However, the addition of the SRMCA to the network
appears to be effective in preserving a continuous dis- tribution of grizzly bear and wolf between the Canadian Mountain Parks and the NCDE (Fig. 6A, B).
Integrating the sites and patch results into conservation planning
A landscape prioritization that locks in existing pro- tected areas and uses both static models for the eight species and PATCH-based goals for three species (Fig. 7) suggests priorities for one or more new protected areas in northcentral British Columbia between Jasper National Park and the Muskwa-Kechika area, a possible eastern addition to the Muskwa-Kechika protected area, and new protected areas in north-central Idaho. Carnivore target levels were set here at 40% regional/ 30% local, based on the PATCH evaluation (Fig. 5). Networks based on more modest goals generally iden- tified priority areas in the same regions (i.e., nested within the priority areas shown here). Potential buffer and linkage areas can be identified from the summed- runs solution for the 40%/30% goals (Fig. 7).
Comparing networks for carnivores and other conservation goals
Setting carnivore goals to 35% in the Canadian Rockies ecoregion produced a reserve network of the same size as one constructed from special elements and
representation goals; 55% of the area was shared be- tween the carnivore and noncarnivore reserve net- works. Areas of overlap tended to have both high bi- ological productivity and low human impacts. The SITES solution based on representation and special el- ement goals alone offered more balanced protection to the carnivore focal species than did current protected areas, which are predominantly at higher elevations. The network captured 30-34% of the total habitat value
TABLE 3. Extended.
Percentage of current carrying Total regional carrying capacity in 2025 capacity (PATCH model) (percentage of 2000 carrying capacity)
Grizzly bear Wolf Wolverine Grizzly bear Wolf
33.2 29.9 35.4 95.4 97.4 43.2 39.9 45.2 101.3 103.7 54.8 50.9 58.0 104.3 105.9 22.9 19.1 25.2 85.6 86.2

1784 CARLOS CARROLL ET AL. Ecological Applications Vol. 13, No. 6
for the different carnivore species. Value captured was slightly lower for lynx (30.4%) and fisher (30.7%), and higher for grizzly bear (33.3%), wolverine (33.7%), and wolf (34.0%). Current protected areas, which con- sist of -22.6% of the region, provide disproportion- ately large habitat value for wolverine (31.6%), grizzly bear (25.5%), and wolf (23.5%), but perform poorly for lynx (17.7%) and especially fisher (9.9%); see Car- roll et al. (2001a).
A SITES solution developed from carnivore goals only (the 35% level) suggests that a diverse set of car- nivore species produces a better "umbrella" effect than
any single species. Nevertheless, coverage of noncar- nivore goals varied widely depending on the specific goal (Table 4). Overall, coverage of special elements was poorer than coverage of representation targets. This may be partially an artifact of the lack of surveys for rare species in the northern portions of the region. This area also contains the best carnivore habitat, lead-
ing to artificially poor congruence between carnivore and special elements goals. Whereas the percentage of
targets covered by carnivores ranged from 19% (non- vascular plants) to 50% (birds) for special elements, carnivores covered 76% of the representation targets (Table 4).
DIscussIoN
The approach to reserve design used here integrates population viability analysis tools such as spatially ex-
plicit population models (SEPMs) with reserve selec- tion algorithms to build flexible and biologically re- alistic conservation strategies. By linking demography to mapped habitat characteristics, the SEPMs reveal how these areas may influence the overall viability of the region's carnivore species under current and future conditions. Our approach may be most applicable in regions where much of the landscape has not yet been developed and thus is "available" for conservation; because of this lack of development, intensive biodi- versity surveys (e.g., of rare species locations) have not been conducted. In this type of region, the focal species approach is relevant because options for re- taining regional landscape connectivity remain and there is a need to incorporate surrogates that can com-
pensate for the lack of data on many taxa. The models help to elucidate the contrasting patterns
of distribution among the eight carnivore species (Car- roll et al. 2001a). The species can be grouped along two axes of habitat association (Carroll et al. 2001a): an axis ranging from habitat generalists sensitive to human impact to human-tolerant forest specialists (Mattson et al. 1996) and an axis of topographic tol- erance (use or avoidance of rugged terrain). These pat- terns imply that the current distribution of protected areas, concentrated in the most rugged portions of the study area (the central Canadian Rockies), should be augmented by new conservation areas in regions of lower topographic relief and higher biological produc-
120 - Grizzly Bear
--. Wolf
' 110
100- 0 a)
90 SA
L_
n 80
0
S120
U. 100
90
20 30 40 50 Portifolio size (percentage of region)
FIG. 5. Responses of grizzly bear and wolf populations, as predicted by the PATCH model, to reserve networks of varying size, in (A) the study region as a whole and (B) the Canadian Rockies ecoregion.
tivity that still have mild enough human impacts to support the large carnivores. Our results identify at least two such areas: north-central Idaho (Carroll et al. 2001a) and the area between the Canadian Mountain Parks and Muskwa-Kechika protected areas in British Columbia (Fig. 1). Comparison of model predictions with new survey data sets suggests that both static and dynamic models were relatively robust for the large carnivores, whereas distribution of the lesser known mesocarnivores was more difficult to predict, espe- cially on a local scale (Carroll et al. 2002). Although the PATCH model may predict current distribution with a level of accuracy similar to that of the simpler static model, the insights that it produces concerning popu- lation processes and response to future scenarios justify its use. Nevertheless, the level of uncertainty that prop- agates through the SITES and PATCH modeling sug- gests that the final reserve design (Fig. 7) should be used to identify generalized areas of conservation em- phasis rather than exact management boundaries. The level of uncertainty is partially quantified by the SITES summed-runs results (Fig. 7).
The dynamic model results concern those carnivores most sensitive to direct human impacts: grizzly bear, wolf, and wolverine. Some overlap in core areas and critical linkages is evident among these three species.

December 2003 RESERVE SELECTION AND PVA 1785
A - B
! i ALBERTA ,ALBERTA
. . . . ..
M NN
FIG. 6. Contrast in long-term persistence probability, as predicted by the PATCH model, for (A) grizzly bear and (B) wolf, under current trends extrapolated to 2025 (gray) and with new conservation areas based on the 40% regional/30% local goals network (gray plus black). Only areas with long-term persistence probability >50% are shown.
The interplay of habitat productivity and mortality risk, however, is mediated by the species' differing ecolog- ical resilience, as expressed in their demographic and social structure (Weaver et al. 1996). These differences result in greater contrasts in the distribution patterns and conservation priorities among the species than would be expected based on habitat associations alone (Fig. 3).
Focal-species planning based on dynamic models differs from that based purely on habitat suitability, in that the most threatened areas in the irreplaceability/ vulnerability graphs do not necessarily face the highest level of development pressure, but qualify because of their locations adjacent to large source populations (Fig. 4). This makes habitat degradation in these areas a major demographic threat to regional carnivore pop- ulations. Improving conditions in strong sinks can be as important to regional viability as protecting strong sources because of their effect on neighboring source habitat. Decisions concerning whether to protect the most vulnerable areas or more secure habitat can be made based, in part, on the strategic time line and pol- icy focus of a particular conservation organization or land management agency.
Coordinated management strategies addressing hab- itat and connectivity across national, state, and pro- vincial boundaries are critical to the survival of car- nivores in the Rocky Mountain region (Paquet and
Hackman 1995, Noss et al. 1996). Trade-offs must be addressed between allocating scarce conservation re- sources toward protecting relatively secure core areas, stemming the degradation of threatened buffer zones, or restoring linkages that are already degraded but might contribute to long-term persistence of metapop- ulations. The combination of data on irreplaceability and vulnerability allows us to develop a defensible in- cremental strategy linking immediate conservation needs with longer term goals for a comprehensive con- servation network. Although we refer to areas identi- fied in the selection algorithms as potential reserves, they may be categorized more broadly as focal areas for carnivore conservation that may require various
policy changes, ranging from designation of new re- serves to restrictions on specific activities such as trap- ping or development.
When we use the PATCH model to compare SITES networks of different size across the study region as a whole, thresholds are evident that help us answer the question "How much is enough?" to ensure carnivore population viability. Our approach allows conservation
planners to move beyond such simple design rules as "bigger is better" and "connected is better than dis- connected," to rigorous and defensible design pre- scriptions. The completed reserve designs include areas identified in the SITES runs that use both static-model and PATCH-based goals, and add additional linkage

1786 CARLOS CARROLL ET AL. Ecological Applications Vol. 13, No. 6
SExisting reserve
New focal area
D Alternate area
SLimited data
ALBE
0 A
(-
FIG. 7. A composite SITES network incorporating current protected areas and new priority areas from the 40% regional/ 30% local goals SITES best run. Alternate areas shown in gray were included in one or more of 100 replicate SITES solutions, with darker gray indicating inclusion in a larger proportion of the 100 solutions.
areas that appear to affect population distribution in PATCH and also score highly in the SITES "sum runs" results. This method uses the model results not to iden- tify a single best reserve network, but as complemen- tary sources of information in a decision support sys- tem.
The ability of a protected area to support carnivores depends on its area, isolation, and habitat quality (Woodruffe and Ginsberg 1998). Because parks often occur in areas of low biological productivity, even the largest parks are unlikely to retain their full comple- ment of species if isolated (Newmark 1995, Carroll et al., in press). Our results suggest that substantial con- servation commitments will be necessary to prevent the northward retreat of carnivore populations in the region and to sustain transboundary populations threat- ened by the demographic risks associated with small
size and isolation. Thresholds to population persistence are evident in the region as a whole (Fig. 5A), but not in the Canadian Rockies Ecoregion (Fig. 5B), because the latter area is at the retreating range margin for large carnivores (Fig. 6A, B), where each increase in pro- tected areas results in a corresponding increase in car- nivore viability. This underscores the difficulty in pro- viding general guidelines for the amount of protected area necessary to insure species viability (Soule and
Sanjayan 1998). Protection of relatively extensive landscape linkages
such as the proposed Southern Rocky Mountains Con- servation Area may be necessary to preserve functional
connectivity between the Northern Continental Divide
Ecosystem (NCDE) and more northerly populations. Low levels of gene flow between adjacent grizzly bear
populations in southeastern British Columbia demon-

December 2003 RESERVE SELECTION AND PVA 1787
TABLE 4. Capture of noncarnivore targets by a carnivore-based network for the Canadian Rockies ecoregion. Because targets are stratified geographically, several targets may be associated with each species.
Number of Percentage Average Class of target targets Number met met shortfall (%)
Vascular plants 215 56 26 89 Nonvascular plants 57 11 19 94 Birds 36 18 50 89 Gastropods 12 1 8 94 Amphibians 14 6 43 94 Rare mammals 11 3 27 90 Carnivores 55 55 100 NA Butterflies 5 2 40 90 Rare plant communities 105 40 38 95 ELU/Vegetation types 3052 2327 76 74 Matrix plant communities 75 26 35 64 Riparian communities 34 17 50 46 Patch plant communities 170 86 51 74 Wetlands 11 7 64 58 Total (excluding carnivores) 3796 2600 68 78
strate that functional connectivity already may have been lost for this species in some parts of the trans- boundary region (Proctor 2001). Potential linkages are unlikely to be chosen by reserve selection algorithms because they traverse an area of ongoing range frag- mentation and high development threat, and therefore have only moderate habitat suitability. Current methods of adding design criteria to selection algorithms, such as the Boundary Length Modifier used in SITES (An- delman et al. 1999), cannot address these issues (Briers 2002). Connectivity is not an abstract feature of land- scapes, but rather concerns population processes such as dispersal (Beier and Noss 1998). Therefore, this fac- et of reserve design may be where mechanistic models such as SEPMs are most useful.
Presence or absence of individuals is often a poor indicator of the importance of an area for maintaining population viability (Tyre et al. 2001). Our PATCH results suggest that reserve design based only on static habitat suitability models may be poor at conserving species that are more vulnerable than expected due to unique aspects of their demography or social structure. For example, the large territory size of the wolf, which is a social animal, may make it particularly sensitive to mortality risk near the boundaries of reserves, as well as to the effects of environmental stochasticity (Woodruffe and Ginsberg 1998, Carroll et al. 2003).
Viability of wide-ranging species such as carnivores is a high priority in regions such as the Rocky Moun- tains, but this goal must increasingly be integrated with the larger mandate of biodiversity conservation (Noss and Cooperrider 1994). Our comparison of reserve net- works designed for carnivores with those designed for other biodiversity surrogates suggests that even an in-
telligently selected group of potential umbrella species will not coincidentally conserve rare species or other special elements. In relatively undeveloped regions such as this one, the overlap between the goals of con- serving wide-ranging species and representing ecosys-
tems may simplify reserve design. However, neither approach will compensate for a lack of data on locally distributed rare species. Lack of such information will be a greater problem in lower latitude regions with higher rates of endemism than present in the Rocky Mountains (Noss et al. 1996).
Development of complex and data-hungry models such as SEPMs may seem a low priority for regional conservation planning. Nevertheless, our results sug- gest that these models can add information on habitat thresholds and the effect of corridors that is unavailable from reserve selection algorithms or simple reserve design rules. The increased efficacy of a conservation network that incorporates data from SEPMs may imply differences in the tens of thousands of square kilo- meters over a large region, which probably justifies the increased data requirements of such models. These con- clusions appear to be robust enough to data gaps to aid conservation of the species for which the SEPMs are developed. Moreover, they bring a unique component into the conservation planning process by requiring us to consider population viability as it relates to habitat configuration, in judging the effectiveness of alterna- tive reserve networks. Reserve designs based on the needs of a well-selected group of focal species serve fairly well as a coarse filter for ecosystem types, al- though they do not adequately protect localized rare species. Although we evaluated the overlap between carnivore and noncarnivore reserve designs, we did not determine whether the reserve configuration and con- nectivity lessons are directly applicable to a larger suite of species. In balance, our results suggest that SEPMs have reached the stage of development at which they can serve as a practical tool for regional conservation planning. Although addressing viability requirements for carnivores appears to require a larger commitment of the land base than do other conservation goals such as ecosystem representation (assuming that represen- tation goals are typically modest), this may be only

1788 CARLOS CARROLL ET AL. Ecological Applications Vol. 13, No. 6
because we know more about the biology of individual carnivore species. Meeting the needs of wide-ranging species may help to forestall the still poorly known effects of loss of connectivity on other species and
ecosystems by creating a reserve system that is a whole
greater than the sum of its parts.
ACKNOWLEDGMENTS
This study was funded by World Wildlife Fund Canada and The Nature Conservancy and their contributors, with addi- tional support provided by The Wilburforce Foundation, the Kendall Foundation, The Yellowstone to Yukon Initiative, Parks Canada, and the Calgary Foundation. ESRI (Redlands, California, USA) provided software. The information in this document has been funded, in part, by the U.S. Environmental Protection Agency. It has been subjected to the Agency's peer and administrative review, and has been approved for pub- lication as an EPA document. Mention of trade names or commercial products does not constitute endorsement or rec- ommendation for use. We are grateful to G. Mowat, M. Gi- beau, and D. Smith for sharing unpublished field data and to B. Butterfield for furnishing ecoregional planning data. We would like to thank the following individuals for assistance: A. Hackman, S. Price, S. Alexander, M. Andrews, M. Austin, M. Badry, V. Banci, B. Butterfield, D. Carr, J. Copeland, L. Craighead, C. Daly, S. Donelon, D. Gilbride, B. Hall, S. Herrero, D. Hillary, M. Jalkotzy, K. Kunkel, P. Lee, M. Mahr, D. Mattson, T. Merrill, M. Quinn, R. Redmond, B. Robinson, I. Ross, C. Rumsey, B. Runnels, D. Sachs, A. Shilsky, C. Stewart, J. Weaver, C. White, J. Wierzchowski, J. Williams, and M. Wood. J. Dunning, M. Turner, and one anonymous reviewer provided helpful reviews of the manuscript.
LITERATURE CITED
Andelman, S., I. Ball, E Davis, and'D. Stoms. 1999. SITES Version 1.0: an analytical toolbox for designing ecoregional conservation portfolios. The Nature Conservancy, Boise, Idaho. [Online: (http://www.biogeog.ucsb.edu/projects/tnc/ download.htm) (accessed 31 December 2002).]
Banci, V. 1994. Wolverine. Pages 99-127 in L. E Ruggiero, K. B. Aubry, S. W. Buskirk, L. J. Lyon, and W. J. Zielinski, technical editors. The scientific basis for conserving forest carnivores: American marten, fisher, lynx, and wolverine. USDA Forest Service Rocky Mtn. Forest and Range Ex- periment Station, Ft. Collins, Colorado. General Technical Report RM-254.
Beier, P., and R. E Noss. 1998. Do habitat corridors provide connectivity? Conservation Biology 12:1241-1252.
Beissinger, S. R., and D. R. McCullough, editors. 2002. Pop- ulation viability analysis. University of Chicago Press, Chi- cago, Illinois, USA.
Boyce, M. S. 1992. Population viability analysis. Annual Review of Ecology and Systematics 23:481-506.
Boyce, M. S., and L. L. McDonald. 1999. Relating popu- lations to habitats using resource selection functions. Trends in Ecology and Evolution 14:268-272.
Briers, R. A. 2002. Incorporating connectivity into reserve selection procedures. Biological Conservation 103:77-83.
Carroll, C., R. E Noss, and P. C. Paquet. 2000. Carnivores as focal species for conservation planning in the Rocky Mountain region. World Wildlife Fund Canada, Toronto, Ontario, Canada. [Online, URL: (http://www.wwf.ca/en/ res_links/rl_resources.asp) (accessed December 2002).]
Carroll, C., R. E Noss, and P. C. Paquet. 2001a. Carnivores as focal species for conservation planning in the Rocky Mountain region. Ecological Applications 11:961-980.
Carroll, C., R. E Noss, and P. C. Paquet. 2002. Rocky Moun- tain Carnivore Project-Final Report. World Wildlife Fund Canada. Toronto, Ontario, Canada. [Online, URL: (http://
www.wwf.ca/en/res_links/rl_resources.asp) (accessed De- cember 2002).]
Carroll, C., R. E Noss, P. C. Paquet, and N. H. Schumaker. In press. Extinction debt of protected areas in developing landscapes. Conservation Biology.
Carroll, C., R. E Noss, N. H. Schumaker, and P C. Paquet. 2001b. Is the return of the wolf, wolverine, and grizzly bear to Oregon and California biologically feasible? Pages 25-46 in D. Maehr, R. Noss, and J. Larkin, editors. Large mammal restoration: ecological and social challenges in the 21st century. Island Press, Washington, D.C., USA.
Carroll, C., M. K. Phillips, N. H. Schumaker, and D. W. Smith. 2003. Impacts of landscape change on wolf restoration success: planning a reintroduction program using dynamic spatial models. Conservation Biology 17:536-548.
Chadwick, D. 2000. Yellowstone to Yukon. National Geo- graphic Society, Washington, D.C., USA.
Demarchi, D. A., and E. C. Lea. 1992. Regional and zonal ecosystems in the Shining Mountains. Province of British Columbia, Ministry of Environment, Lands and Parks. Wildlife Branch, Habitat Inventory Section. Victoria, Brit- ish Columbia, Canada.
Diamond, J. M. 1975. The island dilemma: lessons of modern biogeographic studies for the design of natural preserves. Biological Conservation 7:129-146.
Dunning, J. B., Jr., D. J. Stewart, B. J. Danielson, B. R. Noon, T. L. Root, R. H. Lamberson, and E. E. Stevens. 1995. Spatially explicit population models: current forms and fu- ture uses. Ecological Applications 5:3-11.
Fuller, T. K. 1989. Population dynamics of wolves in north- central Minnesota. Wildlife Monographs 105:1-41.
Groves, C., L. Valutis, D. Vosick, B. Neely, K. Wheaton, J. Touval, and B. Runnels. 2000. Designing a geography of hope: a practitioner's handbook for ecoregional conser- vation planning. The Nature Conservancy, Arlington, Vir- ginia, USA.
Huete, A. R., H. Q. Liu, K. Batchily, and W. van Leeuwen. 1997. A comparison of vegetation indices over a global set of TM images for EOS-MODIS. Remote Sensing of the Environment 59:440-451.
Kareiva, P., D. Skelly, and M. Ruckelshaus. 1996. Reeval- uating the use of models to predict the consequences of habitat loss and fragmentation. Pages 156-166 in S. T. A. Pickett, R. S. Ostfeld, M. Schachak, and G. E. Likens, editors. The ecological basis of conservation: heteroge- neity, ecosystems, and biodiversity. Chapman and Hall, New York, New York, USA.
Kareiva, P, and U. Wennergren. 1995. Connecting landscape patterns to ecosystem and population processes. Nature 373:299-302.
Kyle, C. J., and C. Strobeck. 2001. Genetic structure of North American wolverine (Gulo gulo) populations. Molecular Ecology 10:337-347.
Lambeck, R. J. 1997. Focal species: a multi-species umbrella for nature conservation. Conservation Biology 11:849- 856.
Manly, B. E J., L. L. McDonald, and D. L. Thomas. 1993. Resource selection by animals. Chapman and Hall, New York, New York, USA.
Margules, C. R., and R. L. Pressey. 2000. Systematic con- servation planning. Nature 405:243-253.
Mattson, D. J., S. Herrero, R. G. Wright, and C. M. Pease. 1996. Designing and managing protected areas for bears: how much is enough? Pages 133-164 in R. G. Wright, editor. National parks and protected areas: their role in environmental protection. Blackwell Science, Cambridge, Massachusetts, USA.
Merrill, T., D. J. Mattson, R. G. Wright, and H. B. Quigley. 1999. Defining landscapes suitable for restoration of griz-

December 2003 RESERVE SELECTION AND PVA 1789
zly bears (Ursus arctos) in Idaho. Biological Conservation 87:231-248.
Mowat, G., and C. Strobeck. 2000. Estimating population size of grizzly bears using hair capture, DNA profiling, and mark-recapture analysis. Journal of Wildlife Management 64:183-193.
Newmark, W. D. 1995. Extinction of mammal populations in western North American national parks. Conservation Biology 9:512-526.
Noss, R. E 1993. A bioregional conservation plan for the Oregon Coast Range. Natural Areas Journal 13:276-290.
Noss, R. E, C. Carroll, K. Vance-Borland, and G. Wuerthner. 2002. A multicriteria assessment of the irreplaceability and vulnerability of sites in the Greater Yellowstone Ecosys- tem. Conservation Biology 16:895-908.
Noss, R. E, and A. Cooperrider. 1994. Saving nature's legacy: protecting and restoring biodiversity. Island Press, Wash- ington, D.C., USA.
Noss, R. E, H. B. Quigley, M. G. Hornocker, T. Merrill, and P. C. Paquet. 1996. Conservation biology and carnivore conservation in the Rocky Mountains. Conservation Bi- ology 10:949-963.
Paquet, P. C., and A. Hackman. 1995. Large carnivore con- servation in the Rocky Mountains. World Wildlife Fund Canada, Toronto, Ontario, Canada, and World Wildlife Fund U.S., Washington, D.C., USA.
Pease, C. M., and D. J. Mattson. 1999. Demography of the Yellowstone grizzly bears. Ecology 80:957-975.
Possingham, H. P., I. R. Ball, and S. Andelman. 2000. Math- ematical methods for identifying representative reserve net- works. Pages 291-306 in S. Ferson and M. Burgman, ed- itors. Quantitative methods for conservation biology. Springer-Verlag, New York, New York, USA.
Pressey, R. L., T. C. Hager, K. M. Ryan, J. Schwarz, S. Wall, S. Ferrier, and P. M. Creaser. 2000. Using abiotic data for conservation assessments over extensive regions: quanti- tative methods applied across New South Wales, Australia. Biological Conservation 96:55-82.
Pressey, R. L., I. R. Johnson, and P. D. Wilson. 1994. Shades of irreplaceability: towards a measure of the contribution of sites to a reservation goal. Biodiversity and Conservation 3:242-262.
Pressey, R. L., H. P. Possingham, and C. R. Margules. 1996. Optimality in reserve selection algorithms: When does it matter and how much? Biological Conservation 76:259- 267.
Pressey, R. L., and K. H. Taffs. 2001. Scheduling conser- vation action in production landscapes: priority areas in western New South Wales defined by irreplaceability and vulnerability to vegetation loss. Biological Conservation 100:355-376.
Proctor, M. 2001. Grizzly bear habitat and population frag- mentation in the Central Selkirk Mountains and surround- ing region of southeast British Columbia. Unpublished re- port to Forest Renewal British Columbia, Nelson, British Columbia, USA.
Pulliam, R. 1988. Sources, sinks, and population regulation. American Naturalist 132:652-661.
Rumsey, C., et al. 2003. Canadian Rocky Mountains ecore- gional assessment. Volume One. Report. Nature Conser- vancy of Canada, Victoria, British Columbia, Canada.
Schumaker, N. H. 1998. A user's guide to the PATCH model. EPA/600/R-98/135. U.S. Environmental Protection Agency, Environmental Research Laboratory, Corvallis, Oregon. [On- line, URL:(http://www.epa.gov/naaujydh/pages/models/ patch/patchmain.htm) (accessed 31 December 2002).]
Scott, J. M., E Davis, B. Csuti, R. Noss, B. Butterfield, C. Groves, J. Anderson, S. Caicco, E D'Erchia,
T..C. Edwards,
J. Ulliman, and R. G. Wright. 1993. Gap analysis: a geo- graphical approach to protection of biological diversity. Wildlife Monographs 123.
Soule, M. E., and M. A. Sanjayan. 1998. Conservation tar- gets: do they help? Science 279:2060-2061.
Statistics Canada. 1997. A national overview: 1996 Census of Canada. Publication 93-357-XPB. Industry Canada, Ot- tawa, Ontario, Canada.
Tyre, A. J., H. P Possingham, and D. B. Lindenmayer. 2001. Inferring process from pattern: can territory occupancy pro- vide information about life history parameters? Ecological Applications 11:1722-1737.
U.S. Census Bureau. 1991. Census of the United States: 1990. U.S. Government Printing Office, Washington, D.C., USA.
Van Horne, B. 1983. Density as a misleading indicator of habitat quality. Journal of Wildlife Management 47:893- 901.
Weaver, J. L., P. C. Paquet, and L. E Ruggiero. 1996. Re- silience and conservation of large carnivores in the Rocky Mountains. Conservation Biology 10:964-976.
Woodruffe, R., and J. R. Ginsberg. 1998. Edge effects and the extinction of populations inside protected areas. Sci- ence 280:2126-2128.