use of phase-contrast mra to assess intracranial venous ... · sion have normal blood flow in the...
TRANSCRIPT
ORIGINAL RESEARCHADULT BRAIN
Use of Phase-Contrast MRA to Assess Intracranial Venous SinusResistance to Drainage in Healthy Individuals
X S. Fall, X G. Page, X J. Bettoni, X R. Bouzerar, and X O. Baledent
ABSTRACT
BACKGROUND AND PURPOSE: Resistance to blood flow in the cerebral drainage system may affect cerebral hemodynamics. Theobjective of the present study was to use phase-contrast MRA to quantify resistance to drainage of blood across branches of the venoussinus tree and to determine whether the resistance to drainage values correlated with internal jugular vein outflows.
MATERIALS AND METHODS: We performed whole-head phase-contrast MRA and 2D phase-contrast MR imaging in 31 healthy volun-teers. Vascular segmentation was applied to the angiograms, and the internal jugular vein velocities were quantified from the flow images.Resistance to drainage across branches of the venous sinus tree was calculated from the segmented angiograms, by using the Poiseuilleequation for laminar flow. Correlations between the values of resistance to drainage and internal jugular vein outflow measurements wereassessed by using the Spearman �.
RESULTS: The overall mean resistance to drainage of the venous sinus tree was 24 � 7 Pa s/cm3. The mean resistance to drainage of theright side of the venous sinus tree was 42% lower than that of the left side (P � .001). There were negative correlations between the valuesof resistance to drainage and internal jugular vein outflows on both the left side of the venous sinus tree (R � �0.551, P � .002) and the rightside (R � �0.662, P � .001).
CONCLUSIONS: Phase-contrast MRA is a noninvasive means of calculating the resistance to drainage of blood across the venous sinustree. Our approach for resistance to drainage quantification may be of value in understanding alterations in the cerebral venous sinusdrainage system.
ABBREVIATIONS: AI � asymmetry index; IJV � internal jugular vein; PC-MRA � phase-contrast MR angiography; Rd � resistance to drainage
The cerebral venous sinus system is characterized by anatomic
variations1 associated with marked interindividual variability
in blood drainage patterns.2 The venous compartment is gener-
ally compliant, whereas the walls of the sinuses tend to be rigid. In
comparison with the intracranial arterial system, the venous sinus
system has received less attention in the imaging-based evaluation
of cerebrovascular diseases in clinical research, possibly because
the pathologies that affect the intracranial venous sinus system are
less common than those affecting the arterial system and often
present a broad spectrum of clinical manifestations.3 However,
alterations in cerebral hemodynamics are known to be associated
with abnormal drainage in the cerebral venous sinus system. For
example, impaired intracranial drainage is widely cited as one of
the prime causes in idiopathic intracranial hypertension,4-7 intra-
cranial dural arteriovenous fistula malformation,8 communicat-
ing and noncommunicating hydrocephalus,9,10 and multiple
sclerosis.11 Nevertheless, a suspected case of venous stenosis must
be assessed with caution12 because misinterpretation can lead to a
nonindicated operation (with all its associated non-negligible
risks). This point is clearly illustrated by the debate over the in-
volvement of jugular venous stenosis in the pathogenesis of mul-
tiple sclerosis. In multiple sclerosis, it has been shown that percu-
taneous transluminal angioplasty of extracranial veins with
suspected alterations is ineffective, may exacerbate underlying
disease activity, and can lead to serious complications.13
In clinical practice, intraluminal vessel defects and/or patho-
logic flow velocities of the intracranial drainage system are usually
evaluated by using contrast-enhanced or unenhanced MR imag-
ing,5 CTA,14 DSA,15 or transcranial Doppler sonography.16 Al-
Received April 20, 2016; accepted after revision September 11.
From the BioFlow Image Laboratory (S.F., G.P., O.B.), University of Picardy JulesVerne, Amiens, France; Maxillofacial Department (J.B.) and Medical Image Process-ing Department (R.B., O.B.), University Hospital of Picardy, Amiens, France; andICube-IRMA (S.F.), Strasbourg University, Illkirch, France.
The research was funded in part by the French National Research Agency (grantANR-12-MONU-0010).
Please address correspondence to Sidy Fall, MD, BioFlow Image, University of PicardyJules Verne, Chemin du Thil, F-80000, Amiens, France; e-mail: [email protected]
http://dx.doi.org/10.3174/ajnr.A5013
AJNR Am J Neuroradiol 38:281– 87 Feb 2017 www.ajnr.org 281

though unenhanced vascular imaging techniques are less sensitive
than contrast-enhanced techniques, they may be of value for an
initial evaluation of the venous system in neonates or in patients
who are allergic to contrast agents or have kidney dysfunction.
Unenhanced 3D phase-contrast MRA (PC-MRA) offers several
advantages: It is relatively rapid, is often appropriate for patient
follow-up, and is associated with a lower complication rate.17,18
The results of patient evaluations usually show that a narrower
luminal cross-section can produce higher flow resistance and
therefore a decrease in flow and an increase in pressure—at least
in the region adjacent (proximal) to the lesion. Moreover, venous
sinus manometry has shown an elevated sagittal sinus pressure
and a significant drop in transverse sinus pressure in patients with
idiopathic intracranial hypertension.19 Other researchers have
shown that most patients with idiopathic intracranial hyperten-
sion have normal blood flow in the superior sagittal sinus.7
The mechanisms linking the cerebral venous outflow rate to
intracranial pressure have not been characterized, to our knowl-
edge. However, it is possible that structural factors (such as an
increase in the resistance to drainage [Rd] of blood across the
branches of the venous sinus pathways) may impact intracranial
venous outflow, as has been demonstrated in patients with venous
outflow obstruction (in whom an elevated venous back pressure
resulted in elevated venous resistance20). It is generally assumed
that the pressure drop for driving axial flow across a tube increases
with the flow resistance. Thus, an increase in venous sinus flow
resistance would require an increase in upstream flow pressure for
a constant volume flow through this drainage system to be main-
tained. Hence, the cumulative effects of the Rd across segments of
the venous sinus pathways may have a role in cerebral hydrody-
namics in general and in intracranial pressure and cerebral com-
pliance in particular.
While the association between intracranial hydrodynamics
and the geometric characteristics of the venous sinus system ap-
pears to be strong, we are not aware of any quantitative data on the
resistance to blood flow in the cerebral drainage system. The ob-
jective of the present study was therefore to calculate the Rd of
blood across the major dural sinuses and internal jugular veins
(IJVs) in healthy volunteers by using phase-contrast MR angiog-
raphy. We used the well-established Poiseuille equation for lam-
inar flow to calculate the Rd from the PC-MRA data. Further-
more, we explored the relationship between the values of Rd and
the IJV flows measured by cine phase-contrast MR imaging.
MATERIALS AND METHODSParticipantsTwenty-nine healthy volunteers (mean age, 26.7 � 5.5 years; 18
women and 11 men) were recruited. None had a history of neu-
rovascular disease. The study was approved by the regional inves-
tigational review board, and all participants gave their written,
informed consent.
Image AcquisitionImages were acquired with a 3T MR imaging system (dStream;
Philips Healthcare, Best, the Netherlands) equipped with a 32-
channel digital head coil, by using a 3D PC-MRA sequence. This
sequence exploits the property whereby spins that move through
a bipolar gradient field accumulate a phase difference, whereas
static spins do not. The bipolar flow-encoding gradients can be
applied simultaneously along 3 axes to measure the correspond-
ing flow sensitivities. The sensitivity of the PC-MRA technique
can be controlled by using a parameter sequence commonly re-
ferred to as “velocity-encoding.” More details of this technique
have been presented by Dumoulin et al.21
PC-MRA was performed in the sagittal plane (covering the whole
cerebral venous system and some of the IJVs, up to the C3–C4 cervi-
cal vertebrae) by using the following parameters: FOV � 220 � 220
mm2; number of sections � 320; effective spatial resolution � 0.7 �
0.7 mm2; flip angle � 12°; velocity-encoding � 30 cm/s; TR � 5.5
ms; TE � 3 ms; acquisition time � 6 minutes. Next, 2D PC-MR
images were acquired perpendicular to the IJVs near the C2 and C3
vertebrae, by using a gated cine PC-MR imaging pulse sequence. The
main scan parameters were as follows: FOV � 120 � 120 mm2;
resulting spatial resolution � 0.5 � 0.5 mm2; section thickness � 2
mm; TR/TE � 14/8 ms; flip angle � 30°; velocity-encoding � 80
cm/s; cardiac phases � 16. The acquisition times ranged from 1.2 to
1.8 minutes, depending on the heart rate.
Image ProcessingThe PC-MRA datasets were imported into Mimics software (Ma-
terialise, Leuven, Belgium) for 3D, semiautomated segmentation
of the cerebral venous sinus tree (represented as the superior sag-
ittal, straight, transverse, and sigmoid sinuses and the IJVs).
Threshold-based segmentation was used to extract the venous
sinus tree from each angiogram. To this end, the section passing as
close as possible to the mesial plane of the straight sinus was se-
lected, and an intensity profile was obtained along a line perpen-
dicular to the sinus. A suitable intensity threshold was then deter-
mined from this profile (17%–23% of its maximum intensity,
depending on the image quality for each participant). All voxels
with signal intensities below this threshold value were masked.
Figure 1 shows a typical segmentation of the venous sinus tree.
The final segmented geometry was converted into a Standard Tes-
sellation Language file format. The Standard Tessellation Lan-
guage file was then imported into the Vascular Modeling Toolkit
software (www.vmtk.org) for quantification of the length, cross-
sectional area, and associated radius at 10-mm intervals along
each vessel segment. To avoid possible bias due to anatomic vari-
ations, we excluded the anterior portion of the superior sagittal
sinus from the calculation.
FIG 1. Representative examples of maps of the venous sinus tree. A,Maximum-intensity projection of a 3D PC-MRA source image. B, Thevenous sinus tree segmentation was produced by Mimics software.
282 Fall Feb 2017 www.ajnr.org

For the flow images, IJV flow velocities at the C2–C3 cervi-
cal vertebrae were quantified throughout the cardiac cycle by
using freely available, semiautomatic software (Bio Flow im-
age; http://www.tidam.fr). Details of the flow measurement
have been described previously.22
Calculation of Resistance and FlowsThe Rd of each 10-mm segment was calculated by applying the
Poiseuille equation for laminar flow:
Rd �8�L
�rh4 ,
where L (10 mm) and rh are the length and the radius of the
segment, respectively, and � is the viscosity of the blood. The total
Rd for a selected part of the venous sinus tree was calculated by
summing the Rd for all the component 10-mm segments.
The left- or right-sided Rd for the venous sinus tree was calcu-
lated by summing the Rd values for the transverse sinus, sigmoid
sinus, and IJV on each side of the head. An overall Rd for the
venous sinus tree was also calculated by analogy with an electric
circuit (Fig 2). Details of the mathematic equation for calculation
of the overall Rd are presented in the Appendix.
The flows in each IJV were also added to obtain the total IJV
flow. Figure 3 shows the change in mean flow in the IJVs over the
cardiac cycle in 1 participant.
Statistical AnalysisStatistical analysis was performed with R statistical and comput-
ing software (Version 3.2.3; http://www.r-project.org/). A Wil-
coxon matched-pairs test was used to probe for differences be-
tween the left and right sides of the venous sinus tree. Correlations
between the values of Rd and blood flow measurements of the
IJVs were assessed by using the Spearman �. The threshold for
statistical significance was set at P � .05.
We calculated the correlations between the values of Rd and
IJV flow measurements for each side of the venous tree and be-
tween the overall Rd for the venous sinus tree and the total IJV
flow measurements. We also looked at whether there was an as-
sociation between sidedness in flow and sidedness in Rd in the
venous sinus tree. To this end, we calculated 2 asymmetry indices
(AIs) for each participant:
The resistance AI, reflecting asymmetry resistance, was the
following:
Resistance AI � (left-sided Rd
� right-sided Rd) / (left-sided Rd � right-sided Rd).
The flow AI, reflecting IJV flow dominance, was the following:
Flow AI � (left IJV flow � right IJV flow) / (left IJV flow
� right IJV flow).
The AIs obtained with these 2 equations ranged from �1
(strong right dominance) to �1 (strong left dominance). The
strength of the sidedness (for flow or resistance) was categorized
as �0.2 � AI � �1 (left-sided dominance), �0.2 � AI � �1
(right-sided dominance), and �0.2 � AI � �0.2 (codominance).
The correlation between the flow AIs and resistance AIs were
also evaluated.
RESULTSThe mean values of Rd for each vessel segment and for the venous
sinus tree as a whole are summarized in the Table. Significant
sidedness was observed for the mean of Rd (left side versus right
side, 42.1 � 17 versus 18.4 � 10 Pa s/cm3; P � .001) and the
measured flows (left side versus right side, 250 � 108 versus 349 �
124 cm3/min; P � .02). Left-dominant, right-dominant, and
codominant flow was observed in, respectively, 17%, 48%, and
35% of the participants.
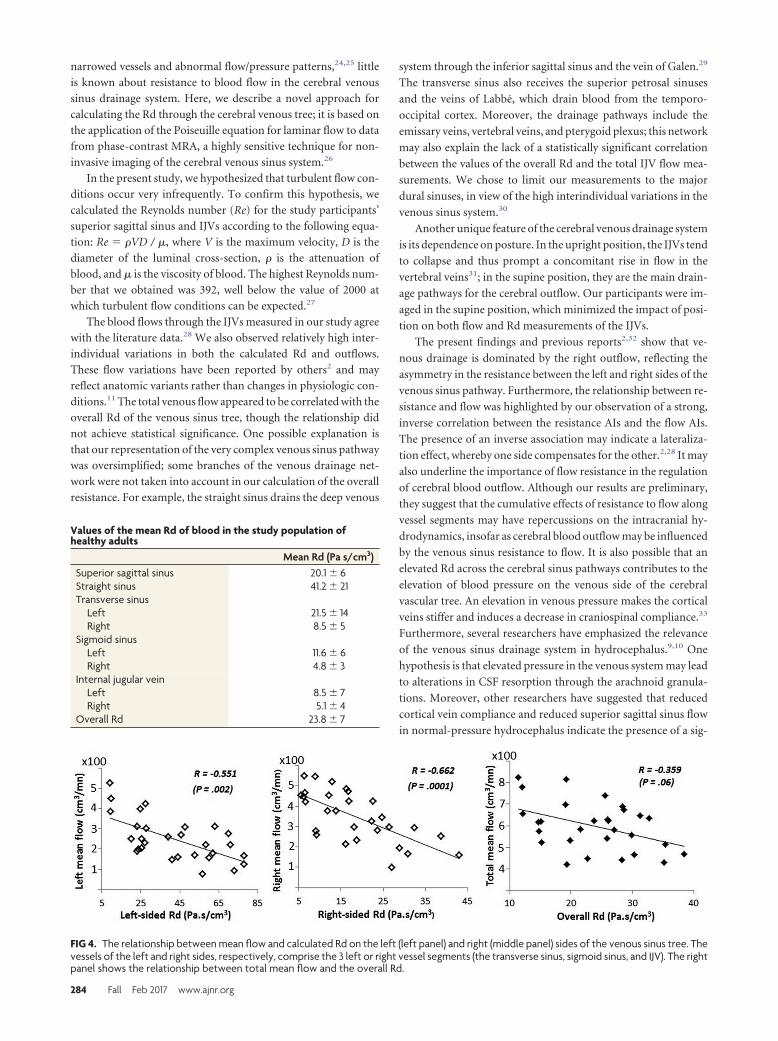
Scatterplots of the associations between the values of Rd and
flow measurements are shown in Fig 4. There were significant
negative correlations between the values of Rd and the flow mea-
surements on both the left side of the venous sinus tree (R �
�0.551, P � .002) and the right side (R � �0.662, P � .001).
When we considered associations between flow dominance and
resistance dominance, there was a strong
negative correlation between the flow
AIs and the resistance AIs (R � �0.792,
P � .001) as illustrated by a scatterplot
(Fig 5). There was no significant corre-
lation between total resistance and total
venous outflow (R � �0.359, P � .06).
DISCUSSIONIt has been suggested that cerebral ve-
nous sinus insufficiency is a major factor
in certain neurovascular diseases.4,5,8-10,23
Apart from evaluations of anatomic ab-
normalities and the quantification of
FIG 2. Schematic representation of the modeled venous system. S.indicates sinus.
FIG 3. An example of phase-contrast MR imaging showing the 2 IJVs (at the C2–C3 vertebrae) andtypical flow curves over the cardiac cycle in 1 participant. The curve marked with triangles showsthe total mean flow through the left and right IJVs.
AJNR Am J Neuroradiol 38:281– 87 Feb 2017 www.ajnr.org 283
narrowed vessels and abnormal flow/pressure patterns,24,25 little
is known about resistance to blood flow in the cerebral venous
sinus drainage system. Here, we describe a novel approach for
calculating the Rd through the cerebral venous tree; it is based on
the application of the Poiseuille equation for laminar flow to data
from phase-contrast MRA, a highly sensitive technique for non-
invasive imaging of the cerebral venous sinus system.26
In the present study, we hypothesized that turbulent flow con-
ditions occur very infrequently. To confirm this hypothesis, we
calculated the Reynolds number (Re) for the study participants’
superior sagittal sinus and IJVs according to the following equa-
tion: Re � �VD / �, where V is the maximum velocity, D is the
diameter of the luminal cross-section, � is the attenuation of
blood, and � is the viscosity of blood. The highest Reynolds num-
ber that we obtained was 392, well below the value of 2000 at
which turbulent flow conditions can be expected.27
The blood flows through the IJVs measured in our study agree
with the literature data.28 We also observed relatively high inter-
individual variations in both the calculated Rd and outflows.
These flow variations have been reported by others2 and may
reflect anatomic variants rather than changes in physiologic con-
ditions.11 The total venous flow appeared to be correlated with the
overall Rd of the venous sinus tree, though the relationship did
not achieve statistical significance. One possible explanation is
that our representation of the very complex venous sinus pathway
was oversimplified; some branches of the venous drainage net-
work were not taken into account in our calculation of the overall
resistance. For example, the straight sinus drains the deep venous
system through the inferior sagittal sinus and the vein of Galen.29
The transverse sinus also receives the superior petrosal sinuses
and the veins of Labbe, which drain blood from the temporo-
occipital cortex. Moreover, the drainage pathways include the
emissary veins, vertebral veins, and pterygoid plexus; this network
may also explain the lack of a statistically significant correlation
between the values of the overall Rd and the total IJV flow mea-
surements. We chose to limit our measurements to the major
dural sinuses, in view of the high interindividual variations in the
venous sinus system.30
Another unique feature of the cerebral venous drainage system
is its dependence on posture. In the upright position, the IJVs tend
to collapse and thus prompt a concomitant rise in flow in the
vertebral veins31; in the supine position, they are the main drain-
age pathways for the cerebral outflow. Our participants were im-
aged in the supine position, which minimized the impact of posi-
tion on both flow and Rd measurements of the IJVs.
The present findings and previous reports2,32 show that ve-
nous drainage is dominated by the right outflow, reflecting the
asymmetry in the resistance between the left and right sides of the
venous sinus pathway. Furthermore, the relationship between re-
sistance and flow was highlighted by our observation of a strong,
inverse correlation between the resistance AIs and the flow AIs.
The presence of an inverse association may indicate a lateraliza-
tion effect, whereby one side compensates for the other.2,28 It may
also underline the importance of flow resistance in the regulation
of cerebral blood outflow. Although our results are preliminary,
they suggest that the cumulative effects of resistance to flow along
vessel segments may have repercussions on the intracranial hy-
drodynamics, insofar as cerebral blood outflow may be influenced
by the venous sinus resistance to flow. It is also possible that an
elevated Rd across the cerebral sinus pathways contributes to the
elevation of blood pressure on the venous side of the cerebral
vascular tree. An elevation in venous pressure makes the cortical
veins stiffer and induces a decrease in craniospinal compliance.33
Furthermore, several researchers have emphasized the relevance
of the venous sinus drainage system in hydrocephalus.9,10 One
hypothesis is that elevated pressure in the venous system may lead
to alterations in CSF resorption through the arachnoid granula-
tions. Moreover, other researchers have suggested that reduced
cortical vein compliance and reduced superior sagittal sinus flow
in normal-pressure hydrocephalus indicate the presence of a sig-
FIG 4. The relationship between mean flow and calculated Rd on the left (left panel) and right (middle panel) sides of the venous sinus tree. Thevessels of the left and right sides, respectively, comprise the 3 left or right vessel segments (the transverse sinus, sigmoid sinus, and IJV). The rightpanel shows the relationship between total mean flow and the overall Rd.
Values of the mean Rd of blood in the study population ofhealthy adults
Mean Rd (Pa s/cm3)Superior sagittal sinus 20.1 � 6Straight sinus 41.2 � 21Transverse sinus
Left 21.5 � 14Right 8.5 � 5
Sigmoid sinusLeft 11.6 � 6Right 4.8 � 3
Internal jugular veinLeft 8.5 � 7Right 5.1 � 4
Overall Rd 23.8 � 7
284 Fall Feb 2017 www.ajnr.org

nificant elevation in the resistance to flow through these ves-
sels.34,35 The balance between cerebral arterial inflow and venous
outflow contributes to the maintenance of normal intracranial
pressure, which depends not only on the arterial volume input
and CSF volume but also on venous outflow.
The effect of intracranial fluid dynamics on intracranial pres-
sure is a major component of the Monro-Kellie36,37 doctrine. As
presented in Wilson’s recent review,38 increasing evidence sug-
gests that a venous pathology is central to the multiple conditions
that cause a rise in intracranial pressure. A better understanding
of the role of the venous system in neurocritical care is essential. In
a prospective controlled study based on a grading system, Farb
et al25 showed sinovenous stenosis in 27 of 29 patients with idio-
pathic intracranial hypertension and in only 4 of 59 control pa-
tients. Moreover, the severity of intracranial hypertension (which
depends on the degree of venous congestion) was found to be
closely related to the intradural sinus pressure.39 As the latter
rises, slight parenchymal damage may progress to severe cerebral
edema and/or hematoma if thrombolysis is delayed. Further-
more, some researchers have suggested that benign intracranial
hypertension may be caused by venous hypertension,19,20 mostly
due to stenosis or occlusions of the lateral sinuses. Moreover, it
has been shown that dilation of one of the sinuses with a stent may
reduce the pressure gradient and produce a striking reduction in
symptoms.40 This venous sinus stent placement technique had a
high technical success rate and was highly effective (80%) in re-
ducing the headache associated with benign intracranial hyper-
tension.41 Nevertheless, sinus stenosis appears to result from ele-
vated CSF pressure (rather than hypertension) in some cases.42
Also, there is some evidence that idiopathic intracranial hyper-
tension may be characterized by elevated central venous pres-
sure20 in the absence of ventricular dilation, a mass lesion, or
venous sinus thrombosis.43,44 Thus, it is possible that the cumu-
lative effects of resistance to blood flow across the venous sinus
pathways may lead to a substantial pressure increase in the intra-
cranial drainage system. This question could be addressed (at least
in part) by comparing venous sinus Rd measurements in patients
versus healthy individuals. However, in the absence of such data,
it seems premature to draw conclusions with regard to a possible
causal link between venous sinus resistance to blood flow and
intracranial hypertension.
The relationships between blood flow velocity, cross-sectional
area, pressure drop, and resistance are very complex. A simplified
relationship between fluid velocity and pressure can be described
by the Bernoulli law, which is based on the fundamental physical
law of energy conservation. The equation based on the Bernoulli
law can take various forms, which differ in their complexity as a
function of the type of fluid flow45 but can be represented as
(1⁄2)���V2 � P � ��g�z � Constant, where � is the fluid attenuation,
V is the velocity, P is the pressure, z the vertical height relative to a
reference location, and g is the gravity constant. The first term of
this equation accounts for the kinetic energy, and the 2 last terms
represent the potential energy resulting from pressure and grav-
ity. According to this principle, an increase in fluid velocity im-
plies a concomitant decrease in pressure and vice versa. Therefore,
if vessel resistance is increased by lumen constriction, the flow
velocity rise would imply a decrease in pressure.
However, several assumptions must be made before applying
the Bernoulli equation. In particular, the velocities must be uni-
formly distributed at the cross-sectional area, the fluid must be
incompressible, and there must be no loss of energy. These as-
sumptions tend to limit the applicability of the Bernoulli law
to structures that are subject to deformation. Moreover, Cebral
et al46 used phase-contrast MR imaging to investigate the flow-
area relationship in the internal carotid and vertebral arteries. To
the best of our knowledge, a similar study on the cerebral veins has
not been performed. The pressure/area/flow relationships in
compliant veins are much more complicated to evaluate than in
the venous sinuses because the veins are prone to hydrostructural
instability and are much more sensitive to slight pressure
variations.
The present study had a number of limitations. First, the rel-
atively small sample size must be taken into account when inter-
preting the results. A second limitation relates to the calculated Rd
possibly being influenced by the hydrostatic pressure gradient
across the venous sinus wall, which might influence the compli-
ance of the vessels. Third, given that patterns of complex and
disturbed flow may occur at branch points in the venous sinus
network, the laminar flow required for the validity of the Poi-
seuille equation may not be met. It is also possible that the image
quality was worsened by intravascular signal loss due to turbu-
lence and intravoxel dephasing.47 Moreover, although the PC-
MRA technique may be useful for imaging slowing blood flow48
and can depict multidirectional flow (such as recirculating flow
patterns) with good sensitivity,49 the choice of an optimal veloc-
ity-encoding value that enables avoiding velocity aliasing also
constitutes a study limitation.26 Last, our data were collected from
a group of young, healthy participants. Extending this investiga-
tion to more representative samples of older individuals (includ-
ing patients with cerebrovascular/neurovascular disease) would
be a valuable goal in the near future.
CONCLUSIONSThe results of this preliminary study suggest that PC-MRA can be
used to quantify Rd in the venous sinus drainage system. These
measurements may improve our understanding of certain cere-
FIG 5. Flow AIs plotted against resistance AIs. Diamonds located be-low the horizontal gray band (AI � �0.2) reflect right-sided flows,and those above the horizontal gray band (AI � �0.2) reflect left-sided flows. Diamonds located to the left of the vertical gray band(AI � �0.2) reflect right-sided resistance, and those on the right ofthe vertical gray band (AI � �0.2) reflect left-sided resistance.
AJNR Am J Neuroradiol 38:281– 87 Feb 2017 www.ajnr.org 285
brovascular diseases. Along with flow measurements, this ap-
proach can also be used to calculate a pressure drop across vessel
segments by application of the Poiseuille equation for laminar
flow: pressure gradient � resistance � flow.
APPENDIXCalculation of Overall RdThe overall Rd of the venous sinus system can be calculated by an
analogy with an electric circuit (Fig 2). We have the following:
Overall Rd �Rd SSS � Rd StS
Rd SSS � Rd StS�
Rleft side � Rright side
Rleft side � Rright side.
Here, SSS and StS denote the superior sagittal sinus and the
straight sinus, respectively, and Rleft side (or right side) represents the
resistance of the left (or right) side of the venous sinus tree, cal-
culated as the sum of the Rd of the 3-vessel segments (transverse
sinus � sigmoid sinus � internal jugular vein):
Rleft/right side � Rd Tranverse Sinus � Rd Sigmoid Sinus
� Rd Internal Jugular Vein.
ACKNOWLEDGMENTSThe authors are grateful to the staff members at the Institut Faire
Faces (Amiens, France) for technical assistance and thank the
study volunteers for their participation.
REFERENCES1. Grand W, Hopkins LN. Vasculature of the Brain and Cranial Base:
Variations in Clinical Anatomy. New York: Thieme; 19992. Stoquart-Elsankari S, Lehmann P, Villette A, et al. A phase-contrast
MRI study of physiologic cerebral venous flow. J Cereb Blood FlowMetab 2009;29:1208 –15 CrossRef Medline
3. Agnelli G, Verso M. Epidemiology of cerebral vein and sinus throm-bosis. Front Neurol Neurosci 2008;23:16 –22 CrossRef Medline
4. Dhungana S, Sharrack B, Woodroofe N. Idiopathic intracranial hy-pertension. Acta Neurol Scand 2010;121:71– 82 CrossRef Medline
5. Bateman GA. Vascular hydraulics associated with idiopathic andsecondary intracranial hypertension. AJNR Am J Neuroradiol 2002;23:1180 – 86 Medline
6. Gross CE, Tranmer BI, Adey G, et al. Increased cerebral blood flowin idiopathic pseudotumour cerebri. Neurol Res 1990;12:226 –30CrossRef Medline
7. Greitz D, Hannerz J, Rahn T, et al. MR imaging of cerebrospinalfluid dynamics in health and disease: on the vascular pathogenesisof communicating hydrocephalus and benign intracranial hyper-tension. Acta Radiol 1994;35:204 –11 CrossRef Medline
8. Kwon BJ, Han MH, Kang HS, et al. MR imaging findings of intra-cranial dural arteriovenous fistulas: relations with venous drainagepatterns. AJNR Am J Neuroradiol 2005;26:2500 – 07 Medline
9. Sainte-Rose C, LaCombe J, Pierre-Kahn A, et al. Intracranial venoussinus hypertension: cause or consequence of hydrocephalus in in-fants? J Neurosurg 1984;60:727–36 CrossRef Medline
10. Shulman K, Ransohoff J. Sagittal sinus venous pressure in hydro-cephalus. J Neurosurg 1965;23:169 –73 CrossRef Medline
11. Zamboni P, Galeotti R, Menegatti E, et al. Chronic cerebrospinalvenous insufficiency in patients with multiple sclerosis. J NeurolNeurosurg Psychiatry 2009;80:392–99 Medline
12. ElSankari S, Baledent O, van Pesch V, et al. Concomitant analysis ofarterial, venous, and CSF flows using phase-contrast MRI: a quan-titative comparison between MS patients and healthy controls.J Cereb Blood Flow Metab 2013;33:1314 –21 CrossRef Medline
13. Tsivgoulis G, Faissner S, Voumvourakis K, et al. “Liberation treat-ment” for chronic cerebrospinal venous insufficiency in multiple
sclerosis: the truth will set you free. Brain Behav 2015;5:3–12CrossRef Medline
14. Willems PW, Brouwer PA, Barfett JJ, et al. Detection and classifi-cation of cranial dural arteriovenous fistulas using 4D-CTangiography: initial experience. AJNR Am J Neuroradiol 2011;32:49 –53 CrossRef Medline
15. Leach JL, Jones BV, Tomsick TA, et al. Normal appearance of arach-noid granulations on contrast-enhanced CT and MR of the brain:differentiation from dural sinus disease. AJNR Am J Neuroradiol1996;17:1523–32 Medline
16. Schoser BG, Riemenschneider N, Hansen HC. The impact of raisedintracranial pressure on cerebral venous hemodynamics: a pro-spective venous transcranial Doppler ultrasonography study.J Neurosurg 1999;91:744 – 49 CrossRef Medline
17. Heiserman JE, Dean BL, Hodak JA, et al. Neurologic complicationsof cerebral angiography. AJNR Am J Neuroradiol 1994;15:1401– 07;discussion 1408 –11 Medline
18. Waugh JR, Sacharias N. Arteriographic complications in the DSAera. Radiology 1992;182:243– 46 CrossRef Medline
19. King JO, Mitchell PJ, Thomson KR, et al. Cerebral venography andmanometry in idiopathic intracranial hypertension. Neurology1995;45:2224 –28 CrossRef Medline
20. Karahalios DG, Rekate HL, Khayata MH, et al. Elevated intracranialvenous pressure as a universal mechanism in pseudotumor cerebriof varying etiologies. Neurology 1996;46:198 –202 CrossRef Medline
21. Dumoulin CL, Cline HE, Souza SP, et al. Three-dimensional time-of-flight magnetic resonance angiography using spin saturation.Magn Reson Med 1989;11:35– 46 CrossRef Medline
22. Baledent O, Henry-Feugeas MC, Idy-Peretti I. Cerebrospinal fluiddynamics and relation with blood flow: a magnetic resonance studywith semiautomated cerebrospinal fluid segmentation. Invest Ra-diol 2001;36:368 –77 CrossRef Medline
23. Elsankari S, Czosnyka M, Lehmann P, et al. Cerebral blood andCSF flow patterns in patients diagnosed for cerebral venousthrombosis: an observational study. J Clin Imaging Sci 2012;2:41CrossRef Medline
24. Donnet A, Metellus P, Levrier O, et al. Endovascular treatment ofidiopathic intracranial hypertension: clinical and radiologic out-come of 10 consecutive patients. Neurology 2008;70:641– 47CrossRef Medline
25. Farb RI, Vanek I, Scott JN, et al. Idiopathic intracranial hypertension:the prevalence and morphology of sinovenous stenosis. Neurology2003;60:1418–24 CrossRef Medline
26. Fera F, Bono F, Messina D, et al. Comparison of different MR venog-raphy techniques for detecting transverse sinus stenosis in idio-pathic intracranial hypertension. J Neurol 2005;252:1021–25CrossRef Medline
27. Hatle L, Angelsen B. Doppler Ultrasound in Cardiology: Physical Prin-ciples and Clinical Applications. Philadelphia: Lea & Febiger; 1982
28. Sundstrom P, Wåhlin A, Ambarki K, et al. Venous and cerebrospinalfluid flow in multiple sclerosis: a case-control study. Ann Neurol2010;68:255–59 CrossRef Medline
29. Suzuki Y, Ikeda H, Shimadu M, et al. Variations of the basal vein:identification using three-dimensional CT angiography. AJNRAm J Neuroradiol 2001;22:670 –76 Medline
30. Cure JK, Van Tassel P, Smith MT. Normal and variant anatomy ofthe dural venous sinuses. Semin Ultrasound CT MR 1994;15:499 –519 CrossRef Medline
31. Valdueza JM, von Munster T, Hoffman O, et al. Postural dependencyof the cerebral venous outflow. Lancet 2000;355:200 – 01 CrossRefMedline
32. Lichtenstein D, Saïfi R, Augarde R, et al. The internal jugular veinsare asymmetric: usefulness of ultrasound before catheterization.Intensive Care Med 2001;27:301– 05 CrossRef Medline
33. Bateman GA. The reversibility of reduced cortical vein compliancein normal-pressure hydrocephalus following shunt insertion. Neu-roradiology 2003;45:65–70 Medline
34. Bateman GA. Pulse-wave encephalopathy: a comparative study of
286 Fall Feb 2017 www.ajnr.org

the hydrodynamics of leukoaraiosis and normal-pressure hydro-cephalus. Neuroradiology 2002;44:740 – 48 CrossRef Medline
35. Bateman GA. Vascular compliance in normal pressure hydroceph-alus. AJNR Am J Neuroradiol 2000;21:1574 – 85 Medline
36. Kellie G. An account of the appearances observed in the dissectionof two of the three individuals presumed to have perished in thestorm of the 3rd, and whose bodies were discovered in the vicinityof Leith on the morning of the 4th November 1821 with some reflec-tions on the pathology of the brain. Trans Med Chir Soc Edinb1824;1:84 –169
37. Monro A. Observations on Structure and Functions of the Nervous Sys-tem. Edinburgh, UK: Creech and Johnson; 1783
38. Wilson MH. Monro-Kellie 2.0: the dynamic vascular and venouspathophysiological components of intracranial pressure. J CerebBlood Flow Metab 2016;36:1338 –50 CrossRef Medline
39. Tsai FY, Wang AM, Matovich VB, et al. MR staging of acute duralsinus thrombosis: correlation with venous pressure measurementsand implications for treatment and prognosis. AJNR Am J Neurora-diol 1995;16:1021–29 Medline
40. Higgins JN, Owler BK, Cousins C, et al. Venous sinus stenting forrefractory benign intracranial hypertension. Lancet 2002;359:228 –30 CrossRef Medline
41. Albuquerque FC, Dashti SR, Hu YC, et al. Intracranial venous sinusstenting for benign intracranial hypertension: clinical indications,
technique, and preliminary results. World Neurosurg 2011;75:648 –52; discussion 592–95 CrossRef Medline
42. Higgins JNP, Pickard JD. Lateral sinus stenoses in idiopathic intra-cranial hypertension resolving after CSF diversion. Neurology 2004;62:1907– 08 CrossRef Medline
43. Friedman DI, Jacobson DM. Diagnostic criteria for idiopathic intra-cranial hypertension. Neurology 2002;59:1492–95 CrossRef Medline
44. Lee AG, Brazis PW. Magnetic resonance venography in idiopathicpseudotumor cerebri. J Neuroophthalmol 2000;20:12–13 CrossRefMedline
45. Fung Y. Biomechanics: Circulation. New York: Springer; 199746. Cebral JR, Castro MA, Putman CM, et al. Flow-area relationship in
internal carotid and vertebral arteries. Physiol Meas 2008;29:585–94CrossRef Medline
47. Ayanzen RH, Bird CR, Keller PJ, et al. Cerebral MR venography:normal anatomy and potential diagnostic pitfalls. AJNR Am J Neu-roradiol 2000;21:74 –78 Medline
48. Bono F, Lupo MR, Lavano A, et al. Cerebral MR venography oftransverse sinuses in subjects with normal CSF pressure. Neurology2003;61:1267–70 CrossRef Medline
49. Wheaton AJ, Miyazaki M. Non-contrast enhanced MR angiography:physical principles. J Magn Reson Imaging 2012;36:286 –304CrossRef Medline
AJNR Am J Neuroradiol 38:281– 87 Feb 2017 www.ajnr.org 287