use of non-traditional water for power plant applications ......
TRANSCRIPT

Use of Non-Traditional Water for Power Plant Applications: An Overview of DOE/NETL R&D Efforts
November 1, 2009
DOE/NETL-311/040609

Disclaimer
This report was prepared as an account of work sponsored by an agency of the United States Government. Neither the United States Government nor any agency thereof, nor any of their employees, makes any warranty, express or implied, or assumes any legal liability or responsibility for the accuracy, completeness, or usefulness of any information, apparatus, product, or process disclosed, or represents that its use would not infringe privately owned rights. Reference therein to any specific commercial product, process, or service by trade name, trademark, manufacturer, or otherwise does not necessarily constitute or imply its endorsement, recommendation, or favoring by the United States Government or any agency thereof. The views and opinions of authors expressed therein do not necessarily state or reflect those of the United States Government or any agency thereof.

Use of Non-Traditional Water for Power Plant Applications:
An Overview of DOE/NETL R&D Efforts
DOE/NETL-311/040609
November 1 2009
NETL Contact:
Jared Ciferno
Technology Manager
Office Coal and Power R & D
National Energy Technology Laboratory
www.netl.doe.gov

This page intentionally left blank

i
Table of Contents
List of Figures ................................................................................................................................ ii List of Tables. ............................................................................................................................... iii List of Abbreviations and Acronyms ......................................................................................... iv Acknowledgements ..................................................................................................................... vii Executive Summary ................................................................................................................... viii
1. Background ............................................................................................................................ 1 2. Scope and Organization ......................................................................................................... 3 3. Regulatory and Permitting Considerations ............................................................................ 5
Plant Discharge from Treatment Processes ..................................................................... 5 Water Rights .................................................................................................................... 5 Regulations Governing Water Reuse ............................................................................... 6
Available Governmental Incentives ................................................................................. 8 4. Thermoelectric Power Plant Water Quantity and Quality Needs ........................................ 10
Introduction .................................................................................................................... 10 Background .................................................................................................................... 10 Water Quality Impacts on the Cooling Water System ................................................... 13 Water Quality Requirements for the Cooling Water System......................................... 14 Water Quality Impacts on the FGD System .................................................................. 15 Water Quality Requirements for the FGD System ........................................................ 17
5. Treated Municipal Wastewaters/Reclaimed Waters ............................................................ 20 Water Quality ................................................................................................................. 21 Current Use of Reclaimed Waters for Power Plant Cooling ......................................... 23 Treatment of Reclaimed Water ...................................................................................... 25
Other Issues .................................................................................................................... 26 Summary ........................................................................................................................ 31
6. Produced Waters from Oil and Gas Wells ........................................................................... 33 Environmental Concerns for Untreated Waters ............................................................. 34 Access and Collection .................................................................................................... 35 Non-Traditional Water Quality Assessment .................................................................. 36 Treatment Technology Descriptions .............................................................................. 37 Performance Goals ......................................................................................................... 40
Performance Results ...................................................................................................... 41 Other Issues .................................................................................................................... 42 Summary ........................................................................................................................ 43
7. Mine Pool Waters ................................................................................................................ 44 Resource Characterization ............................................................................................. 45
Water Quality ................................................................................................................. 47 Viability for Use ............................................................................................................ 48
Other Issues .................................................................................................................... 52 Summary ........................................................................................................................ 53
8. Produced Water from Carbon Dioxide Storage in Saline Formations ................................. 56 Environmental Concerns for Untreated Waters ............................................................. 56 Access and Collection .................................................................................................... 57 Non-Traditional Water Quality Assessment .................................................................. 57

ii
Treatment Technology Descriptions .............................................................................. 58
Performance Goals ......................................................................................................... 61 Other Issues .................................................................................................................... 61 Summary ........................................................................................................................ 63
9. Recovered Plant Discharges ................................................................................................ 65 Environmental Concerns for Untreated Waters ............................................................. 65 Non-Traditional Water Quality Assessment .................................................................. 66 Treatment Technology Descriptions .............................................................................. 67 Performance Goals ......................................................................................................... 68 Performance Results ...................................................................................................... 69 Other Issues .................................................................................................................... 71 Summary ........................................................................................................................ 72
10. Locating Sources of Non-Traditional Waters .................................................................... 74
Appendix A .............................................................................................................................. 79
List of Figures Figure 4-1: Schematic of a Wet Recirculating Cooling Water System ........................................ 11 Figure 4-2: Wet Limestone FGD Process Schematic ................................................................... 16 Figure 5-1: Reclaimed Water Pipes and Pumps Painted Purple ................................................... 23 Figure 5-2: Pilot Scale Cooling Towers in Operation at the Franklin Township Municipal
Sanitary Authority ................................................................................................................ 28 Figure 6-1: Collection Network Diagram Chosen for SJGS Produced Waters ............................ 36 Figure 6-2: Illustration of Pretreatments and HERO System for Produced Waters ..................... 38 Figure 6-3: Illustration of Constructed Wetlands Treatment System for Produced Waters ......... 40 Figure 7-1: Distribution of Coal Resources in Pennsylvania and West Virginia ......................... 45 Figure 7-2: Frequency Distribution of the pH of Coal Mine Discharges in Pennsylvania ........... 47 Figure 7-3: Pilot Scale Cooling Towers........................................................................................ 50 Figure 7-4: Mine Discharges in the Vicinity of the Proposed Beech Hollow Power Plant .......... 52 Figure 8-1: Illustration of Pretreatments and HERO System for Produced Waters. .................... 60 Figure 9-1: Illustration of CWTS for Ash Basin Waters .............................................................. 68 Figure 9-2: Scaling Behavior of Synthetic Ash Pond Effluent in Bench-Scale Tests:
Effectiveness of Different Antiscalants at Four Cycles of Concentration ........................... 69 Figure 9-3: Sample Chart Showing Element Removal from Simulated Ash Basin Water by
CWTS .................................................................................................................................. 70 Figure 9-4: Scaling, Biofouling, and Corrosion Potential when Constructed Wetlands Treat Ash
Basin Waters ........................................................................................................................ 71 Figure 10-1: Data Distribution in the UND EERC Decision Support System ............................. 75

iii
Figure 10-2: Historical Stream Flow Data Displayed by the UND EERC Decision Support System .................................................................................................................................. 75
Figure 10-3: Aquifer Yield Information in the UND EERC Decision Support System (data gap for groundwater yield information for South Dakota) ......................................................... 76
Figure 10-4: Municipal Wastewater Discharge Rates More Than 1 Million Gallons Per Day in the UND EERC Decision Support System .......................................................................... 77
List of Tables Table 2-1: Investigations Reviewed in this Report ......................................................................... 3 Table 3-1: Summary of State Regulatory Requirements on Water Reuse...................................... 7 Table 4-1: Estimated Cooling and FGD System Makeup Water Requirements .......................... 12 Table 4-2: SPX General Cooling Water Chemistry Limits .......................................................... 14 Table 4-3: Nalco Water Chemistry Limits for Cooling Water ..................................................... 14 Table 4-4: EPRI Water Chemistry Limits for Cooling Water ...................................................... 15 Table 5-1: Commonly Applied Limits for Water Quality Constituents in Reclaimed Water ...... 22 Table 5-2: Geographic Distribution of Facilities .......................................................................... 24 Table 5-3: Volume Usage Distribution ......................................................................................... 24 Table 5-4: Distribution of Facilities by Their Use of Reclaimed Water ....................................... 24 Table 5-5: Distribution of Facilities by Time Period in Which Power Plant Began Using
Reclaimed Water .................................................................................................................. 25 Table 5-6: Examples of Treatment Processes for Power Plant Cooling Water at Eight Specific
Facilities ............................................................................................................................... 26 Table 5-7: Target Concentrations for Chemical Treatment Agents .............................................. 29 Table 5-8: Average Corrosion Rates (MPY) of Metal Alloys in Pilot Scale Cooling Towers ..... 30 Table 6-1: Composition of Produced Waters and NPDES Discharge Limits .............................. 34 Table 7-1: Selected Mine Discharges from the Anthracite and Bituminous Coal Fields of
Pennsylvania ........................................................................................................................ 46 Table 8-1: Box Model Predictions of Chemical Composition for CO2 Storage in Saline
Formations ........................................................................................................................... 58 Table 8-2: Summary of Desalination Calculations and Assumptions for CO2 Storage Waters ... 62 Table 9-1: Reported Chemical Contaminant Concentrations in Untreated Ash Basin Waters .... 65 Table 9-2: Parameters Indicating CWTS Readiness for Treatment of Ash Basin Waters ........... 68

iv
List of Abbreviations and Acronyms
Acronym/Abbreviation Definition
AMD Acid Mine Drainage ANL Argonne National Laboratory BC Brine Concentrator BGD Billion Gallons Per Day BOD Biochemical Oxygen Demand BOD5 Five-Day Biochemical Oxygen Demand CBM Coalbed Methane CCS Carbon Capture and Sequestration CEC California Energy Commission CO2 Carbon Dioxide COC Cycles of Concentration CWA Clean Water Act CWTS Constructed Wetland Treatment Systems CaCO3 Calcium Carbonate CaO Calcium Oxide CaOH2 Calcium Hydroxide DOE U.S. Department of Energy EDR Electrodialysis Reversal EIA Energy Information Administration EOR Enhanced Oil Recovery EPA Environmental Protection Agency EPEC Existing Plants, Emissions and Capture Program EPRI Electric Power Research Institute FGD Flue Gas Desulfurization FeS2 Iron Sulfide GHG Greenhouse Gas GIS Geographic Information System gph/MW Gallons Per Hour Megawatt Capacity gpm Gallons Per Minute HERO High-Efficiency Reverse Osmosis HPC Heterotrophic Bacteria IGCC Integrated Gasification Combined Cycle ISGS Illinois State Geological Survey LFCM Ligand Functionalized Core Materials MAPP Mid-Continent Area Power Pool MGD Million Gallons Per Day mg/L Milligrams Per Liter MW Megawatt NERC North American Electric Reliability Council NETL National Energy Technology Laboratory NH3 Ammonia NMLRC National Mine Land Reclamation Center

v
NPDES National Pollutant Discharge Elimination System NaHCO3 Sodium Bicarbonate O&M Operations and Maintenance PAA Polyacrylic Acid PBTC 2-Phosphonobutane-1,2,4-Tricarboxylic Acid PC Pulverized Coal pCi/L Picocuries Per Liter PMA Polymaleic Acid POTWs Publicly Owned Treatment Works ppm Parts Per Million psi Pounds Per Square Inch PSI Puckorious Scaling Index R&D Research and Development RCRA Resource Conservation and Recovery Act RO Reverse Osmosis SEM/EDS Scanning Electron Microscopy/Energy Dispersive Spectrometry SJGS San Juan Generating Station SNL Sandia National Laboratories SO2 Sulfur Dioxide SO4 Sulfate TDS Total Dissolved Solids TKPP Pyrophosphate TMDL Total Maximum Daily Load TPH Total Petroleum Hydrocarbons TSS Total Suspended Solids TTA Tolyltriazole UND EERC University of North Dakota Energy and Environmental Research
Center USGS United States Geological Survey VOC Volatile Organic Compounds WQC Water Quality Criteria

vi
Prepared by:
Ronald Munson
James Murphy
Kenneth Walsh
Science Applications International Corp. /
Research Development Solutions, LLC
Contract Information:
DE-AC26-04NT 41817.311.01.03.113

vii
Acknowledgements
This work was funded by the U.S. Department of Energy’s National Energy Technology Laboratory (DOE/NETL). The NETL sponsors for this project were Andrea McNemar, Project Manager, and Jared Ciferno, Technology Manager for the Existing Plants, Emissions and Capture Program. The authors would also like to acknowledge the contributions of DOE/NETL colleagues Barbara Carney, Bill Aljoe, and Lynn Brickett. This NETL management team provided guidance and technical oversight for this study. The authors acknowledge the significant role played by DOE/NETL in providing the programmatic guidance and review of this report. The authors also acknowledge SAIC/RDS colleagues Judith Gerba, Joseph Giardina, and Cynthia Pellegrino for their assistance in report preparation.

viii
Executive Summary A U.S. Department of Energy National Energy Technology Laboratory (DOE/NETL) study estimated that in 2005, total U.S. freshwater withdrawals for thermoelectric power generation amounted to approximately 146 billion gallons per day (BGD), while freshwater consumption was 3.7 BGD. Coal-fired power plants use water for cooling water systems, flue gas desulfurization (FGD) makeup, boiler makeup, ash handling, wastewater treatment, and general plant wash down. As the population continues to increase, electric and water demands are expected to grow.
Research examining the energy/water link in coal-based power plants is sponsored by DOE/NETL under the Existing Plants, Emissions and Capture (EPEC) Program. The research and development (R&D) program aims to minimize freshwater withdrawal and consumption without introducing negative impacts of poor water quality on plant operations. In order to develop cost-effective approaches to using lower-quality water sources, the Non-Traditional Sources of Process and Cooling Water component of the EPEC Program includes research focusing on potential new water sources, including brackish and saline water supplies and various domestic and industrial wastewaters. Studies in the treatment of municipal treated water/reclaimed water, produced waters from oil and gas wells, mine pool waters, produced waters from carbon dioxide (CO2) storage in saline formations, and ash pond basins focus on understanding the location, volumes, and quality of different non-traditional waters. This component also develops treatment technologies to reduce the scaling, biofouling, and corrosion potential of available impaired waters that would not otherwise be useful in cooling water systems or other processes within thermoelectric plants.
Reclaimed water (treated municipal wastewater) is widely available in communities throughout the United States in sufficient volumes and is reliable enough to supply power plant cooling water. Reclaimed waters are already being used in more than 50 U.S. power plants and are subject to Federal and state regulations in order to protect worker and public health. Researchers have developed small pilot-scale cooling towers for side-by-side evaluation of the use of impaired waters under different operating conditions. Standard chemical additives provided reasonable scaling and biofouling control. The corrosion rates were not affected by the corrosion inhibitors but were strongly influenced by the degree of scaling on the corrosion coupons. The effects of combinations of tertiary treatments (e.g., nitrification, filtration, carbon adsorption) and different chemical treatment regimens are under investigation.
Produced waters from oil and gas wells, as well as enhanced coalbed methane (CBM) recovery activities, generally exceed discharge limits because chloride and total dissolved solids (TDS) concentrations are very high. With appropriate pretreatment, both a high-efficiency reverse osmosis (HERO) system and a constructed wetland treatment system offer promising treatment techniques to utilize produced waters as process waters. Additional studies are being conducted using nanofiltration techniques and tertiary treatments to utilize produced waters. Ownership of the produced waters is one key regulatory issue that must be addressed, but policy makers also need to investigate methods to allow designations of these waters for beneficial purposes.
Some mine pool waters can provide sustainable waters to power plants but generally have a low pH and high TDS, thus necessitating treatment prior to use in cooling systems. Scaling issues have not yet been ameliorated, and corrosion analyses indicate that mine pool waters should not

ix
be used where aluminum is present in the system. However, chloramine and tolyltriazole (TTA) effectively inhibited biofouling and corrosion on steel and copper in the pilot-scale cooling towers. Some studies are also focused on characterizing the water flow rates and quality in particular mine drainages to understand the potential uses as process and cooling waters. In addition, investigations into these mines as direct wide area heat sinks shows lower capital costs but higher operating costs than traditional cooling methods. Studies of the mine pool waters as geothermal heat pumps show that a single coal seam could heat and cool as many as 20,000 homes.
Waters produced when CO2 is stored in saline formations could provide significant volumes of process cooling water if this practice is widely adopted to reduce greenhouse gas (GHG) emissions. At the San Juan Generating Station (SJGS), the HERO system should be able to recover 83 percent of the water. The reject stream from the HERO process would be treated by the brine concentrator (BC) to recover an additional 73 percent of the reject. The total cost was estimated at $5.32 per 1,000 gallons of treated water. Additional studies are considering the transport and treatment of produced waters from additional saline formations. To treat waters like these, a new study will couple electrodialysis reversal (EDR) to lower TDS with a ligand functionalized core material to remove silica.
Regarding non-traditional waters at thermoelectric power plants, current studies focus on recovering ash pond waters. The studies indicate that untreated ash pond waters typically exceed the National Pollutant Discharge Elimination System (NPDES) permit and water quality criteria for arsenic, cadmium, chromium, copper, mercury, selenium, and zinc. Chemical treatments and constructed wetlands treatment systems have been shown to treat the scaling, biofouling, and corrosion potential of these waters. The wetlands system was also measured to decrease the toxicity and pollutant concentrations (arsenic, chromium, mercury, selenium, and zinc) from the ash pond waters. With regard to legislative and regulatory issues, U.S. Representative Nick Rahall introduced a bill (Coal Ash Reclamation and Environmental Safety Act of 2009) that would impose uniform design, engineering, and performance standards on coal ash impoundments. Also, Senator Barbara Boxer has introduced a resolution calling on the U.S. Environmental Protection Agency (EPA) to utilize its existing authority under the Resource Conservation and Recovery Act (RCRA) to regulate coal combustion waste.
In addition to the treatment technologies for non-traditional waters, NETL is also sponsoring work to allow utilities to assess the availability of suitable water supplies in their area. These mapping tools are being constructed as web interfaces and will access National and state-level data sets for both surface freshwaters and non-traditional waters. Groundwater volumes have not been well characterized in many of these data sets, but the researchers are including information about water quantity and quality where available. These projects are being conducted in conjunction with the Ground Water Protection Council, the United States Geological Survey (USGS), state officials, and other NETL contractors.
1
1. Background
U.S. population estimates show an increase of 2.8 million individuals from July 1, 2007, through July 1, 2008.1 The increases since July 2000 average 0.94 percent per year. As the U.S. population continues to increase, demands for both freshwater and electricity are expected to rise. Thermoelectric power generation requires a large quantity of freshwater to support operations. In regions of the country with limited freshwater supplies, thermoelectric power generation may be competing with other uses for dwindling freshwater supplies. Other issues associated with continued supply of freshwater include:
All regions of the United States are subject to water shortages, particularly during droughts.
Regional imbalances in available water may require additional energy.
Non-consumptive water uses must be explored.
Long-term societal and economic sustainability (e.g., for areas reliant on slow-charging aquifers) may require current and future limitations on water usage.
Water usage may be measured by both water withdrawal and water consumption. A withdrawal rate refers to the net volume of freshwater that is removed from a water supply over a given time. Water consumption is that portion of water withdrawal that is not returned directly in the discharge (e.g., lost through evaporation to the atmosphere). In other words, the user’s consumption refers to the difference between the withdrawal rate and the discharge rate.
In 2005, thermoelectric plants ranked slightly ahead of agricultural irrigation in terms of freshwater withdrawal rates (41 percent), according to the United States Geological Survey (USGS).2 This percentage is presented to indicate the necessity for water withdrawal by thermoelectric plants. However, the water consumption for thermoelectric power plants represented just 3 percent of the total consumption in the 1995 version of the USGS circular.3
Since 2002, the Department of Energy’s (DOE) National Energy Technology Laboratory (NETL) has sponsored research examining the energy/water link in coal-based power plants under the Existing Plants, Emissions and Capture (EPEC) Program (formerly known as the Innovations for Existing Plants Program). The research and development (R&D) program aims to minimize freshwater withdrawal and consumption without introducing negative impacts of poor water quality on plant operations. The Water-Energy Interface research focuses on four areas4:
1. Advanced Cooling Technologies – With the goal to improve performance and reduce costs associated with wet cooling, dry cooling, and hybrid cooling technologies, this component includes projects dealing with condensing technology evaluation, scale prevention, novel filtration methods, testing an evaporative cooler with impaired waters, prevention of zebra mussel fouling, and development of foam with high thermal conductivity for air cooled condensers.
2. Water Reuse and Recovery – This component focuses on reuse of cooling water and the associated waste heat and water recovery from coal and flue gas. The projects include coal drying; desalination and additional power generation from waste heat; condensing

2
heat exchangers, membranes, and liquid desiccants in flue gas streams; and the use of wetlands to treat and reuse waters.
3. Non-Traditional Sources of Process and Cooling Water – In order to develop cost-effective approaches to using lower-quality, non-traditional water sources, this component includes studies in the treatment of municipal treated water/reclaimed water, produced waters from oil and gas wells, mine pool waters, produced waters from carbon dioxide (CO2) storage in saline formations, and ash pond basins.
4. Advanced Water Treatment and Detection Technology – Focusing on the removal of pollutants, the studies in this component include investigations into a passive integrated treatment facility, the creation of a market-based approach for water quality and carbon emissions, use of novel anionic clay sorbents, and pilot-scale constructed wetland treatment systems.
NETL has set quantifiable metrics for the Water-Energy Interface research projects within the EPEC Program. The short-term goal is to prepare technologies for commercial demonstration by 2015 that, when used alone or in combination, can reduce freshwater withdrawal and consumption by 50 percent or greater for thermoelectric power plants equipped with wet recirculating cooling technology, at a levelized cost of less than $4.40 per thousand gallons of freshwater conserved. The 2020 long-term goal is more ambitious and calls for a freshwater withdrawal and consumption reduction of 70 percent or greater, at a cost less than $2.90 per thousand gallons of freshwater conserved.
This report focuses on the research that has been done to date for the Non-Traditional Sources of Process and Cooling Water component. Studies in this research area focus on identifying potential new water sources, including brackish and saline water supplies and various domestic and industrial wastewaters. In particular, these studies focus on understanding the location, volumes, and quality of different non-traditional waters, as well as treatment technologies to reduce the scaling, biofouling, and corrosion potential of available impaired waters that would not otherwise be useful in a cooling water system or other processes within a thermoelectric plant.
References
1 U.S. Census Bureau, Table T1. Population Estimates, factfinder.census.gov, last accessed March 23, 2009. 2 Kenny, J.F., N.L. Barber, S.S Hutson, K.S. Linsey, J.K. Lovelace, and M.A. Maupin, Estimated Use of Water in the United States in 2005, U.S. Geological Survey Circular 1344, 2009, http://pubs.usgs.gov/circ/1344/pdf/c1344.pdf/ 3 Solley, W.B., R. R. Pierce, and H.A. Perlman, Estimated Use of Water in the United States in 1995, U.S. Geological Survey Circular 1200, 1998, http://water.usgs.gov/watuse/pdf1995/html/, last accessed March 25, 2009. 4 B. Carney, T. Feeley, and A. McNemar. “Department of Energy, National Energy Technology Laboratory, Power Plant-Water R&D Program.” Presented at the Water-Energy Nexus Conference in December 2008. Available at: http://www.netl.doe.gov/technologies/coalpower/ewr/water/pdfs/NETL%20Paper%20Unesco%20Conference.pdf.

3
2. Scope and Organization
This report covers ongoing and recent projects that fall under the DOE/NETL list of projects dealing with uses of non-traditional waters for power plant makeup waters. Where appropriate, some other NETL water-related activities in similar technical areas have also been described to offer a broader perspective to the research for certain non-traditional waters, but this report is focused on non-traditional waters and is not intended to summarize all water-related activities at NETL.
Instead of organization by individual projects, each chapter of this report discusses all of the projects that deal with a particular category of non-traditional waters. The entire report is organized to discuss the focal points of the research:
Chapter 3: Regulatory and Permitting Considerations
Chapter 4: Thermoelectric Power Plant Water Quantity and Quality Needs
Chapter 5: Municipal Treated Wastewater/Reclaimed Water
Chapter 6: Produced Waters from Oil and Gas Wells
Chapter 7: Mine Pool Waters
Chapter 8: Produced Water from Carbon Dioxide Storage in Saline Aquifers
Chapter 9: Recovered Plant Discharges
Chapter 10: Locating Sources of Non-Traditional Waters Chapter 3 briefly discusses the regulatory and permitting considerations associated with the use of non-traditional waters. Chapter 4 discusses the various makeup water needs within a thermoelectric plant for the different operations. Chapter 5 through Chapter 9 represents the majority of the presented NETL-funded work on non-traditional waters. Based on the reports from the investigators, each of these chapters presents the environmental concerns associated with the untreated water, a water quality assessment, treatment technology descriptions, performance goals (for studies underway), performance results (for completed studies), and other issues. Table 2-1 summarizes the investigations that are covered in this report. Chapter 10 describes studies that are underway in an effort to identify nearby sources of non-traditional waters through geographic information systems (GIS).
Table 2-1: Investigations Reviewed in this Report
Chapter Investigation Research Group Start Date 5 Use of Reclaimed Water for Power Plant
Cooling (DE-AC02-06CH11357) Argonne National Laboratory --
5, 7, 9 Reuse of Treated Internal or External Wastewaters in the Cooling Systems of Coal-based Thermoelectric Power Plants (NT42722)
University of Pittsburgh and Carnegie Mellon University
March 2006
5 Use of Treated Municipal Wastewater as Power Plant Cooling System Makeup Water: Tertiary Treatment versus Expanded Chemical Regimen for Recirculating Water Quality Management (NT06550)
University of Pittsburgh and Carnegie Mellon University
October 2008

4
Chapter Investigation Research Group Start Date 6, 8 Use of Produced Water in Recirculating
Cooling Systems at Power Generating Facilities (NT41906)
EPRI at the San Juan Generating Station
July 2004
6 Reuse of Produced Water from CO2 Enhanced Oil Recovery, Coal-Bed Methane, and Mine Pool Water by Coal-Based Power Plants (NT0005343)
Illinois State Geological Survey
October 2008
6 Nanofiltration Treatment Options for Thermoelectric Power Plant Water Treatment Demands (FWP-08-014250)
Sandia National Laboratories September 2008
6, 7 Identification of Incentive Options to Encourage the Use of Produced Water, Coal Bed Methane Water, and Mine Pool Water
Argonne National Laboratory --
6, 9 An Innovative System for Treatment of Non-Traditional Waters for Reuse in Power Generation (NT42535)
Clemson University July 2005
7 Development and Demonstration of a Modeling Framework for Assessing the Efficacy of Using Mine Water for Thermoelectric Power Generation (NT42723)
National Mine Land Reclamation Center (NMLRC) of West Virginia University
March 2006
7 Strategies for Cooling Electric Generating Facilities Using Mine Water: Technical and Economic Feasibility (NT41908)
West Virginia University September 2003
7 Use of Mine Pool Water for Power Plant Cooling
Argonne National Laboratory --
8 Study of the Use of Saline Aquifers for Combined Thermoelectric Power Plant Water Needs and Carbon Sequestration at a Regional Scale (07-013812)
Sandia National Laboratories July 2007
8 Thermoelectric Power Plant Water Demands Using Alternative Water Supplies: Power Demand Options in Regions of Water Stress and Future Carbon Management (FWP-08-014053)
Sandia National Laboratories June 2008
8 Technology to Facilitate the Use of Impaired Waters in Cooling Towers (NT0005961)
GE Global Research October 2008
10 Optimization of Cooling Water Resources for Power Generation (FT40320-01.24 and NT43291-05.1)
University of North Dakota Energy and Environmental Research Center (UND EERC)
June 2007 July 2008
10 Internet Based, GIS Catalog of Non-Traditional Sources of Cooling Water for Use at America’s Coal-Fired Power Plants (NT0005957)
Arthur Langhus Layne, LLC October 2008
This document is intended to be regularly updated as additional research is conducted by investigators. The research reports through October 2009 are reported in this version.

5
3. Regulatory and Permitting Considerations
The purpose of this chapter is to highlight the broad issues associated with regulations and permitting that must be considered when proposing to use non-traditional waters within a thermoelectric power plant. Most of the NETL research reports on non-traditional waters cover this topic, at most, in a cursory fashion, but access to a water supply in a water-scarce region is limited by law, regulation, and/or policy.
With regard to regulatory and permitting considerations, the principal issues of concern include plant discharge from treatment processes, laws related to water rights, and regulations governing water reuse. In addition, one researcher lists available government incentives to promote the use of non-traditional waters. These topics are covered in the following sections.
Plant Discharge from Treatment Processes
Federal and state laws apply to the plant discharges, but vary depending on the composition of the non-traditional water source as well as the treatment processes. The Federal Clean Water Act (CWA) establishes authority over plant discharges into the environment, but most state water pollution control agencies are responsible for administering and enforcing the provisions of the CWA.
Under the CWA, plant discharges into navigable waters are regulated by permits issued under the National Pollution Discharge Elimination System (NPDES). The NPDES permits are based on both technology-based effluent limits and water quality-based effluent limits, whichever is more stringent. When discharges are made to designated impaired waters, the effluent limits specified in the permit are more stringent. In addition to pollutant concentration limits, NPDES discharge regulations may also restrict the total maximum daily load (TMDL) of a particular pollutant or the quality of the receiving water body (e.g., minimum dissolved oxygen concentrations).
Regulations may also govern the effluent discharge flow rate from a power plant. In the U.S. Environmental Protection Agency’s (EPA) Guidelines for Water Reuse5, examples for regulating flow in order to preserve existing habitat (e.g., Endangered Species Act) and to meet demand for reclaimed water by communities in the area are cited. The EPA guidelines focused on water reclaimed from municipal wastewater treatment systems and on pollutants associated with wastewater treatment.
In addition, some treatment processes may generate solid or sludge byproducts requiring offsite storage. The Federal Resource Conservation and Recovery Act (RCRA), as well as state laws, will govern requirements associated with these process streams.
Water Rights
Water rights allow the diversion of water and its use for particular purposes. State statutes, regulations, and case law govern the rights of private parties and government entities regarding the use of the public waters.5 Water rights in Western states (and areas that are water-limited) are generally governed under the appropriative doctrine, and the riparian doctrine typically

6
applies in Eastern states. Both doctrines can affect water reuse projects and apply to surface waters, but groundwater rights are most often administered through an appropriative doctrine.
The appropriative rights system grants the user the rights to a particular beneficial use based on a first-come, first-served basis. Under this system, a new user may not diminish the quantity or quality of the water to any more senior users. Late users may not have rights to the water except in the wet season. Under the appropriative doctrine, state law may promote or constrain reuse projects. Even if the user has first rights to the use of effluent, EPA guidelines suggest four cases that may discourage reuse projects:
Activities that could reduce discharge (e.g., evaporative cooling) and affect downstream users.
Changes in the point of discharge or the place of use.
In times of shortage, a hierarchy of use could prevent reclaimed water from being used for industrial processes.
Reduced withdrawals from the water supply may jeopardize the availability during a shortage if allocations are based on historic usage.
In the East and water-abundant areas, riparian water rights systems are based on land purchases beside the waterways. All landowners whose property is directly adjacent to a body of water have equal right to make reasonable use of that water. However, riparian users are not entitled to use the water such that stream flow or quality is substantially depleted. Unlike the appropriative doctrine, each landowner is assured some water when available, and the riparian doctrine does not allow for storage of water.
Federal water laws may sometimes impact water rights when usage affects water supply in another state, protected Native American tribal land, or another country. The Federal government may claim jurisdiction in state disputes (e.g., claims to water in the Colorado River during shortages). In addition, Federal reserved water rights refer to the water quantity reserved by the Federal government but do not have to be established at the time of the land’s acquisition and are not lost due to non-use or abandonment. The Federal reserved water rights may not cause harm to other water users or take priority over existing appropriations.
Regulations Governing Water Reuse
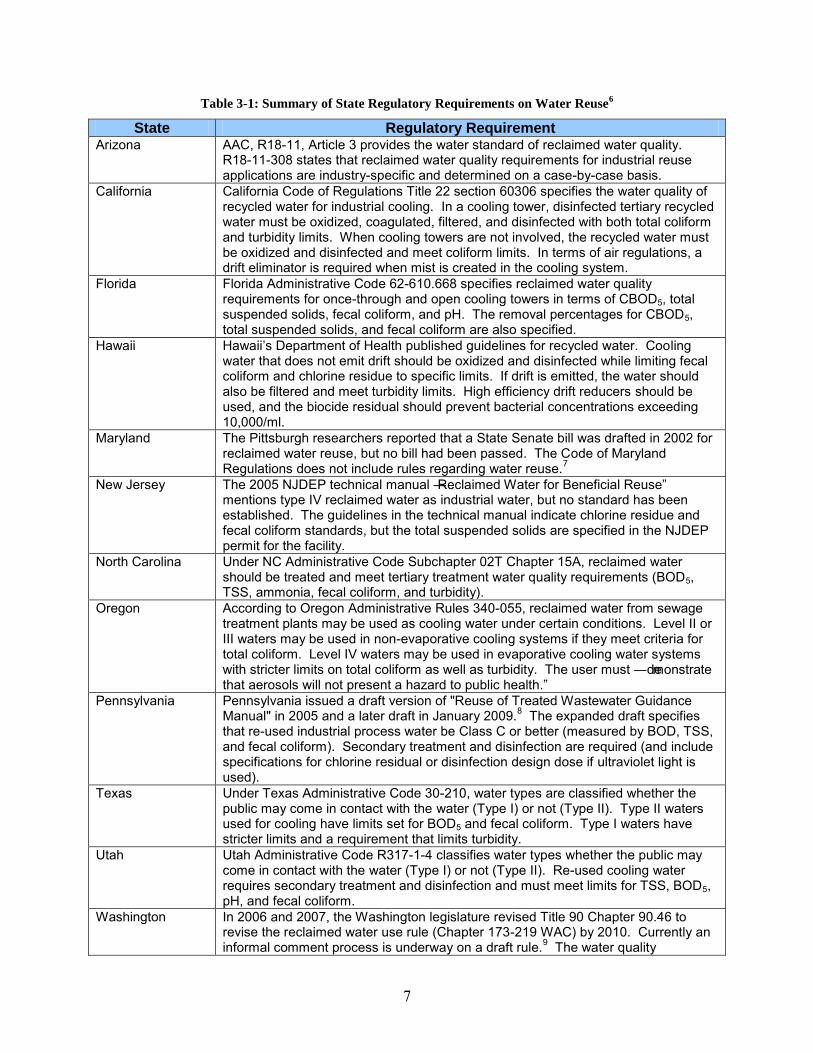
The University of Pittsburgh is currently conducting a research project for DOE/NETL on the treatment and use of various impaired waters in the cooling system for thermoelectric power plants.6 One of the project tasks was to assess the relevant regulations and permitting issues associated with the use of impaired waters. Although the Federal government has not established regulations that specifically address reuse of impaired waters, a number of states have developed guidelines or regulations. The state regulations pertain primarily to minimizing cooling tower drift, which could possibly pose a health risk to the public. Table 3-1 highlights state regulations from the University of Pittsburgh study related to regulatory requirements for reuse of impaired water in industrial settings.
7
Table 3-1: Summary of State Regulatory Requirements on Water Reuse6
State Regulatory Requirement Arizona AAC, R18-11, Article 3 provides the water standard of reclaimed water quality.
R18-11-308 states that reclaimed water quality requirements for industrial reuse applications are industry-specific and determined on a case-by-case basis.
California California Code of Regulations Title 22 section 60306 specifies the water quality of recycled water for industrial cooling. In a cooling tower, disinfected tertiary recycled water must be oxidized, coagulated, filtered, and disinfected with both total coliform and turbidity limits. When cooling towers are not involved, the recycled water must be oxidized and disinfected and meet coliform limits. In terms of air regulations, a drift eliminator is required when mist is created in the cooling system.
Florida Florida Administrative Code 62-610.668 specifies reclaimed water quality requirements for once-through and open cooling towers in terms of CBOD5, total suspended solids, fecal coliform, and pH. The removal percentages for CBOD5, total suspended solids, and fecal coliform are also specified.
Hawaii Hawaii’s Department of Health published guidelines for recycled water. Cooling water that does not emit drift should be oxidized and disinfected while limiting fecal coliform and chlorine residue to specific limits. If drift is emitted, the water should also be filtered and meet turbidity limits. High efficiency drift reducers should be used, and the biocide residual should prevent bacterial concentrations exceeding 10,000/ml.
Maryland The Pittsburgh researchers reported that a State Senate bill was drafted in 2002 for reclaimed water reuse, but no bill had been passed. The Code of Maryland Regulations does not include rules regarding water reuse.7
New Jersey The 2005 NJDEP technical manual ―Reclaimed Water for Beneficial Reuse‖ mentions type IV reclaimed water as industrial water, but no standard has been established. The guidelines in the technical manual indicate chlorine residue and fecal coliform standards, but the total suspended solids are specified in the NJDEP permit for the facility.
North Carolina Under NC Administrative Code Subchapter 02T Chapter 15A, reclaimed water should be treated and meet tertiary treatment water quality requirements (BOD5, TSS, ammonia, fecal coliform, and turbidity).
Oregon According to Oregon Administrative Rules 340-055, reclaimed water from sewage treatment plants may be used as cooling water under certain conditions. Level II or III waters may be used in non-evaporative cooling systems if they meet criteria for total coliform. Level IV waters may be used in evaporative cooling water systems with stricter limits on total coliform as well as turbidity. The user must ―demonstrate that aerosols will not present a hazard to public health.‖
Pennsylvania Pennsylvania issued a draft version of "Reuse of Treated Wastewater Guidance Manual" in 2005 and a later draft in January 2009.8 The expanded draft specifies that re-used industrial process water be Class C or better (measured by BOD, TSS, and fecal coliform). Secondary treatment and disinfection are required (and include specifications for chlorine residual or disinfection design dose if ultraviolet light is used).
Texas Under Texas Administrative Code 30-210, water types are classified whether the public may come in contact with the water (Type I) or not (Type II). Type II waters used for cooling have limits set for BOD5 and fecal coliform. Type I waters have stricter limits and a requirement that limits turbidity.
Utah Utah Administrative Code R317-1-4 classifies water types whether the public may come in contact with the water (Type I) or not (Type II). Re-used cooling water requires secondary treatment and disinfection and must meet limits for TSS, BOD5, pH, and fecal coliform.
Washington In 2006 and 2007, the Washington legislature revised Title 90 Chapter 90.46 to revise the reclaimed water use rule (Chapter 173-219 WAC) by 2010. Currently an informal comment process is underway on a draft rule.9 The water quality

8
State Regulatory Requirement standards are currently set by the 1997 version of the Water Reclamation and Reuse Standards. If mists are not created, Class C water may be oxidized and disinfected with limits on total coliform, chlorine residual, BOD, TSS, and turbidity. If mists are created, only Class A water that has been oxidized, coagulated, filtered, and disinfected may be used with stricter standards on total coliform than the non-mist case.
Wyoming Under Wyoming’s Standards for the Reuse of Treated Wastewaters Chapter 21,10 Section 12 states that treated wastewater is authorized for reuse for irrigation purposes only. However, Section 7(b) states that ―The determination of the manner in which treated wastewater is to be reused is a local determination.‖ Standards are set for fecal coliform.
As indicated in Table 3-1, states’ regulatory requirements are focused on the reuse of wastewaters (primarily municipal) but not on other non-traditional waters, as evidenced by the concerns about microorganisms in cooling tower drift. Any additional rules or regulations that researchers have identified regarding their particular types of non-traditional waters are described in the chapters that deal with the individual waters.
Available Governmental Incentives
Gillette and Veil11 conducted an NETL study on potential incentive options to encourage industrial sources to use produced water, coalbed methane (CBM) water, and mine pool water. In that report, the authors list several reasons why different levels of government might offer incentives (e.g., reducing demand on conventional sources, enticing industry, and eliminating contamination threats). They then identified and briefly described five governmental incentive measures that could be applied:
1. Direct grants to pay full or partial costs for constructing and/or operating a facility.
2. Tax/royalty subsidies or reductions by local or state governments (set to expire after a specific period of time).
3. Reduced water costs to the user.
4. Assured market for a private company that collects, treats, and distributes these water resources to ensure an appropriate return on the investment.
5. Regulatory relief where possible on environmental requirements, water quality restrictions, permitting, etc.
References 5 U.S. Environment Protection Agency and U.S. Agency for International Development, Guidelines for Water Reuse, EPA/625/R-04/108, September 2004. 6 University of Pittsburgh. Reuse of Treated Internal or External Wastewaters in the Cooling Systems of Coal-
Based Thermoelectric Power Plants; Quarterly Report for DOE/NETL Project No. DE-FC26-06NT42722; December 2006. 7 Office of the Secretary of State Division of State Documents. Title 26: Department of the Environment. http://www.dsd.state.md.us/comar/subtitle_chapters/26_Chapters.htm, last accessed March 11, 2009.

9
8 Pennsylvania Department of Environmental Protection, Reuse of Treated Wastewater Guidance Manual, http://www.dep.state.pa.us/TechnicalGuidance/Draft_technical_guidance.asp, last accessed March 11, 2009. 9 Department of Ecology, State of Washington. “Preliminary Baseline Rule Language Comments.” http://www.ecy.wa.gov/programs/wq/reclaim/comments/COMMENTS.html, last accessed March 11, 2009. 10 Wyoming Secretary of State, Standards for the Reuse of Treated Wastewaters Chapter 21. http://soswy.state.wy.us/Rules/RULES/2804.pdf, last accessed March 11, 2009. 11 J.L. Gillette and J.A. Veil. Identification of Incentive Options to Encourage the Use of Produced Water, Coal Bed Methane Water, and Mine Pool Water. September 2004.

10
4. Thermoelectric Power Plant Water Quantity and Quality Needs
Introduction
The purpose of this chapter is to provide an overview of the makeup water quantity and quality requirements for thermoelectric power plants. In the future, thermoelectric power plants may be required to supplement and/or replace freshwater makeup with some source of non-traditional water in order to conserve freshwater resources. However, some sources of non-traditional water could have physical or chemical properties that would be detrimental to power plant operations without appropriate treatment. Therefore, the water quality requirements for power plant systems need to be specified in order to determine appropriate treatment requirements for the non-traditional water.
Background
Thermoelectric power plants – coal, oil, natural gas, and nuclear fueled power generators using a steam turbine based on the Rankine thermodynamic cycle – require significant quantities of water for generating electrical energy. The largest demand for this water is process cooling. The two commonly used metrics to measure water use are withdrawal and consumption. The water required for thermoelectric plant operation is withdrawn primarily from large volume sources, such as lakes, rivers, oceans, and underground aquifers.12 Water consumption is used to describe the loss of withdrawn water, typically through evaporation into the air, which is not returned to the source. USGS estimated that thermoelectric generation accounted for approximately 41 percent of freshwater withdrawals, ranking slightly ahead of agricultural irrigation as the largest source of freshwater withdrawals in the United States in 2005.13 However, the corresponding water consumption associated with thermoelectric generation accounted for only 3 percent of total U.S. freshwater consumption in 1995.14 A recent DOE/NETL study estimated that in 2005, the total U.S. freshwater withdrawals for thermoelectric power generation amounted to approximately 146 billion gallons per day (BGD), while freshwater consumption was 3.7 BGD.15
There are two general types of wet cooling system designs used for thermoelectric power plants: once-through and wet recirculating.16 Plants equipped with once-through cooling water systems have relatively high water withdrawal, but low water consumption. Conversely, compared to once-through systems, plants equipped with wet recirculating systems have relatively low water withdrawal but high water consumption. In once-through systems, the cooling water is withdrawn from a local body of water and the warm cooling water is subsequently discharged back to the same water body after passing through the surface condenser. Due to the large volume of water required for once-through cooling systems, chemical treatment is generally not practical with the possible exception of chlorination to control microbiological fouling. This chapter focuses on water treatment requirements for wet recirculating cooling systems. Figure 4-1 shows a simplified schematic of a coal-fired power plant equipped with a wet recirculating cooling system.

11
Figure 4-1: Schematic of a Wet Recirculating Cooling Water System
In wet recirculating systems, the warm cooling water is typically pumped from the condenser to a cooling tower where the heat is dissipated directly to ambient air by evaporation of the water and heating the air. The cooling water is then recycled back to the condenser. Because of evaporative losses, a portion of the cooling water needs to be discharged from the system – known as blowdown − to prevent an excessive buildup of minerals and sediment in the water that could adversely affect performance. The quantity of blowdown required for a particular cooling water system is determined by a parameter known as cycles of concentration (COC), which is defined as the ratio of dissolved solids in the circulating water to that in the makeup water. As the COC increases, the quantity of blowdown and makeup water decreases. In addition to the cooling system, coal-fired power plants use water for flue gas desulfurization (FGD) makeup, boiler makeup, ash handling, wastewater treatment, and general plant wash down.17 For coal-fired power plants with a wet FGD system, it is the second largest user of makeup water. Table 4-1 shows the estimated makeup water requirements for a 520-megawatt (MW) subcritical coal-fired power plant equipped with a wet recirculating cooling tower operating at four COC and a wet FGD system.18 Flow rates are given in terms of gallons per minute (gpm) and gallons per hour per megawatt capacity (gph/MW). The cooling system requires a net makeup water flow of 5,150 gpm to replace the evaporation and blowdown water losses less the boiler blowdown water that is directed to the cooling tower. The FGD system requires a net makeup water flow of 571 gpm to replace evaporative losses in the flue gas and FGD gypsum by-product water losses. Water requirements for a supercritical plant would be approximately 10 percent to 12 percent less than those for a subcritical plant on a megawatt basis due to greater plant efficiency.

12
Table 4-1: Estimated Cooling and FGD System Makeup Water Requirements
for a 520-MW Subcritical Coal-Fired Power Plant18
Flow Path Flow Rate,
gpm Flow Rate, gph/MW
Cooling System Evaporation 3,891 449 Blowdown 1,297 150 Gross cooling tower makeup 5,188 599 Boiler blowdown to tower 38 4 Net cooling tower makeup 5,150 595 FGD System Flue gas evaporation 490 57 FGD gypsum by-product 81 9 Net wet FGD makeup 571 66
As previously mentioned, evaporative losses from the cooling tower can lead to an excessive buildup of total dissolved solids (TDS) in the circulating water system that could adversely affect performance of the steam condenser and cooling tower. Blowdown of a portion of the circulating water is the primary method used to control TDS concentrations. The COC can be calculated using the following formula (assuming zero drift losses):
COC = (E + B)/B
Where: COC = Cycles of concentration
B = Blowdown rate, gpm
E = Evaporation rate, gpm
The makeup water quality requirements for the cooling water system are contingent on the water quality requirements of the circulating water and the COC that the system is operated. For example, if the maximum acceptable level of chlorides in the circulating water system is 750 milligrams per liter (mg/L) and the system is operated at three COC, then the makeup water would need to be limited to 250 mg/L (750 divided by three).
Conversely, the makeup water quality can dictate the allowable COC for which the cooling system can be operated. The formula above can be re-written to calculate the required blowdown rate (B) based on the COC and evaporation rate (E):
B = E/(COC-1)
For example, if the circulating water’s maximum chloride concentration were 1,000 mg/L and the makeup water chloride concentration was 250 mg/L, then the maximum COC would be four (1,000/250). Assuming the evaporation rate was 3,000 gpm, the required blowdown rate would be 1,000 gpm (3,000/4-1), and total makeup water would be 4,000 gpm (3,000+1,000). However, if the makeup water chloride concentration increases to 500 mg/L, then the maximum COC would be two (1,000/500), the required blowdown rate would increase to 3,000 gpm (3,000/2-1), and total makeup water would increase to 6,000 gpm (3,000+3,000). If such an increase in the blowdown rate or makeup were not acceptable, then either the makeup water would require treatment to reduce the concentration of chlorides, or the circulating water would require treatment to accommodate the increased chloride concentration.

13
Water Quality Impacts on the Cooling Water System
Without proper control, the physical and chemical characteristics of the makeup and circulating water can lead to scale formation, corrosion, or microbiological fouling that adversely affect cooling water system performance.
Scale Formation
As water evaporates from the circulating water system, dissolved solids from the makeup water can accumulate to saturation levels and begin to precipitate out of solution as solid scale-forming deposits. Scale formation is a function of the chemical composition of the makeup water, circulating water temperature and pH, and COC.19 There are several chemical species (including calcium carbonate [CaCO3], calcium sulfate, calcium phosphate, and magnesium silicate) that contribute to TDS in freshwater makeup to the cooling system that can form scale deposits if allowed to reach saturation levels. Recent studies of various non-traditional waters have identified CaCO3, silica, barium sulfate, and calcium sulfate to be chemical constituents that could potentially limit COC based on the effective treatment limits of commercially available scale control technologies.20
Calcium carbonate is the principal scale-forming component in the cooling water system and is formed by the decomposition of calcium bicarbonate. There can also be a problem with calcium sulfate scaling if sulfuric acid is used to control calcium bicarbonate levels. The potential for CaCO3 scaling is dependent on a number of inter-related physical and chemical characteristics of the cooling water system. Although blowdown is the primary method used to control TDS concentration in the circulating water system, some form of treatment may also be required (e.g., chemical additives and/or various methods of filtration). Chemical treatment using phosphonates or polymers are used to prevent CaCO3 scaling by acting as a dispersant and/or crystal modifier.
Corrosion
Corrosion in the cooling water system occurs primarily due to electrolytic action. Therefore, an increase in TDS raises conductivity and the potential for corrosion. Excessive chloride and sulfate ion concentrations are of particular concern regarding corrosion potential. However, the acceptable level of water quality to minimize corrosion is dependent on the materials of construction used throughout the cooling water system. The most serious concern with corrosion occurs with the tubing and tubesheet of the steam condenser. These components are typically constructed of copper alloys, stainless steel, or titanium. The copper alloys are the most susceptible to corrosion, but the stainless steels are also at risk. For example, ammonia (NH3) can cause corrosion to copper and copper alloys.21 Pitting corrosion of stainless steels can also be caused by manganese oxide in the circulating water.19 Chemical treatment using various corrosion inhibitors can be used to prevent corrosion. Copper alloys can be treated with tolyltriazole, and stainless steels can be treated with ortho-phosphate.22
Microbiological Fouling
Microbiological growth within the circulating water system results in biofilm deposits of slime and algae on heat transfer surfaces. The biofilm deposits can both restrict heat transfer and promote corrosion. Certain chemical species in the makeup water – such as nitrogen, phosphate, and organic compounds – can promote microbiological growth within the circulating water

14
system.19 Microbiological fouling can be controlled by chlorine, bromine, sodium hypochlorite, chlorine dioxide, hydrogen peroxide, ozone, or various proprietary chemical treatments.19,23,24
Water Quality Requirements for the Cooling Water System
As previously discussed, proper water quality requirements must be maintained in order to prevent scale formation, corrosion, or microbiological fouling that could adversely affect cooling water system performance. Although corrosion and microbiological fouling might be more severe when using non-traditional water for makeup, it is likely that scale formation will be the greatest concern. The maximum COC using the non-traditional water needs to be determined based on a review of calculated saturation ratios of potential mineral deposits compared to the practical treatment limits of commercially available scale control technologies. The following subsections provide recommended water quality requirements for cooling water systems as recommended by various industry experts. Since several methods of treatment may be required, it is important that any interaction between the treatments does not impede their performance. Therefore, a qualified cooling water system consultant should be used to assure proper water treatments are being utilized. Table 4-2, Table 4-3, and Table 4-4 provide cooling water chemistry limit recommendations from three organizations. SPX Cooling Technologies, Inc. is one of the largest U.S. suppliers of wet and dry cooling systems for thermoelectric power plants. Table 4-2 presents SPX general recommendations for circulating water quality requirements.23 Nalco is one of the largest U.S. vendors for cooling system water treatment technologies used in the power generation industry. Table 4-3 shows the concentrations or saturation ratios for constituents of non-traditional water that Nalco assumes as upper limits when using commercially available scale inhibitors.20,25 The Electric Power Research Institute (EPRI) conducted a study for the California Energy Commission (CEC) on the use of degraded water sources for cooling water makeup in power plants. Table 4-4 presents a summary of the cooling water criteria developed by EPRI for the CEC study.26
Table 4-2: SPX General Cooling Water Chemistry Limits
Constituent Cooling Water Chemistry Limit pH Range of 6 to 8 Chloride Less than 750 mg/L measured as NaCl Sulfate (SO4) Less than 1,200 mg/L Sodium bicarbonate (NaHCO3)
Less than 200 mg/L
Calcium carbonate (CaCO3)
Langelier saturation index ≈ 0 Ryznar stability index between 6 and 7
Table 4-3: Nalco Water Chemistry Limits for Cooling Water
Constituent Cooling Water Chemistry Limit Iron Up to 5.0 mg/L
Silica Up to 200 – 250 mg/L depending on temperature and magnesium concentration
CaCO3 Saturation ratio up to 250 Calcium sulfate Gypsum saturation ratio up to 4.5 Barium sulfate Barite saturation ratio up to 900

15
Table 4-4: EPRI Water Chemistry Limits for Cooling Water
Constituent Units Cooling Water Chemistry Limit Ca mg/L CaCO3 < 900 (Note 1)
Ca w/ PO4 present mg/L CaCO3 20 – 285 (depending on pH and PO4 concentration) (Note 1)
Ca x SO4 (mg/L)2 < 500,000 (Note 1)
Mg x SiO2 mg/L CaCO3 x
mg/L SiO2 < 35,000 w/o scale inhibitor < 75,000 w/ scale inhibitor (Note 1)
Alkalinity (HCO3 + CO3)
mg/L CaCO3 30 – 50 w/o scale inhibitor 200 – 250 w/ scale inhibitor (Note 1)
SO4 mg/L Case specific limit (Note 1) SiO2 mg/L < 150 (Note 1) PO4 mg/L Case specific limit (Note 1) Fe mg/L < 0.5 (Note 1) Mn mg/L < 0.5 Cu mg/L < 0.1 Al mg/L < 1 S mg/L < 5 NH3 mg/L < 2 (Note 2)
pH mg/L 6.8 – 7.2 w/o scale inhibitor 7.8 – 8.4 w/ scale inhibitor (Note 1)
pH w/ PO4 present 7.0 – 7.5 (Note 1) TDS mg/L < 70,000 (Note 1)
TSS mg/L < 100 with film fill < 300 with splash fill
Langelier index -- < 0 Ryznar index -- > 6 Puckorius index -- > 6
Note 1: Limit represents a conservative value. EPRI recommends software calculation of saturation level. Note 2: <2 mg/L NH3 limit applies when copper alloys are present in cooling water system. Does not apply
to 70-30 or 90-10 copper nickel alloys.
Water Quality Impacts on the FGD System
Proper makeup water quality is also necessary to maintain process performance and minimize corrosion and scaling in FGD systems. The basic FGD process involves spraying an alkaline reagent into the coal combustion flue gas that reacts with sulfur dioxide (SO2) and water to form a precipitated salt by-product that can be filtered from the system and either disposed in an impoundment/landfill, or marketed for beneficial use. Lime or limestone can be used as the reagent and the salt by-product is calcium sulfite and/or calcium sulfate. The FGD process can be further defined as either dry or wet depending on the amount of water used to spray the reagent into the flue gas. Figure 4-2 is a schematic of a wet limestone FGD absorber module showing the major process flows. The majority of U.S. wet FGD systems use limestone, while most dry FGD systems use lime as the reagent. However, there are a number of U.S. plants that have wet FGD systems that use a magnesium-enhanced lime as the reagent.
This discussion will focus on the water quality requirements for wet lime and limestone FGD systems because they require greater volumetric flow rates of makeup water. There are several processes in wet FGD systems that require makeup water including reagent preparation and mist eliminator wash. Makeup water is also required for pump seals and to maintain process density

16
and/or tank levels. These water uses are necessary for operation of the FGD process and help replenish the water losses associated with evaporation to the flue gas and the chemical formation and disposal of the FGD waste by-product. In addition to using freshwater for FGD makeup, some plants utilize cooling tower blowdown. Reclaimed FGD process water from the FGD solids dewatering process can also be used for some of the FGD-related processes. Water may also need to be purged from the FGD system to control the build-up of chlorides. This serves a similar function to blowdown in the cooling water system.
Figure 4-2: Wet Limestone FGD Process Schematic
In a wet lime FGD system the lime feed slurry is prepared by mixing dry pebble lime with freshwater to convert the calcium oxide (CaO) to calcium hydroxide (Ca[OH]2) – known as lime slaking. The slaked lime is then further diluted with either freshwater or FGD process water to produce lime slurry with the proper solids concentration. Similarly, in a wet limestone FGD system, limestone slurry is typically prepared by grinding dry pebble limestone to a fine powder in a wet ball mill where freshwater or reclaimed process water is added to provide proper dilution. The FGD absorber vessel includes a mist eliminator device to prevent excessive carryover of slurry droplets in the exit flue gas stream. The mist eliminator chevrons are washed with freshwater to prevent the accumulation of solids that could lead to pluggage.
The relative amount of calcium sulfite/sulfate formed in a wet FGD system is a function of several process parameters, including the amount of oxygen available in the flue gas to convert the sulfite to sulfate. A majority of today’s wet FGD systems use forced oxidation to further drive the FGD chemistry to maximize calcium sulfate production. The use of forced oxidation to promote calcium sulfate formation has two primary FGD process benefits: 1) there is less scaling of internal FGD components, which increases performance and reliability; and 2) dewatering and disposal of calcium sulfate is easier and less expensive than calcium sulfite. However, perhaps just as important, calcium sulfate – also known as gypsum – can be used as a low-cost alternative to naturally-occurring rock gypsum in the production of wallboard. As a result, many coal-fired power plants equipped with forced oxidation wet FGD systems have been selling their FGD synthetic gypsum by-product to wallboard manufacturers, which both eliminates the cost of disposal and provides additional revenue.
Flue Gas from
ESP or FF
Wet Flue Gas
to Stack
FGD Solids to Dewatering
System
FGD Absorber
Vessel
FGD Slurry
Sprays
Limestone &
Water
Oxidation Air
M.E. wash water
Mist
Eliminator

17
Water Quality Requirements for the FGD System
Lime and limestone wet FGD systems have different water quality requirements for both reagent preparation and mist eliminator wash due to differences in process chemistry. According to Carmeuse, a major U.S. supplier of FGD lime and limestone reagents, while lime preparation requires water with relatively low sulfate content (less than 500-1,000 mg/L), limestone preparation should be relatively unaffected by high TDS water quality. Conversely, wet lime FGD systems are likely to be unaffected by high TDS mist eliminator wash water, but wet limestone FGD mist eliminators could be adversely affected. However, for either lime or limestone systems, mist eliminator wash water should be low enough in calcium and sulfate to maintain gypsum saturation levels below 30 percent to minimize the potential for scaling.27
Although wet FGD systems are designed with appropriate materials of construction to address a highly corrosive environment, the relatively high chloride content of some non-traditional water could adversely impact some stainless steels.28 For example, EPRI established a 5,000-mg/L limit for chloride levels at the San Juan Power Station to minimize corrosion of stainless steel components of the wet FGD absorber.29
In 1996, Radian International (now part of URS Group) prepared an FGD process design manual for DOE that included recommendations on water quality requirements.30 The following information is taken from the manual:
1. In addition to using freshwater, much of the required wet FGD makeup water can be met using relatively low-quality water sources such as treated wastewater, ash sluice water, cooling tower blowdown, or treated municipal wastewater.
2. Trace species, such as iron and manganese, can act as oxidation catalysts. This would be a benefit to forced-oxidation systems, but a detriment to inhibited-oxidation systems. However, iron and manganese may be a concern if the gypsum is being marketed for wallboard production.
3. For wet lime FGD systems, the lime slaking water must be relatively low in TDS to minimize unwanted chemical reactions that could reduce slaking efficiency. Therefore, freshwater is preferred for this application.
4. For wet limestone FGD systems, the limestone grinding operation does not require a chemical reaction; therefore, reclaimed FGD process water can be used for limestone slurry preparation without affecting reagent reactivity.
5. Mist eliminator wash water for magnesium-lime and inhibited-oxidation limestone wet FGD systems can be reclaimed FGD process water, provided the calcium sulfate relative saturation31 is less than 50 percent and the water is free of suspended solids. However, it is recommended that freshwater be used for mist eliminator wash in forced-oxidation limestone wet FGD systems.
6. Pump seal water should be freshwater.
7. High levels of chloride can concentrate in the FGD process water depending on the chlorine content of the coal and the FGD system water balance. Excessive levels of chloride can decrease SO2 removal performance in limestone FGD systems and accelerate corrosion of stainless steel components. Chloride concentrations should be kept below 15,000 mg/L to prevent any significant impact on SO2 removal. The

18
chloride concentration should be kept below 3,000 mg/L for Type 316L stainless steel, less than 6,000 to 8,000 mg/L for Type 317L stainless steel, and less than 10,000 mg/L for Type 904L stainless steel.
8. Wallboard manufacturers have quality control specifications for the physical and chemical parameters of FGD synthetic gypsum. It will be important to assure that any use of impaired water for FGD makeup not adversely impact the quality of the synthetic gypsum.
9. Depending on the overall water balance of the wet FGD system and the need to limit the buildup of chlorides and TDS in the process liquor, it may be necessary to discharge water from the system similar to a cooling tower blowdown. The FGD discharge water may need treatment in order to meet the plant’s NPDES permit requirements.
References
12 Both freshwater (approximately 70 percent of U.S. total) and saline water (approximately 30 percent of U.S. total) are currently used for thermoelectric generation. Saline water is used primarily at plants located along the coast that are equipped with once-through cooling systems. 13 Kenny, J.F., N.L. Barber, S.S Hutson, K.S. Linsey, J.K. Lovelace, and M.A. Maupin, Estimated Use of Water in the United States in 2005, U.S. Geological Survey Circular 1344, 2009. 14 USGS. Estimated Use of Water in the United States in 1995; USGS Circular 1200; 1998. 15 DOE/NETL. Estimating Freshwater Needs to Meet Future Thermoelectric Generation Requirements; September 2008. 16 A relatively small percentage of thermoelectric power plants in the United States utilize dry cooling systems that require a minimal supply of makeup water. 17 Compared to the cooling water and FGD systems, there is a minimal quantity of makeup water required for the boiler, ash handling, wastewater treatment, and general plant wash down systems. As a result, there is no further discussion of these water uses in this chapter. 18 Parsons. Power Plant Water Usage and Loss Study; Report prepared for U.S. DOE/NETL; May 2007. 19 Daniels, David. Untangling the Complexities of Cooling Water Chemistry; Power Magazine; September 2002. 20 Nalco Company. A Synergistic Combination of Advanced Separation and Chemical Scale Inhibitor Technologies
for Efficient Use of Impaired Water as Cooling Water in Coal-Based Power Plants; Quarterly Report for DOE/NETL Project No. DE-FC26-06NT42721; July 2006. 21 Argonne National Laboratory. Use of Reclaimed Water for Power Plant Cooling; August 2007. 22 Mortensen, Ken. How to Manage Cooling Tower Water Quality; RSES Journal; May 2003. 23 SPX Cooling Technologies. Cooling Tower Fundamentals; Published by Marley Cooling Technologies, Inc.; Second edition; Copyright 1998. 24 Buecker, Brad. Choosing the Right Cooling Tower Chemicals; Power Engineering; July 1998. 25 Nalco Company. A Synergistic Combination of Advanced Separation and Chemical Scale Inhibitor Technologies
for Efficient Use of Impaired Water as Cooling Water in Coal-Based Power Plants; Quarterly Report for DOE/NETL Project No. DE-FC26-06NT42721; October 2006.

19
26 EPRI. Use of Degraded Water Sources as Cooling Water in Power Plants; Report No. P500-03-110 prepared for California Energy Commission; October 2003. 27 Benson, Lew. Carmeuse North America; Personal communication on September 10, 2007. 28 Buecker, Brad. Kansas City Power & Light Company; Personal communication on September 10, 2007. 29 EPRI. Use of Produced Water in Recirculating Cooling Systems at Power Generating Facilities; Semi-Annual Technical Progress Report for DOE/NETL Project No. De-FC26-03NT41906; October 2004. Available at: http://www.netl.doe.gov/technologies/coalpower/ewr/water/pp-mgmt/pubs/41906/41906Treatment%26DisposalAnalysis.pdf. 30 Radian International. Electric Utility Engineer’s FGD Manual, Volume I – FGD Process Design. Final Report for DOE Project No. DE-FG22-95PC94256; March 1996. 31 Relative saturation is the ratio of the actual concentration to the theoretical saturation concentration based on the solution’s chemical composition, pH, and temperature.

20
5. Treated Municipal Wastewaters/Reclaimed Waters
This chapter covers Existing Plants Program-funded work on the use of treated municipal wastewaters (also called reclaimed waters) for power plant cooling. Reclaimed waters represent a large alternative source of water that is being used in a variety of ways throughout the United States. Many studies have been published on the use of reclaimed water for irrigation, fire protection, wildlife habitat enhancement, and industrial applications. EPA has issued several reports on reclaimed water and water reuse, the most comprehensive of which was completed in 2004. EPA (2004)32 documents numerous examples of reclaimed water reuse, including some involving cooling water at power plants. A national organization, the WateReuse Association, sponsors conferences and meetings that provide information on many aspects of the reuse of reclaimed water. While there has been a significant amount of work devoted to the study of the use of reclaimed water, a small percentage of that has been devoted to its use in utility applications.33
There are several reasons why reclaimed water represents a potentially valuable alternative source of cooling water. Municipal wastewater is available in communities throughout the country, and treatment facilities are designed to handle specific design flows. Thus, the quantity of water leaving the treatment plants is well defined and can be factored into the design and operation of power plant cooling systems. Data analysis has revealed that 81 percent of power plants proposed for construction by the Energy Information Administration (EIA) would have sufficient cooling water supply from one to two publicly owned treatment works (POTWs) within a 10-mile radius, while 97 percent of the proposed power plants would be able to meet their cooling water needs with one to two POTWs within 25 miles of these plants. Thus, municipal wastewater will be the impaired water source most likely to be locally available in sufficient and reliable quantities for power plants.34
This chapter reflects work that has been, or is currently being done, in the following NETL studies:
“Use of Reclaimed Water for Power Plant Cooling,” (DE-AC02-06CH11357) conducted by Argonne National Laboratory (ANL) to develop information on the actual use of reclaimed water for cooling or other purposes at power plants.33
“Reuse of Treated Internal or External Wastewaters in the Cooling Systems of Coal-based Thermoelectric Power Plants,” (NT42722) conducted by the University of Pittsburgh and Carnegie Mellon University to assess the potential of using three different impaired waters (secondary treated municipal wastewater, passively treated coal mine drainage, and ash pond effluent) as cooling water in coal-based thermoelectric power generation.34
“Use of Treated Municipal Wastewater as Power Plant Cooling System Makeup Water: Tertiary Treatment versus Expanded Chemical Regimen for Recirculating Water Quality Management,” (NT06550) conducted by Carnegie Mellon University and University of Pittsburgh to compare the impacts of tertiary treatment and chemical treatments on the performance of treated municipal wastewater in power plant cooling systems.35

21
Water Quality
Reclaimed water is treated municipal wastewater, and as such is subject to several sets of state and Federal regulatory requirements. EPA (2004)33 contains a detailed discussion of the national and state requirements associated with the full spectrum of reuse of reclaimed water. A brief summary is provided below.
The CWA requires that all discharges of pollutants to surface waters (streams, rivers, lakes, bays, and oceans) must be authorized by a permit issued under the NPDES program. EPA has the authority to administer the NPDES program, but it can also authorize states to implement all or parts of the program. Municipal wastewater treatment facilities must obtain an NPDES permit before discharging treated wastewater.
The national minimum technology-based discharge standard for municipal wastewater is referred to as “secondary treatment.” The secondary treatment regulation places limits on five-day biochemical oxygen demand (BOD5), total suspended solids (TSS), and pH. The pH limit is that the effluent must be maintained between six and nine. For BOD5 and TSS, the 30-day average values cannot exceed 30 mg/L, the seven-day average values cannot exceed 45 mg/L, and the 30-day average percent removal cannot be less than 85 percent.
In addition, NPDES permits can include water quality-based limits that consider state water quality standards and the available dilution of the receiving water body. These limits may be set on metals, organic compounds, nutrients, whole effluent toxicity, or other parameters. Bacteria and other microbial pathogens that could potentially be released to the atmosphere through a cooling tower plume are of particular concern. Most NPDES permits for municipal wastewater discharges include limits for microbial pathogens and/or controls for disinfection. However, these limits are not based on any Federal regulations, but rather on state regulations and policies.
Most states have either regulations or guidelines regarding the reuse of treated municipal wastewaters. Regulations refer to actual rules that have been enacted and are enforceable by government agencies. Guidelines, on the other hand, are generally not enforceable but can be used in the development of a reuse program or for exercise of agency discretion.
State requirements typically consider the probable degree of public exposure to reclaimed water. In circumstances where public exposure is unlimited, reclaimed water must be highly treated. In addition to the general and secondary standards, states may require more stringent biochemical oxygen demand (BOD) and TSS standards. To control microbial pathogens, states usually establish limits on fecal or total coliform bacteria, and may require that the wastewater be filtered before it can be reused as reclaimed water. States also frequently impose turbidity standards to ensure that the treatment systems are working properly. Chlorine is the most commonly used disinfectant. Some plants use ultraviolet radiation, ozone, or other halogenated compounds. If the disinfectant creates corrosive conditions (e.g., chlorine in some applications), operators may dechlorinate prior to use.
Table 5-1 summarizes some of the limits that are commonly applied by states to the use of reclaimed water.33

22
Table 5-1: Commonly Applied Limits for Water Quality Constituents in Reclaimed Water
Water Quality Constituent Limit Fecal Coliform <200/100 ml
Five-Day Biochemical Oxygen Demand (BOD5) <30 mg/L pH 6.0 – 9.0
Residual Chlorine >1 mg/L Total Suspended Solids (TSS) <30 mg/L
EPA (2004)32 includes suggested guidelines for reusing treated municipal wastewater in various applications. The elements of the guidelines related to using reclaimed water for power plant cooling include the water quality constituent concentrations cited in Table 5-1, along with the following:
The minimum treatment requirements include secondary treatment and disinfection with, if needed, chemical coagulation and filtration. Additional treatment may be performed to prevent scaling, corrosion, biological growth, fouling, and foaming.
Windblown spray should not reach areas accessible to workers or the public. This requirement can be met by providing a setback distance of 90 meters. This setback may be reduced or eliminated if a high level of disinfection is provided.
One other requirement relates to marking and identification of reclaimed water systems. The general standard is to paint any pipes, valves, pumps, and other components that convey reclaimed water a bright purple color to distinguish them from other types of water. Figure 5-1 shows reclaimed water pipes and pumps painted purple at a power plant in Maryland.33

23
Figure 5-1: Reclaimed Water Pipes and Pumps Painted Purple
Current Use of Reclaimed Waters for Power Plant Cooling
Argonne (2007)33 developed a database of power production facilities using reclaimed water for cooling based upon information found in Federal and state databases along with internet searches and detailed investigative work. The full database of 57 facilities is attached as Appendix A. Table 5-2 through Table 5-5 provides summary information from that database.
Table 5-2 shows the distribution of facilities by state. Florida, California, Texas, and Arizona have the highest number of facilities. All of these states have experienced freshwater shortages for many years. Their use of reclaimed water is a direct response to water shortages. However, reclaimed water is being used throughout the country. Several facilities are found in states that traditionally have been thought to have ample water supplies (Massachusetts, Maryland, Mississippi, New Hampshire, New Jersey, Pennsylvania, and Wisconsin).33

24
Table 5-2: Geographic Distribution of Facilities33
State in Which Power Plant and Wastewater Treatment Plant are Located
Number of Power Plants Using Reclaimed Water
Arizona 3 California 13 Colorado 1 Florida 17 Iowa 1
Kansas 1 Maryland 2
Massachusetts 3 Mississippi 1
Nevada 2 New Hampshire 1
New Jersey 2 New Mexico 1 Pennsylvania 1
Texas 7 Wisconsin 1
Table 5-3 shows the volumes of reclaimed water used by power production facilities. The data are well distributed and range from less than 0.1 million gallons per day (MGD) to as high as 55 MGD. Many facilities use seasonal-varying rates, as the power plants shift loads to meet power demand.
Table 5-3: Volume Usage Distribution33
Volume of Reclaimed Water Used (MGD) Number of Facilities
<0.1 6 0.1 – 0.5 10 0.51 – 1.0 12 1.01 – 5.0 15 5.01 – 10.0 6
>10.0 5
Table 5-4 shows the varying uses of reclaimed water at the power plants. Most of the plants use the reclaimed water as cooling tower makeup. Other uses include cooling pond supplementation, air scrubbing, boiler feed water, and source water to maintain underground pressure in geothermal fields in Northern California.33
Table 5-4: Distribution of Facilities by Their Use of Reclaimed Water
33 Use of Reclaimed Water Number of Facilities
Air scrubbers 2 Boiler feed water 1 Cooling ponds 2
Cooling tower makeup 46 Cooling tower makeup and scrubber water 1
Injected to increase pressure at geothermal fields 2

25
Table 5-5 shows the time period in which power facilities began using reclaimed water. Most power plants in the database began using reclaimed water after 1990. The oldest reported usage came from two power plants in Southern California that started using reclaimed water in 1967.33
Table 5-5: Distribution of Facilities by Time Period in Which Power Plant Began Using Reclaimed Water
33 Time Period in Which Power Plant Began Using
Reclaimed Water Number of Facilities
1960 – 1969 2 1970 – 1979 3 1980 – 1989 8 1990 – 1999 18 After 2000 19
Treatment of Reclaimed Water
Some of the chemical constituents commonly found in reclaimed water may lead to operational issues. For example:
Calcium phosphate and other constituents can cause mineral scaling.
Corrosion, pitting, and stress cracking damage to metal heat transfer surfaces and structural metal surfaces can result from the presence of a variety of constituents (e.g., NH3 can damage copper, copper alloys, and other metals).
BOD, phosphate, and NH3 can lead to biofouling of heat transfer surfaces and excessive biological growth on cooling tower fill material surfaces.
There are a variety of ways for power plant operators to control the water quality and cycles of concentration. Some of the concentrated water can be removed from the system as cooling tower blowdown. In order to replace the water lost to evaporation, blowdown, and drift, new makeup water is added to the system. Operators can adjust the flow volumes of blowdown and makeup to maintain suitable chemistry in the recirculating water. Another method for controlling water quality and increasing the cycles of concentration is to treat the incoming reclaimed water. Many different treatment processes can be used to target those constituents that are likely to limit the cycles of concentration or that could damage components of the cooling system, as described below.33
Reclaimed water is treated at the municipal wastewater treatment plant to at least secondary treatment standards in order to comply with Federal requirements. In some states (e.g., California), reclaimed water must be treated to tertiary treatment levels prior to reuse. However, other states do not place additional requirements on the quality of reclaimed water. In most cases, if the reclaimed water is not already treated beyond secondary standards, the power plant using the water will either treat it at the power plant site or pay the wastewater treatment utility to provide additional treatment.33
Table 5-6 shows the starting treatment levels and the additional treatment provided for reclaimed water used for power plant cooling at eight facilities. The starting level of treatment ranges from

26
secondary to tertiary. The additional treatment steps include chemical addition, clarification, disinfection, pH adjustment, and biological treatment.33
Other Issues
The overall objective of the University of Pittsburgh/Carnegie Mellon University study34 is to assess the potential of using three different impaired waters (secondary treated municipal wastewater, passively treated coal mine drainage, and ash pond effluent) as cooling water in coal-based thermoelectric power generation. The study is assessing geographic proximity, pretreatment requirements, available quantities, and regulatory and permitting issues that are relevant for application of these impaired waters in a cooling system. In addition, key design and operating parameters that would ensure successful use of impaired waters without detrimental impact on the performance of the cooling system are being evaluated. Another important project objective is the development and demonstration of small pilot-scale cooling towers for side-by-side evaluation of the use of impaired waters under different operating conditions. The pilot-scale cooling towers have been built, deployed, and operated at the Franklin Township Municipal Sanitary Association located in Southwestern Pennsylvania, as pictured in Figure 5-2.
The pilot-scale towers were operated for two consecutive 25-day periods. During the first run, secondary treated effluent was fed to the pilot-scale cooling towers. During the second run, two of the towers were run with secondary treated effluent for additional testing while the third tower was run with a tertiary effluent (secondary effluent subjected to nitrification and granular media filtration) feed stream. Chemical treatment agents were added to the incoming waters to evaluate their impacts on cooling tower performance. These included scaling inhibitors polymaleic acid (PMA) and 2-phosphonobutane-1,2,4-tricarboxylic acid (PBTC), corrosion inhibitors tolyltriazole (TTA) and pyrophosphate (TKPP), and chlorine compounds (free chlorine and monochloramine) to combat biofouling. The target concentrations of chemical treatment agents used in the analyses are presented in Table 5-7.
Detailed information on tower operations during the runs was recorded. Solids deposition rates on stainless steel coupon surfaces, corrosion weight loss of metal alloys, and heterotrophic planktonic/sessile bacteria were documented during both runs. Numerous water chemistry parameters were monitored to obtain detailed understanding of the cooling tower behavior. It was documented that the towers were able to perform according to design specifications and adequately simulate the operation of full-scale cooling towers.
Table 5-6: Examples of Treatment Processes for Power Plant Cooling Water at Eight Specific Facilitiesa,32
Power Facility and Location
Average Cooling Water Supply and
Return Flow
Treatment Processes at Wastewater
Treatment Plant
Treatment of Cooling Water at
Power Plant
Lancaster County Resource Recovery Center, Marietta, PA
Supply = 0.65 MGD Return = 0 Zero discharge; all blowdown is evaporated or leaves plant as sludge.
Secondary treatment with alum, flocculation and polymer addition followed by settling and phosphorus removal
Clarification and addition of ferric sulfate, polymer, and sodium hypochlorite
PSE&G, Ridgefield, NJ Supply = 0.3 to 0.6 Secondary treatment Water chemistry is

27
Power Facility and Location
Average Cooling Water Supply and
Return Flow
Treatment Processes at Wastewater
Treatment Plant
Treatment of Cooling Water at
Power Plant
MGD. The blowdown is disposed of with plant wastewater to local sewer system.
controlled with biocide, neutralization, and surfactant
Hillsborough County Solid Waste to Energy Recovery Facility (operated by Ogden Martin Corp.) Tampa, FL
Supply – 0.7 MGD (includes some use for irrigation water). The blowdown of 0.093 MGD is mixed with plant wastewater and returned to the WWTP.
Advanced treatment with high-level disinfection. Partial tertiary treatment removes phosphorus.
Addition of chlorine, biocide, surfactant, trisodium, phosphate, and sulfuric acid
Nevada Power – Clark and Sunrise Stations, Las Vegas, NV
Supply = 2.72 MGD average to Clark Station Return = 0 Blowdown is discharged to holding ponds for evaporation.
Advanced secondary treatment with nitrification, dentrification, and biological phosphorus removal; tertiary treatment using dual-media filtration and disinfection with chlorine
None at present time; previously had been treated with lime and softener
Panda Brandywine, Brandywine, MD
Supply = 0.65 MGD Blowdown is returned to the WWTP.
Secondary treatment, biological nutrient removal, sand filters
Addition of corrosion inhibitors, sodium hypochlorite, acid, and antifoaming agents
Chevron Refineries, El Segundo and Richmond, CA
Supply = 3 to 5 MGD Return = 0
Tertiary treatment at both. El Segundo uses an ammonia stripping process; Richmond uses a caustic soda treatment process
Richmond plant uses a commercial chemical additive [chemistry no specified in EPAQ (2004)]
Curtis Stanton Energy Center, Orange County, FL
Supply = 10 MGD Return = 0 Blowdown is evaporated in concentrator and crystallizer units at the power plant.
Advanced wastewater treatment including filtration, disinfection, and biological nutrient removal.
Addition of acid, scale inhibitor, chlorine; control of calcium
Palo Verde Nuclear Plant, Phoenix, AX
Total supply to three units = 72 MGD Return = 0 All blowdown is evaporated in ponds.
Secondary treatment Tertiary treatment plant consisting of trickling filters for ammonia removal, clarification fro removal of phosphorus, magnesium, and silica; addition of dispersants, defoaming agents, and sodium.
a. The information included in this table is reproduced or paraphrased from an earlier study. The information may not match the more current data shown in the database in Appendix A.

28
Figure 5-2: Pilot Scale Cooling Towers in Operation at the Franklin Township Municipal Sanitary
Authority34

29
Table 5-7: Target Concentrations for Chemical Treatment Agents Chemical Treatment
Agent Tower A
Run 1 Tower B
Run 1 Tower C
Run 1 Tower A
Run 2 Tower B
Run 2 TTA 2 1 2 2 0 TKPP 10 0 10 0 0 PMA 10 0 20 10 0 PBTC 5 0 10 0 0 Free Chlorine 1~2 1~2 1~2 -- -- Monochloramine -- -- -- 2~3 2~3
In the analysis of impacts on scaling behavior, for the first run, both PMA and PBTC were added as scaling inhibitors. However, no PBTC was detected in the recirculating water, indicating that PBTC is not effectively maintained in the solution and cannot assist to prevent scaling. Scanning electron microscopy/energy dispersive spectrometry (SEM/EDS) analysis of the scales indicates the presence of both carbonate and phosphate-based solids. In addition, microorganisms were present in the solids due to inadequate biofouling control program in the first run. Only PMA was used in the second run (at the same concentrations), and reasonable scaling control was achieved because the biofouling control was also much more effective.
As indicated in Table 5-7, during the first run, biofouling was controlled by free chlorine levels targeted at 1 to 2 mg/L. The microbial activity in the cooling towers was above the desired level of 104 CFU/ml for planktonic heterotrophic bacteria (HPC) whenever the concentrations of chlorine plus monochloramine fell below 1 mg/L. Results from the second run show better control over microbial activity. In the second run, biofouling was controlled by monochloramine levels targeted at 2 to 3 mg/L, so excursions above the 104 CFU/ml value for HPC were much less common.
Overall, mild steel, copper, and copper-nickel showed acceptable corrosion rates in the pilot scale towers with or without corrosion inhibitor addition, as indicated in Table 5-8. The corrosion inhibitors TTA and TKPP did not appear to reduce corrosion rates or increase inhibition effectiveness, and scaling seemed to be primarily responsible for protection of the metal alloys. Higher monochloramine levels to prevent biofouling caused higher corrosion rates initially, but their influence was minimized after the scale layer grew thicker and protected the metal alloys. So, when treated municipal wastewater is used in cooling tower systems, it appears that corrosion effects should be considered only after scaling and biofouling controls are determined.

30
Table 5-8: Average Corrosion Rates (MPY) of Metal Alloys in Pilot Scale Cooling Towers
Metal Alloy
Tower A Run 1
Tower B Run 1
Tower C Run 1
Tower A Run 2
Tower B Run 2
Mild Steel (21-day avg.)
3.35 (fair)
3.51 (fair)
3.28 (fair)
4.78 (fair)
8.21 (poor)
Mild Steel (last 5 days
avg.)
1.99 (good)
0.37 (excellent)
3.24 (good)
2.45 (good)
3.51 (fair)
Aluminum (21-day avg.)
2.3, pitting (unacceptable)
1.74, pitting (unacceptable)
1.18, pitting (unacceptable)
6.86, pitting (unacceptable)
13.7, pitting (unacceptable)
Copper (21-day avg.)
ND (excellent)
ND (excellent)
0.03 (excellent)
0.11 (good)
0.08 (excellent)
Copper-nickel
(21-day avg.)
ND (excellent)
0.03 (excellent)
ND (excellent)
0.05 (excellent)
0.04 (excellent)
ND: non-detectable MPY: mils/year = thousandths of an inch/year Corrosion Criteria Mild steel piping: 0-1 (MPY) excellent; 1-3 good; 3-5 fair; 5-10 poor; >10 unacceptable Copper alloys: 0-0.1 excellent; 0.1-0.2 good; 0.2-0.3 fair; 0.3-0.5 poor; >0.5 unacceptable Pitting is not acceptable for all alloys
The recently initiated Carnegie Mellon University/University of Pittsburgh study35 builds on and extends the previous University of Pittsburgh/Carnegie Mellon University study34 described above. The overall objective of the new study is to evaluate the benefits and costs of implementing tertiary treatment of the municipal wastewater prior to use in recirculating cooling systems versus an expanded chemical regimen for managing the quality of the cooling water when secondary municipal wastewater is used as makeup. Specific objectives of this research are as follows:
Determine the benefits and costs of subjecting secondary treated municipal wastewater to additional treatment (to remove NH3 by nitrification, particulates by filtration and BOD by granular activated carbon adsorption or microfiltration) prior to use as cooling water makeup.
Determine different chemical treatment regimens required to manage cooling water quality for different levels of tertiary treatment ranging from no tertiary treatment to inclusion of nitrification, organic compound removal by adsorption, and filtration.
Perform comparative life cycle cost analyses for different levels of tertiary treatment versus the corresponding chemical treatment regimens.
Determine critical economic, technical, and social factors that need to be considered in comparative evaluation of tertiary treatment of makeup water versus cooling water chemistry control by chemical treatment (e.g., future changes in freshwater availability and cost; value of treated wastewater in the future; social support for water reuse efforts).

31
Summary
Reclaimed water (treated municipal wastewater) represents a valuable water resource that can be used for cooling and other purposes in electric power plants. It is widely available in communities throughout the United States in sufficient volumes and reliable enough to warrant consideration as power plant cooling water.
Because reclaimed water is treated municipal wastewater, it is subject to considerable regulation prior to use in a power plant setting. Based upon Federal regulations, all municipal wastewater must be treated to secondary standards before it can be released from a wastewater treatment facility. Some states require further treatment prior to reuse of the reclaimed water. The concern prompting further treatment is to minimize the exposure of workers and the public to microbial pathogens. Typically the regulated parameters include fecal coliform, BOD5, pH, residual chlorine, and TSS.
Beyond regulatory requirements, most reclaimed waters require some treatment prior to use as cooling waters in order to preclude operational issues within the power plant. Untreated reclaimed water could cause problems within the power plant related to scaling, corrosion, and biofouling. Usually this treatment is done onsite at the power plant, or the utility will pay the municipal treatment plant to perform supplemental treatment. These supplemental treatments can include chemical additions, coagulation, filtration, and clarification among others.
Reclaimed waters are already being used in more than 50 U.S. power plants. Most of the power plants currently using reclaimed water are in states with freshwater shortages such as Florida, California, Texas, and Arizona. However, 12 other states currently have facilities that use reclaimed water for cooling, including states that are typically thought to have abundant freshwater supplies. As competition increases for limited water resources in the future, reclaimed water may supply cooling water to additional electrical utilities.
Ongoing research is being conducted to evaluate the expanded use of reclaimed water in power plant settings. The University of Pittsburgh/Carnegie Mellon University study currently underway is considering factors such as geographic proximity, pretreatment requirements, available quantities, and regulatory and permitting issues that are relevant for application of these impaired waters in a cooling system. In addition, key design and operating parameters that would ensure successful use of reclaimed waters without detrimental impact on the performance of the cooling system are being evaluated. Another important project objective is the development and demonstration of small pilot-scale cooling towers for side-by-side evaluation of the use of impaired waters under different operating conditions. Initial testing of the performance of the pilot-scale cooling towers using municipal wastewater has produced promising results and offers the potential for testing a wide range of treatments to prevent scaling, corrosion, and biofouling.
References
32 EPA (U.S. Environmental Protection Agency), 2004. Guidelines for Water Reuse, EPA/625/R-04/108, U.S. Environmental Protection Agency and U.S. Agency for International Development. Available at : http://www.epa.gov/nrmrl/pubs/625r04108/625r04108.pdf. 33 J.A. Veil. Use of Reclaimed Water for Power Plant Cooling, ANL/EVS/R-07/3, August 2007.

32
34 R.D. Vidic and D. Dzombak. Reuse of Treated Internal or External Wastewaters in the Cooling Systems of Coal-based Thermoelectric Power Plants: Final Technical Report September 2009. http://www.netl.doe.gov/technologies/coalpower/ewr/water/pp-mgmt/pubs/06550/42722FSRFG063009.pdf 35 D. Dzombak R.D. Vidic and A.E. Landis. Use of Treated Municipal Wastewaters as Power Plant Cooling System Makeup Water: Tertiary Treatment versus Expanded Chemical Regimen for Recirculating Water Quality Management. Proposal submitted April 21, 2008.

33
6. Produced Waters from Oil and Gas Wells
This chapter covers Existing Plants Program-funded work on water produced from oil and gas wells. Although the flow rates for produced waters vary over the lifetime of a well, the water produced from oil and gas extraction activities is significant. In 2001, oil and gas wells in California produced 2.16 billion barrels of water.36 A low value from onshore oil wells across the Nation was estimated as 14 billion barrels of water per year, with an average water-to-oil ratio of 9.5. The EPRI work37 cites that seven states generated 90 percent of the produced water in the continental United States in 2002 and that 37 percent of the produced water sources in a USGS database have been deemed treatable (based on TDS less than 30,000 mg/L).
When CBM wells are drilled to reduce hydrostatic pressure on coal, groundwater is also withdrawn. In 2001, the average Powder River Basin well produced 7,400 gallons of water each day and 100,000 cubic feet of methane gas.36 Projecting 30,000 production wells across Wyoming, the produced water from these sources might be 250 million gallons per day. However, some detailed analyses estimate that water production from most CBM wells will drop rapidly and end in seven to 10 years.
This chapter reflects work that has been, or is currently being done, in several NETL studies, including:
“Use of Produced Water in Recirculating Cooling Systems at Power Generating Facilities,” (NT41906) led by EPRI at the San Juan Generating Station (SJGS) that examined treatment options for oil and gas well-produced waters.
“Reuse of Produced Water from CO2 Enhanced Oil Recovery, Coal-Bed Methane, and Mine Pool Water by Coal-Based Power Plants,” (NT0005343) conducted by the Illinois State Geological Survey (ISGS) that will characterize waters, determine treatments, and develop cost estimates within the Illinois Basin.
“Nanofiltration Treatment Options for Thermoelectric Power Plant Water Treatment Demands,” (FWP-08-014250) by Sandia National Laboratories (SNL) that will examine nanofiltration as an alternative to reverse osmosis (RO) for the treatment of non-traditional waters.
“Identification of Incentive Options to Encourage the Use of Produced Water, Coal Bed Methane Water, and Mine Pool Water,” by ANL that presents scenarios and possible government actions to encourage use of produced waters.
“An Innovative System for the Efficient and Effective Thermoelectric Treatment of Non-Traditional Waters for Reuse in Power Generation,” (NT42535) by Clemson University that tested how wetlands can treat produced waters.
In addition, Chapter 10 describes additional studies that deal with identifying these sources of water:
“Optimization of Cooling Water Resources for Power Generation,” (FT40320-01.24 and NT43291-05.1) conducted by the UND EERC, which is developing a GIS-based web application decision support system for North Dakota, South Dakota, Minnesota, and the North American Electric Reliability Council’s (NERC) Mid-Continent Area Power Pool (MAPP) region.

34
“Internet-Based, GIS Catalog of Non-Traditional Sources of Cooling Water for Use at America’s Coal-Fired Power Plants,” (NT0005957) conducted by Arthur Langus Layne, LLC that is building national geospatial databases related to non-traditional water sources within 10 miles of power plants and internet-based applications to access the information.
Enhanced oil recovery (EOR) and enhanced CBM recovery activities inject CO2 to extract additional fossil fuels and are generally conducted because of financial incentives for fuel recovery. In addition to fuel extraction, this activity sequesters CO2 in geologic formations, thereby reducing emissions to the atmosphere and helping to mitigate climate change. Chapter 8 considers the produced water resulting from geologic sequestration of CO2 in the Nation’s saline formations which offer substantially more CO2 storage capacity than that achieved via EOR.
Environmental Concerns for Untreated Waters
According to the Clemson study, the composition of the waters extracted from oil and gas wells often does not meet discharge standards. That study compared published literature concentrations for produced waters with the NPDES discharge limits (Table 6-1). The pH values for the produced waters ranged from 7.84 to 9.56.
Table 6-1: Composition of Produced Waters and NPDES Discharge Limits
38
Constituent Concentration Range
(mg/L) Minimum/Maximum
Discharge Limits (mg/L)
Chemical Oxygen Demand
11.2 – 45.8 170 – 292
Solids, Total Dissolved (TDS)
668 – 38,938 500
Solids, Total Suspended 24 – 101 30 – 70 Total Carbon 3.9 – 1077 5 Total Phosphorus 0 – 0.763 1 Total Sulfate <10 – 1100 Polyaromatic hydrocarbons
0 – 0.11 2.8 – 12.2
Naphthalenes 0 – 1.18 0.2 Phenols 0.15 – 21.5 Benzene 0.683 – 12.1 0.06 – 2.88 Toluene 1.01 – 19.8 0.028 – 5.0 C2-Benzene 0.05 – 3.7 Oil and grease 0 – 78 15 Aluminum 0.0015 – 0.473 Arsenic 0 – 51 Barium 0.23 – 17 154 Beryllium 0 – 0.001 Boron 0.019 – 28 Bromine 0.7 – 350 Cadmium 0 – 0.098 Calcium 1 – 818 Chloride 133 – 108,968 5000 Chromium 0 – 0.39 0.1 – 100 Cobalt 0.0009 – 0.058

35
Constituent Concentration Range
(mg/L) Minimum/Maximum
Discharge Limits (mg/L)
Copper 0 – 1.45 0.37 – 1.0 Gallium 0 – 0.003 Gold 0 – 0.095 Iodine 0 – 3.91 Iron 1.6 – 768 0.6 – 9.4 Lithium 0 – 64 Magnesium 0.6 – 3671 Manganese 0 – 15 1 – 4.4 Mercury 0 – 0.086 0.004 Molybdenum 0 – 0.003 Niobium 0 – 0.002 Nickel 0 – 1.7 2 Potassium 0.67 – 669 Rubidium 0 – 1.59 Ruthenium 0 – 0.018 Selenium 0 – 0.14 Silicon 0.05 – 2.9 Silver 0.012 – 0.15 Sodium 7 – 13,704 Strontium 0.65 – 917 Sulfur 0 – 1556 Tellurium 0 – 0.004 Tin 0 – 0.001 50 Titanium 0 – 4402 Uranium 0 – 0.018 Vanadium 0 – 1.1 Zinc 0.017 – 1.6 0.4 – 5.0
Table 6-1 shows that some larger concentrations (e.g., chlorides and TDS) exceed the discharge limits by more than an order of magnitude. Many of these concentrations also exceed toxicity thresholds set under the EPA water quality criteria and cannot be discharged without treatment.
Access and Collection
Investigators considered using existing pipelines and rights-of-way to transport the produced waters to SJGS.37 The abandoned Hart Canyon Line (previously an oil pipeline) and the abandoned CO2 Gas Line (previously used in a technique to displace methane from coal) were both identified as possible lines for future use, and an effective delivery system was designed (Figure 6-1) after considering several options. The Hart Canyon and CO2 Gas Lines would accept both direct injection into the pipelines and delivery by trucks at satellite collection stations. Discussions with the largest producer in the area suggested that the most practical scheme would be to tie these two lines together with a new extension line to the Collection Center.
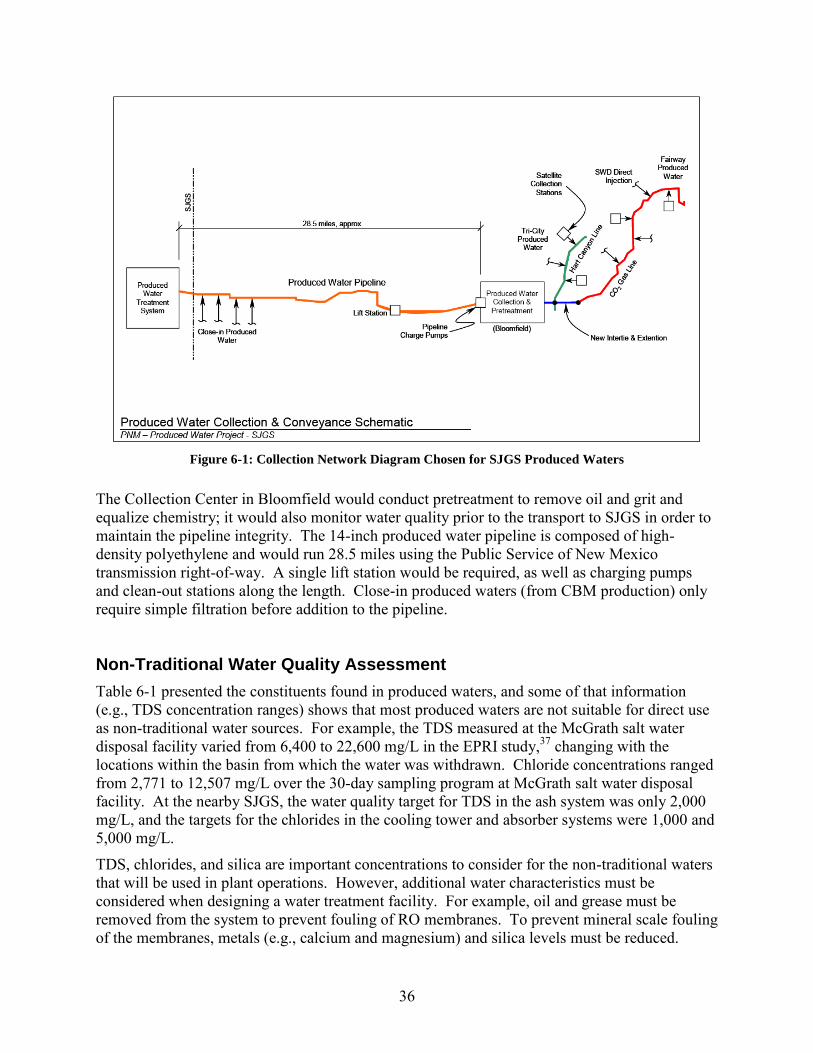
36
Figure 6-1: Collection Network Diagram Chosen for SJGS Produced Waters
The Collection Center in Bloomfield would conduct pretreatment to remove oil and grit and equalize chemistry; it would also monitor water quality prior to the transport to SJGS in order to maintain the pipeline integrity. The 14-inch produced water pipeline is composed of high-density polyethylene and would run 28.5 miles using the Public Service of New Mexico transmission right-of-way. A single lift station would be required, as well as charging pumps and clean-out stations along the length. Close-in produced waters (from CBM production) only require simple filtration before addition to the pipeline.
Non-Traditional Water Quality Assessment
Table 6-1 presented the constituents found in produced waters, and some of that information (e.g., TDS concentration ranges) shows that most produced waters are not suitable for direct use as non-traditional water sources. For example, the TDS measured at the McGrath salt water disposal facility varied from 6,400 to 22,600 mg/L in the EPRI study,37 changing with the locations within the basin from which the water was withdrawn. Chloride concentrations ranged from 2,771 to 12,507 mg/L over the 30-day sampling program at McGrath salt water disposal facility. At the nearby SJGS, the water quality target for TDS in the ash system was only 2,000 mg/L, and the targets for the chlorides in the cooling tower and absorber systems were 1,000 and 5,000 mg/L.
TDS, chlorides, and silica are important concentrations to consider for the non-traditional waters that will be used in plant operations. However, additional water characteristics must be considered when designing a water treatment facility. For example, oil and grease must be removed from the system to prevent fouling of RO membranes. To prevent mineral scale fouling of the membranes, metals (e.g., calcium and magnesium) and silica levels must be reduced.

37
Prevention of fouling by particulate matter, colloidal matter, and biological films are additional concerns based on the composition of the produced waters near SJGS. The study found that SO2 absorbers represented the least costly use for treated produced water at SJGS.
Produced waters from oil and gas wells (as well as CBM) usually have low concentrations of volatile organic compounds (VOC).37 Common chemicals in the VOC category (benzene, toluene, ethyl benzene, and xylene) are collectively referred to as BTEX.
Gillette and Veil36 report that radium may be a concern because many samples have average concentrations exceeding 50 picocuries per liter (pCi/L). Some sources report radium concentrations as high as 3,000 pCi/L, but U.S. nuclear facilities are limited to discharges of 60 pCi/L.
The ISGS project will investigate the produced water quantity and quality available in the Illinois Basin.39 The samples will be tested for pH, ionic strength, turbidity, TSS, TDS, total petroleum hydrocarbons, total organic carbon, total inorganic carbon, total nitrogen, metal ions, silica, boron, and selected anions (e.g., chloride, sulfate, carbonate, and bicarbonate).
Treatment Technology Descriptions
Four NETL studies have, or are, investigating treatment technologies and their effectiveness on produced waters. The EPRI work with RO systems, Sandia’s study with nanofiltration, and the ISGS project all aim to treat waters for use in power plants. The constructed wetlands study by Clemson University compared its results against discharge criteria.
The EPRI work investigated the use of both conventional RO and high-efficiency RO (HERO) in combination with brine concentrators (BCs).37 Investigators evaluated five treatment alternatives (conventional RO, HERO, BCs only, conventional RO with a BC, and HERO with the same BC). The HERO process with a BC acting on a blend of produced and purge waters was determined to be the most economically feasible approach. The HERO process pre-treats the water to remove scale-forming minerals (e.g., calcium) and other ions associated with high salinity (e.g., chloride). The subsequent BC separates the reject water from the HERO process into mineral-rich and mineral-lean streams. The recovered mineral-lean water from the BC and the HERO permeate would be fed to the cooling towers.
Like conventional RO techniques, the HERO process uses standard spiral-wound polyamide membranes. It differs from conventional techniques because it operates at high pH values (9.5-10.5) after pre-softening to remove hardness. At pH levels above 10, soluble silica (H4SiO4) dissociates and does not form scale on the membranes.
In addition, pretreatments will be necessary in order to ensure proper operation of RO systems. These include precipitation softening or scale inhibitors to prevent mineral scale from fouling membranes, filtration to remove particulate matter, periodic membrane cleaning with non-oxidizing biocides to remove biofilms, a combination of gravity separation, air flotation, and filtration to remove oil, and neutralization of charged colloidal matter with polymers. The high pH of the HERO system dissolves organic fouling and certain oil constituents to minimize fouling by these mechanisms. An illustration of the pretreatments and the HERO system is shown in Figure 6-2.37 Similarly, the conventional RO system involved pretreatment through softening (to reduce calcium, magnesium, barium, strontium, and dissolved iron), ultrafiltration

38
(to remove particulate matter and organic foulants), basket strainers (to protect the ultrafiltration device from particulate loading), sodium hypochlorite addition as a disinfectant to protect membranes, and a degasifier to remove CO2 after the pH is adjusted.
Following the exit from the HERO system, the RO reject stream would be sent to the BC for further water recovery under the most economical treatment alternative. The BC would operate in the unseeded mode at high pH (10-11), eliminating the need for acid, antiscalant, and calcium chloride.
Figure 6-2: Illustration of Pretreatments and HERO System for Produced Waters
37
RO processes represent a mature technology with a high salt rejection rate (greater than 95 percent). However, nanofiltration membranes require lower pressures to generate equivalent water fluxes at the expense of a lower salt rejection rate (roughly 85 percent). Nanofiltration has typically been used for water softening or the rejection of pathogens and high molecular weight compounds. However, SNL will investigate if TDS in a typical produced water can be reduced from 14,500 mg/L to 2,050 mg/L at a feed pressure of 256 pounds per square inch (psi).40 With the same feed, model calculations suggest that RO membranes would require 460 psi to lower the TDS from 14,500 to 580 mg/L.
The nanofiltration investigation aims to operate on waters with modest TDS (less than 5,000 mg/L) with very high recovery (roughly 90 percent) and will estimate the associated costs of operation. Nanofiltration techniques are more tolerant of fouling than RO and have a high reject

39
rate for divalent cations. The pilot study will be conducted using Dow Filmtec membranes at a ConocoPhillips CBM production site in the San Juan Basin of northwest New Mexico.
The Illinois Basin study will investigate combinations of conventional treatment techniques, as well as innovative water treatment concepts for treating EOR-produced waters.41 The conventional techniques include: gravimetric and de-oiling unit operations; filter media including sand, biomass, organoclay, and coal; precipitation and coagulation by adding lime, iron sulfide, and lime followed by iron sulfide; adsorption with granular activated carbon, ion exchange resins, and ion exchange clays; and membrane separation. The de-oiling and filter media processes will not be tested for those waters without oil products (e.g., CBM waters).
The Illinois Basin study will also consider innovative water treatment technologies being developed at the university, including: system-level integration of desalination, organic separation, and decontamination; catalytic destruction of oxyanions; and adsorbents and photocatalysts with high capacity to adsorb and transform organic and toxic compounds.
The constructed wetland treatment systems (CWTS) designed at Clemson University were tailored to meet the unique needs of the produced waters. In order to design effective sustainable systems, the produced waters were first divided into four categories based on the chloride concentrations:
Fresh (under 400 to 2,500 mg/L)
Brackish (2,500 to 15,000 mg/L)
Saline (15,000 to 40,000 mg/L)
Hyper Saline (over 40,000 mg/L)
Before introduction to the CWTS, the waters with chloride concentrations greater than 4,000 mg/L were pretreated in a saltwater wetlands system followed by passage through an RO system (Figure 6-3). The RO system was used to lower chloride and TDS concentrations so that levels would be tolerable for freshwater wetland and aquatic life.

40
Figure 6-3: Illustration of Constructed Wetlands Treatment System for Produced Waters
38
Water passed through four freshwater wetlands reactors, with a 24-hour residence time in each. The first two freshwater wetlands systems contained reducing hydrosoil (river sand hydrosoil and pine mulch) and California bulrush. The final two reactors contained oxidizing hydrosoil (quartz sand) and broadleaf cattail. Concentrations of six targeted pollutants (chlorides, cadmium, copper, lead, zinc, and oil/grease) were tracked through each reactor using simulated waters in each of the four saline categories.
The EPRI study also examined an emerging technology that could significantly reduce the level of oil and particulate matter through ceramic membrane filtration. A traditional difficulty with the use of ceramic membranes for produced waters had been sustaining flux while maintaining separation efficiency. Under previous work, CeraMem Corporation developed a proprietary ceramic membrane and cleaning technique to maintain process flux for several hundred hours between cleanings. Treating pre-filtered produced water with ceramic membranes might eliminate the need for ultrafiltration or RO cartridge filtration.
Performance Goals
Two NETL studies are beginning to investigate the effectiveness of treatment technologies for produced waters. Sandia’s study with nanofiltration and the ISGS project to treat waters from the Illinois Basin have each set performance goals to treat the waters so that they can be used at power plants.

41
The Illinois Basin study will consider options to treat EOR-produced waters at four levels for: (1) coal slurry preparation in an integrated gasification combined cycle (IGCC), (2) FGD makeup water in pulverized coal (PC) plants, (3) cooling tower makeup water in PC and IGCC, and (4) boiler feedwater in PC and IGCC. The appropriate levels will be determined as one of the early tasks in the investigation before treatment technologies are chosen.
The Illinois Basin treatment technologies will focus on separating sand/grit and oil; removing extremely small oil droplets and precipitates; removing dissolved organic and inorganic compounds through precipitation, adsorption, and membrane separation; and destroying oxyanions. Therefore, the performance metrics should focus on reductions in these measurements.
The nanofiltration study is conducting a pilot test at the ConocoPhillips CBM production site followed by pilot testing at an existing cooling tower system located at SNL. Sandia will test and gather operational data for the nanofiltration technology at the ConocoPhillips site to compare against the model calculations (reducing TDS from 14,500 to 2,050 mg/L at a feed pressure of 256 psi). Instead of investigating treatment of produced waters, the upcoming pilot work at SNL will focus on nanofiltration as a method to reduce the concentration of dissolved solids in the recirculating stream for the cooling tower.
The goals of the wetland treatment study and the EPRI study are discussed in the section below along with their performance results.
Performance Results
The constructed wetland treatment study employed four simulated produced waters (fresh, brackish, saline, and hyper-saline) and measured toxicity, chlorides, cadmium, copper, lead, zinc, and oil/grease. In addition, the study used the Puckorius Scaling Index (PSI) to rate the potential for the waters to form chemical scale and/or cause corrosion. The PSI values of the four simulated produced waters were all in the “Intolerable Corrosion” range, but after CWTS treatment the ratings were reduced to “Heavy Corrosion.”
All of the inflow waters were toxic using C. dubia in seven-day static renewal toxicity tests. The output waters from the treated fresh, saline, and hyper-saline waters resulted in no mortality or reproductive effects, but the output from the brackish water treatment impaired reproductive processes. The investigators speculated that the poor performance for the brackish water might be attributed to the lack of maturity of the CWTS and relatively high initial loading of constituents of concern.
Most of the cadmium, lead, and zinc were removed in the first two reactors. Although the saltwater wetland module was designed to remove residual organics, it also effectively removed metals from the stream. Overall, the removal rates ranged from 38 to 99.6 percent for cadmium, 91 to 99.8 percent for copper, 93 to 99.3 percent for lead, and 40 to 99.8 percent for zinc. The removal performance was lowest for the brackish waters. The inlet streams contained 1.5 mg/L of total petroleum hydrocarbons (TPH) as diesel fuel (measure of oil/grease), but no TPH was detected in the outlet streams beyond the oil/water separator. The investigators concluded that produced waters could be reused as service water if the pretreatment technologies sufficiently reduced the chloride concentrations.

42
The EPRI study evaluated the costs of different alternatives and concluded that the treatment of a produced water/purge water blend with the HERO+BC system would have a net cost of $4.52 per thousand gallons, considerably lower than the other systems considered for SJGS. The study also showed that pretreatment was critical to prevent membrane fouling. The HERO+BC system had the lowest capital cost ($14.1 million) and operating cost ($2.98 million per year) but would require the highest power (1,915 kW).
In evaluation of the CeraMem membrane filtration as a pretreatment, six runs were conducted with Teflon and silica membrane materials. The addition of surfactant dramatically improved the flux stability while providing low TSS in the permeate. The ceramic membrane system was estimated to cost $3.9 million installed and have a unit operating cost of $0.051 per barrel ($1.62 per kgal).
In terms of plant usage, the HERO permeate could all be used in the SJGS SO2 absorbers, but the purge water rate would have to increase slightly to compensate for the increased chloride levels. To reduce costs further, HERO permeate could be fed to both the absorbers and the ash system.
The EPRI study also examined cost estimates for plant examples in other parts of the Nation. A Southwest coal-fired power plant located 7.5 miles from conventional oil production had installed costs of $37.2 million and operating costs ranging from $0.128 to $0.426 per barrel ($4.06 to $13.52 per kgal). A coal-fired power plant in a Rocky Mountain state located 2.5 miles from CBM production would have total installed costs of $15 million and operating costs ranging from $0.169 to $0.371 per barrel ($5.37 to $11.78 per kgal).
Other Issues
Gillette and Veil36 examined the non-technical issues associated with the use of produced waters. They noted that ownership of produced waters is one critical issue that water policy and law have not yet addressed. It is not clear whether ownership falls to the oil, coal, or gas producer or to the landowner, state, or another entity.
A New Mexico law was signed in March 2004 that allowed SJGS to treat and utilize produced water as process water within the SJGS boundaries.37 The law was written in a manner that the New Mexico Oil Conservation Division would consider the water as being disposed of at the electric generating facilities, thereby exempting it from other environmental regulations administered by the Office of the State Engineer.
Gillette and Veil listed possible incentives for using produced waters such as direct grants, tax/royalty subsidies or reductions, reduced water costs to the user, assured markets, and regulatory relief. They then constructed 12 scenarios for produced waters and presented examples of such incentives. Those scenarios would be examined in a further study to assess both quantitative and qualitative metrics for potential incentives.
Federal actions include a recent bill that has passed the U.S. House of Representatives. The Produced Water Act of 2009 appropriates 20 million dollars for the research, development, and demonstration of technologies for environmentally sustainable utilization of produced waters.

43
Summary
Produced waters from oil and gas wells, as well as enhanced CBM recovery activities, represent a significant volume of available water that may be transported to nearby power plants. The produced waters generally exceed discharge limits because chloride and TDS concentrations are high.
Chloride and TDS levels generally prevent untreated use of the waters in any power plant operations as a non-traditional water source. However, several studies have, and are, investigating treatment options and possible uses for these waters. The HERO system (with necessary pretreatments) has been coupled with BCs to achieve a cost of $4.52 per thousand gallons, considerably lower than conventional RO processes. The analysis showed that this stream could be fed to both the SO2 absorbers and the ash system.
Clemson University investigated the use of CWTS to treat produced waters falling into four different salinity classes. Constructed saltwater wetland systems were necessary with RO membrane pretreatment for the more saline produced waters. Four freshwater reactors with reducing and oxidizing components followed the pretreatment. All of the input streams exceeded toxicity criteria, but the outflow streams generally did not. The oil and grease, cadmium, copper, lead, and zinc removal rates were high, and the investigators concluded that produced waters could be reused as service water if the pretreatment technologies sufficiently reduced the chloride concentrations.
An additional study is being done with nanofiltration techniques as a low-pressure alternative to RO. Investigators are also considering potential treatment technologies for produced waters in the Illinois Basin.
Some regulatory issues also need to be addressed if produced waters are to be considered for use at power plants. Ownership of the water is one key issue, but policy makers also need to investigate methods to allow designations of these waters for beneficial purposes.
References 36 J.L. Gillette and J.A. Veil. Identification of Incentive Options to Encourage the Use of Produced Water, Coal Bed Methane Water, and Mine Pool Water. September 2004. 37 Zammit, Kent. Semi-Annual Technical Progress Report October 1, 2005 to March 31, 2006: Use of Produced Water in Recirculating Cooling Systems at Power Generating Facilities. Deliverable Number 11 for DOE Award No. 41906. 38 J.H. Rodgers et al. An Innovative System for the Efficient and Effective Treatment of Non-traditional Waters for Reuse in Thermoelectric Power Generation. Fifth Quarterly Progress Report for DOE Award DE-FG26-05NT42535. January 2007. 39 Notice of Financial Assistance Award. Project Title: Reuse of Produced Water from CO2 Enhanced Oil Recovery, Coal-Bed Methane, and Mine Pool Waster by Coal-Based Power Plants. (NT0005343). September 2008. 40 Sandia National Laboratories. Work statement on Nanofiltration Treatment Options project. 41 University of Illinois. Statement of Project Objectives. DE-NT0005343.

44
7. Mine Pool Waters
This chapter covers Existing Plants Program-funded work on the use of mine pool waters. The term mine pool has typically been used to characterize a volume of ground water that has accumulated in an underground mine after operations in the mine have ceased. This volume, in some cases, represents the volume of a single mine, but in many cases, it may represent the combined volume of several mines, or a mine complex.42 Most of the research efforts to date have focused on mine pools in Pennsylvania and West Virginia, but the concepts and principles are applicable to mining areas and operations across the country.
There have been two general areas of focus for the use of mine pool waters. One has been the use of mine pool waters as an alternative source for coal-fired power plant cooling processes. Mine pool waters offer the potential to improve the efficiency of the cooling process due to their cool, constant water temperatures (~50°F). The other area of focus has been the potential use of the underground mines themselves as wide area heat sinks.
This chapter reflects work that has been, or is currently being done, in several NETL studies, including:
“Reuse of Treated Internal or External Wastewaters in the Cooling Systems of Coal-based Thermoelectric Power Plants,” (NT42722) conducted by the University of Pittsburgh and Carnegie Mellon University to assess the potential of using three different impaired waters (secondary treated municipal wastewater, passively treated coal mine drainage, and ash pond effluent) as cooling water in coal-based thermoelectric power generation.
“Development and Demonstration of a Modeling Framework for Assessing the Efficacy of Using Mine Water for Thermoelectric Power Generation,” (NT42723) conducted by the National Mine Land Reclamation Center (NMLRC) of West Virginia University that will evaluate the quantity and quality of water associated with mine water drainage to meet cooling requirements at a proposed power plant.
“Strategies for Cooling Electric Generating Facilities Using Mine Water: Technical and Economic Feasibility,” (NT41908) by West Virginia University that identified cost saving alternatives to current coal-fired power plant cooling processes.
“Identification of Incentive Options to Encourage the Use of Produced Water, Coal Bed Methane Water, and Mine Pool Water,” by ANL that presents scenarios and possible government actions to encourage use of produced waters.
“Use of Mine Pool Water for Power Plant Cooling” by ANL that provides preliminary information about the opportunity to use mine pool waters for cooling and process waters in electric generating facilities.
In addition, Chapter 10 describes an additional study that deals with identifying these sources of water:
“Internet-Based, GIS Catalog of Non-Traditional Sources of Cooling Water for Use at America’s Coal-Fired Power Plants,” (NT0005957) conducted by Arthur Langus Layne, LLC that is building national geospatial databases related to non-traditional water sources within 10 miles of power plants and internet-based applications to access the information.

45
Resource Characterization
As noted above, the research on the use of mine pool waters has focused on resources in Pennsylvania and West Virginia. Thus, the discussion here will focus on these two states, although states with underground mining operations throughout the Appalachians, the Illinois basin, and even in the West (e.g., Utah) can benefit from this research.
There are two geographically distinct coal mining regions in Pennsylvania. Anthracite coal was mined in the north-central/northeastern part of the state, and bituminous coal is mined in the western portion of the state. Coalbeds lie beneath approximately 15,000 square miles in Pennsylvania. In West Virginia, bituminous coal is mined from approximately 17,000 square miles of land in the northern, western, and southern parts of the state. Figure 7-1 shows the locations of coal resources in both states.38
Figure 7-1: Distribution of Coal Resources in Pennsylvania and West Virginia
42

46
Comprehensive inventories of mine pools or mine pool complexes do not exist for either Pennsylvania or West Virginia. Some data has been generated on specific coal fields in the anthracite region of Pennsylvania. In addition, some evaluations of individual mines in the bituminous regions of each state have been conducted. In spite of the lack of comprehensive inventories, sufficient data do exist to allow for estimates of the potential for using mine pool water from specific mines/areas as cooling water at power plants.42
For example, a study mapping the mines and mine pools of the Pittsburgh coal seam in western Pennsylvania and northern West Virginia has estimated that the combined storage volume of the 130 mines mapped to date is 250 billion gallons. Another study of selected mines in the Western Middle Anthracite Coal Field estimated the water volume for these mine pools at over 47 billion gallons. In yet another study of mines in the Pittsburgh coal seam, water volumes associated with just eight mines were estimated at nearly 55 billion gallons.43 These volumes could serve as significant water resources.
Having established that the total volume of mine pool waters is substantial, the next question becomes whether the water yield from the mine pools could be sustained at an adequate rate and over a long enough time frame to serve as a reliable cooling water source for a power plant. If water is withdrawn at a rate significantly higher than the rate of ground water recharge to a mine pool, even with a large initial volume, the ability of a mine pool to supply cooling water over a long time period might be jeopardized. One indicator of the potential rate of ground water recharge to a mine pool is the rate of discharge of a mine outfall. Cravotta et al (1999)44 measured several outfalls at both anthracite and bituminous sites in Pennsylvania. Table 7-1 lists measured discharge volumes from several of the largest outfalls. As indicated, the discharge volumes range from 450 to 35,000 gpm. Closed cycle cooling requires 4,000 to 6,000 gpm for a 400-MW plant; thus, six of the listed discharges could sustainably supply all of the cooling water needs for a plant of this capacity.
Table 7-1: Selected Mine Discharges from the Anthracite and Bituminous Coal Fields of Pennsylvania
42
Coal Type Site Discharge
Volume (ft3/s) Discharge
Volume (gpm) Anthracite Truesdale #2 5 2,240 Anthracite Bell Water Level Tunnel 22 9,800 Anthracite Big Mountain Mine 1 450 Anthracite Derringer Tunnel 13 5,800 Anthracite Gravity Slope 11 4,900 Anthracite Jeddo Mine Tunnel 78 35,000 Anthracite Jermyn Outfall 34 15,000 Anthracite Old Forge Borehole 78 35,000 Bituminous S Wilkes Barre Boreholes 32 14,000 Bituminous Gillespie Run (05) 5 2,240 Bituminous N. Branch Plum Creek (06) 2 900 Bituminous Berwind Mine (018) 6 2,700 Bituminous Little Conemaugh (019) 4 1,800 Bituminous Browns Run (025) 7 3,100 Bituminous Sewickley Creek (084) 6 2,700 Bituminous Tinkers Run (091) 10 4,500

47
Water Quality
Cravotta et al. (1999)40 observed that mine pool water in Pennsylvania and West Virginia exhibits a bimodal frequency distribution of pH with two peaks of pH in the range of 2.5 to 4 (acidic) and 6 to 7 (near neutral), as indicated in Figure 7-2. In addition, mine pool water will also have elevated levels of TDS, iron, aluminum, sulfate, and other dissolved metal ions.
Figure 7-2: Frequency Distribution of the pH of Coal Mine Discharges in Pennsylvania
A) Data for 252 coal mine discharges in the anthracite coal field. B) Data for 793 coal mine discharges in the bituminous coal field [Source Cravotta et al. (1999)].40
Mine pool water becomes acidic from the reaction of oxygen and water with iron-sulfide-bearing minerals found in the coal, such as pyrite (FeS2). Near-neutral pH mine pool water results from the buffering of mine pool water with calcareous minerals, such as calcite (CaCO3). There are many factors that affect the chemistry (pH, acidity, metals concentration) of mine pool water, including:
Mineralogy of the coals and overburden.
Quantity of water flowing through the mine.
Residence time, path length, and depth of water circulation through the mine.
Availability of oxygen in mine water.

48
Mine design (e.g., up-dip versus down-dip).
Active pumping, either within the mine or within the influence of adjacent mines.
Exposed surface of sulfide minerals.
Presence or absence of calcite minerals.42
Viability for Use
In light of the elevated levels of TDS (from 200 to more than 10,000 mg/L), hardness, and the variable nature of pH, mine pool water will have to be treated to some degree prior to use in a power plant cooling water system in all but the most unusual conditions. Treatment technologies for pH adjustment, removal of TDS, dissolved metal ions, and other constituents found in mine pool water are available.
An example of a treatment system of mine pool water that might be used for a closed-cycle cooling system makeup includes the following process units:
Clarification to remove suspended solids.
pH adjustment, horizontal precipitator, coagulation, and flocculation for metals removal.
Multimedia filtration, ion exchange, and carbon adsorption if necessary to remove low TDS.
Any water that will be used for boiler feed water will require additional treatment. The following additional treatment units can produce high-quality boiler feed water:
Cartridge filter units for additional sub-micron particle removal.
RO and/or ion exchange for additional polishing.42 Specific treatment technologies for impaired waters are discussed in other chapters. The focus of studies on the use of mine pool waters in power plant cooling and operations is more closely related to evaluation of the physical feasibility of using this resource and developing methodologies to determine the level of treatment required to effectively use mine pool waters. Efforts in these areas are described below.
Two NETL studies are evaluating the viability of using mine pool water for cooling in coal-fired power plants. Both the University of Pittsburgh/Carnegie Mellon University study and the NMLRC/West Virginia University study are evaluating the impacts of geographic proximity and other physical characteristics on mine pool water viability. The University of Pittsburgh/Carnegie Mellon University study is also developing pilot-scale testing capabilities, while the NMLRC/West Virginia University study includes a computer-aided design component.
The overall objective of the University of Pittsburgh/Carnegie Mellon University study45,46 is to assess the potential of using three different impaired waters (secondary treated municipal wastewater, passively treated coal mine drainage, and ash pond effluent) as cooling water in coal-based thermoelectric power generation. The study will assess geographic proximity, pretreatment requirements, available quantities, and regulatory and permitting issues that are relevant for application of these impaired waters in a cooling system. In addition, key design and operating parameters that would ensure successful use of mine pool waters without detrimental impact on the performance of the cooling system will be evaluated. Another important project

49
objective is the development and demonstration of small pilot-scale cooling towers for side-by-side evaluation of the use of impaired waters under different operating conditions. The pilot-scale cooling towers have been built and are pictured in Figure 7-3.45
In anticipation of the use of the pilot-scale towers with mine pool waters, preliminary bench testing of acid mine drainage (AMD) collected from a mine in western Pennsylvania revealed that this water could be suitable for use in cooling towers with the addition of 15 parts per millions (ppm) of PMA, 2 ppm of TTA, and 1 ppm of monochloramine to control scaling, corrosion, and biofouling, respectively.45
Following the bench-scale testing, the pilot-scale cooling towers were operated for 25 consecutive days using AMD from the same location as the bench-scale testing. Data recorded included water temperature at specific locations, airflow rate in the cooling tower, the conductivity of makeup and bulk water, makeup water volume, blowdown volume, water flowrate, and ambient conditions (weather, temperature, relative humidity).46
The impact of PMA on scaling was evaluated in one analysis. PMA was added to two towers at concentrations of 15 and 25 ppm. Scaling behavior was monitored based on mass gain of stainless steel coupons. This analysis generated counterintuitive observations in that higher concentrations of PMA resulted in more deposition on steel coupons. This behavior was explained by the observation that significant quantities of solids precipitated on the packing in the control tower (which did not receive any antiscalant material) and that the turbidity of the recirculating water in the control tower was close to that of the makeup water. These findings suggest that the solids formed in the control tower were easily separated from the liquid phase and removed from the system. This was evidenced by the significant mass of solids that accumulated in the bottom sump of the control tower. However, the presence of PMA in the test towers resulted in relatively high levels of suspended solids that were maintained in solution and given a chance to precipitate on the sampling coupons. Overall, PMA was not very effective at keeping the high dissolved solids of AMD in solution under the pilot testing conditions. The solids content of the AMD water at four cycles of concentration was very high, and inhibition of precipitation by PMA proved to be difficult.46
Corrosion of metal alloys in the pilot-scale cooling towers was monitored through weight loss measurement. The two test towers were operated with the addition of phosphate (target of 5 ppm) and 2 ppm of TTA. Study results indicated that aluminum is not a suitable material for cooling water systems using AMD as makeup water due to severe pitting corrosion. Mild steel and copper corrosion were successfully inhibited by the presence of TTA. Copper-nickel exhibited little corrosion with or without the presence of TTA. Phosphate-based inhibitors are not suitable for use in this system due to their low solubility in the recirculating cooling water.46
Biofouling and bioactivity were controlled by adding 1 to 2 ppm chloramine as Cl2 to each test tower. The chloramine was added into the system continuously from a stock solution. Experimental results showed that the continuous chloramine concentration used achieved very good control of both planktonic and sessile heterotrophic bacteria in the system, and that the common control objective for biofouling (104 CFU/mL) can be easily accomplished under test conditions.46

50
Figure 7-3: Pilot Scale Cooling Towers
45

51
The NMLRC/West Virginia University study47 is identifying mine water sources and quantifying the volume and water quality of mine water with the goal of determining whether it can be used for cooling at a specific power plant. Based upon preliminary analyses, there appears to be sufficient water available (3,000 gpm) from underground mines to meet the water needs of the proposed Beech Hollow power plant, a 300-MW facility burning waste coal. About half of this water need may be available in the Raccoon Creek watershed, including several creeks that are fed by mine discharges. Use of this water by the power plant would have a major impact on the restoration of Raccoon Creek between the JB-1 discharge (just under five miles southwest of the power plant site) and the Ohio River. Additional mine water is available in the Robinson Run and North Branch Robinson Run watersheds. These two tributaries to Chartiers Creek are severely impacted by AMD. Diversion of water to the power plant in these watersheds will reduce, but not eliminate, the acid load of the receiving streams. This illustrates a potentially important benefit associated with using mine drainage water in a power plant setting. If these impaired waters are diverted for beneficial use, treated, and then returned to surface or ground water, the negative impacts that could occur if the drainage waters flowed directly into surface waters can be avoided. A map showing the mine discharge locations relative to the power plant is presented in Figure 7-4.42
The wide distribution and generally small size of the mine discharges in the vicinity of the power plant will adversely affect the economics of complete mine water use at this site. However, this distribution will present a robust basis for developing the computer-based design aid that is one of the project deliverables. The design aid consists of an interactive Microsoft Excel spreadsheet with Visual Basic macros. Initial work on the design aid has focused on the design of the water piping system needed to transport the water from the mine discharge to the water treatment plant or power plant. Data analysis includes the length of pipe, static and dynamic head, pipe diameter, pipe cost, pump horsepower requirements, operations and maintenance (O&M) cost, and water temperature changes resulting from buried pipe flow.47
While most of the alternatives involved using mine water in cooling towers, the West Virginia University study cited above also looked at the ability of abandoned coal mines to serve as a heat sink.43 Under this scenario, cool water is extracted from a specific mine, run through the power plant, and then warm water is re-injected into the same mine or an adjacent mine. Flow and thermal modeling is required to establish design parameters for this type of cooling. Thermal modeling establishes the area of the mine needed to achieve the required cooling, while flow modeling produces average mine residence times that must be known to assure cooling performance. Two specific scenarios were evaluated and compared to a base case that assumed cooling water was supplied from a conventional source (e.g., surface water). The first scenario involved injecting hot water from the power plant into one mine and extracting cooled water from an adjacent mine. The median underground travel time between mines was approximately 206 days. The capital cost associated with this scenario was 75 percent of the base case due to elimination of the cooling tower. However, operating costs were 119 percent of the base case due to increased water pumping and treatment requirements. The overall cost-effectiveness of this scenario will be site-specific. A second scenario involved multiple extraction and injection steps to try to use cooler water in the power plant. This involved injecting hot water from the power plant into one mine, extracting the cooled water from an adjacent mine, reinjecting the cooled water into a third mine, and extracting the cooler water from the upper part of the third mine. This scenario had capital cost that were 80 percent of the base case with operating costs that were 193 percent of the base case.45

52
Figure 7-4: Mine Discharges in the Vicinity of the Proposed Beech Hollow Power Plant
47
Other Issues
Gillette and Veil48 examined the non-technical issues associated with the use of mine pool water. They noted that there are technical, economic, legal, regulatory, environmental, and public perception issues that must be identified and resolved. Specifically, they noted that regulatory and legal issues must be resolved to make widespread use of mine pool water resources feasible. Any company using mine pool water would need to meet the provisions of their NPDES permits, as well as any other discharge requirements that might be imposed at any level of government. Measures needed to meet regulatory requirements on water discharge and their associated costs

53
are perhaps the leading barriers to wider use of mine pool water. Many regulatory agencies at all levels of government have not traditionally addressed these waters in a way that reflects their potential use as a valuable resource.48
Technical issues to be resolved include methods of effectively collecting, treating, and distributing the water and its long-term sustainability. The issue of subsidence following the withdrawal of mine pool waters could also be an important consideration.48
While each of these issues represents a potential barrier to developing mine pool water resources, the cost of using these waters is considered the greatest general barrier that must be overcome. It is also the barrier against which government incentives are likely to be most effective. The overall cost of using mine pool water includes the following components:
Collection – Mine pool waters might need to be collected from a variety of locations in order to meet volumetric rate requirements.
Treatment – The water may require treatment to prevent scaling or corrosion problems.
Transportation/Distribution – Depending on the relative locations of the source, use, and discharge, there may be costs associated with transporting and/or distributing mine pool water.
Disposal/Discharge – Costs may be incurred depending on the use of the water and the physical conditions with respect to discharge points (rivers, lakes, ground water).48
Gillette and Veil listed possible incentives for using mine pool waters such as direct grants, tax/royalty subsidies or reductions, reduced water costs to the user, assured markets, and regulatory relief. They then constructed six scenarios for mine pool waters and presented examples of such incentives. Those scenarios would be examined in a further study to assess both quantitative and qualitative metrics for potential incentives.48
Yet another issue related to the use of mine pool waters was addressed by Watzlaf and Ackman (2006). They point out that use of mine pool water in geothermal heat pumps could be an extremely cost-effective method to provide residential and/or industrial heating and cooling. This is particularly true where the mine water is already being pumped and treated. Operational costs are much lower than conventional heating and cooling. Costs per unit of heat are only 33 percent, 34 percent, and 21 percent of the costs associated with using fuel oil, natural gas, or propane, respectively, for heating and cooling. They point out that the amount of water currently being discharged for mines in the Pittsburgh coal seam could potentially be used to heat and cool up to 3.74 million square meters of interior space, roughly equivalent to 20,000 homes.49 This type of system has been deployed successfully at abandoned mine sites in Canada, the United States, and Europe.49
Summary
Mine pool waters represent a significant volume of available water that may be transported to nearby power plants for use in cooling systems. While the volume of mine pool waters is large, there are questions about the sustainability of these waters as supplies to cooling water systems. However, studies have shown that there are indeed mine pools that can provide sustainable

54
waters to power plants and supplement other water supplies. Mine pool waters are generally low in pH and have high TDS, so they likely require treatment prior to use in cooling systems.
The University of Pittsburgh/Carnegie Mellon University study currently underway is considering factors such as geographic proximity, pretreatment requirements, available quantities, and regulatory and permitting issues that are relevant for application of these impaired waters in a cooling system. In addition, key design and operating parameters that would ensure successful use of mine pool waters without detrimental impact on the performance of the cooling system will be evaluated. Another important project objective is the development and demonstration of small, pilot-scale cooling towers for side-by-side evaluation of the use of impaired waters under different operating conditions.
Testing conducted to date in these pilot-scale cooling towers indicates that using AMD as makeup water leads to scaling issues that are not ameliorated by the addition of PMA. Corrosion analysis indicated that aluminum should not be used in the presence of AMD, but that mild steel and copper corrosion is inhibited by the presence of TTA, and copper-nickel corrosion is minimal with or without TTA. Biofouling was effectively controlled by chloramine treatment.
The NMLRC of West Virginia University is identifying mine pool water sources and quantifying the volume and water quality of mine water with the goal of determining whether it can be used for cooling water at the proposed Beach Hollow power plant. Mine drainages from several mines surrounding the power plant site have been evaluated in terms of both flow rates and water quality to determine their viability for use in the plant. One of the positive outcomes of using the mine drainage water in the power plant is that impaired water that is currently having negative impacts on local streams would be diverted from those surface waters, improving their water quality. Another product of this project is the development of a computerized design tool that can be used to evaluate the viability of using mine pool water for cooling in other specific applications.
A second West Virginia University study has evaluated the use of abandoned coal mines as a wide area heat sink. This involves extraction of cool water from a specific mine that is used for power plant cooling and then the warmed water is re-injected into the same mine or an adjacent mine. Flow and thermal modeling is required to establish design parameters for this type of cooling. Based upon two scenarios evaluated, capital costs are lower for this type of operation than more traditional cooling methods, but operating costs are higher.
Some regulatory issues also need to be addressed if mine pool waters are to be considered for use at power plants. Regulatory agencies at all levels of government have not traditionally addressed these waters in a way that reflects their potential use as a valuable resource. The government could play a key role in the future use of these resources through incentive programs that reduce the cost and associated risks inherent in using these non-traditional waters.
Finally, the use of mine pool waters in geothermal heat pumps could be a cost-effective method to provide residential and/or industrial heating and cooling. Costs associated with geothermal heating and cooling are significantly lower than those associated with conventional methods of heating and cooling (e.g., natural gas and fuel oil). Analyses indicate that water currently being discharged just by the Pittsburgh coal seam could be used to heat and cool up to 20,000 homes.

55
References
42 J.A. Veil, J.M. Kupar, and M.G. Puder. Use of Mine Pool Water for Power Plant Cooling. September 2003. 43 West Virginia University. Strategies for Cooling Electric Generating Facilities Utilizing Mine Water: Technical and Economic Feasibility. 44 C.A. Cravotta, K..B.C. Brady, A.W. Rose, and J.B. Douds. Frequency Distribution of the pH of Coal Mine Drainage in Pennsylvania. In D.W. Morganwalp and Buxton, eds. U.S. Geological Survey Toxic Substances Hydrology Program – Proceedings of the Technical Meeting, Charleston, South Carolina, March 8-12, 1999. U.S. Geological Survey Water Resources Investigations Report 99-4018A. 45 R.D. Vidic and D. Dzombak. Reuse of Treated Internal or External Wastewaters in the Cooling Systems of Coal-based Thermoelectric Power Plants. April 1, 2008 – June 30, 2008. 46 R.D. Vidic and D. Dzombak. Reuse of Treated Internal or External Wastewaters in the Cooling Systems of Coal-based Thermoelectric Power Plants: Final Technical Report September 2009. http://www.netl.doe.gov/technologies/coalpower/ewr/water/pp-mgmt/pubs/06550/42722FSRFG063009.pdf. 47 P. Ziemkiewicz, R. Herd, and B. Leavitt. Development and Demonstration of a Modeling Framework for Assessing the Efficacy of Using Mine Water for Thermoelectric Power Generation. January 2007. 48 J.L. Gillette and J.A. Veil. Identification of Incentive Options to Encourage the Use of Produced Water, Coal Bed Methane Water, and Mine Pool Water. September 2004. 49 G.R. Watzlaf and T.E. Ackman. Underground Mine Water for Heating and Cooling Using Geothermal Heat Pump Systems. Technical Communication, 2006.
56
8. Produced Water from Carbon Dioxide Storage in Saline Formations
This chapter covers Existing Plants Program-funded work on water produced from saline geologic formations when CO2 is sequestered (stored) in these formations thousands of feet below the surface. Geologic sequestration is an option that would reduce CO2 emissions to the atmosphere and help mitigate climate change. Chapter 6 considers the produced water resulting from geologic sequestration in fossil fuel beds for the purposes of recovering oil and gas, but the Nation’s saline formations offer substantially more CO2 storage capacity than the fossil fuel beds.
This chapter reflects work that has been, or is currently being done, in several different NETL studies, including:
“Use of Produced Water in Recirculating Cooling Systems at Power Generating Facilities,” (NT41906) led by EPRI at the SJGS that examined treatment options for oil and gas well produced waters.
Year I of “Study of the Use of Saline Aquifers for Combined Thermoelectric Power Plant Water Needs and Carbon Sequestration at a Regional Scale,” (07-013812) completed by SNL in June 2008 that considered the geochemistry of saline formations and developed cost estimates for providing cooling tower makeup water.
Year II of “Study of the Use of Saline Aquifers for Combined Thermoelectric Power Plant Water Needs and Carbon Sequestration at a Regional Scale,” (07-013812) led by SNL that will expand the assessment.
“Thermoelectric Power Plant Water Demands Using Alternative Water Supplies: Power Demand Options in Regions of Water Stress and Future Carbon Management,” (FWP-08-014053) examining additional saline formations across the Nation and led by SNL.
“Technology to Facilitate the Use of Impaired Waters in Cooling Towers,” (NT0005961) coupling electrodialysis reversal (EDR) to lower TDS and a silica-specific ligand functionalized core material to remove silica.
The water extracted from saline formations will have been forced by high pressure CO2 injection to extraction wells at other locations within the formation. An advantage to using saline formations may be that the available volumes are large enough to provide a considerable amount of water for an extended period of time. The SNL study50 indicates that each metric ton of CO2 injected into a saline formation may displace roughly 317 gallons of water. Because considerable uncertainty exists with these underground formations, capacity estimates are conservative.
Additional research into using saline formations for CO2 storage is being done by the NETL-funded work of NATCARB.51 The NATCARB project is exploring the geological sequestration of carbon by combining regional databases on geology and emissions into an interactive mapping system. Links at http://www.natcarb.org/Atlas/sinks.html can help interested parties understand the geospatial extents of these saline formations.
Environmental Concerns for Untreated Waters
According to the SNL study, the composition of the waters extracted from saline formations will change in later years as compressed CO2 dissolves in the water and reacts chemically with the mineral formations. Carbon dioxide in water produces carbonic acid, a weak acid. When acid

57
exceeds the buffering capacity of the waters, the pH will decrease. The pH of the water in contact with the CO2 is expected to initially drop from near 8.0 to a range of 3.5 to 5, depending on the surrounding minerals. More minerals will dissolve in the acidic environment, but slow processes will eventually precipitate carbonate minerals again.
The goal would be to only extract water that had not been in contact with the injected CO2, so changes in acidity are not of concern. However, the disposal of saline formation waters could still present permitting challenges for sequestration operations with regard to discharge limits on TDS. Sequestration activities in saline formations will likely be restricted to formations with TDS greater than 10,000 mg/L to protect potential drinking water sources; so saline formation sequestration produced waters will have TDS greater than 10,000 mg/L.
Access and Collection
The water extracted from saline formations will be produced at extraction wells located in proximity of the injection wells. In the case of SJGS, an earlier study focused on the Fruitland Formation suitability for water extraction and carbon sequestration.52 Carbon sequestration in the Fruitland Formation was accompanied by oil/gas recovery, and the project was discussed in Chapter 6. Wells in the Fruitland formation are located 32 miles from the power plant, so the water required delivery from the extraction wells to the plant. The investigation examined trucking, utilizing abandoned gas pipelines, and constructing new pipelines as options for transporting the water to the power plant.
The 2008 report assumed that the Morrison Formation would be used and that water would need to be pumped from the well to SJGS a distance of three miles. Five other saline formations located within 35 miles of SJGS and the Four Corners Plant were also evaluated in SNL’s report. It was assumed that the desalination process would occur at the power plants, but this study did not examine different transport processes. Readers interested in the costing of the access and collection process from extraction wells should refer to the Access and Collection discussion in Chapter 6.
Non-Traditional Water Quality Assessment
The SNL study devoted a chapter to the prediction of the chemical composition expected from the various saline formations. The introduction of CO2 into the formations will alter the chemical equilibrium state, but the kinetics are often slow. Therefore, the SNL study used box models (including TOUGH-2) to predict the aqueous concentrations initially, after 100 years, after 350 years, and when the equilibrium is balanced. This method was applied for six different local formations; the ranges in chemical composition after CO2 is added over time are shown in the following table. Table 8-1 compares the concentrations for the nearby Morrison Formation with the limits for all six formations.

58
Table 8-1: Box Model Predictions of Chemical Composition for CO2 Storage in Saline Formations
Water Chemistry
Composition
Minimum Concentration
in Morrison Formation
(ppm)
Maximum Concentration
in Morrison Formation
(ppm)
Minimum Concentration
in All Formations
(ppm)
Maximum Concentration in All Formations
(ppm)
Aluminum 0.004 0.008 0.001 0.014 Calcium 278 1767 7.1 2056 Carbon 22,220 30,700 22,220 31,360 Chlorine 62.8 65.1 62.8 3810 Iron 0 29.7 0 32.9 Magnesium 43.6 786 6.2 1709 Potassium 8.9 5845 8.9 7511 Silicon 2.4 21.8 2.3 24.5 Sodium 194.2 1393 184 4968 Sulfate 963 3351 1.24 4899 pH range 3.49 5.31 3.45 5.31
Considering all six local formations, the SNL study summarized that initially high silica and iron concentrations would present desalination difficulties, as would the high calcium content. Acidic pH levels would last for centuries. However, when full equilibrium is reached (far beyond 350 years), the pH would be expected to be only slightly acidic, potassium and magnesium concentrations would rise, and calcium and sodium concentrations would equilibrate to low levels. Because the produced waters are expected to consist of water ahead of the CO2 plumes, the initial chemistry of the waters is of interest.
The salinity across these formations is not always uniform, and the shallow components of the formations may be less salty than the deeper components. At the October 2008 Existing Plants Water Projects Meeting, it was suggested that saline formations located beneath western salt domes may also have concerns with arsenic and selenium in the produced waters.
An expanded study by SNL53 has sought to describe additional produced waters within saline formations in other water-stressed areas of the country. The deep saline formations initially investigated in the Southeast had TDS far greater than the 20,000 mg/L selection criteria initially assumed for feasible treatment. With the criteria stating that the formations are to be located at least 2,500 feet below the surface and the TDS be between 10,000 and 20,000 mg/L, only one of the four sites initially investigated in the Southeast was suitable. The Black Warrior Basin Coal Test Site is located in northern Alabama, but SNL is also investigating potential sites in Florida, Georgia, and Texas. As part of this study, SNL is developing a tool to guide other investigations of suitable carbon sequestration sites for produced waters that could be treated for power plant use.
Treatment Technology Descriptions
For the initial run of their model, SNL investigated the site specifics of the Morrison Formation, chosen for its geochemistry, physical location, and for desalination purposes. The brackish waters from this formation could not be used as cooling tower makeup without treatment

59
(chlorides must be below 1,000 mg/L). A simple spreadsheet analysis was conducted to study the costs and yields of four desalination options:
Desalination and gathering equipment only; no concentrate disposal.
Desalination and gathering equipment only; 59.5 acre evaporation ponds for concentrate disposal.
Desalination and gathering equipment only; 3,000-ft pipeline and injection well for concentrate disposal.
Desalination and gathering equipment with HERO process and a BC retrofit.
SNL’s study chose the final option with an estimated cost of $5.32 per 1,000 gallons of produced water for these site-specific conditions. The treatment technology was estimated at approximately five percent of the base costs; in comparison, the carbon capture and sequestration (CCS) process represented an additional 100 percent to the base costs.
The HERO+BC treatment was chosen over other options based on the findings from a previous NETL/EPRI study done at SJGS.52 The earlier study is described in Chapter 6 that details treatment of produced water from oil and gas wells. The HERO process pre-treats the water to remove scale-forming minerals (e.g., calcium) and other ions associated with high salinity (e.g., chloride). The subsequent BC separates the reject water from the HERO process into mineral-rich and mineral-lean streams. The recovered mineral-lean water from the BC and the HERO permeate would be fed to the cooling towers.
Like conventional RO techniques, the HERO process uses standard, spiral-wound polyamide membranes. It differs from conventional techniques because it operates at high pH values (9.5-10.5) after pre-softening to remove hardness. At pH levels above 10, soluble silica (H4SiO4) dissociates and does not form scale on the membranes.
In addition, pretreatments will be necessary in order to ensure proper operation of RO systems. These include precipitation softening or scale inhibitors to prevent mineral scale from fouling membranes, filtration to remove particulate matter, periodic membrane cleaning with non-oxidizing biocides to remove biofilms, a combination of gravity separation, air flotation, and filtration to remove oil, and neutralization of charged colloidal matter with polymers. The saline formation waters may not require all of these pretreatments (e.g., oil filtration), and the high pH of the HERO system dissolves organic fouling and certain oil constituents to minimize fouling by these mechanisms. An illustration of the pretreatments and the HERO system (designed for oil and gas well waters) is shown in Figure 8-1.52
Following the exit from the HERO system, RO reject stream would be sent to the BC for further water recovery. The BC would operate in the un-seeded mode at high pH (10-11), eliminating the need for acid, antiscalant, and calcium chloride.

60
Figure 8-1: Illustration of Pretreatments and HERO System for Produced Waters
52
Another process for silica removal is beginning development at GE Global Research. Impaired waters with silica concentrations of 100 ppm will first be treated through EDR, an electrochemical separation process that removes ions and other charged species from fluids.54 Direct current voltage transfers the ions through ion exchange membranes to desalinate the stream. The GE EDR technology process has been marketed for municipal drinking water, industrial process water, and wastewater reuse, and it includes the following features:
High water recovery rate design (and the associated reduced waste discharges)
Membranes that tolerate moderate particulate levels
Long membrane life
Chlorine-resistant membranes
Low electricity consumption
High silica tolerance GE Global Research proposes that the self-cleaning EDR membranes will reduce the TDS from 2,500 mg/L to the range of 25-100 mg/L.55 Silica remediation will then be performed on the effluent stream to reduce the silica concentrations by 90 percent using ligand functionalized core

61
materials (LFCM) developed with silica-specific ligands. The bound silica will then be separated, and the LFCM will be recycled after the silica is removed.
Performance Goals
For produced water from the Morrison saline formation, the HERO process is designed to operate with an 83 percent efficiency, producing 0.83 gallons of water for each gallon of feed. The concentrate stream from the HERO process would be treated by the BC to recover 73 percent of that reject. Total solids from the BC would be limited to the 200,000 to 250,000 mg/L range.
The SNL study has estimated the costs associated with this process based on the assumptions shown in Table 8-2. Based on these assumptions, SNL estimated the total treatment cost for the Morrison Formation at $5.32 per 1,000 gallons of treated water (including ponds and groundwater pumping).
The work at GE Global Research is currently in Phase I (Material Selection and Synthesis).55 The tasks within this phase are aimed at synthesizing and testing LFCMs for silica and developing preliminary cost estimates. The goal in this phase is to achieve 90 percent silica removal. Later phases will include demonstration of a recycle protocol at the benchtop level, scale-up of the LFCM synthesis, pilot plant design and demonstration, and finalization of cost and process models.
Other Issues
Power plants considering CCS must identify additional water sources to be used in the carbon capture process (Table 1-1). A DOE/NETL report56 examined the effects of carbon capture technologies on three scenarios that estimated PC plants required 143-147 BGD of water withdrawal. The carbon capture process that was constructed on the coal-fired fleet with existing scrubbers demanded an additional 0.7-4.1 BGD of water withdrawal. A 2008 analysis57 shows lower water withdrawal and consumption rates for all future years compared to the 2007 analysis largely because the future thermoelectric capacity estimates decreased in the 2008 analysis.
On July 25, 2008, the U.S. EPA proposed a rule designed to outline the requirements necessary to develop wells for geologic sequestration of CO2.58 Previous injection well requirements under EPA’s underground injection control (UIC) program had established five different categories for wells. The issues associated with the geologic sequestration of CO2 for storage purposes were sufficiently different than previous well activities, so EPA proposed a Class VI well with its own requirements. These requirements are designed to ensure safe injection of CO2 while protecting potential drinking water aquifers.
The salts produced during this treatment require disposal, but the SNL study does not make recommendations about the appropriate techniques. Because the produced waters containing the same quantities of salts would also require disposal, this aspect was not considered in the cost estimates.

62
Table 8-2: Summary of Desalination Calculations and Assumptions for CO2 Storage Waters
Base Case Value Water TDS (mg/L) Used Morrison formation 6,000 Design Flow rate (gpm) Based on 24/7 pumping of
brackish aquifer and % CO2 capture
1,807
Design Flow Rate (MGD) Used 2.0 MGD desalination output (treated water)
Design Annual Flow (Mgal/yr) Based on 0.85 plant capacity factor (USBR recommendation)
400
Electrical cost ($/kwh) 0.1 Pipeline distance from brackish well to desal plant (mi)
Based on radial distance, Morrison formation 3
Well Depth (ft) Based on Morrison formation 4,725 Capital Costs:
Pump & Pipe – Produced Water Gathering Capital
Used USBR desalting Handbook Figures 9-18 a $2,000/ft
Piping from gathering station to desal plant
Used USBR desalting Handbook Figures 9-11 a
$126,810/mi
Concentrate Disposal pipeline & well Used USBR desalting Handbook Figures 9-11 & 9-13 a
Evaporation Ponds Used USBR desalting Handbook Figures 9-12 a
Desalination Total Construction Cost Used USBR desalting Handbook Figures 9-7 a
2,000 mg/L TDS for options A-C NETL/EPRI (2006) Value for option D
O&M
Labor for (2) MGD Used USBR desalting Handbook Figures 9-37 a
Electrical BWRO (for 6,000 mg/L TDS, 2 MGD)
Used USBR desalting Handbook Figures 7-8 & 9-45a
Electrical GW pumping (for 1807 gpm/2 MGD)
Used equations to estimate pump power; see Appendix X
Membrane Replacement Used USBR desalting Handbook a
$0.08/1000 gal plant capacity
Chemicals (used surface water) Used USBR desalting Handbook Figures 9-41 a
Other Maintenance Used USBR desalting Handbook Figures 9-18 a
1.5% of capital
a – Desalting Handbook for Planners, third edition, United States Department of Interior Bureau of Reclamation, July 2003.
Year II of SNL’s study of using brackish water from saline formations expands the assessment to consider additional factors. It will characterize the CO2 sequestration potential within select formations, consider new desalination technologies and potential uses of waste heat for reducing desalination costs, and incorporate considerations of the costs associated with CO2 sequestration within these formations. The study will continue to focus on SJGS but will create a framework

63
that allows planners to consider the development costs of collocation of power plants near saline formations to both utilize the carbon sequestration potential and the available brackish water. Year II of the study will also consider using the brackish water in systems other than cooling towers.
In addition, another study by SNL (Project FWP-08-014053) has been investigating candidate sites in other parts of the United States where potential geologic sequestration formations may provide water. That study is described further in Chapter 10.
Summary
The first year of the SNL study has scoped the options associated with the use of waters produced from saline formations when accompanied by carbon sequestration in the formation. The extraction, transport, and treatment of the waters were examined in order to estimate the costs of using these waters for cooling tower makeup at SJGS. Site-specific costs were estimated at $5.32 per 1,000 gallons of treated water (including ponds and groundwater pumping).
The treatment costs were estimated for a single nearby formation (Morrison Formation) that could supply sufficient rates of brackish water to justify use as a makeup system. After pretreatment, the HERO system should recover 83 percent of the water, and the subsequent BC an additional 73 percent of the reject.
Year II of SNL’s study will characterize the CO2 sequestration potential within select formations, consider new desalination technologies and potential uses of waste heat for reducing desalination costs, and incorporate considerations of the costs associated with CO2 sequestration within these formations. The study will continue to focus on SJGS but will create a framework that allows planners to consider development costs. Year II of the study will also consider using the brackish water in systems other than cooling towers. An additional ongoing study by SNL is examining additional potential geologic sequestration formations around the United States and evaluating their potential for using these non-traditional waters.
A new study is underway at GE Global Research to treat impaired waters with high TDS and silica concentrations. EDR techniques will first lower the TDS, and then a silica-specific ligand will be introduced to separate silica from the water stream. The ligand will be bound as a ligand functionalized core material, separated from the water stream, and recycled after the silica has been removed.
References 50 Kobos et al., Sandia Report SAND2008-4037, Study of the Use of Saline Aquifers for Combined Thermoelectric Power Plant Water Needs and Carbon Sequestration at a Regional Scale: Phase I Report (June 2008). 51 Kansas Geological Survey, NATCARB Homepage, http://www.natcarb.org/index_nc.html, last accessed March 14, 2009. 52 Zammit, Kent. Semi-Annual Technical Progress Report October 1, 2005 to March 31, 2006: Use of Produced Water in Recirculating Cooling Systems at Power Generating Facilities. Deliverable Number 11 for DOE Award No. 41906.

64
53 National Energy Technology Laboratory, “NETL-Existing Plants Water Projects Meeting Presentations,” stored at http://www.netl.doe.gov/technologies/coalpower/ewr/water/pdfs/NETL%20Existing%20Plants%20Water%20Projects%20Meeting%20Presentations.pdf, last accessed March 13, 2009. 54 GE Water and Process Technologies. Electrodialysis Reversal (EDR), http://www.gewater.com/products/equipment/ed_edr_edi/edr.jsp, last accessed March 17, 2009. 55 D. Whisenhunt, J. Melzer, and A. Shetty, “Minimization of Fresh Water Usage at Coal-Fired Power Plants.” Presented at October 2008 meeting. 56 Department of Energy/National Energy Technology Laboratory (DOE/NETL). Estimating Freshwater Needs to
Meet Future Thermoelectric Generation Requirements: 2007 Update Forecasts. DOE/NETL-400/2007/1304. http://www.fypower.org/pdf/DOE_WaterNeedsAnalysis_2007.pdf. 57 Department of Energy/National Energy Technology Laboratory (DOE/NETL). Estimating Freshwater Needs to
Meet Future Thermoelectric Generation Requirements: 2008 Update. DOE/NETL-400/2008/1339. http://www.netl.doe.gov/technologies/coalpower/ewr/pubs/2008_Water_Needs_Analysis-Final_10-2-2008.pdf. 58 Federal Register, Vol. 73, No. 144, 43492-43541, July 25, 2008. Regulatory development can be tracked at: http://www.epa.gov/safewater/uic/wells_sequestration.html.

65
9. Recovered Plant Discharges
This chapter covers Existing Plants Program-funded work on water that normally would be discharged from the power plant, before or after treatment. To date, the work in this area has focused on discharges associated with ash pond effluent. The ash pond waters consist predominantly of waters contacting ash in the process stream (e.g., sluice) but also include surface water runoff from precipitation events. The ash ponds are primarily utilized for settling solids and provide only minimal treatment for inorganics and organics.
This chapter reflects work that has been, or is currently being done, in two NETL studies:
“An Innovative System for the Efficient and Effective Treatment of Non-Traditional Waters for Reuse in Thermoelectric Power Generation,” (NT42535) led by Clemson University that tested how constructed wetlands can treat ash basin waters.
“Reuse of Treated Internal or External Wastewaters in the Cooling Systems of Coal-based Thermoelectric Power Plants,” (NT42722) led by the University of Pittsburgh that tests treated water performance in pilot-scale cooling towers.
Environmental Concerns for Untreated Waters
National attention has turned to the regulation of coal ash impoundments in recent months, and U.S. Representative Nick Rahall, chairman of the House Natural Resources Committee, proposed a bill (Coal Ash Reclamation and Environmental Safety Act of 2009) that would impose uniform design, engineering, and performance standards on coal ash impoundments.59 Other members of Congress have also pushed for EPA to take actions to regulate operation of coal ash impoundments.
The Clemson University work surveyed chemical contaminants of concern in various ash basin waters, as indicated in Table 9-1.60 In addition, the University of Pittsburgh noted the typical ash pond water quality range reported by 10 coal-fired power plants operated by Tennessee Valley Authority, which are also shown in Table 9-1.61
Table 9-1: Reported Chemical Contaminant Concentrations in Untreated Ash Basin Waters
Site Contaminant Concentrations (mg/L) Savannah River, SCa Arsenic
Cadmium Chromium Copper Mercury Selenium Zinc
4.08±9.70 0.1083±0.061 0.324±0.382 1.003±0.901 0.0267±0.007
0.79±1.52 3.27±2.839
Virginia sitea Arsenic Cadmium Mercury Zinc
0.450±0.424 0.17 (n=1)
0.025±0.007 2.67 (n=1)
New Mexico sitea Arsenic Cadmium Chromium Copper
0.030 0.001
0.0025±0.0007 0.0025±0.0007

66
Site Contaminant Concentrations (mg/L) Selenium Zinc
0.058±0.002 0.510±0.098
North Carolina sitea Arsenic Selenium Zinc
0.039±0.061 0.0158±0.0167 0.030±0.023
Tennessee Valley Authorityb Aluminum Arsenic Beryllium Cadmium Chromium Copper Cyanide Lead Mercury Selenium Silver Zinc
0.1—8.8 <0.005—0.180 <0.01—0.002 <0.001—0.052 <0.005—0.17 <0.01—0.45 <0.01—0.02 <0.01—0.2
<0.0002—0.3 <0.001—0.14 <0.01—0.03 <0.01—2.7
a reported by Clemson University b reported by the University of Pittsburgh
Although ash pond waters are not discharged from the plant, researchers compared them to NPDES and EPA-recommended water quality criteria (WQC) to represent their relative toxicities. Arsenic concentrations in ash pond waters exceed both NPDES permit levels of 0.293 mg/L and the WQC of 340 μg/L. The WQC for cadmium of 20 μg/L is lower than the concentrations in several basins listed in Table 9-1. NPDES permits restrict chromium concentrations to 0.2 mg/L, and the WQC recommends 570 μg/L and 16 μg/L as the upper limits for trivalent and hexavalent chromium. As indicated in Table 9-1, the Savannah River site exceeds these concentrations. For copper, both the NPDES permit limits (0.04-1.0 mg/L) and the EPA WQC (13 μg/L) were lower than many of the measured concentrations. The WQC for mercury is 1.4 μg/L; therefore, this element is a constituent of concern based on the measured concentrations. The WQC for selenium is only 5 μg/L, but most of the concentrations listed in Table 9-1 exceed this value. The EPA WQC for zinc recommends that the concentration not exceed 120 μg/L, but the concentrations in ash basin waters range from 0.011 to 8.1 mg/L.
Non-Traditional Water Quality Assessment
Studies also address the suitability of the recovered plant discharge waters for use at the power plants. Clemson reports that ash basin waters have low ionic strength and thus do not promote the formation of chemical scale. Because some constituents (e.g., mercury, arsenic, and zinc) pose risks to living organisms, Clemson lists biofouling as an issue of minor concern for the use of ash basin waters. In addition, scaling and biofouling were monitored in simulated ash pond waters. The principal issue of concern for ash basin waters is corrosion potential, and it was examined in the Clemson study.
The University of Pittsburgh study examined ash pond water from the Reliant Energy power plant.62 In bench-scale tests, they found that ash pond water was less likely to cause biofouling than using secondary treated municipal wastewater. Their results show that both the planktonic and sessile heterotrophic plate counts for the untreated ash pond waters were close to, or only slightly exceeded, the target criterion.

67
The University of Pittsburgh examined the scaling behavior of actual and synthetic ash pond waters. The scaling results caused by raw water and water after four cycles of concentration (evaporated down to one quarter of the volume) were examined. An unexpected result was that the actual raw water seemed to produce more scaling deposits than the concentrated raw water in the bench-scale tests. The inversion in results was explained by both deposition of minerals during the concentration phase and the presence of deposits introduced to the raw water by mild steel corrosion coupons. Increased scaling in the synthetic ash pond waters was associated with higher calcium levels, but there was little influence from magnesium.
Treatment Technology Descriptions
The University of Pittsburgh study has measured the effects of different chemical treatments on ash pond waters for use in power plants through bench-scale testing but has not had an opportunity for pilot-scale testing. Their efforts have focused on scale control, chlorine demand, and biofouling prevention.
The University of Pittsburgh tested scale control additives in raw and simulated ash pond waters, but the tests in raw waters were not conclusive. In bench-scale testing, the synthetic waters were tested and compared with waters dosed with polyacrylic acid (PAA), PMA, and PBTC individually, as well as a 2:1 dosage ratio of PMA to PBTC.
Bacterial control in cooling water often depends on maintenance of a free chlorine residual in the range from 0.5 to 1 ppm Cl2. The ash pond waters were tested to determine the chlorine dosage necessary to maintain these concentrations. Biofouling tests (both planktonic and sessile heterotrophic plate counts) were also conducted on the untreated raw ash pond waters to determine biofouling rates.
In the CWTS designed at Clemson University, water passed through one of two reactor series, but both series consisted of four similarly constructed freshwater wetlands reactors (Figure 9-1). The sequential order runs from a moderately reducing wetlands reactor (redox potential Eh from -100 to 100 mV) followed by two smaller, more strongly reducing reactors (Eh less than -150 mV) and finally an oxidizing wetlands reactor (Eh from -100 to 250 mV). The reducing reactors include 30 cm of river sand hydrosoil and Schoenoplectus californicus (California bulrush) planted at realistic field densities. The oxidizing reactors include a granite cascade, 30 cm of river sand hydrosoil, and Typha angustifolia (narrowleaf cattail).

68
Table 9-2 shows characteristics of the reactors prior to introduction of the simulated ash basin waters. Ash basin water was simulated by adding high-purity salts of arsenic, chromium, mercury, selenium, and zinc to the reservoir. The retention time in the reactor series was approximately five days.
Table 9-2: Parameters Indicating CWTS Readiness for Treatment of Ash Basin Waters
Series and Reactor A1 B1 A2 B2 A3 B3 A4 B4 Eh (mV) -76 -67 -172 -174 -182 -167 189 -17 Sediment Organic Matter (%)
0.10 0.12 0.42 0.24 0.36 0.25 0.19 0.18
Plant Density (#/m2) 272 436 340 432 336 384 152 120
Performance Goals
The goal for the University of Pittsburgh study is to demonstrate that ash pond waters can be chemically treated to perform as cooling tower makeup waters in pilot-scale testing. The efforts focus on scale control through the addition of PAA, PMA, PTBC, or a combination and biofouling prevention through chlorine addition.63 Bench-scale testing in a recirculating system showed that significant biocide and inhibitor concentrations were not necessary for biofouling prevention in the ash pond waters at both one and four cycles of concentration. When the free chlorine levels rose above 0.2 ppm, the planktonic bacteria decreased to non-detectable levels. However, free chlorine concentrations at 0.5 ppm increased the copper corrosion rate six times without inhibitors and four times with an inhibitor mixture. Investigators recommended that free chlorine levels remain at or below 0.5 ppm to achieve biofouling control without significant corrosion.
The University of Pittsburgh conducted bench-scale testing of scaling control methods using simulated ash pond waters in order to maintain better controls than could be achieved with the raw waters. The simulated waters representing four cycles of concentration were composed of
Figure 9-1: Illustration of CWTS for Ash Basin Waters

69
Ca2+ (177 mg/L), Mg2+ (39.6 mg/L), Na+ (217 mg/L), Fe3+ (15.6 mg/L), SO42- (392 mg/L),
HCO3- (312 mg/L), and Cl- (312 mg/L). The bench-scale testing (pictured in Figure 9-2) showed
that PAA had the least impact on scale formation beyond four days, and PMA and PBTC showed similar performance by reducing scaling deposits roughly four times. When PMA and PBTC were dosed at 10 ppm and 5 ppm in the same test, the antiscaling effectiveness improved, but not significantly.
Figure 9-2: Scaling Behavior of Synthetic Ash Pond Effluent in Bench-Scale Tests: Effectiveness of Different
Antiscalants at Four Cycles of Concentration
Performance Results
These two studies have addressed different water treatment for different purposes. The Clemson University study investigated using wetlands for the removal of toxic constituents for discharge. The University of Pittsburgh study researched using chemical treatment to control the corrosion, scaling, and biofouling characteristics for reuse in power plant cooling towers.
The Clemson CWTS showed decreases in concentrations of arsenic, chromium, mercury, selenium, and zinc below the detection limits (sample shown in Figure 9-3), and the detection limits will be lowered for future testing. In addition, the conductivity, dissolved oxygen, alkalinity, and hardness remained fairly constant during the three experimental periods. Toxicity tests showed that survival and reproduction rates were higher in the treated waters than the untreated waters.64

70
Figure 9-3: Sample Chart Showing Element Removal from Simulated Ash Basin Water by CWTS
The Clemson investigators also found that scaling and biofouling potential decreased significantly through both reactor series compared with the original detention basin (Figure 9-4). However, Figure 9-4 shows that corrosion potential increased significantly.

71
Figure 9-4: Scaling, Biofouling, and Corrosion Potential when Constructed Wetlands Treat Ash Basin Waters
Other Issues
These two studies address water that would normally leave the fence line of the power plant. However, many NETL Existing Plants Program-funded water projects in research areas outside the non-traditional waters technology area consider other innovative methods for water recovery within the fence line, including:
“A Synergistic Combination of Advanced Separation and Chemical Scale Inhibitor Technologies for Efficient Use of Impaired Water as Cooling Water in Coal-Based Power Plants,” at Nalco Company.
“Application of Pulsed Electrical Fields for Advanced Cooling and Water Recovery,” at Drexel University.
“Water Extraction from Coal-Fired Power Plant Flue Gas,” by the University of North Dakota Energy and Environmental Research Center.
“Recovery of Water from Boiler Flue Gas,” by Lehigh University.
“Use of Coal Drying to Reduce Water Consumed in Pulverized Coal Power Plants,” by Lehigh University.
“Transport Membrane Condenser for Water and Energy Recovery from Power Plant Flue Gas,” by Gas Technology Institute.
In recent months, the lack of Federal regulations on the containment and disposal of coal ash pond waste has been a news item. EPA has been studying possible regulations of coal ash for 28

72
years but has not designated it as a hazardous waste. If future regulations demand that ash be stored dry in lined landfills, this source of non-traditional water might no longer be available.
Summary
Currently two studies are underway to examine the use of non-traditional waters that would normally be discharged from thermoelectric power plants. Both studies examine the use of ash pond waters. The Clemson University study has focused on using constructed wetlands treatment systems to treat the waters, and the University of Pittsburgh study has conducted bench-scale testing to determine appropriate chemical treatments.
Although ash pond waters are not discharged from the plant, researchers compared them to NPDES and WQC to represent their relative toxicities. The studies indicated that untreated ash pond waters typically exceed NPDES permit and WQC for arsenic, cadmium, chromium, copper, mercury, selenium, and zinc. Biofouling was not an issue of concern for power plant reuse, and bench-scale testing showed untreated waters were close to, or only slightly exceeded, the target criterion. If chlorine doses were kept low, the corrosion rates of the ash pond waters remained low. Scaling potential is also being studied.
The CWTS series at Clemson were found to decrease arsenic, chromium, mercury, selenium, and zinc concentrations below the detection limits. In addition, toxicity, scaling potential, and biofouling potential were all decreased in the treated waters compared to the untreated as basin waters. However, corrosion potential did increase. The University of Pittsburgh study found that maintenance of chlorine at 0.5 ppm levels was optimal and that PMA, PTBC, and a combination (PMA:PBTC at 2:1) all afforded roughly the same scaling control. The use of PAA was not as effective.
Future Federal legislation regarding coal ash ponds should also be considered when examining the viability of recovering ash pond waters. Recent legislative efforts, as well as consideration of rules by the EPA, may affect future impoundment methods.
References
59 Allyson Groff and Blake Androff, “Rahall Introduces Legislation to Regulate Coal Ash Disposal.” January 14, 2009. http://resourcescommittee.house.gov/index.php?option=com_content&task=view&id=439&Itemid=27. 60 J.H. Rodgers et al. An Innovative System for the Efficient and Effective Treatment of Non-traditional Waters for Reuse in Thermoelectric Power Generation. Fifth Quarterly Progress Report for DOE Award DE-FG26-05NT42535. January 2007. 61 R.D. Vidic and D. Dzombak Reuse of Treated Internal or External Wastewaters in the Cooling Systems of Coal-Based Thermoelectric Power Plants. July 1, 2007-September 30, 2007, Quarterly Progress Report for DOE Award DE-FC26-06NT42722. 62 R.D. Vidic and D. Dzombak Reuse of Treated Internal or External Wastewaters in the Cooling Systems of Coal-Based Thermoelectric Power Plants. January 1, 2008-March 31, 2008, Quarterly Progress Report for DOE Award DE-FC26-06NT42722.

73
63 R.D. Vidic and D. Dzombak. Reuse of Treated Internal or External Wastewaters in the Cooling Systems of Coal-based Thermoelectric Power Plants: Final Technical Report September 2009. http://www.netl.doe.gov/technologies/coalpower/ewr/water/pp-mgmt/pubs/06550/42722FSRFG063009.pdf 64 J.H. Rodgers et al. An Innovative System for the Efficient and Effective Treatment of Non-traditional Waters for Reuse in Thermoelectric Power Generation. Final Technical Report for DOE Award DE-FG26-05NT42535. November 28, 2008.

74
10. Locating Sources of Non-Traditional Waters
Chapter 9 described an ongoing SNL project that is assessing power demand options in regions of water stress with regard to water produced from saline aquifers if CO2 is injected as part of a future carbon management program.65 Earlier work examined aquifers in the Southwest, but efforts now are focusing on the Southeast and how specific evaluation metrics should be applied to characterize these water supplies. The study aims to consolidate the analysis framework into metrics, processes, and modeling aspects that can be applied across various regions of the United States. When that work is done, it will be important to relate its findings regarding non-traditional water availability to geographic locations for existing and planned thermoelectric power plants.
The proximity to non-traditional waters is an important issue when considering their use. Therefore, the following two GIS projects are underway that will help match thermoelectric power plants to nearby acceptable sources of non-traditional waters:
“Optimization of Cooling Water Resources for Power Generation,” (FT40320-01.24 and NT43291-05.1) conducted by the UND EERC that is developing a GIS-based web application decision support system for the Northern Great Plains Water Consortium.
“Internet Based, GIS Catalog of Non-Traditional Sources of Cooling Water for Use at America’s Coal-Fired Power Plants,”66 (NT0005957) conducted by Arthur Langhus Layne, LLC (ALL Consulting) that will develop a nationwide catalog of the location, quantity, and quality of non-traditional water sources relative to power plants.
UND EERC is developing a decision support system67 that uses web interfaces in conjunction with GIS tools to allow utilities to assess the availability of suitable water supplies in the Dakotas and Minnesota. These three states include a spatial extent that covers two EPA regions, different water rights doctrines (Chapter 3 of this document), and information management by both watershed districts and county water boards. The GIS-based information has been gathered from a number of sources, such as:
Surface waters (USGS)
Groundwater (individual states)
Non-traditional waters (USGS and states)
Water quantity (USGS and states)
Water quality (EPA STORET database) A sample screen shot displaying the data distribution is shown in Figure 10-1 and includes aquifers, rivers, and wastewater treatment plants. Both real-time and historical surface water flows can be tracked through the system using live links to USGS gauging station data (Figure 10-2). Clicking the mouse on a point provides the user access to detailed information about the sites through online links.

75
Figure 10-1: Data Distribution in the UND EERC Decision Support System
Figure 10-2: Historical Stream Flow Data Displayed by the UND EERC Decision Support System

76
Although the geographic distribution of aquifer-bearing material is often known, the potential yields of the aquifers have not always been quantified. Figure 10-3 shows some aquifer yield information for various locations in the three-state area; the largest data gap has been groundwater yield information for South Dakota. The three states use different methods for calculating and reporting aquifer yield potential. However, quantitative information about surface non-traditional waters is often better known. For example, Figure 10-4 illustrates the municipal wastewater discharge rates at facilities discharging more than 1 million gallons per day. Researchers are also integrating the EPA’s STORET database information to help determine surface water quality.
Figure 10-3: Aquifer Yield Information in the UND EERC Decision Support System (data gap for
groundwater yield information for South Dakota)

77
Figure 10-4: Municipal Wastewater Discharge Rates More Than 1 Million Gallons Per Day in the UND
EERC Decision Support System
In Phase 2 of the study, links to laws and tribal rights information will be included. Researchers plan to expand the geographic regions and include quantifiable data for produced waters (Chapter 6) and those from saline aquifers (Chapter 8). In addition to these GIS studies, Chapter 6 and Chapter 8 briefly discuss issues associated with access and collection of produced waters. Interested readers are encouraged to follow these discussions in order to understand the choices that were made about modes of transport, where to pre-treat waters along the pipeline, and how investigators evaluated the use of abandoned pipelines.
ALL Consulting has begun an internet-based GIS effort to associate power plants with non-traditional water sources across the lower 48 states. The project advisory council includes members of the Ground Water Protection Council and the USGS. The Ground Water Protection Council is a national association of state ground water and underground injection control agencies whose mission is to promote protection and conservation of ground water resources for all beneficial uses.
In this project, ALL Consulting plans to:
Identify the locations and water needs of coal-fired power plants in the lower 48 states.
Identify the locations, quality, and volumes of non-traditional water sources.
Create an internet-based GIS catalog of non-traditional sources of cooling water connecting the two geodatabases.

78
Information about power plant water usage will be collected by the Ground Water Protection Council. ALL Consulting is working with other NETL contractors and state officials to populate the geodatabase for the non-traditional sources of water. By clicking on a map location, users will be able to visualize the potential water sources, quality, volumes, and horizontal distance to those waters. The tool is intended to make users aware of water options and allow them to assess the costs for supplementing or replacing their current freshwater supplies.
References 65 National Energy Technology Laboratory, Power Plant Water Management: Thermoelectric Power Plant Water
Demands Using Alternative Water Supplies: Power Demand Options in Regions of Water Stress and Future Carbon
Management. http://204.154.137.14/technologies/coalpower/ewr/water/pp-mgmt/regional.html, last accessed March 11, 2009. 66 National Energy Technology Laboratory, Power Plant Water Management: Internet-Based, GIS Catalog of Non-
Traditional Sources of Cooling Water for Use at Coal-Fired Power Plants.
http://www.netl.doe.gov/technologies/coalpower/ewr/water/pp-mgmt/gis.html, last accessed March 13, 2009. 67 National Energy Technology Laboratory, “NETL-Existing Plants Water Projects Meeting Presentations,” stored at http://www.netl.doe.gov/technologies/coalpower/ewr/water/pdfs/NETL%20Existing%20Plants%20Water%20Projects%20Meeting%20Presentations.pdf, last accessed March 13, 2009.

79
Appendix A
Database of Power Plants Using Reclaimed Water2
(Listed by State)

80

81

82

83

84

85