use of mangroves by fish: new insights from in-forest videos · sheaves et al.: use of mangroves by...
TRANSCRIPT

MARINE ECOLOGY PROGRESS SERIESMar Ecol Prog Ser
Vol. 549: 167–182, 2016doi: 10.3354/meps11690
Published May 10
INTRODUCTION
Mangroves provide important habitats for fish(Morton 1990, Robertson & Duke 1990a, Nagelker-ken et al. 2002); there are clearly demonstrated linksbetween mangroves and the health, diversity andcommunity structure of nearshore fish populations(Nagelkerken et al. 2001, Mumby et al. 2004), andindeed the health of nearshore ecosystems (Mumby& Hastings 2008). It is also widely accepted that man-groves provide substantial fisheries value (Costanzaet al. 1997, Kathiresan & Bingham 2001, Creighton etal. 2015), although the extent of that value has rarelybeen definitively assessed (Manson et al. 2005).
Substantial variations in mangrove floodingdynamics in different parts of the world suggest thatpatterns of mangrove habitat use by fish may alsovary considerably among locations (Igulu et al. 2014,
Baker et al. 2015). While underwater visual censuseshave facilitated detailed studies of mangrove utilisa-tion by fish in a number of areas of the world (e.g.Nagelkerken et al. 2001, Mumby et al. 2004), quanti-fying direct use of tropical Indo-Pacific estuarinemangroves has been hampered by substantial popu-lations of estuarine crocodiles. Consequently, studieshave been mainly restricted to netting techniquesthat are limited in their effectiveness in dense man-grove forests. The most successful method to deter-mine which fish use mangroves is block netting;however to our knowledge, only 2 studies (Morton1990, Halliday & Young 1996) used this approach in away that assured that all fish sampled had actuallyentered the mangrove forest (i.e. they used blocknets deployed directly along the front edge of themangroves). Other studies used methodologies thatincluded adjacent mud banks (Blaber et al. 1989) or
© Inter-Research 2016 · www.int-res.com*Corresponding author: [email protected]
Use of mangroves by fish: new insights from in-forest videos
Marcus Sheaves*, Ross Johnston, Ronald Baker
College of Marine and Environmental Sciences and TropWater, James Cook University, Townsville, QLD 4811, Australia
ABSTRACT: Even in some of the best-studied areas, there has been little direct evaluation of howextensively mangroves are used by fish, or the extent of their penetration through mangroveforests. As a result, paradigms about the utilisation and value of mangroves have not been fullytested. We used an array of unbaited underwater videos to investigate the extent to which fishused mangroves in north-eastern Australian estuaries. Only a small subset of estuarine specieswere observed entering the mangroves, and patterns of utilisation differed from those expectedbased on standard paradigms. In particular, trophic groups such as planktivores occurred rarelyeven 1 m inside the seaward mangrove margin, with utilisation dominated by a few speciesknown to specialise on mangrove-associated prey. Of the species that did enter the mangroves,only a few penetrated through to the landward edge. The limited use of mangroves by fish in thesesystems suggests a need to reconsider the ways in which mangroves provide refuge and theextent to which they are used as foraging sites. The fact that mangrove use was more restrictedthan expected implies that the nursery value of these systems is likely to be conferred at a whole-ecosystem scale, and emphasises the need for a detailed, region-specific understanding of thespecific values of the different components of mangrove ecosystems.
KEY WORDS: Mangrove · Refuge · Tropical estuary · Fish · Underwater video
Resale or republication not permitted without written consent of the publisher
Mar Ecol Prog Ser 549: 167–182, 2016
blocked mangrove drainage channels (Robertson &Duke 1990a), both of which are habitats known toharbour substantial numbers of fish (Johnston &Sheaves 2007), and therefore likely included fish thathad not entered the flooded mangrove forest itself.Both the Morton (1990) and Halliday & Young (1996)studies sampled single sites, and both recorded atotal of 42 species, only 6 of which comprised >55%of the total numbers. In addition, while Morton (1990)reported high fish densities, Halliday & Young (1996)found that densities were low, highlighting site-specificity in mangrove utilisation.
The use of underwater video overcomes many ofthe problems associated with sampling in man-groves, and provides the opportunity to collect datafrom within flooded meso- and macrotidal mangroveforests at a level of detail not previously possible.Until now, there have been few video studies con-ducted in estuaries (Meynecke et al. 2008, Kimball &Able 2012). However, video has proved successful atdetailing movements in and out of seaward man-grove margins (Ellis & Bell 2008), suggesting thepotential for more detailed investigations of man-grove use. Although not without limitations (Kimball& Able 2012) (e.g. only sampling small areas, beinglimited to areas with sufficient water clarity, and onlybeing employed during the day), underwater videoprovides the opportunity to determine which speciesuse the forests, their temporal patterns of use, andtheir behaviours while in the forest; information notavailable from traditional capture sampling (Beckeret al. 2010).
To develop a more detailed understanding of howfish use tropical Indo-Pacific mangrove forests, weused an array of replicate, unbaited underwatervideo cameras in the mangrove forests of tropicalnorth-eastern Australia to address 3 questions: (1)What component of the available fish fauna entersmangrove? (2) How extensive is penetration into theforest by those species? (3) What are the temporalpatterns of mangrove use by those species?
MATERIALS AND METHODS
Study sites
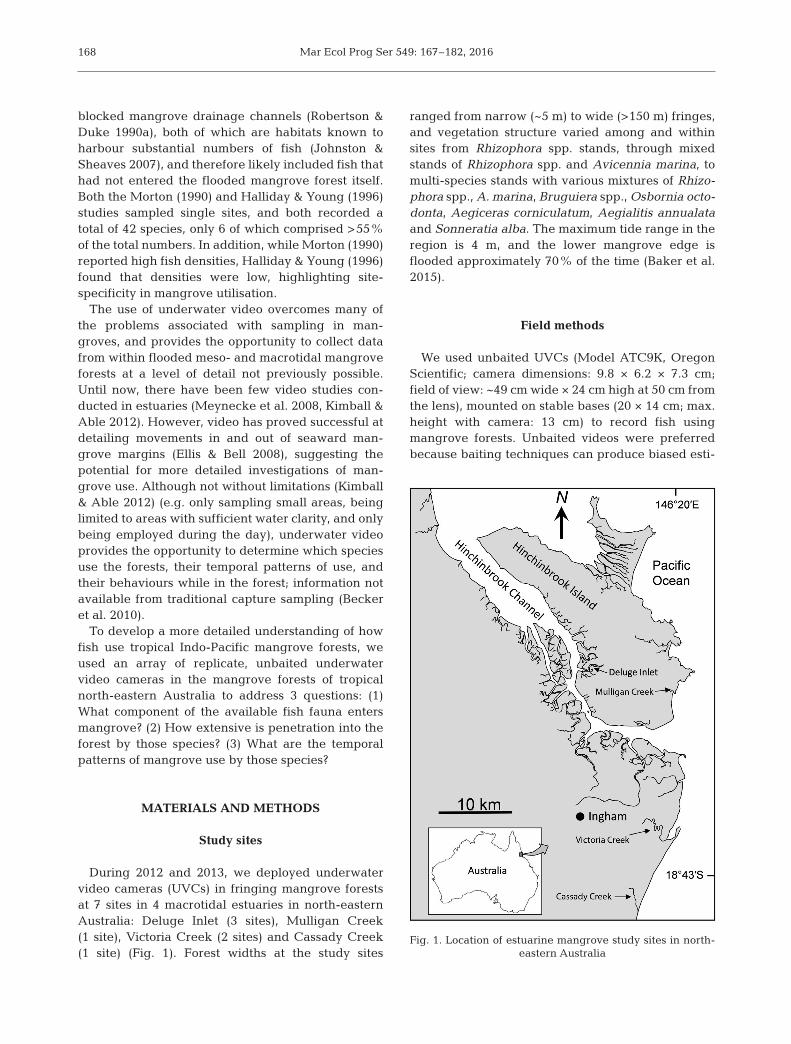
During 2012 and 2013, we deployed underwatervideo cameras (UVCs) in fringing mangrove forestsat 7 sites in 4 macrotidal estuaries in north-easternAustralia: Deluge Inlet (3 sites), Mulligan Creek(1 site), Victoria Creek (2 sites) and Cassady Creek(1 site) (Fig. 1). Forest widths at the study sites
ranged from narrow (~5 m) to wide (>150 m) fringes,and vegetation structure varied among and withinsites from Rhizophora spp. stands, through mixedstands of Rhizophora spp. and Avicennia marina, tomulti-species stands with various mixtures of Rhizo -phora spp., A. marina, Bruguiera spp., Osbornia octo -donta, Aegiceras corniculatum, Aegialitis annu a lataand Sonneratia alba. The maximum tide range in theregion is 4 m, and the lower mangrove edge isflooded approximately 70% of the time (Baker et al.2015).
Field methods
We used unbaited UVCs (Model ATC9K, OregonScientific; camera dimensions: 9.8 × 6.2 × 7.3 cm;field of view: ~49 cm wide × 24 cm high at 50 cm fromthe lens), mounted on stable bases (20 × 14 cm; max.height with camera: 13 cm) to record fish using mangrove forests. Unbaited videos were preferredbecause baiting techniques can produce biased esti-
168
Fig. 1. Location of estuarine mangrove study sites in north-eastern Australia
Sheaves et al.: Use of mangroves by fish
mates of small-scale habitat use by drawing fish infrom adjacent habitats (Bassett & Montgomery 2011).The cameras were set to record high definitionimages at 30 frames s−1. At each site, 9 cameras werepositioned 1 to 2 m inside the seaward edge of theforest (‘seaward zone’), at the edge adjacent to theestuary main channel, and in an area of the forestfirst flooded by incoming tides. The forest edge wasdefined as having essentially continuous mangroveroot structure, such as beds of A. marina pneumato -phores or Rhizophora spp. prop roots. A second set of9 cameras was deployed the same distance inside thelandward edge (‘landward zone’) of the forest. Thelogistical difficulty in deploying cameras at the land-ward edge of mangrove forests backed by naturalterrestrial forest meant that there were limits to howfar apart the cameras could be placed; thus, cameraswere positioned haphazardly, most >50 m apart, andat a minimum of at least 20 m apart. This spacing didnot appear to compromise sample independencesince the faunal composition recorded by adjacentcameras was no more similar than that between the2 most distant cameras at a given site.
UVCs were placed in small gaps among the roots/pneumatophores with no obstructions to the field ofview within at least 50 cm of the camera lens, andwere directed towards the interiors of the forests toprevent sighting of fish outside forest edges. Cam-eras were deployed so that their horizontal orienta-tion was parallel with the substrate, the lower edge ofthe lens was 7 cm above the substrate, and the sub-strate horizon was two-thirds of the way down thefield of view. UVCs were deployed and left to recordduring flood tides. Seaward zone cameras were de -ployed as the water first entered the mangrove forestat depths less than 8 cm (the depth at which cameralenses were fully submerged), were left to recorduntil the camera batteries were discharged (2 to 3 h,depending on light conditions), and retrieved at thecommencement of the ebb tide. Seaward zone cam-eras were deployed from a small dinghy and land-ward cameras from the shore following the same protocols as seaward cameras. Information aboutmangrove species, substrate type and forest widthwas recorded at each camera position.
Sampling was confined to spring tides to ensurethere was sufficient tidal flooding for fish to utilisemangroves. Video recording was not attempted ifsecchi depth was <1 m (which was always the casewhen spring high tides exceeded 3 m, and occurredat other times due to the presence of suspended sed-iment caused by wave action). Maximum waterdepths over the cameras at the 7 sites were: Cassady
Creek, 1.15 m; Deluge 1, 1.50 m; Deluge 2, 1.79 m;Deluge 3, 1.10 m; Mulligan Creek, 0.85 m; VictoriaCreek 1, 0.59 m; Victoria Creek 2, 0.85 m. Wet andpost-wet season conditions were generally too turbidfor video sampling; therefore, sampling was under-taken through the pre-wet period. This is a period ofhigh recruitment in Australia’s tropical estuaries,when fish densities and species richness are greatest(Robertson & Duke 1990a, Sheaves et al. 2010), thusproviding the greatest potential to determine man-grove utilisation.
Data extraction from videos
Of 126 videos collected, 27 were omitted due topoor visibility, resulting in a total of 50 seaward and49 landward videos used in the analysis. Useablevideos had visibilities ranging from 50 to 210 cm,with the majority around 100 cm; visibility in theunusable videos was <50 cm and caused by condi-tions such as unfavourable patterns of shade, turbid-ity caused by the activities of stingrays or the wash ofpassing boats, or unacceptable restrictions to thefield of view such as floating debris lodging acrossthe camera lens.
Videos were viewed in media players (e.g. VLCplayer) capable of slow speed replay and image opti-misation (contrast, brightness, colour saturation) toaid in fish identification. For data extraction, videoswere subdivided into 1 min intervals commencingonce the camera lens was first fully submerged(8 cm); the occurrence of each fish taxon present ineach 1 min of video was recorded. Data extractionwas limited to recording presences because suchdata are usually more robust than fully quantitativeapproaches (Manley et al. 2004), particularly whereindices of abundance are likely to be unstable(Legendre & Legendre 2003), and because they treatspecies with different patterns of behaviour (e.g.schooling versus non-schooling) in equivalent ways(Sheaves & Johnston 2009). Identification of fish wasundertaken by 2 researchers experienced in localfish identification and validated by exchangingvideos between recorders and cross-referencing re -sults. When fish were too indistinct to be identified,or if discrepancies in identification could not be re -solved, those occurrences were recorded as ‘fish’.Some fish (particularly blenniids and many gobiids)were allocated to species-level morphotypes eventhough their species could not be determined fromvideo examination. None of these were common fau-nal components (only 148 records out of >23 000).
169

Mar Ecol Prog Ser 549: 167–182, 2016
Ontogenetic stage was recorded where it could bedetermined from colour or morphology. For most species, almost all individuals were in a single onto-genetic group so the information was not utilised inanalyses. However, although Acanthopagrus spp.juveniles did not possess characteristics that wouldenable them to be allocated to species and thus wereonly identified to genus, they did have distinct pat-terning which allowed them to be reliably distin-guished from more mature individuals. Most largerAcanthopagrus spp. individuals could be reliablyidentified as either A. australis or A. pacificus. Un -identifiable larger Acanthopagrus spp. were onlyincluded in analyses of total fish occurrences.
Data analysis
A ranking procedure was used to develop an indexof the extent of mangrove utilisation by the differentfish. This comprised all identified taxa, includingspecies and species-level morphotypes. Species wereranked for each site based on the proportion of 1 minintervals in which that species occurred, summedacross all videos at each site, and the mean rank cal-culated for the top 10 species at any site.
Fish composition
Fish composition was compared among sites, zones(seaward vs. landward), substrate type (rock, sand,silt, mud) and dominant mangrove vegetation type(Rhizophora spp., A. marina, Bruguiera spp., O. octo -donta, A. corniculatum), using a multivariate classifi-cation and regression tree (mvCART) (De’ath 2002)based on Bray-Curtis dissimilarities. Dependent vari-ables were the proportion of 1 min intervals eachspecies was present in each video. Only species thatoccurred in >5% of videos were included. Data were4th root transformed to reduce the impact of extremevalues, and row-standardised to convert the data intoproportions for each video. This focussed interpreta-tion on a definition of ‘composition’ such that videoswith similar profiles of species proportions wereinterpreted as having similar compositions. ThemvCART analysis was conducted using the ‘mvpart’routine (De’ath 2007) in R, and fitted using 10-foldcross validation. Tree selection was based on min-imising cross validation error, with the final mvCARTtree selected as the most common 1-SE tree (i.e. thesmallest tree within 1 standard error of the tree withminimum cross validation error) from 100 replicate
runs. Species richness was analysed using a univari-ate classification and regression tree (uvCART) onthe same explanatory variables and using the sametree-fitting procedure.
Pattern of mangrove forest use
The extent of the fishes’ penetration into the man-groves over time during the rising tide was investi-gated for the most commonly occurring taxa (spe-cies/morphotypes) in the mangrove videos (i.e. thoseoccurring in >25% of videos), again employinguvCARTs with the fitting procedure described above.The base data were taxon presence min−1 of video.Dependent variables were calculated as the propor-tion of presences min−1 for each 10 min segment ofvideo for each taxon. These data were arcsine trans-formed before analysis. Explanatory variables weresite, zone, substrate type, dominant mangrove vege-tation and maximum water depth (at video retrieval).To investigate temporal patterns in occurrence dur-ing tidal flooding, the analyses were re-run with theaddition of the variable ‘minutes since flooding’. Theanalyses were also re-run using only the landwardsamples and the variables forest width and site, toinvestigate the extent to which the occurrence of dif-ferent species in landward mangroves was influ-enced by mangrove forest width.
Patterns of mangrove use over the rising tide forcommonly occurring taxa were investigated graphi-cally. The large number of profiles (i.e. individualvideos) were summarised by calculating the meannumber of videos in which each taxon occurred foreach minute across all videos (keeping landward andseaward videos separate). The resulting profileswere smoothed using locally weighted regression(LOESS, 1st degree polynomial, sampling proportion0.25; Cleveland & Devlin 1988) to display major pat-terns of fish occurrence over time. The videos were ofdifferent durations because the landward edge of themangroves is flooded for a shorter amount of timethan the seaward edge; therefore, to ensure that thesame number of observations contributed to meannumbers, only videos with durations of ≥110 min forseaward videos (42 of 50 videos; 84%) and ≥90 minfor landward videos (39 of 49 videos; 80%) were ana-lysed. Videos of shorter durations were omitted, andthose of longer durations were truncated at the spec-ified time cut-offs. Only videos in which a species ormorphotype was present were included. Conse-quently, these estimates cannot be related to totalprobability of encounter per minute but rather are
170
Sheaves et al.: Use of mangroves by fish
focussed on understanding patterns of utilisationwhen the taxon was present in the mangrove forest.Patterns of use were also investigated for barramundiLates calcarifer, a species of high commercial andrecreational value that is widely reported to usenorthern Australia’s estuaries as nurseries, but thatoccurred in only 7% of videos. Information on its useof mangroves was analysed due to its high economicvalue, but should be interpreted with caution due tothe small sample size.
RESULTS
Faunal compositional
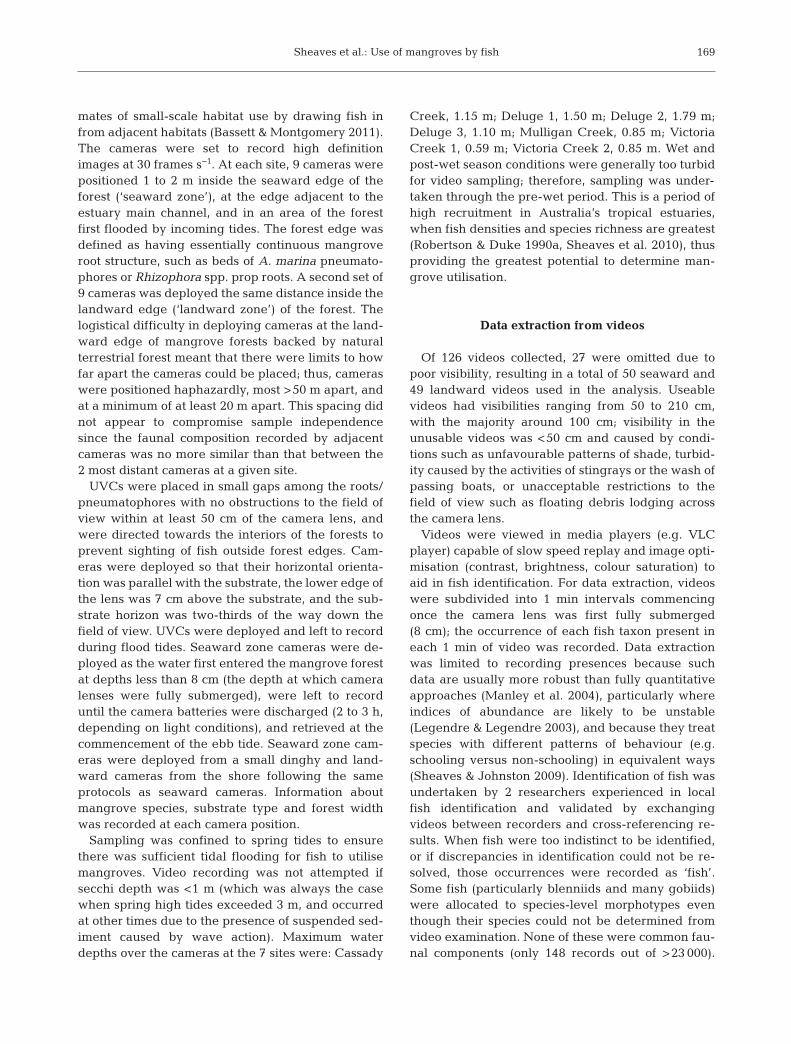
Approximately 96.6% of fish observed in the man-grove videos (23 765 total records) could be confi-dently identified to at least genus level, and com-prised 67 taxa (see Table S1 in the Supplement atwww. int-res. com/ articles/ suppl/ m549 p167_ supp.pdf). However, a few species occurred in a high per-centage of the videos (Table 1). The sparid Acantho-
pagrus pacificus made the most extensive use ofmangroves, occurring in 89% of videos and rankingin the top 10 of proportional duration observed at all7 sites (Table 1). Juvenile Acanthopagrus spp. exhib-ited similar use, occurring in 81% of videos and alsoranking in the top 10 at all sites. Although identifiedat all sites, a second sparid, A. australis, showed alower level of utilisation, occurring in only 47% ofvideos and ranking in the top 10 in only 5 sites. Otherfish species that used mangroves extensively in -cluded Gerres filamentosus, G. oyena, Pseudomugilsignifer, and Lutjanus argentimaculatus.
Fish composition varied greatly among sites, withdistinct assemblages differentiating 4 groups: Cas-sady Creek and Victoria Creek 2, Deluge 3 and Vic-toria Creek 1, Mulligan Creek, and Deluge 1 and 2(Fig. 2). Cassady Creek and Victoria Creek 2 wereparticularly distinct, with substantial contributionsfrom most of the common species. Each of the othersites was dominated by a smaller group of species.Deluge 3 and Victoria Creek 1 were further differen-tiated on the basis of substrate type, with high occur-rences of P. signifer over mud and silt substrates ver-
171
Species Site % of No. of sites Mean No. of sites D1 D2 D3 M V1 V2 C videos present ranking in top 10
Acanthopagrus pacificus 1 2 4 2 2 6 5 89 7 1 7Acanthopagrus spp. juveniles 3 1 2 7 7 3 1 81 7 2 7Gerres filamentosus 4 3 6 4 9 63 7 3 5Gerres oyena 7 5 9 9 2 4 58 6 4 6Pseudomugil signifer 2 4 1 5 6 8 54 6 5 6Lutjanus argentimaculatus 6 7 5 7 51 7 7 4Acanthopagrus australis 8 8 8 9 6 47 7 6 5Toxotes chatareus 10 3 7 44 6 8 3Chelonodon patoca 4 3 40 4 14 2Siganus lineatus 7 8 37 6 10 2Lutjanus russellii 4 9 34 6 9 2Ambassis vachellii 3 1 2 31 6 11 3Lutjanus fulviflamma 5 28 5 13 1Goby sp. 9 (pelagic, spot) 8 9 3 1 22 4 12 4Chelon subviridis 10 8 17 6 15 2Goby sp. 10 (pelagic, line) 1 4 15 3 18 2Terapon jarbua 10 13 3 22 1Redigobius balteatus 5 12 3 25 1Zenarchopterus buffonis 8 10 5 19 1Neoarius graeffei 10 8 2 30 1Lates calcarifer 10 7 4 17 1Goby sp. 7 5 3 2 28 1Psammogobius sp. 10 3 2 31 1Gerres oblongus 6 2 1 40 1
Table 1. Species identified by underwater video cameras that used mangroves most extensively during this study. All speciesthat ranked in the top 10 at any site are shown; sites (D1: Deluge 1; D2: Deluge 2; D3: Deluge 3; M: Mulligan Creek; V1: Victo-ria Creek 1; V2: Victoria Creek 2; C: Cassady Creek ) are listed in order from north to south as per Fig. 1. The ranks (when intop 10) at each site are displayed for each site; the percentage of videos in which a species was present, number of sites pres-ent, mean rank, and number of sites at which a species ranked in the top 10 are also provided. Blank cells indicate the speciesthat did not rank in the top 10 at that site. Note: at Site D2, only 9 taxa were observed, hence rankings are from 1−9

Mar Ecol Prog Ser 549: 167–182, 2016
sus dominance of A. pacificus and Chelonodonpatoca on sand and rock substrates. The only differ-entiation in overall assemblage composition betweenthe seaward and landward zones of the mangroveforest occurred at Mulligan Creek, and was almostentirely attributable to a very high occurrence of anunidentified pelagic goby that was confined mainlyto the seaward part of the site. Species richness alsovaried substantially among sites (Fig. 3), althoughsite grouping was somewhat different. Vegetationtype influenced species richness at Cassady Creekand Victoria Creek, with substantially more speciesin sites with Avicennia marina or Rhizophora spp.than those with Aegiceras corniculatum or Osbornia
172
C (all)V2 (all)
MudSilt
RockSand
D1 (all)D2 (all)
Seaward Landward
D3, V1 D1, D2, M
D1, D2, D3, M, V1
M
Site
Site
Site Substrate
Zone
Acanthopagrus pacificusGerres filamentosus
Gerres oyenaPseudomugil signifer
Lutjanus argentimaculatusAcanthopagrus australis
Toxotes chatareusChelonodon patoca
Siganus lineatusLutjanus russellii
Ambassis vachelliLutjanus fulviflamma
Pelagic goby (spot-tail)Scylla serrataLiza subviridis
Pelagic goby (mid-line)
302520151050
4035302520151050
20100
20100
50403020100
403020100
3020100
3020100
Fig. 2. Fish use of mangrove sites in north-eastern Australia (see Table 1 for definitions of site abbreviations). Multivariateclassification and regression tree (mvCART) analysis was based on Bray-Curtis dissimilarities, and dependent variables werethe percentage of minutes that each species seen in >5% of videos occurred in each video. Data were 4th root transformed toreduce the impact of extreme values and row standardised to convert to proportions for each video. Explanatory variableswere compared among sites, zones (seaward vs. landward), substrate type (rock, sand, silt, mud) and dominant mangrove veg-etation type (Rhizophora spp., Avicennia marina, Bruguiera spp., Osbornia octodonta, Aegiceras corniculatum). Bar plots un-der each terminal node and adjacent to non-terminal site nodes indicate mean (±SE) % of minutes present for each species.
Species in each bar plot from left to right are shown from top to bottom in the key
Fig. 3. Univariate regression tree for species richness of man -grove fauna in north-eastern Australia. Explanatory variablesare the same as in Fig. 2. Bar graphs below the terminalbranches indicate the distribution of species richness valuesat that node. Numbers below bars are estimates of mean spe-cies richness for each node; numbers in brackets indicate the
number of samples in each node
Sheaves et al.: Use of mangroves by fish
octodonta. More species were found in the seawardfringe of the mangroves in Deluge 2, Deluge 3 andMulligan Creek than in Deluge 1 or Victoria Creek 1.
Estuary fauna that use mangroves
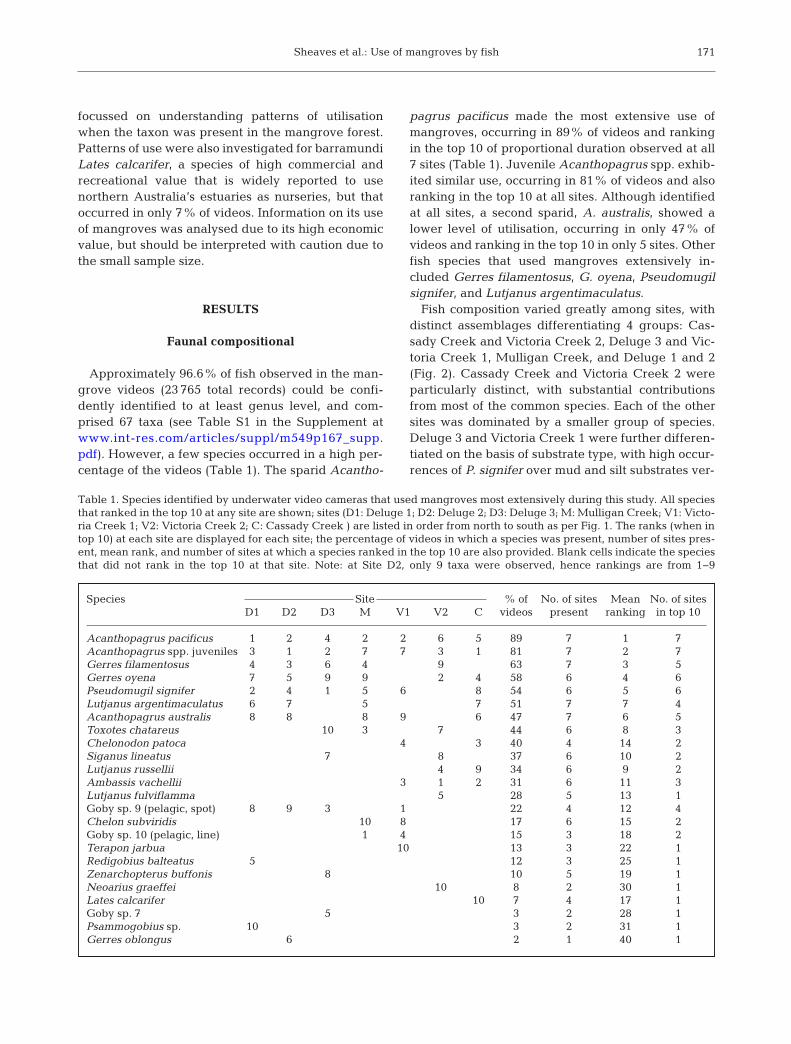
Eleven studies from north-east Queensland en -com passing 48 different estuaries provided dataenabling the ranking of fish catches based on somemeasure of catch per unit effort (CPUE) from a spec-ified gear type for 234 named species. The 25 speciesthat ranked highest in occurrence on our videos wereall reported from at least one of those previous stud-
ies (Fig. 4), with the exception of Redigobius baltea-tus, which was probably not identified to species inprevious studies (Parvigobius spp., a synonym forRedigobius, was reported from seine net catches in astudy from Trinity Inlet; Blaber 1980). Despite simi-larities with previously reported fauna, the rankingsfrom our mangrove videos differed substantially fromthose made using fishing gears that sampled themain estuaries. The characteristics of gill nets andfish traps (Fig. 4c,e) result in the targeting of particu-lar components of the fish assemblage, at least partlyexplaining the differences in rankings. In particular,the ability of the fish to escape through mesh nettingmeans that many of these gears most probably
173
Fig. 4. Comparisons of species rankings in mangrove videos to rankings in previous north-east Queensland estuarine studies.Bars indicate ranks determined by (a) combined gears, (b) cast nets, (c) gill nets, (d) seine nets and (e) fish traps of the top 25ranked species in the mangrove videos. Numbers in brackets next to species names indicate rankings in videos; numbers insquare brackets indicate the number of estuaries that contribute to the estimates for each gear type. The 8 estuaries contributing
to estimates for (a) all included gill nets plus at least 1 other gear

Mar Ecol Prog Ser 549: 167–182, 2016
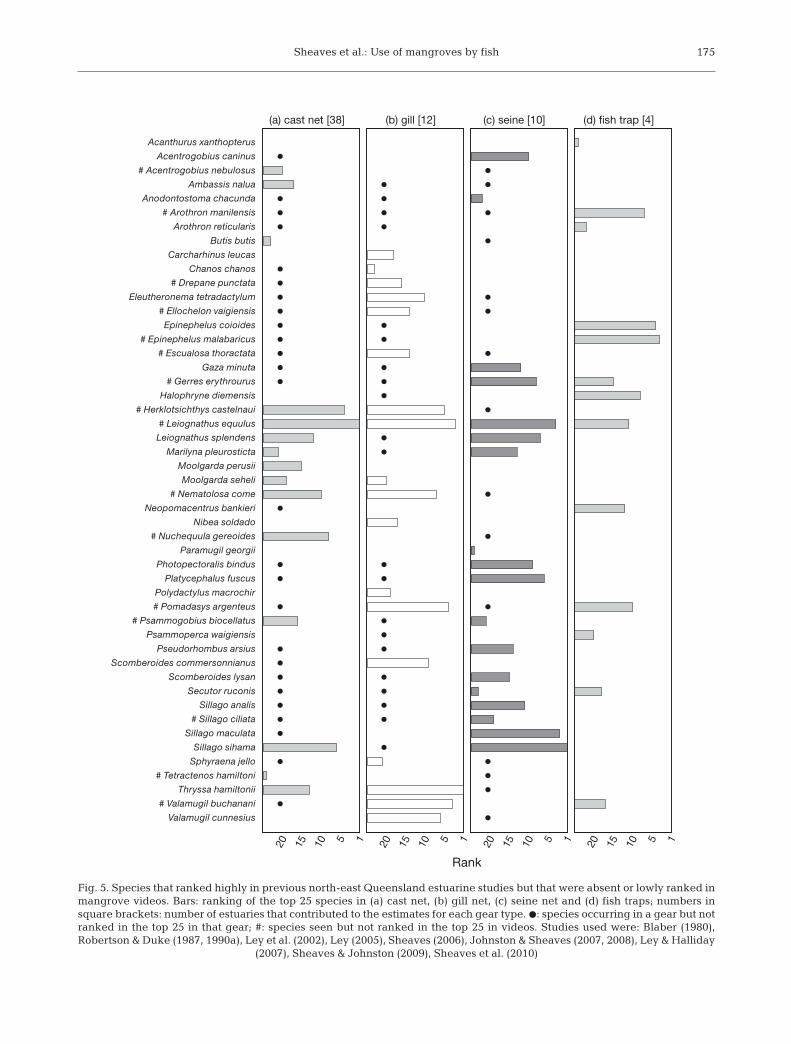
underestimate small species and juveniles that likelyuse mangroves extensively. However, this does notex plain the divergent rankings between the videosand cast and seine nets (Fig. 4b,d), which use meshsizes small enough to catch most small fish (cast nets:5 to 6 mm mesh; seine nets: all except 1 case, 2 to 12mm mesh). Rather, it suggests that some speciesmake extensive use of mangroves, while other com-mon estuarine species tend to remain in the estuarymain channel. This is clearly demonstrated by thenumber of species that ranked highly in samples col-lected from the main estuaries, but were absent orlowly ranked in mangrove videos (Fig. 5). Of particu-lar note:
• Only 2 sightings of Epinephelus malabaricuswere recorded in mangrove videos, even thoughE. malabaricus and its congener E. coioides are com-mon components of fish trap catches along steepmangrove banks
• Planktivores (such as Herklotsichthys castelnauiand Escualosa thoractata) that ranked highly in netcatches were rarely seen in mangrove videos
• Benthopelagic micro-invertebrate feeders, suchas Leiognathus equulus and Nuchequula gerreoides,which comprise a large part of net catches in north-east Queensland estuaries, were rarely encounteredin mangroves
• Although a number of species of Mugilidae rankhighly in estuarine net catches, there were relativelyfew occurrences in mangrove videos, and those didnot rank highly. Other detritivores that are commonin the regions estuaries, such as Anodontostoma cha-cunda, Nematalosa come and Chanos chanos, werenever seen in mangrove videos
• Shallow water predators (such as Platycephalusfuscus) that might be expected to enter shallow man-grove waters to feed were absent from mangrovevideos
• Although cursorial piscivores such as the caran -gids Caranx spp. and Scomberoides spp. were com-mon in studies of the main estuary body, they wereabsent or low ranking in videos
• While 4 species of Sillaginidae are common com-ponents of the fauna of shallow estuarine banks innorth-eastern Australia, only 1 species, S. ciliata, wasidentified in the videos, and then only at 1 site.
Extent of fish penetration through the mangroves
In line with the results of the mvCART and theanalysis of species richness, the species-by-speciesunivariate analyses of occurrences per 10 min block
reflected a high level of variation in the presence ofcommonly occurring mangrove fish between sites,with a primary site split for all taxa (Table 2). For allfish combined, and for 6 of the 13 taxa occurring in>25% of videos, there was a greater proportion ofoccurrences in seaward versus landward videos,although this effect was generally only apparent forsites with the highest proportion of occurrences. Thistrend of higher abundance in seaward videos isreflected in the overall percentage of videos in whichthese taxa occurred; of the 13 commonly occurringmangrove fish, only the 2 Gerres species occurred inmore landward than seaward videos.
In line with the full data set, when landward sam-ples were analysed separately the primary effectswere differences among sites. Width of mangroveforest was only important for 2 species: C. patoca andSiganus lineatus, both of which occurred more oftenin videos from narrow (<12 m) mangrove forests(Table 3). Other species showed no differences in theproportion of time they were present in relation tomangrove forest width.
Temporal patterns of mangrove use
When the variable ‘minutes since flooding’ was in-cluded, uvCART analysis indicated variations in oc-currence over time for all commonly occurring fishexcept S. lineatus and Toxotes chatareus (Table 2).For most variables, the addition of minutes only pro-duced subsidiary splits — meaning variation overtime was not always detectible in all sites or zones.However, for P. signifer the model was modified sub-stantially, with minutes forming the primary split, in-dicating a general difference in presence over timewith occurrences greatest in the first 20 min of man-grove flooding regardless of site or location of thecamera (seaward or landward). The pattern ofhighest occurrences early in the flooding period (20 to30 min) was also apparent for juvenile Acantho -pagrus spp. and C. patoca. Most other species de -layed arrival until flooding was more extensive, andthus were generally not common in the first 10 to20 min.
The smoothed profiles of most fish followed one of2 patterns of occurrence over the tide. One group re -mained at relatively constant numbers once theyentered the mangroves during the first 20 min offlooding, with similar patterns in both seaward andlandward zones (Fig. 6a, Fig. S1 in the Supplement).This group was designated ‘foragers’, because mostare known to feed extensively on prey found in man-
174
Sheaves et al.: Use of mangroves by fish 175
(a) cast net [38]
20 15 10 5 1
Valamugil cunnesius
# Valamugil buchanani
Thryssa hamiltonii
# Tetractenos hamiltoni
Sphyraena jello
Sillago sihama
Sillago maculata
# Sillago ciliata
Sillago analis
Secutor ruconis
Scomberoides lysan
Scomberoides commersonnianus
Pseudorhombus arsius
Psammoperca waigiensis
# Psammogobius biocellatus
# Pomadasys argenteus
Polydactylus macrochir
Platycephalus fuscus
Photopectoralis bindus
Paramugil georgii
# Nuchequula gereoides
Nibea soldado
Neopomacentrus bankieri
# Nematolosa come
Moolgarda seheli
Moolgarda perusii
Marilyna pleurosticta
Leiognathus splendens
# Leiognathus equulus
# Herklotsichthys castelnaui
Halophryne diemensis
# Gerres erythrourus
Gaza minuta
# Escualosa thoractata
# Epinephelus malabaricus
Epinephelus coioides
# Ellochelon vaigiensis
Eleutheronema tetradactylum
# Drepane punctata
Chanos chanos
Carcharhinus leucas
Butis butis
Arothron reticularis
# Arothron manilensis
Anodontostoma chacunda
Ambassis nalua
# Acentrogobius nebulosus
Acentrogobius caninus
Acanthurus xanthopterus
(b) gill [12]
Rank
20 15 10 5 1
(c) seine [10]
20 15 10 5 1
(d) fish trap [4]
20 15 10 5 1
Fig. 5. Species that ranked highly in previous north-east Queensland estuarine studies but that were absent or lowly ranked inmangrove videos. Bars: ranking of the top 25 species in (a) cast net, (b) gill net, (c) seine net and (d) fish traps; numbers insquare brackets: number of estuaries that contributed to the estimates for each gear type. d: species occurring in a gear but notranked in the top 25 in that gear; #: species seen but not ranked in the top 25 in videos. Studies used were: Blaber (1980),Robertson & Duke (1987, 1990a), Ley et al. (2002), Ley (2005), Sheaves (2006), Johnston & Sheaves (2007, 2008), Ley & Halliday
(2007), Sheaves & Johnston (2009), Sheaves et al. (2010)

Mar Ecol Prog Ser 549: 167–182, 2016
groves (A. australis, A. pacificus, L.argentimaculatus, T. chatareus) orwere observed spending a large partof their time in mangroves pickingfrom the substrate surface (G. fila-mentosus, G. oyena) or mangrovepneu ma to phores and roots (S. linea-tus). Consequently, this profile ap -pears to be characteristic of speciesdispersing to feed throughout themangrove forest. In contrast to mostother foragers, A. pacificus had aconsistently lower presence in land-ward zones, suggesting it spentmore time in the forest proper ratherthan penetrating through to higherintertidal levels. G. fila mentosus ex -hibited a slight variation, with initial -ly high occurrences in both seawardand landward zones, suggesting aninitial mass arrival followed by dis-persal as more intertidal area be -came available. The forager patternwas generally underpinned by asubstantial number of videos rang-ing from 17−37 for seaward zonesand 10−30 for landward zones.
A second group, ‘early arrivers’(Fig. 6b, Fig. S2), comprising juve-nile Acanthopagrus spp., P. signiferand C. patoca, arrived as soon asthe water was deep enough to coverthe camera lens (i.e. 8 cm), thendeclined over time. These were allsmall fish (maximum length of P.signifer : 7 cm; Froese & Pauly 2014),juveniles in the case of Acanthopa-grus spp., and all individuals thathad marking patterns consistentwith small size in the case of C.patoca. The details of the patternsof occurrence varied for the 3 earlyarrivers. Although the number ofjuvenile Acanthopagrus spp. de -clined substantially in both seawardand landward zones, they still oc -curred in both areas throughout theflood tide (Fig. S2). However, thedecline in landward zones wasmuch less than in seaward zones, tothe extent that mean presenceswere consistently twice as high inlandward zones from 40 min on -
176
Sp
ecie
s
%
of
vid
eos
pre
sen
t
Pri
mar
y sp
lit
(alw
ays
‘sit
e’)
Z
one
spli
t
M
inu
tes
Sea
war
d
Lan
dw
ard
All
fis
h (
7)
1
00
1
00
C, D
2, D
3, V
2 >
D1,
M, V
1
F
or C
, V2:
sea
war
d (
0.79
) >
lan
dw
ard
(0.
44)
>15
Aca
nth
opag
rus
spp
. ju
ven
iles
(5)
82
79
C, D
1, D
2, D
3, V
2 >
M, V
1
−
<
45 p
arti
cula
rly
<25
Aca
nth
opag
rus
aust
rali
s (3
)
6
4
30
C >
D1,
D2,
D3,
M, V
1, V
2
For
C: s
eaw
ard
(0.
05)
> l
and
war
d (
0.00
1)
−A
can
thop
agru
s p
acif
icu
s (8
)
9
4
83
C, D
1, D
2, M
, V2
> D
3, V
1
For
C, D
1, D
2, M
, V2:
sea
war
d (
0.04
) >
lan
dw
ard
(0.
01)
>25
Am
bas
sis
vach
elli
i (4
)
36
26
V
2 >
C, D
1, D
2, D
3, M
, V1
For
C, V
2: s
eaw
ard
(0.
49)
> l
and
war
d (
0.01
)
>
15C
hel
onod
on p
atoc
a (3
)
48
32
C
> D
1, D
2, D
3, M
, V1,
V2
−
<
35G
erre
s fi
lam
ento
sus
(5)
58
67
D
2 >
C, D
1, D
3, M
, V1,
V2
−
<
35 b
ut
>5
Ger
res
oyen
a (6
)
5
4
61
C, V
2 >
D1,
D2,
D3,
M, V
1
F
or C
, V2:
sea
war
d (
0.08
) >
lan
dw
ard
(0.
02)
>15
Lu
tjan
us
arg
enti
mac
ula
tus
(3)
6
0
40
C >
D1,
D2,
D3,
M, V
1, V
2
−
>35
Lu
tjan
us
fulv
ifla
mm
a (4
)
4
2
14
V2
> C
, D1,
D2,
D3,
M, V
1
F
or V
2: s
eaw
ard
(0.
06)
> l
and
war
d (
0.00
3)
>
15L
utj
anu
s ru
ssel
lii
(5)
50
18
C
, V2
> D
1, D
2, D
3, M
, V1
F
or C
, V2:
sea
war
d (
0.04
) >
lan
dw
ard
(0.
001)
>25
Pse
ud
omu
gil
sig
nif
er (
6)
5
6
51
D3
> C
, D1,
D2,
M, V
1, V
2
−
<25
a
Sig
anu
s li
nea
tus
(2)
46
28
C
, D3,
V2
> D
1, D
2, M
, V1
−
T
oxot
es c
hat
areu
s (2
)
52
36
M
, V2
> C
, D1,
D2,
D3,
V1
−a I
n c
ontr
ast
to t
he
oth
er m
odel
s w
her
e it
for
med
ad
dit
ion
al s
ub
sid
iary
sp
lits
, ‘m
inu
tes’
for
med
th
e p
rim
ary
spli
t fo
r P.
sig
nif
ier,
tak
ing
pri
mac
y ov
er l
ocat
ion
sp
lits
Tab
le 2
. Un
ivar
iate
cla
ssif
icat
ion
an
d r
egre
ssio
n t
ree
(uvC
AR
T)
anal
yses
of
fish
pre
sen
ce i
nsi
de
man
gro
ve f
ores
ts i
n n
orth
-eas
t Q
uee
nsl
and
, sh
owin
g t
he
pro
por
tion
of
pre
sen
ces
per
10
min
of v
ideo
for
spec
ies/
gro
up
s oc
curr
ing
in >
25%
of v
ideo
s. F
or e
ach
an
alys
is, u
vCA
RT
incl
ud
es s
ite
(see
Tab
le 1
for
site
ab
bre
viat
ion
s) a
nd
zon
e (s
ea-
war
d o
r la
nd
war
d)
as e
xpla
nat
ory
vari
able
s. N
um
ber
s in
bra
cket
s af
ter
spec
ies
ind
icat
e re
gre
ssio
n t
ree
size
(i.e
. nu
mb
er o
f te
rmin
al b
ran
ches
). S
ite
alw
ays
form
ed t
he
pri
mar
y sp
lit
in e
ach
tre
e; c
olu
mn
s 2
and
3 i
nd
icat
e th
e p
rop
orti
on o
f vi
deo
s in
eac
h z
one
that
eac
h s
pec
ies
gro
up
was
pre
sen
t. W
hen
a z
one
spli
t oc
curr
ed, t
he
site
s at
wh
ich
the
spli
t occ
urr
ed a
nd
the
mea
n p
rop
orti
on o
f min
ute
s th
e sp
ecie
s g
rou
p w
as p
rese
nt i
n e
ach
zon
e is
sh
own
. For
exa
mp
le, ‘
All
fish
’ in
dic
ates
a s
pli
t am
ong
zon
es a
tS
ites
C a
nd
V2,
wit
h fi
sh p
rese
nt 7
9%
of t
he
tim
e in
the
seaw
ard
an
d 4
4%
in th
e la
nd
war
d z
one.
Th
e C
AR
Ts
wer
e re
-ru
n a
fter
ad
din
g m
inu
tes
as a
n e
xpla
nat
ory
vari
able
;w
hen
th
is f
orm
ed a
sp
lit,
th
e ti
me
fact
or l
evel
s le
adin
g t
o th
e te
rmin
al b
ran
ch w
ith
hig
hes
t p
rop
orti
on o
f p
rese
nce
s is
in
dic
ated
(n
ote
som
e va
riab
les
hav
e 2
‘min
ute
’sp
lits
); e
.g. A
can
thop
agru
ssp
p. j
uve
nil
es f
orm
ed 2
sp
lits
bas
ed o
n m
inu
tes,
ind
icat
ing
gre
ater
occ
urr
ence
in t
he
firs
t 45
min
of
vid
eos,
esp
ecia
lly
hig
h in
th
e fi
rst
25 m
in.
–: m
odel
s w
her
e th
ere
wer
e n
o zo
ne
spli
ts

Sheaves et al.: Use of mangroves by fish 177
Species Site splits Forest width split
All fish No effects
Acanthopagrus spp. (small) (3) (2) C, D1, D3, V2 > D2, M, V1 D2 > M, V1
Acanthopagrus australis (2) (1) C, D2, M > D1, D3, V1, V2
Acanthopagrus pacificus (2) (1) D1, D2, V2 > C, D3, M, V1
Ambassis vachellii (2) (1) C, V1, V2 > D1, D2, D3, M
Chelonodon patoca (3) (1) C, V2 > D1, D2, D3, M, V1 Greatest occurrences in <10.5 m
Gerres filamentosus (2) (1) D1, D2, D3 > C, M, V1,
Gerres oyena No effects
Lutjanus argentimaculatus No effects
Pseudomugil signifer (4) (3) D1, D2, D3 > C, M, V1, V2 D3 > D1, D2 C > M, V1, V2
Siganus lineatus (4) (2) C, D1 > D2, D3, M, V2, V1 Greatest occurrences in <11.5 m D3, V2 > D2, M, V1
Toxotes chatareus (2) (1) M, V2 > C, D1, D2, D3, V1
Table 3. Univariate classification and regression tree (uvCART) analyses of site and forest width effects on fish presence in thelandward zone of mangrove forests in north-east Queensland. Data are the proportion of minutes present per video for speciesoccurring in >25% of landward videos. Numbers in brackets following species names indicate regression tree size; numbers inbrackets in ‘Site splits’ column indicate the number of splits (‘site’ always formed the primary split). See Table 1 for site
abbreviations. When present, splits based on forest width are described
Fig. 6. RepresentativeLOESS- smoothed profilesof mangrove utilisation foreach of 3 groups of species:(a) foragers, (b) early ar-rivers, and (c) variants.LOESS fits are 1st degreepolynomials with a sam-pling proportion of 0.25.Note: only videos where aspecies or species groupwas present are included inthese analyses. Numbers inbrackets: number of videoscontributing to the profile(first number: seawardzones; second: landward).Profiles for each of the 7 for-ager species are presentedin Fig. S1 in the Supple-ment at www.int-res. com/articles/ suppl/ m549 p 167 _supp.pdf, the 3 early ar-rivers in Fig. S2, and the 3
variants in Fig. S3

Mar Ecol Prog Ser 549: 167–182, 2016178
wards. This pattern suggests that juvenile Acantho -pagrus spp. moved into mangroves early in the tideand spread throughout the forest, but compared totheir larger conspecifics and congeners, made moreextensive use of landward than seaward zones asthe duration of flooding increased. P. signifer(Fig. 6b) exhibited a more extreme pattern, withhigher early occurrences in both landward and sea-ward zones followed by a more precipitous decline,with numbers dropping to essentially zero at sea-ward sites after about 1 h but re maining at low lev-els in landward zones. P. signifer appeared to passthrough the forest rapidly, following the advancingtide and continuing to the extreme landward fringeof the mangroves above our landward cameras, orfurther on to shallow, high intertidal areas landwardof the mangroves while still using the landwardfringe to some extent. C. patoca (Fig. S2) demon-strated a similar pattern as P. signifer, but with alower rate of occurrence and no indication of re -maining in landward mangrove edges higher in thetide, suggesting that few fish remained in the man-groves once water was deep enough for them tomove to higher intertidal areas. The early arriverpattern was generally underpinned by a substantialnumber of videos ranging from 15−32 for seawardzones and 13−26 for landward zones.
A number of profiles did not align with either theforager or early arriver patterns. These ‘variants’(Fig. 6c, Fig. S3) included 2 species that occurred in>25% of videos as well as Lates calcarifer. Variantprofiles were generally based on a smaller number ofvideos than those of foragers and early arrivers, particularly for landward sites. Ambassis vachellii(Fig. 6c) showed a progressive increase in occur-rence in seaward zones over the first hour followingflooding, then stabilised at a high level. This patterncan be interpreted as fish slowly moving into thefront edge of the mangrove forest and then remain-ing at that location. A. vachellii penetrated to land-ward zones in some cases, but for the most partarrived very late in the tide. The number of Lutjanusrussellii (Fig. S3) steadily increased at seaward sitesover time but there was little activity at the landwardedge. This pattern suggests gradual entry of fish intothe seaward part of the mangrove forest but with lit-tle penetration to the back of the forest. L. calcarifer(Fig. S3) was rarely seen in videos, and then only atseaward sites, late in the tide when water depthswere greatest. This was also the case for many otherspecies such as Caranx spp., Pomadasys spp., Dre -pane punctata, Selenotoca multifasciata and Plecto -rhinchus gibbosus.
DISCUSSION
Complexity of estuarine mangrove use by fish
Only a small number of species used the mangroveforests extensively; these were primarily sparids, lut-janids, gerreids and pseudomugilids. Important trop-ical estuary species such as barramundi were rarelydetected in the mangroves, at least during the daywhile the UVCs were operating. The species that didenter the mangroves represent a restricted subset ofthe species found in tropical estuary habitats in theregion (Blaber 1980, Robertson & Duke 1990a, Ley2005, Sheaves & Johnston 2009). This contrasts withthe commonly held belief that many or most tropicalestuarine fish use mangroves extensively (Faunce &Serafy 2006). Our rankings of species’ importancebased on this video study were very different fromthose obtained from previous studies using gill, seineor cast nets that focussed on the main body of theestuary (predominantly at low tide), with many spe-cies common in net catches apparently making littleuse of mangroves. Previous netting surveys, con-ducted in the same estuaries investigated here, haveshown that many species track the shallow edge onthe rising tide and then disappear from net catches inopen waters once the mangrove forest floods (John-ston & Sheaves 2008), suggesting use of the man-grove forest by these species. It is possible that someestuarine species do use mangroves more often dur-ing those times when our video method could not beused (e.g. during larger spring tides, at night). How-ever, the previous netting surveys (Johnston &Sheaves 2008) showed similar patterns of fish move-ment across a wide range of conditions, includingequivalent conditions to the current sampling, yetfew of these fish were seen even 1 m inside the man-grove edge during the present study. This suggeststhat these species probably remain along the outsideedge of the mangrove fringe over the top of the tide.
Mangroves as feeding and refuge sites
A number of the absences and near absences offish from mangroves seem counterintuitive, and sug-gests the need to reconsider the role of mangroves asfeeding or refuge sites. For instance, there were only2 sightings of Epinephelus malabaricus in our man-grove videos and none of its congener E. coioides,even though both are among the most common spe-cies in tropical estuary fish trap catches (Sheaves1996), and are known to feed extensively on man-

Sheaves et al.: Use of mangroves by fish 179
grove-associated sesarmid crabs (Sheaves & Molony2000). This discrepancy may be explained by anunexplored linkage to mangrove forests. Epineph-elus spp. are most common along steep mangrovebanks (Sheaves 1996) where sesarmid burrow en -trances are exposed by bankside erosion. Moreover,the diets of Epinephelus spp. include more non-sesarmid crabs (e.g. Xanthidae, Ocypodidae) thanother mangrove crab feeders (Sheaves & Molony2000). Consequently, it seems likely that Epineph-elus spp. capture the sesarmid crabs they consumefrom the exposed burrows that are common alongsteep erosional banks, without actually entering themangrove forest. In contrast, Lutjanus argentimacu-latus, another mangrove crab feeder (Sheaves & Mo -lony 2000) that focuses more specifically on sesarmidcrabs, was common in the mangrove videos. It seemslikely that Epinephelus spp. could benefit from man-groves, not by entering them to feed but by feedingoutside the mangrove forest proper on crabs derivingtheir nutrition from mangrove forests.
Other taxa with unusually low occurrences withinmangroves reinforce the importance of understand-ing the small-scale detail in the way fish use man-grove systems. Planktivores, such as Herklotsichthyscastelnaui and Escualosa thoracta that consistentlyrank highly in net catches (Robertson & Duke 1990a,Sheaves & Johnston 2009), were rarely seen in man-grove videos. These are extremely abundant mem-bers of north-eastern Australian estuarine fauna.Although these species are found at highest densitiesin themain body of the estuary they do occur alongmangrove margins (Johnston & Sheaves 2008) sowere expected to be common, at least in seawardzone videos. Similarly, benthopelagic micro-inverte-brate feeders such as Leio gnathus equulus andNuchequula gerreo ides, which comprise a large partof net catches in north-east Queensland estuaries(Robertson & Duke 1990a, Sheaves & Johnston 2009),were rarely en countered in mangroves even thoughthey congregate along edges at low tide when themangroves are not flooded (Johnston & Sheaves2008). It may be that these species entered man-groves late in the tide and remained in surfacewaters out of the video field of view, although thealmost complete lack of detection argues against thisexplanation since these species tend to be distributedthroughout the water column. Apparently, neithergroup of micro-invertebrate feeders enter mangrovesto feed, possibly in re sponse to low prey availability;plankton densities are highest in the main body ofthe estuary (Robertson et al. 1988) and other smallinvertebrate benthic prey occur in highest abun-
dances in mid intertidal areas outside the mangrovefringe (Dittmann 2000). However, there may be sub-stantial temporal effects at play. Many planktonfeeding fish forage extensively on crab larvae whenthey are available (Robertson & Duke 1990b), andthey may enter mangroves at these times. On theother hand, it may be more profitable for them toremain outside the forest and feed on the outwellingof mangrove crab larvae originating from the forest,again providing a connectivity link to the mangroveforest and mangrove productivity without necessarilyentering the forest itself.
Other groups that are common in the main part ofthe estuary but occurred relatively rarely in mangrovevideos support the idea of more complex linkages be-tween fish, mangroves and mangrove estuaries. Al-though Mugilidae rank highly in estuarine netcatches (Ley 2005), relatively few individuals weredetected in mangrove videos, while other commondetritivores (e.g. Anodontostoma chacunda, Nemat-alosa come and Chanos chanos) were not seen at all.This suggests that there is little acquisition of detritusby fish within these north-eastern Australian man-groves. Similarly, Sillaginidae (shallow water ben-thos-feeding specialists) (Wilson & Sheaves 2001)were rarely observed in mangrove videos, suggestingthat they remained in intertidal areas outside themangroves where benthic prey abundances are high-est (Ditt mann 2000) during high tide. The situation intropical north-eastern Australia is quite different fromthat of sub-tropical Australia, where both mugilidsand sillaginids are among the most abundant man-grove fish (Morton 1990, Halliday & Young 1996), em-phasising spatial differences in patterns of utilisationby fish, and potentially in ecological functioning.
Not only does the role for mangroves as direct feed-ing sites appear much less important than previouslythought, but the nature of the species that are absentimplies that we may need to reconsider the way inwhich mangroves provide refuge. Many of thespecies that were most common along mangroveedges at low tide (e.g. Leio gnathidae, Clupeidae)(Johnston & Sheaves 2008) did not make regular useof mangroves at high tide. Similarly, juvenile snappers(such as L. russellii) that are common components ofthe areas’ estuary nursery fauna (Sheaves 1995)seemed to make much less use of mangroves — ap-pearing at relatively few sites, entering late in the tideand showing little penetration into the forest. Thesesmall and juvenile fish are precisely those thought torely on mangroves as refuges (Blaber 1980). So, ratherthan moving in to mangroves when they are availablein order to seek refuge (Nanjo et al. 2014), it seems

Mar Ecol Prog Ser 549: 167–182, 2016180
that many such species may use a different refugestrategy — staying close to the mangrove line but onlyretreating into them when danger threatens (Laegds-gaard & Johnson 2001). This is supported by the ob-servation made repeatedly during the present studythat most small fish responded to the approach of alarge predator by moving away rather than by retreat-ing into the cover of the mangrove root complex.
Patterns of mangrove forest utilisation
Not only did relatively few species make extensiveuse of mangrove forests, but those that did used themin quite different ways and, by implication, for differ-ent reasons. The overall composition of the fish as -semblage using seaward and landward parts of man-grove forests was similar; however, for many speciesthere were higher rates of occurrence in the seawardfringe, as well as evidence that the width of the man-grove stand influenced penetration to landwardzones for at least 2 species: Chelonodon patoca andSiganus lineatus. At a more detailed level, therewere clear differences in the patterns of use of themangrove forest.
Most of the species that were common in the man-groves followed 1 of 2 patterns over time. The firstfeatured similar rates of occurrence once they hadentered the mangroves, and displayed broadly simi-lar patterns in both seaward and landward zones.This profile was termed ‘forager’ because it appearsto be characteristic of species dispersing to feedthroughout the mangrove forest; the foragers werecomposed of species known to feed extensively onprey found in mangroves — sesarmid crabs: Acantho -pagrus australis, A. pacificus (Sheaves et al. 2014);L. argentimaculatus (Sheaves & Molony 2000); in -sects and small crabs: Toxotes chatareus (Allen 1991,Allen et al. 2002) — or species that spent a large partof their time in mangroves picking from the substratesurface (Gerres filamentosus, G. oyena) or from man-grove pneumatophores and roots (S. lineatus). Varia-tions among the foragers’ patterns of oc cur renceindicated subtle differences in the mode and timingof entry and dispersal. In contrast to most other for-agers, large individuals of A. pacificus were consis-tently less abundant in landward zones, suggestingthat they spent more time in the forest proper thanpenetrating through to higher intertidal levels. G. fil-amentosus had initially high occurrences in both sea-ward and landward zones, suggesting an initial massarrival followed by dispersal as more of the intertidalbecame available.
A second group (termed ‘early arrivers’) enteredthe mangroves as soon as flooding began then de-clined markedly over time. This pattern wasdisplayed by small fish (including juvenile Acantho-pagrus spp., Pseudomugil signifer and C. patoca) andis broadly consistent with fish following the rising tidein order to remain in shallow water, although the 3early arrivers seemed to use the strategy in slightlydifferent ways. Juvenile Acanthopagrus spp. madegreater use of the landward mangrove zone thantheir larger conspecifics, indicating that they spreadthrough the forest less extensively and suggesting agreater tendency to remain in shallow water, perhapsbecause of a greater need for refuge from aquaticpredators than their larger conspecifics. In contrast tojuvenile Acanthopagrus spp., P. signifer and C.patoca ap peared to follow the shallow water edge,passing through the mangrove forest into higher in-tertidal areas. Notably, C. patoca was one of the spe-cies more likely to be found in narrow rather thanwide mangrove areas. Their preference for narrowforests, together with their rapid passage through theforest, suggests that they may principally use man-groves as a conduit to access higher intertidal areas.
The variant profile was assigned to those speciesthat did not align well with either the forager or earlyarriver patterns. These variants included 2 species(Ambassis vachellii and Lutjanus russellii) thatoccurred in >25% of videos, along with Lates calcar-ifer. A. vachellii exhibited a pattern whereby itsnumbers increased progressively in seaward zonesover the first hour following flooding, then stabilisedand remained at a high level, indicating a slowmovement to the front edge of the mangrove forest,where they remained over time. A. vachellii islargely planktivorous, and this pattern is consistentwith movement into the mangrove fringe to utilizethe refuge or hydrodynamic advantage provided bythe complex root structures, while remaining close tothe main body of the estuary where the supply ofplankton is likely to be greatest (Robertson et al.1988). Similary, occurrences of L. russellii in creasedsteadily in seaward sites over time but few fish pene-trated to the landward edge, suggesting gradualentry of fish into the seaward part of the mangroveforest over time but little utilisation of the inner partsof the forest. Apparently, whatever value the speciesgained from entering the forest was afforded by theseaward mangrove fringe. L. calcarifer was rarelyobserved in the mangrove videos, and when it wasdetected, it was only in the seaward videos late in thetide when water was deepest (and most small poten-tial prey fish had passed through to landward areas),
Sheaves et al.: Use of mangroves by fish
a pattern also seen for Caranx spp. and largePomadasys spp. Ap parently, these species did notenter the mangroves to feed (in fact, no feeding activ-ity was observed). This later arrival contrasts withlarger Acanthopagrus spp., which were of similarbody depth as most of the L. calcarifer, Caranx spp.and Pomadasys spp., and entered the mangrovesearly in the tide, apparently to forage.
CONCLUSIONS
Only a small subset of the species found acrosstropical estuary habitats made extensive use of themangrove forests, and those that did enter the man-groves used them in a variety of ways and presum-ably for a variety of reasons. This limited use andcomplex mix of patterns suggest a need to reconsiderthe extent and ways in which fish use mangroves.Although direct utilisation of the mangrove forestseems to be much more restricted than in other areas(Nagelkerken et al. 2001, Mumby et al. 2004, Faunce& Serafy 2006), the complexity of mangrove use sup-ports the idea of more intricate links between fish,mangroves and mangrove estuaries (Nagelkerken etal. 2015, Sheaves et al. 2015). As is the case in otherestuarine ecosystems (e.g. Weinstein et al. 2005,Wasserman & Strydom 2011), many of the advan-tages provided by mangroves are probably derivedat an ecosystem scale, with mangroves part of a com-plex, life-supporting habitat mosaic (Nagel kerken etal. 2015). This, in turn, emphasises the need for awhole-ecosystem approach to management and res-toration, as has been successful in temperate estuar-ies (Weinstein et al. 2005, 2014, Weinstein & Litvin2016).
Many of the species that did enter mangroves re -mained near the seaward edge, with very few pene-trating through to landward margins despite the rel-atively narrow width (5 to 150 m) of the mangroveforests studied. This suggests substantial variation inthe value of the mangrove forest to fish, and indicatesthe need for more emphasis on evaluating the spe-cific components of mangrove forests. This is particu-larly important given the proliferation of anthro-pogenic modification of estuaries across the tropics(Waltham & Connolly 2011) that has modified theextent and nature of mangrove habitats available tofish. Clearly, more specific research, gathered frommany more locations is necessary if we are to trulyunderstand the function and importance of man-grove systems and their component parts (Sheridan& Hays 2003, Faunce & Serafy 2006).
Acknowledgements. This research was supported by Aus-tralia’s Fisheries Research and Development Corporationgrant No. 2013/046.
LITERATURE CITED
Allen GR (1991) Field guide to the freshwater fishes of NewGuinea. Publication no. 9. Christensen Research Insti-tute, Madang
Allen GR, Midgley SH, Allen M (2002) Field guide to thefreshwater fishes of Australia. Western AustralianMuseum, Perth
Baker R, Sheaves M, Johnston R (2015) Geographic varia-tion in mangrove flooding and accessibility for fishes andnektonic crustaceans. Hydrobiologia 762: 1−14
Bassett D, Montgomery J (2011) Investigating nocturnal fishpopulations in situ using baited underwater video: withspecial reference to their olfactory capabilities. J ExpMar Biol Ecol 409: 194−199
Becker A, Cowley PD, Whitfield AK (2010) Use of remoteunderwater video to record littoral habitat use by fishwithin a temporarily closed South African estuary. J ExpMar Biol Ecol 391: 161−168
Blaber SJM (1980) Fish of the Trinity Inlet system of northQueensland with notes on the ecology of fish faunas oftropical Indo-Pacific estuaries. Aust J Mar Freshw Res31: 137−146
Blaber SJM, Brewer DT, Salini JP (1989) Species composi-tion and biomasses of fishes in different habitats of atropical northern Australian estuary: their occurrence inthe adjoining sea and estuarine dependence. EstuarCoast Shelf Sci 29: 509−531
Cleveland WS, Devlin SJ (1988) Locally weighted regres-sion: an approach to regression analysis by local fitting.J Am Stat Assoc 83: 596−610
Costanza R, d’Arge R, de Groot R, Farber S and others (1997)The value of the world’s ecosystem services and naturalcapital. Nature 387: 253−260
Creighton C, Boon P, Brookes J, Sheaves M (2015) RepairingAustralia’s estuaries for improved fisheries production —What benefits, at what cost? Mar Freshw Res 66: 493−507
De’ath G (2002) Multivariate regression trees: a new tech-nique for modeling species-environment relationships.Ecology 83: 1105−1117
De’ath G (2007) mvpart: multivariate partitioning. R pack-age version 2.15.1. R Foundation for Statistical Comput-ing, Vienna
Dittmann S (2000) Zonation of benthic communities in a trop-ical tidal flat of north-east Australia. J Sea Res 43: 33−51
Ellis WL, Bell SS (2008) Tidal influence on a fringing man-grove intertidal fish community as observed by in situvideo recording: implications for studies of tidallymigrating nekton. Mar Ecol Prog Ser 370: 207−219
Faunce CH, Serafy JE (2006) Mangroves as fish habitat: 50years of field studies. Mar Ecol Prog Ser 318: 1−18
Froese R, Pauly D (eds) (2014) FishBase. www.fishbase.org(accessed Nov 2014)
Halliday IA, Young WR (1996) Density, biomass and speciescomposition of fish in a subtropical Rhizophora stylosamangrove forest. Mar Freshw Res 47: 609−615
Igulu MM, Nagelkerken I, Dorenbosch M, Grol MGG andothers (2014) Mangrove habitat use by juvenile reef fish: meta-analysis reveals that tidal regime matters morethan biogeographic region. PLoS One 9: e114715
181
Mar Ecol Prog Ser 549: 167–182, 2016182
Johnston R, Sheaves M (2007) Small fish and crustaceansdemonstrate a preference for particular small-scale habi-tats when mangrove forests are not accessible. J Exp MarBiol Ecol 353: 164−179
Johnston R, Sheaves M (2008) Cross-channel distribution ofsmall fish in tropical and subtropical coastal wetlands istrophic-, taxonomic-, and wetland depth-dependent.Mar Ecol Prog Ser 357: 255−270
Kathiresan K, Bingham BL (2001) Biology of mangroves andmangrove ecosystems. Adv Mar Biol 40: 81−251
Kimball ME, Able KW (2012) Tidal migrations of intertidalsalt marsh creek nekton examined with underwatervideo. Northeast Nat 19: 475−486
Laegdsgaard P, Johnson C (2001) Why do juvenile fish utilisemangrove habitats? J Exp Mar Biol Ecol 257: 229−253
Legendre P, Legendre L (2003) Numerical ecology. Elsevier,Amsterdam
Ley JA (2005) Linking fish assemblages and attributes ofmangrove estuaries in tropical Australia: criteria forregional marine reserves. Mar Ecol Prog Ser 305: 41−57
Ley JA, Halliday IA (2007) Diel variation in mangrove fishabundances and trophic guilds of northeastern Aus-tralian estuaries with a proposed trophodynamic model.Bull Mar Sci 80: 681−720
Ley JA, Halliday IA, Tobin AJ, Garrett RN, Gribble NA(2002) Ecosystem effects of fishing closures in mangroveestuaries of tropical Australia. Mar Ecol Prog Ser 245: 223−238
Manley PN, Zielinski WJ, Schlesinger MD, Mori SR (2004)Evaluation of a multiple-species approach to monitoringspecies at the ecoregional scale. Ecol Appl 14: 296−310
Manson F, Loneragan N, Harch B, Skilleter G, Williams L(2005) A broad-scale analysis of links between coastalfisheries production and mangrove extent: a case-studyfor northeastern Australia. Fish Res 74: 69−85
Meynecke JO, Poole GC, Werry J, Lee SY (2008) Use of PITtag and underwater video recording in assessing estuar-ine fish movement in a high intertidal mangrove and saltmarsh creek. Estuar Coast Shelf Sci 79: 168−178
Morton RM (1990) Community structure, density and stand-ing crop of fishes in a subtropical Australian mangrovearea. Mar Biol 105: 385−394
Mumby PJ, Hastings A (2008) The impact of ecosystem con-nectivity on coral reef resilience. J Appl Ecol 45: 854−862
Mumby PJ, Edwards AJ, Arias-Gonzalez JE, Lindeman KCand others (2004) Mangroves enhance the biomass ofcoral reef fish communities in the Caribbean. Nature427: 533−536
Nagelkerken I, Kleijnen S, Klop T, Van den Brand R, De laMoriniere EC, Van der Velde G (2001) Dependence ofCaribbean reef fishes on mangroves and seagrass bedsas nursery habitats: a comparison of fish faunas betweenbays with and without mangroves/seagrass beds. MarEcol Prog Ser 214: 225−235
Nagelkerken I, Roberts C, van der Velde G, Dorenbosch M,van Riel M, de la Moriniere EC, Nienhuis P (2002) Howimportant are mangroves and seagrass beds for coral-reef fish? The nursery hypothesis tested on an islandscale. Mar Ecol Prog Ser 244: 299−305
Nagelkerken I, Sheaves M, Baker R, Connolly RM (2015)The seascape nursery: a novel spatial approach to iden-tify and manage nurseries for coastal marine fauna. FishFish 16: 362−371
Nanjo K, Kohno H, Nakamura Y, Horinouchi M, Sano M(2014) Effects of mangrove structure on fish distributionpatterns and predation risks. J Exp Mar Biol Ecol 461: 216−225
Robertson AI, Duke NC (1987) Mangroves as nursery sites: comparisons of the abundance and species compositionof fish and crustaceans in mangroves and other near-shore habitats in tropical Australia. Mar Biol 96: 193−205
Robertson AI, Duke NC (1990a) Mangrove fish-communitiesin tropical Queensland, Australia: spatial and temporalpatterns in densities, biomass and community structure.Mar Biol 104: 369−379
Robertson AI, Duke NC (1990b) Recruitment, growth andresidence time of fishes in a tropical Australian man-grove system. Estuar Coast Shelf Sci 31: 723−743
Robertson AI, Dixon P, Daniel PA (1988) Zooplanktondynamics in mangrove and other nearshore habitats intropical Australia. Mar Ecol Prog Ser 43: 139−150
Sheaves M (1995) Large lutjanid and serranid fishes in trop-ical estuaries: Are they adults or juveniles? Mar EcolProg Ser 129: 31−40
Sheaves M (1996) Habitat-specific distributions of somefishes in a tropical estuary. Mar Freshw Res 47: 827−830
Sheaves M (2006) Scale-dependent variation in compositionof fish fauna among sandy tropical estuarine embay-ments. Mar Ecol Prog Ser 310: 173−184
Sheaves M, Johnston R (2009) Ecological drivers of spatialvariability among fish fauna of 21 tropical Australianestuaries. Mar Ecol Prog Ser 385: 245−260
Sheaves M, Molony B (2000) Short-circuit in the mangrovefood chain. Mar Ecol Prog Ser 199: 97−109
Sheaves M, Johnston R, Connolly RM (2010) Temporaldynamics of fish assemblages of natural and artificialtropical estuaries. Mar Ecol Prog Ser 410: 143−157
Sheaves M, Sheaves J, Stegemann K, Molony B (2014)Resource partitioning and habitat-specific dietary plasti-city of two estuarine sparid fishes increase food-webcomplexity. Mar Freshw Res 65: 114−123
Sheaves M, Baker R, Nagelkerken I, Connolly RM (2015)True value of estuarine and coastal nurseries for fish: in -corporating complexity and dynamics. Estuar Coasts 38: 401−414
Sheridan P, Hays C (2003) Are mangroves nursery habitatfor transient fishes and decapods? Wetlands 23: 449−458
Waltham NJ, Connolly RM (2011) Global extent and distri-bution of artificial, residential waterways in estuaries.Estuar Coast Shelf Sci 94: 192−197
Wasserman RJ, Strydom NA (2011) The importance of estu-ary head waters as nursery areas for young estuary- andmarine-spawned fishes in temperate South Africa. EstuarCoast Shelf Sci 94: 56−67
Weinstein MP, Litvin SY (2016) Macro-restoration of tidalwetlands: a whole estuary approach. Ecol Res 34: 27−38
Weinstein MP, Litvin SY, Guida VG (2005) Considerations ofhabitat linkages, estuarine landscapes, and the trophicspectrum in wetland restoration design. J Coast Res40(Spec Issue): 51−63
Weinstein MP, Litvin SY, Krebs JM (2014) Restoration eco -logy: ecological fidelity, restoration metrics, and a sys-tems perspective. Ecol Eng 65: 71−87
Wilson JP, Sheaves M (2001) Short-term temporal variationsin taxonomic composition and trophic structure of a trop-ical estuarine fish assemblage. Mar Biol 139: 787−796
Editorial responsibility: Janet Ley, St. Petersburg, Florida, USA
Submitted: October 15, 2015; Accepted: March 7, 2016Proofs received from author(s): April 15, 2016
➤
➤
➤
➤
➤
➤
➤
➤
➤
➤
➤
➤
➤
➤
➤
➤
➤
➤
➤
➤
➤
➤
➤
➤
➤
➤
➤
➤
➤
➤
➤
➤
➤
➤
➤