use of landsat tm fraction images to … · relationships for land cover discrimination in the...
TRANSCRIPT

USE OF LANDSAT TM FRACTION IMAGES TO QUANTIFY THE OPTICAL AND SAR DATARELATIONSHIPS FOR LAND COVER DISCRIMINATION IN THE BRAZILIAN AMAZONIA
Yosio E. Shimabukuro*, Raimundo Almeida-Filho,Tatiana M. Kuplich and Ramon M. de Freitas
Divisao de Sensoriamento RemotoInstituto Nacional de Pesquisas Espaciais
Av. dos Astronautas, 1758, Sao Jose dos Campos, 12227-010, SP, Brasil(yosio, rai, tmk, ramon)@ltid.inpe.br
http://www.dsr.inpe.br
KEY WORDS: Amazonia, Fraction Images, Landsat TM, JERS-1 SAR
ABSTRACT:
This paper presents a comparison between L-band HH JERS-1 SAR and Landsat TM data for land cover assessment in an Amazoniantest site. For this, a study area located in the south of Rondonia State, western Brazilian Amazonia, was selected. The LandsatTM data acquired on August 1st 1997 were converted to vegetation, soil, and shade fraction images, using a Linear Spectral MixingModel. These fraction images are produced to enhance different characteristics of land cover, expressed as different mixtures of afew number of image components. The JERS-1 data acquired on August 08th 1997 for this investigation were processed to standardlevel 2.1, i.e., 16 bits ground range, 3 looks and a pixel spacing of 12.5 m. To compare JERS-1 and TM fraction images, a regressionanalysis technique was used. The multiple regression analysis showed coefficient of determination (R2) of 0.86 between SAR and thefraction images. The visual inspection of JERS-1 SAR image showed the high contrast between forest (medium gray) and cleared areas(dark gray). There is a direct relationship between SAR and shade fraction images and an inverse relationship between SAR and soilfraction images. Based on these relationships, it can be pointed out the utility of SAR data as an alternative data source for land coverclassification in the Amazonian region.
1. INTRODUCTION
The complementary use of optical and Synthetic Aperture Radar(SAR) data for the definition of different land cover/land useclasses has been showed by different authors (e.g. Rignot et al.,1997; Kuplich et al., 1997). The quantification of such a comple-mentary use, however, has not been accomplished yet. Attemptsto quantify optical and SAR image relationships were made byImhoff et al. (1986), who found “extremely low correlations be-tween the radar image patterns and any of the individual Land-sat/MSS bands”. Obviously such a conclusion cannot be gen-eralized to all land cover/land use types found in a tropical land-scape. SAR bands in different wavelengths and polarizations alsoshow potential for discriminating land cover types (Hoekman andQuinones, 2000), although the knowledge about their capabilitiesis not as robust as for the optical data.
The theory about optical and radar interaction with forest canopiesevokes the structure of vegetation as the main factor responsiblefor the response recorded by both type of sensors (Imhoff, 1995;Lu et al., 2004). The term “structure of vegetation” is used here asproposed by Parker (1995), to refer to the horizontal and verticalarrangement of canopy components, from leaves and branches tothe different strata of individuals, including gaps and emergenttrees that might break the surface of forest canopy. Species dif-ferences in growth form and shade tolerance, as well as succes-sion stage, produce, invariably, shadowing effects at the surfaceof forest canopies (Asner and Warner, 1995).
In tropical areas, Landsat Thematic Mapper (TM) fraction-imagesderived from linear spectral mixing modeling have proved to bean adequate source of information for discriminating land covertypes, particularly forested and clear-cut areas (Adams et al., 1995;Shimabukuro et al., 1998).
Because its sensibility to forest structure (Weishampel et al., 1996),L-band SAR data seem to be an alternative source for mappingdeforestation areas especially in the region where optical data isrestricted by cloud cover.
In this work statistical analysis was performed to investigate therelationships between JERS-1 (Japanese Earth Resources Satel-lite) /SAR and Landsat/TM fraction images, for different landcover/land use types.
2. STUDY AREA
The study area is located in the south of Rondonia State, westernBrazilian Amazonia (Figure 1), and comprising approximately4,000 km2. The area is mainly covered by tropical forest that hasbeen partially cleared over the past thirty years. Figure 2 showsthe 1997 TM image (R5G4B3) and the land cover map of thestudy area derived from this image.
Figure 1. Location of the study area.
The land cover map of the area (Figure 2) was obtained by digitalclassification using the procedure presented by Shimabukuro etal. (1998), which is based on image segmentation using regiongrowing algorithm, followed by unsupervised classification, and
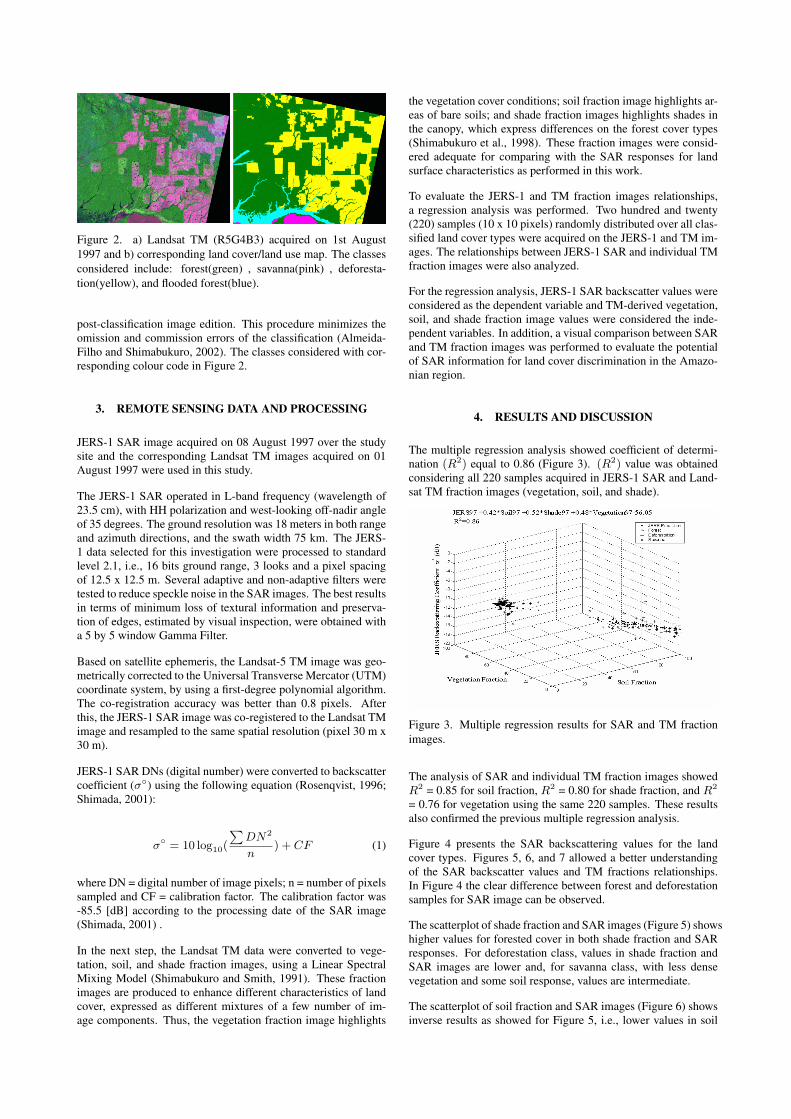
Figure 2. a) Landsat TM (R5G4B3) acquired on 1st August1997 and b) corresponding land cover/land use map. The classesconsidered include: forest(green) , savanna(pink) , deforesta-tion(yellow), and flooded forest(blue).
post-classification image edition. This procedure minimizes theomission and commission errors of the classification (Almeida-Filho and Shimabukuro, 2002). The classes considered with cor-responding colour code in Figure 2.
3. REMOTE SENSING DATA AND PROCESSING
JERS-1 SAR image acquired on 08 August 1997 over the studysite and the corresponding Landsat TM images acquired on 01August 1997 were used in this study.
The JERS-1 SAR operated in L-band frequency (wavelength of23.5 cm), with HH polarization and west-looking off-nadir angleof 35 degrees. The ground resolution was 18 meters in both rangeand azimuth directions, and the swath width 75 km. The JERS-1 data selected for this investigation were processed to standardlevel 2.1, i.e., 16 bits ground range, 3 looks and a pixel spacingof 12.5 x 12.5 m. Several adaptive and non-adaptive filters weretested to reduce speckle noise in the SAR images. The best resultsin terms of minimum loss of textural information and preserva-tion of edges, estimated by visual inspection, were obtained witha 5 by 5 window Gamma Filter.
Based on satellite ephemeris, the Landsat-5 TM image was geo-metrically corrected to the Universal Transverse Mercator (UTM)coordinate system, by using a first-degree polynomial algorithm.The co-registration accuracy was better than 0.8 pixels. Afterthis, the JERS-1 SAR image was co-registered to the Landsat TMimage and resampled to the same spatial resolution (pixel 30 m x30 m).
JERS-1 SAR DNs (digital number) were converted to backscattercoefficient (σ◦) using the following equation (Rosenqvist, 1996;Shimada, 2001):
σ◦ = 10 log10(
∑DN2
n) + CF (1)
where DN = digital number of image pixels; n = number of pixelssampled and CF = calibration factor. The calibration factor was-85.5 [dB] according to the processing date of the SAR image(Shimada, 2001) .
In the next step, the Landsat TM data were converted to vege-tation, soil, and shade fraction images, using a Linear SpectralMixing Model (Shimabukuro and Smith, 1991). These fractionimages are produced to enhance different characteristics of landcover, expressed as different mixtures of a few number of im-age components. Thus, the vegetation fraction image highlights
the vegetation cover conditions; soil fraction image highlights ar-eas of bare soils; and shade fraction images highlights shades inthe canopy, which express differences on the forest cover types(Shimabukuro et al., 1998). These fraction images were consid-ered adequate for comparing with the SAR responses for landsurface characteristics as performed in this work.
To evaluate the JERS-1 and TM fraction images relationships,a regression analysis was performed. Two hundred and twenty(220) samples (10 x 10 pixels) randomly distributed over all clas-sified land cover types were acquired on the JERS-1 and TM im-ages. The relationships between JERS-1 SAR and individual TMfraction images were also analyzed.
For the regression analysis, JERS-1 SAR backscatter values wereconsidered as the dependent variable and TM-derived vegetation,soil, and shade fraction image values were considered the inde-pendent variables. In addition, a visual comparison between SARand TM fraction images was performed to evaluate the potentialof SAR information for land cover discrimination in the Amazo-nian region.
4. RESULTS AND DISCUSSION
The multiple regression analysis showed coefficient of determi-nation (R2) equal to 0.86 (Figure 3). (R2) value was obtainedconsidering all 220 samples acquired in JERS-1 SAR and Land-sat TM fraction images (vegetation, soil, and shade).
Figure 3. Multiple regression results for SAR and TM fractionimages.
The analysis of SAR and individual TM fraction images showedR2 = 0.85 for soil fraction, R2 = 0.80 for shade fraction, and R2
= 0.76 for vegetation using the same 220 samples. These resultsalso confirmed the previous multiple regression analysis.
Figure 4 presents the SAR backscattering values for the landcover types. Figures 5, 6, and 7 allowed a better understandingof the SAR backscatter values and TM fractions relationships.In Figure 4 the clear difference between forest and deforestationsamples for SAR image can be observed.
The scatterplot of shade fraction and SAR images (Figure 5) showshigher values for forested cover in both shade fraction and SARresponses. For deforestation class, values in shade fraction andSAR images are lower and, for savanna class, with less densevegetation and some soil response, values are intermediate.
The scatterplot of soil fraction and SAR images (Figure 6) showsinverse results as showed for Figure 5, i.e., lower values in soil

Figure 4. 1997 JERS-1 SAR Backscattering values for the sam-ples of the land cover classes.
Figure 5. Linear regression between JERS-1 SAR and shade frac-tion image.
Figure 6. Linear regression between JERS-1 SAR and soil frac-tion image.
fraction and higher values in SAR image for forested cover. Fordeforestation class, values are higher for soil and lower in SARimages and, for savanna class, with less dense vegetation coverand some soil response, values are intermediate.
The scatterplot of vegetation fraction and SAR images (Figure
Figure 7. Regression between JERS-1 SAR and vegetation frac-tion image.
7) shows similar results as showed in Figure 5, i.e., higher valuesfor forested cover, in both vegetation and SAR responses. For de-forestation class, values in vegetation and SAR images are lowerand, for savanna class, with less dense vegetation and some soilresponse, values are intermediate.
These results demonstrated that JERS-1 SAR responses are stronglyrelated to land surface characteristics as represented by TM frac-tion images.
Visual inspection of JERS-1 SAR image clearly shows the highcontrast between forest (medium gray) and cleared areas (darkgray). Figure 8 shows the JERS-1 SAR image (a) and vegetation(b), soil (c), and shade (d) Landsat TM fraction images. A directrelationship can be observed between SAR and shade fractionimages and an inverse relationship between SAR and soil fractionimages. Based on these relationships, it can be pointed out theutility of SAR data as an alternative data source for land coverclassification in the Amazonian region.
Figure 8. a) JERS-1 SAR and b) vegetation, c) soil, and d) shadefraction images derived from Landsat TM data acquired in Au-gust 1997 (grid is 10 x 10 km, North is to the top).

5. CONCLUSIONS AND FUTURE WORK
Multiple regression analysis showed coefficient of determination(R2) of 0.86 between JERS-1 SAR and Landsat TM fraction im-ages. The results showed that JERS-1 SAR response is stronglyrelated to land surface characteristics as represented by the TMfraction images. The shade fraction image presented very simi-lar visual characteristics when compared with JERS-1 SAR data.This similarity presents a potential use of future ALOS/PALSARdata for mapping deforestation areas in the Amazonia region. Theavailability of extended polarization possibilities in the PALSARdata will be subject of further work.
ACKNOWLEDGEMENTS
JERS-1 SAR image was provided by the Earth Observation Re-search and Application Center (EORC) of the Japan AerospaceExploration Agency (JAXA), within the framework of the JERS-1 SAR Global Rain Forest Mapping (GRFM) Project, and Landsat-TM image was provided by the National Institute for Space Re-search (INPE).
REFERENCES
Adams, J.B., Sabol, D., Kapos, V., Almeida-Filho, R., Roberts,D.A., Smith, M.O., and Gillespie, A.R., 1995. Classification ofmultispectral images based on fractions of endmembers: applica-tion to land-cover in the Brazilian Amazon. Remote Sensing ofEnvironment, 52: pp. 137-152.
Almeida-Filho, R., Rosenqvist, A., Shimabukuro, Y.E. and San-tos, J.R., 2005. Evaluation and perspectives of using multi-temporalL-band SAR data to monitor deforestation in the Brazilian Ama-zonia. IEEE Geoscience and Remote Sensing Letters, 2, pp. 409-412.
Almeida-Filho, R. and Shimabukuro, Y.E., 2002. Digital pro-cessing of a Landsat-TM time-series for mapping and monitor-ing degraded areas caused by independent gold miners, RoraimaState, Brazilian Amazon. Remote Sensing of Environment, 79,pp. 42-50.
Asner, G.P. and Warner, A.S., 2003. Canopy shadow in IKONOSsatellite observations of tropical forests and savannas. RemoteSensing of Environment, 87, pp. 521-533.
Hoekman, D.H. and Quinones, M.J., 2000. Land cover type andbiomass classification using AirSAR data for evaluation of mon-itoring scenarios in the Colombian Amazon. IEEE Transactionson Geoscience and Remote Sensing, 38, pp. 685-696.
Imhoff, M.L., 1995. A theoretical analysis of the effect of foreststructure on Synthetic Aperture Radar backscatter and the remotesensing of biomass. IEEE Transactions on Geoscience and Re-mote Sensing, 33, pp. 341-352.
Imhoff, M.L., Story, M. Vermillion, C. Khan, F. and Polcyn, F.,1986. Forest canopy characterization and vegetation penetrationassessment with space-borne radar. IEEE Transactions on Geo-science and Remote Sensing, GE-24, pp. 535-542.
Kuplich, T.M., Freitas, C.C., and Soares, J.V., 1997. The studyof ERS-1 SAR and Landsat TM synergism for land use classifi-cation. International Journal of Remote Sensing, 21, pp. 2101-2111.
Lu, D., Mausel, P., Brondizio, E., and Moran, E., 2004. Relation-ships between forest stand parameters and Landsat TM spectralresponses in the Brazilian Amazon Basin. Forest Ecology andManagement, 198, pp. 149-167.
Parker, G.G., 1995. Structure and microclimate of forest canopies.In: Lowman, M.D., Nadkarni, N.M. (Eds.), Forest Canopies.Academic Press, San Diego, pp. 73-106.
Rignot, E., Salas, W.A., and Skole, D.L., 1997. Mapping defor-estation and secondary growth in Rondonia, Brazil, using imag-ing radar and Thematic Mapper data. Remote Sensing of Envi-ronment, 59, pp. 167-179.
Rosenqvist, A., 1996. Evaluation of JERS-1/SAR and Almaz/SARbackscatter for rubber and oil palm stands in West Malaysia. In-ternational Journal of Remote Sensing, 17, pp. 191-202.
Shimabukuro, Y.E., Batista, G.T., Mello, E.M.K., Moreira, J.C.,and Duarte, V., 1998. Using shade fraction image segmentationto evaluate deforestation in Landsat Thematic Mapper images ofthe Amazon region. International Journal of Remote Sensing, 19,pp. 535-541.
Shimabukuro, Y.E. and Smith, J.A., 1991. The least-squares mix-ing models to generate fraction images derived from remote sens-ing multispectral data. IEEE Transactions on Geoscience andRemote Sensing, 29, pp. 16-20.
Shimada, M., 2001. User’s Guide to NASDA’s SAR products.Ver.3, Tokyo, 23p.
Weishampel, J.F., Ranson, K.J., and Harding, D.J., 1996. Remotesensing of forest canopies. Selbyana, 17, pp. 6-14.