use of insulation for frost prevention · use of insulation for frost prevention jackman airport,...
TRANSCRIPT

-AD-A234 274
Use of Insulation for Frost PreventionJackman Airport, Maine, 1986-1987 winterMaureen A. Kestler and Richard L. Berg January 1991
a A":d
a K Copyl
91 4 04 018

Cover; Installation of inisulationl at Newton Field, Jackman,Maine.
CRREL Report 91 -1
U.S. Army Corpsof EngineersCold Regions Research &Engineering Laboratory
Use of Insulation for Frost PreventionJackman Airport, Maine, 1986-1987 WinterMaureen A. Kestler and Richard L. Berg January 1991
Prepared forU.S. DEPARTMENT OF TRANSPORTATONFEDERAL AVIATION ADMINISTRATIONOFFICE OF THE CHIEF OF ENGINEERS
Approved for publtc release; distribution Is unlimIted.

PREFACE
This report was prepared by Maureen A. Kestler and Dr. Richard L. Berg, Research CivilEngineers, Civil and Geotechnical Engineering Research Branch, Experimental Engineering Divi-sion, U. S. Army Cold Regions Research and Engineering Laboratory. Funding for this study wasprimarily provided by the Federal Aviation Administration as part of the FAA-CRREL InteragencyAgreement DTFA 01-84-2-02038. The USACE portion was funded through DA Project4A762784AT42, Design, Construction and Operations Technology for Cold Regions; Task BS, BaseSupport; Work Unit 036, Improved Pavement Design Criteria in Cold Regions. This report wastechnically reviewed by Hisao Tomita (FAA) and Wendy Allen (CRREL).
The authors thank Richard Guyer for instrumentation installation and data collection, MarciaVanCamp for collecting data, Blair VanCamp for assisting in equipment installation, and PamelaBosworth for typing the manuscript.
The contents of this report are not to be used for advertising or promotional purposes. Citation ofbrand names does not constitute an official endorsement or approval of the use of such commercialproducts.

CONTENTS
PagePreface ................................................................................................................................... iiM etric conversion table ......................................................................................................... vIntroduction ........................................................................................................................... ILocation ................................................................................................................................. IW eather data .......................................................................................................................... 1S ite ......................................................................................................................................... 3Background ........................................................................................................................... 3Instrument ..ion ..................................................................................................................... 6Observations and discussion ................................................................................................ . 8
Heaving and cracking ....................................................................................................... 8Time, temperature and depth relations ............................................................................ 17Air temperature and freezing indices .............................................................................. 23Frost penetration ............................................................................................................... 24Ground-penetrating radar ................................................................................................ 27Falling weight deflectometer ............................................................................................ 33
Summary and conclusions ..................................................................................................... 33Literature cited ...................................................................................................................... 35Appendix A: Gradation, hydraulic conductivity and moisture retention data ..................... 37Appendix B: Thermocouple and tensiometer data recorded at CMP, Newton Field
and Nichols Road, W inter 1986-87 ..................................................................... 41Abstract ................................................................................................................................. 47
ILLUSTRATIONS
Figure1. Location map ................................................................................................................ 12. Vicinity maps .............................................................................................................. 23. Soils profiles- Newton Field and Nichols Road ....................................................... 44. Typical cross sections- Newton Field and Nichols Road ........................................... 55. Proxim ity sketches of instrument locations ................................................................ 76. Profiles of instrument locations .................................................................................. 87. Frost heave observations, Nichols Road .................................................................... 98. Average frost heave- Newton Field and Nichols Road ............................................. 129. Frost heave- Newton Field .......................................................................................... 13
10. Surface elevations along centerline- Newton Field ................................................... 15I1. Crack near station 8+22- Newton Field ..................................................................... 15
12. Cross sections depicting irregular surface near station 30+00-Newton Field .......... 1613. Approximate locations of cracks and heaves- Newton Field ..................................... 1714. Temperature vs depth profiles for Nichols Road and Newton Field ........................... 1815. Temperature vs depth immediately beneath the insulation-Newton Field ............... 1916. Removal of pavement at station 30+00. summer 1987 ............................................... 2017. Temperature vs depth- Nichols Road and Newton Field ........................................... 2118. Temperature vs time plots ........................................................................................... 2119. Air, surface, and subsurface temperature vs time ........................................................ 2320. Air and surface freezing indices vs time for Newton Field and Nichols Road ............ 24
iii
Page2 1. Depth vs time for Nichols Road and Newton Field ...................................................... 2622. Correlations between tensiometer readings and frost determined by
therm ocouple readings ......................................................................................... 2723. Known depth to insulation used for ground-penetrating radar calibration ................. 2924. Ground-penetrating radar profile of insulation ........................................................... 3025. Ground-penetrating radar record, Newton Field ........................................................ 3026. Impulse stiffness modulus vs time .............................................................................. 34
TABLES
TableI. Weather data for Madison, Maine, 1951-1980 ............................................................ 32. Annual average air temperatures for Jackman and Madison ..................................... 33. Instrum entation table .................................................................................................... 64. Jackman's average monthly air temperatures (Nov-Mar) since 1980 ......................... 235. Frost penetration depths computed using the modified Berggren equation ................ 276. Times and depths to insulation at cross sections .......................................................... 297. Depths from ground surface to top of insulation measured alongside the
edge of runw ay .................................................................................................... 298. Approximate depths to insulation determined by ground-penetrating radar ............... 339. Sum m ary of observations ........................................................................................... . 35
iv
CONVERSION FACTORS: U.S. CUSTOMARY TOMETRIC (SI) UNITS OF MEASUREMENT
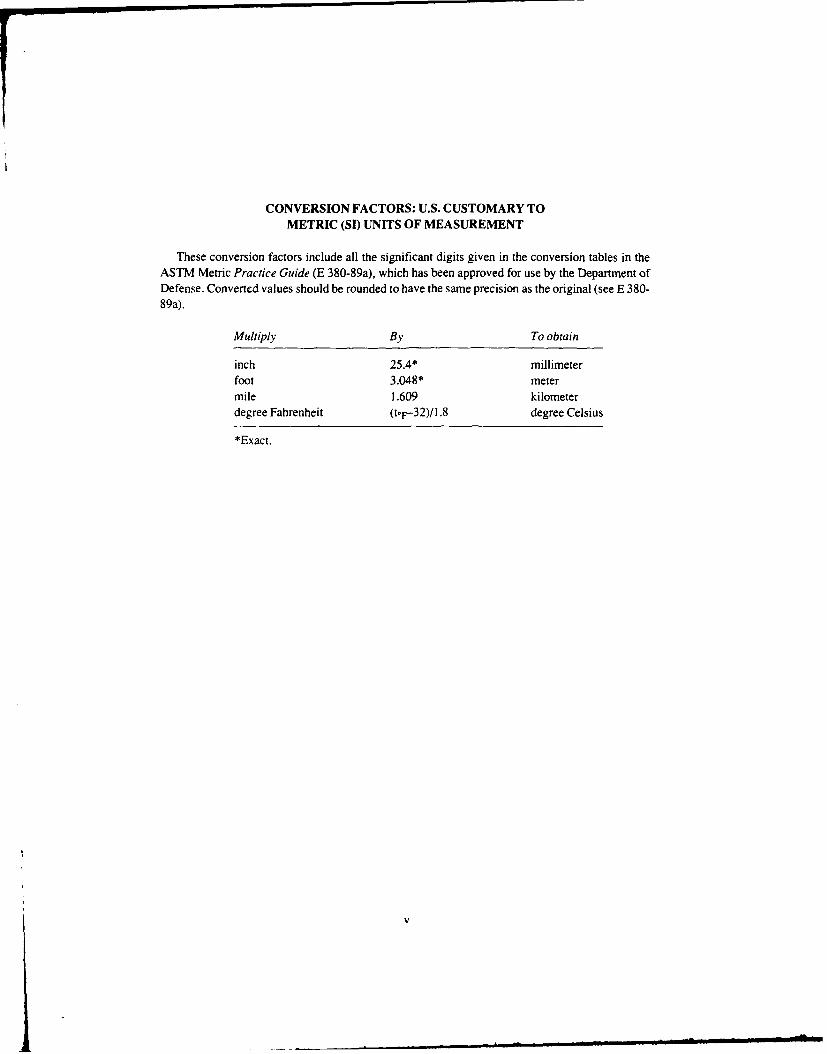
These conversion factors include all the significant digits given in the conversion tables in theASTM Metric Practice Guide (E 380-89a), which has been approved for use by the Department ofDefense. Converted values should be rounded to have the same precision as the original (see E 380-89a).
Multiply By To obtain
inch 25.4* millimeterfoot 3.048* metermile 1.609 kilometerdegree Fahrenheit (to- 3 2)/1.8 degree Celsius
*Exact.
V

Use of Insulation for Frost PreventionJackman Airport, Maine, 1986-1987 Winter
MAUREEN A. KESTLER AND RICHARD L. BERG
INTRODUCTION of Jackman. From 1951 through 1980, Madison's airfreezing index averaged 1366°F-days with a maximum
A 2-in.-thick layer of extruded polystyrene insula- of 1878°F-days (1970-1971 winter), a minimum oftion was placed beneath the runway, taxiway and park- 767°F-days (1957-1958 winter), and design value (theing apron during the 1986 reconstruction of Newton average of the three coldest winters in the 30-yearField in Jackman. Maine. The purpose of the study period) of 1795°F-days. Weather data for Madison aredescribed here was twofold: l)toevaluate the effective- shown in Table 1. Jackman's average annual tempera-nessoftheinsulationinpreventing frost from penetrating ture was 38.3°F from January 1980 through Decemberbeneaththe insulation intothe frost-susceptible subgrade, 1985 (Table 2). and was 37.9°F over the past 30 years.thus resulting in unacceptable frost heave, and 2) to The design freezing index at Jackman is approximatelycompare performance with that of a nearby reconstructed 2570°F-days.roadway (Nichols Road) with a cross section similar tothat proposed for the runway had no insulation beenused. Articles in New England Construction and AirportServices Management discussed the Jackman AirportConstruction Project (Foumier 1986, Davis and Johnson1987).
LOCATION "
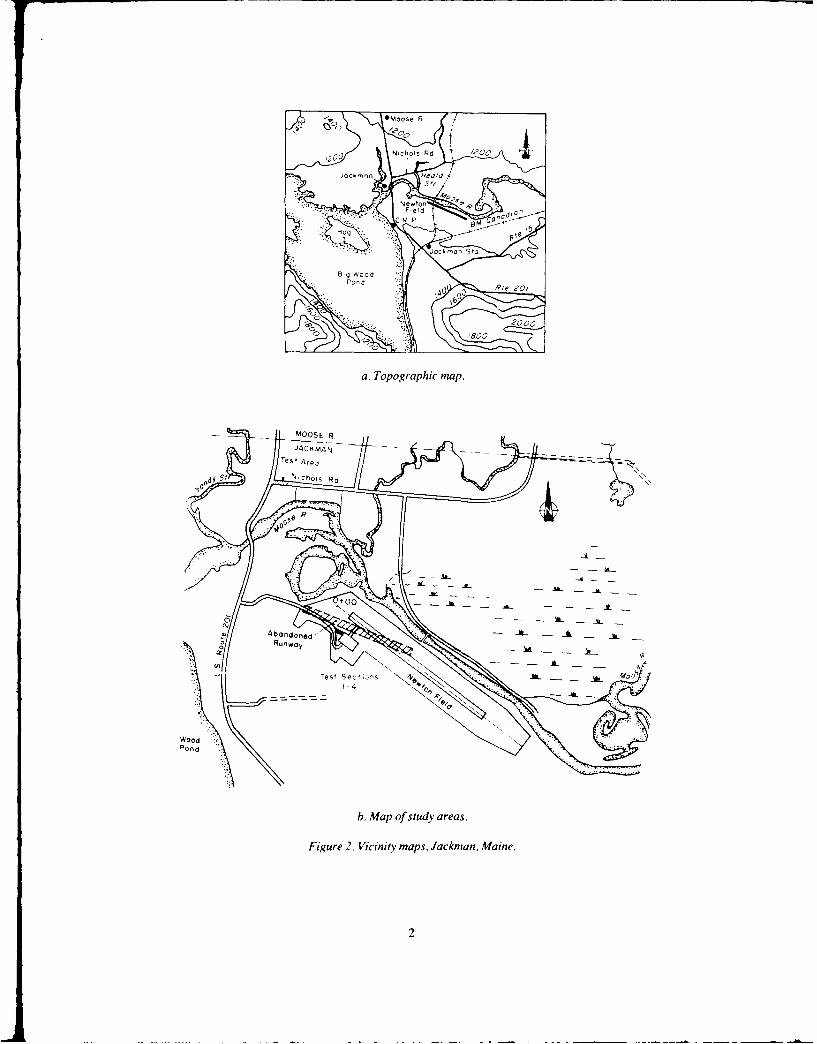
Newton Field and Nichols Road are located withinone mile of each other on the east side of U.S. Route 201 CANADA
in the town ofJackman, Maine (45038 ' .7015'). This town
is situated in a valley within the Moose River Watershedof northwestern Maine. The runway elevation is ap- MAI NE
proximately 1175 ft above MSL; the 100-year floodlevel of the nearby Moose River is approximately 1170 , uiust0o
ft (Fig. I and 2).
AT , AN' E
WEATHER DATA
Although weather data from Jackman are limited, afull range of data is provided by the town of Madison,Maine, located approximately 70 miles south-southeast Figure 1. Location map.
*Moose R
20 Nchols Rd ( '200 4
B Wood
00
a. Topographic map.
h." Ma o suyres
Figure 2.VcntRas aka.Mie
02

Table 1. Weather data for Madison, Maine: 1951- Table 2. Annual average air temperatures for1980. (440481, 69053 ' , elevation 260 ft) Jackman and Madison.
Avg Avg Avg Avg Avg Avg Madison Madison Jackman Temp Difdaily daily daily heating thawing* freezingt ann avg dep ann avg M-J
Date ma.(oF) min(F) (0F) D.D.(0
F, D.D.(°F) D.D.(OF) Year (°F) (0F) (°F) (°F)
Jan 28 5 17 1499 0 476 1956 23.1 2.9 19.3 3.8Feb 31 6 18 1317 0 384 1957 44.2 2.3 40.1 4.1Mar 39 19 29 1116 11 104 1958 43.1 -0.4 39.1 4.0Apr 52 30 41 718 272 0 1959 44,5 40.8 3.May 66 40 53 378 645 0 1969 44.5 40 3.Jun 75 50 62 81 909 0 1961 44.4 41.0 3.4Jul 80 55 68 3 1102 0Aug 78 53 66 17 1040 0 1962 42.1 39.0 3.1
Sep 70 45 57 227 764 0 1963 43.3 -0.2
Oct 58 36 47 559 464 0 1964 43.5 0.0 38.6 4.9
Nov 45 27 36 877 113 0 1965 43.0 -0.5 37.8 5.2
Dec 31 12 21 1351 0 328 1966 44.2 0.7Year 54 32 43 8111 5320 1293 1967 42.2 -1.3 37.4 4.8
1968 41.6 -1.9 38.1 3.5*Thaw starts as early as I Mar 1958 and as late as 6 Apr 1964, but 1969 42.3 -1.2 38.5 3.8
usually about 22 Mar. Length of thawing season averages 246 days 1970 42.1 -1.4 37.8 4.3and ranges from 223 to 282 days. The design length of the thawing 1971 41.5 -2.0 37.8 3.7season is 260 days. 1972 40.0 -3.5 36.0 4.0
tFreezing degree days (seasonal daily data): Avg 1366. Max 1878 1973 43.9 0.4 40.8 3.1(winter 1970-1971). Min 767 (winter 1957-1958). Design 1795. 1974 41.6 -1.9 37.4 4.2Free7ing starts as early as 8 Nov 1971 and as late as 15 Dec 1953. 1975 42.1 -1.4 38.5 3.6but usually around 23 Nov. The length of the freezing season 1976 41.2 -2.3 37.3 3.9averages 119 days and ranges from 97 to 141 days. 1977 38,6
1978 41.1 -2.4 37.1 4.01979 39.51980 42.0 -1.5 37.0 5.0
SITE 1981 43.7 0.2 39.4 4.31982 41.3 -2.2 37.6 3.7
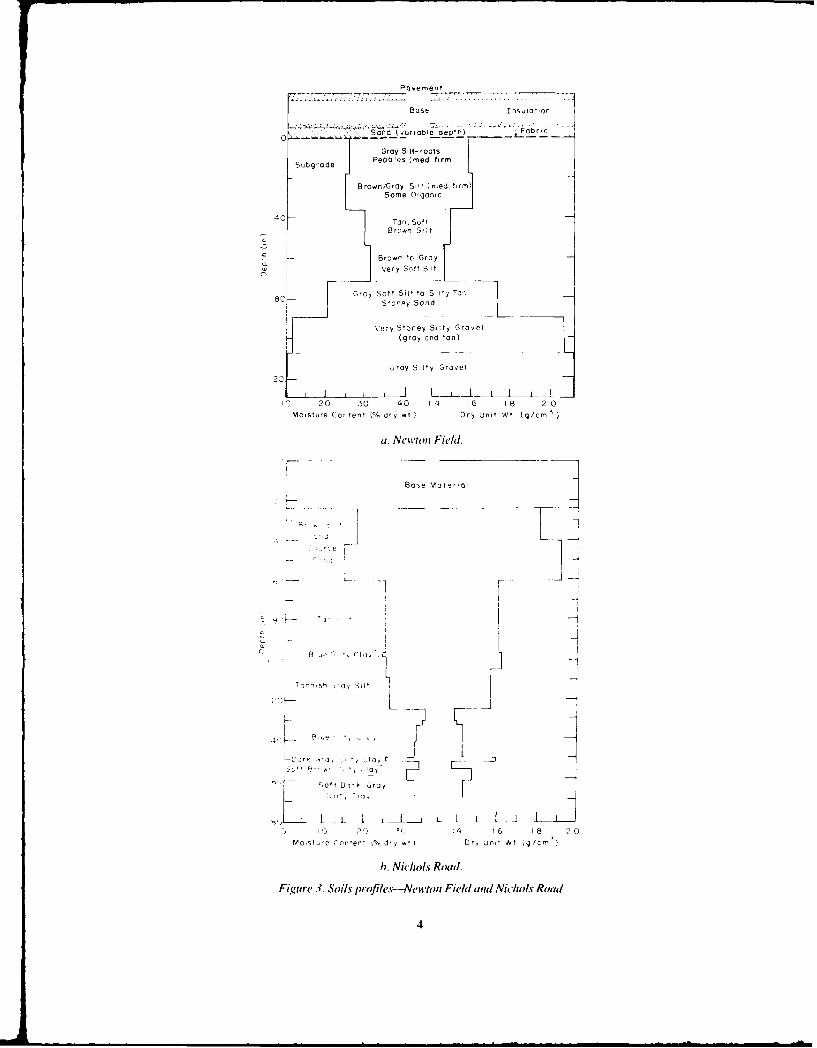
Soil profiles for both Newton Field and Nichols Road 1983 39.7are shown in Figures 3a and 3b, respectively. In 1970, a 1984 42.8 -0.2 39.0 3.8
1985 41.4 -1.6 36.9 4.5field investigation was conducted for the U.S. Route 201 Avg 41.87 37.9 3.98Jackman-Moose River Project F-033-2(0). The follow- Avg('80-85) 42.24 38.27 4.26ing is an excerpt from the soils investigation report (Prueand Morgan 1970) for the segment of road correspondingto the starting station at Nichols Road:
Augerborings, road soundings and backhoe test could be expected in this section. The recently
pits were used todetermine soil types in this section. completed adjacent project in Jackman experi-Fluvial deposits of highly frost-susceptible varved enced severe heaving and consequential break-
sandy clay silts and silty sands were found ing of pavement the first winter after construc-
interbedded. Some non frost-susceptible clean sands tion, even though some undercutting ofsubgradewc, - also found with this material at random loca- was done.
tions and depths and usually with silt layers. The soil If this unacceptable frost damage is to be
stratus were firm. prevented or at least diminished one of two ap-The water table was at a relatively shallow depth proaches might be considered, eitherathick layer
in this plane. of granular material or insulation of the subgrade.The existing road consists of approximately one
foot of silty sandy fine gravel and pavement overone foot of pebbly sandy silt. BACKGROUND
Soils are firm and should adequately support the
proposed embankments. The old runway was in very poor condition. withThe frost enetration in this area is severe...and The drunway as in ery p r ac in.
highly frost-susceptible soils occur with slightly
frost-susceptible or nonfrost-susceptible soils within Construction specifications for the insulated pave-
the frost penetration zone. ment called forapproximately 250.000 ft 2 of2-in.-thickThe watertable is shallow in this area, and unless extruded polystyrene insulation beneath the 60- x 2900-
precautions are taken severe differential heaving ft runway, the 30- x 245-ft taxiway. and the 125- x 300-
3
A
Paove rent
17Bose lrns5:'on r
0' , -' Sand (variable depth), Fobt~c
Gray Silt- roots
Subgrade Pe~b fes med firm
rown/Gray Silt med firm)
40r Some 0-gonic
40 Ton, So fr
~ I--Brown 0o Gray
IVery Saftt S,1
CryS f ito Sit. 'oSc-ey Sand
vey Stoney Sitty Grovel(gray and ton)
20 Gray Sily Grovel
20 30 40 14 :6 18 2 0Moisture Content (% dry wt Dry Unit Wt (9/cm
(1. Net'won Field.
Cos Bltr a
b. Nicol Road.
F~ue..Sdsjrfte--etltFed n NcosJod
4I

ft parking apron, and approximately 23,000 ft2 of I-in.- A typical runway cross section included 2.5-in. ACthick extruded polystyrene insulation for the transition pavement, a 12-in. crushed stone base, 2-in. polystyrenezonealongueedges.Minimumcompressivestrengthof insulation, a l-in. (minimum) layer of sand, and aall insulation was 40 psi. Ninety percent of the funding geotextile atop the wet sandy silty subgrade (Fig. 4a).for this $1 million airport improvement construction The first few hundred feet of oearby Nichols Roadproject was provided by the FAA. The remaining 10% were also reconstructed during the slmn.:e of 1986.Thewas shared equally by the state of Maine and town of typical Nichols Road cross section shown in Figure 4bJackman. Drawings, specifications and contract docu- approximates thL conventional, ioninsulated cross sec-ments were prepared by Dufresne-Henry, Inc., of Port- tion considered for Newton Field. Beyond the first 150land, Maine, and the contract was awarded to Thomas ft of reconstructed roadway is a 50-ft transition sectionDiCenzo. Inc., of Calais, Maine. into the old road (Fig. 4c).
. 3C 30 0 , 2 0 '
?~p-~2 '2 B ' -- 4k-
TcK OOt Surfce 2o rse Matcha.eNeeew i E elds g Ground
*re Coal Base ICourse
44 i.
S---- -G eo lef le F :11e
T2DS 2" Rigid lrnsulotlon
_,e :el.ng Sand Course
[ 3 '
e' a. Newton Field runway.
7 ,.bbose 1 8 ;ind ' j
b. Nichols Road (first 150ft).
.ew. ':ad 21ld ROQd
o o
Bubbose
Sol Subrode c. Longitudinal cross section-Nichols Road.
Figure 4. Typical cross sections-Newton and Nichols Road.
5

Table 3. Instrumentation table.
Frequency ofInstrumentation/test data collection Purpose Observations
Thermocouples Weekly Subsurface Substantialtemperatures frost
penetrationbeneathinsulation.
Tensiometers Weekly Moisturemeasurement
Air and pavement Daily Air andsurface temperature pavementsensors surface
temperatures
Water wells Weekly Groundwaterlevel
Grid of crosses Winter: Surface Substantialon pavement monthly displacement andsurface Spring: differential
biweekly frost heaveat each endof runway.
Falling weight Spring: Stiffness Lowdetlectometer approx. weekly stiffnessand Road Rater at each end
of runway.
Ground- Subsurface Unable topenetrating profile detect frostradar line.
Varyingdepth toinsulation.
INSTRUMENTATION A large wooden F . was constructed to house theairport's thermocoul,,e and tensiometer boxes. Six hori-
Field instruments installed at Newton Field's Run- zontal holes were drilled into a single insulation panel forway 14/32 ar Nichols Road included thermocouples to thermocouple installation. On Thursday, 25 September.monitor subsurface temperatures and tensiometers to four tensiometers were installed approximately 10 ftmonitor pore water pressures in the soil. Groundwater from the south edge of the pavement at station 4+43 atwells were installed at each of the two observation sites. Newton Field. Thermocouples were installed at stationInstrumentation is summarized in Table 3. Figures 5a- 4+47 within the pre-drilled insulation panel, and the6b show the instrumentation locations, sensors in the backfill above the insulation were placed
On 18 August 1986a hole was drilled to a depth of 15 on 6 October 1986. Crosses were painted on the pave-ft and soil samples were taken at Nichols Road. This ment surface at both Nichols Road and the runway tohole, to be used for the thermocouple assembly, was serve as a grid for monitoring changes in surface eleva-located 1.75 ft north of the centerline at station 1+57. tion. At the airport, these points are located on theDrillingofawaterwell fordeterminingthe groundwater centerline and at 5 ft and 15 ft right and left of thetable at Nichols Road wascompleted the same day. Both centerline at 25-ft intervals. The segment to be moni-ihe drill rig and drilling crew were provided by the Maine tored spans 200 ft from station 4+00 to station 6+00. AtDepartment of Transportation (MDOT). Nichols Road, level points are near the road centerline
On 23 September, continuous soil samples were and 5 ft left and right of the center points. Outermosttaken to a depth of approximately 10 ft at Newton Field. points vary between 8 ft and 11 ft from center. ThisThis thermocouple cable hole was located 33.5 ft from pointsa b n d ft from center isthe north edge of the pavement at station 4+41.75. A 14- of U.S. Route 201, to station 3+00.ft-deep groundwater well was installed approximately Separate markings indicate falling weight50 ft from the airport's old windsock. deflectometer(FWD) test points. At Newton Field. these
6

TrueOrth
8 3V WDeclination Clearing
(1981)
TroNiclhols Rd.g O
,P* Thermocouples and Tensiomneters
0o Air Temperature Gage
00
/ OChurCil
TheOrmocoupleGge48 tewl
O~0OTensiom~eters NicIOlS Rd.
* -~---~ -~ - + __ - 5- 3.0
1+00 1+0 20
b, Nichols Road
Figure 5. Proxiimity sketches of instrument locations.
7

2 26 Graove
4o Bose Courseo 4*S 5. -Insulation
" . Sand
1:2 ._evehng Course3.4
i1'4 .7 e
Fnrshed7. T 3 Rood Grade
- - .- - Paeme r- Subgrode H76
v, 1174 T, 4
a 9 5e
T,Z E 1172 *t4
o 6
C -C
o - CableV 7o
S L 1,62.9
a. Newton Field. b,. Nichols Road.
Figure 6. Profiles of instrionent loations.
test points are at the following locations 5 ft from the OBSERVATIONScenterline on alternating sides: 50-ft intervals from AND DISCUSSIONstation 3+50 through station 10+00, 200-ft intervalsfrom station 10+00 through station 30+00, and one final Heaving and crackingpoint at station 31+50. Observed heave at Nichols Road, which served as a
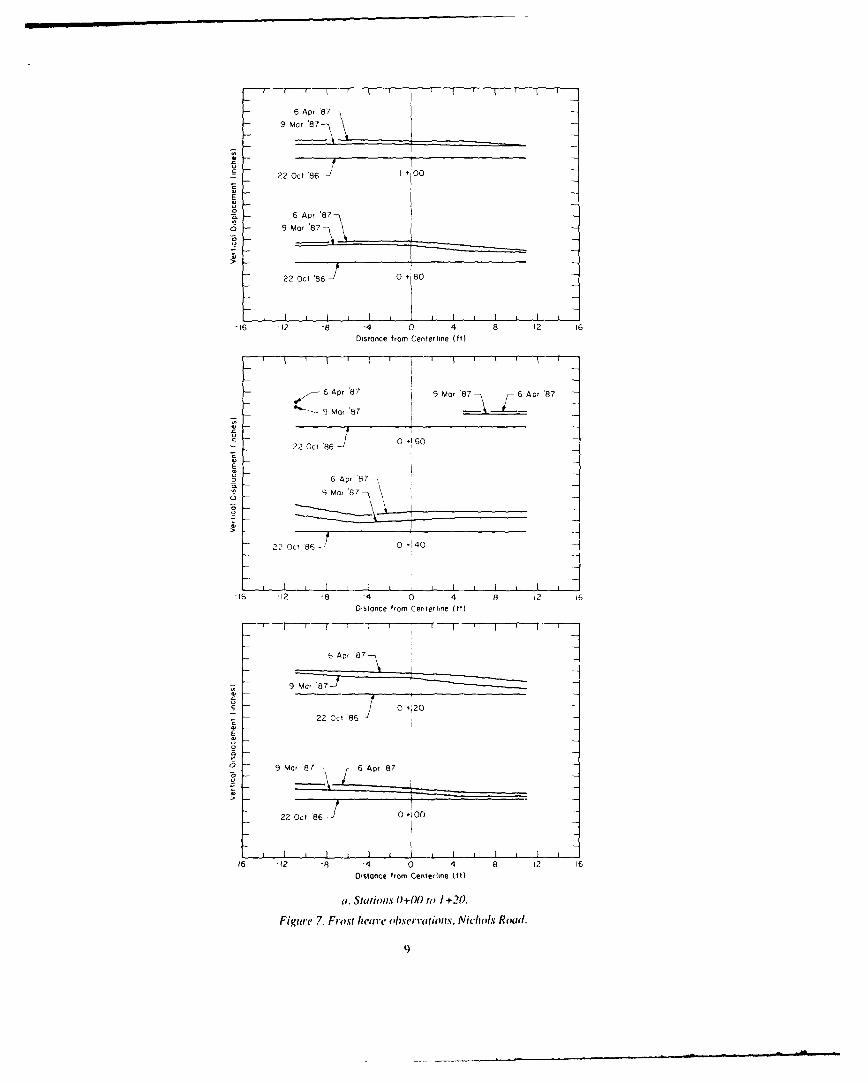
Nichols Road FWD points lie along the outside control site, varied from minimal to quite significant.wheel path at i -ft intervals fromstations 1+00through Maximum heave was observed during March. The ap-station 3+00. proximate ranges of vertical displacements exhibited by
A third set of FWD points is located along U.S. thefirst 150-ftmiddle50-ft.andfnal 100-ftsegments ofRoute 201 North. These 10 test points are randomly the observed portion of Nichols Road were Ito 2 in.. 2.5spaced along the outside wheel path from the point to 3.5 in., and 3 to 6 in.. respectively For the most pant.where new and old road surfaces meet to the Dennison the results were as expected; the smallest average dis-town line marker. Each of the l0points is on the old road placement occurred on the portion of Nichols Road thatsurface. was reconstructed as part of the U.S. Route 201 Recon-
Pavement surface elevations were taken approxi- struction Project: the largest average displacement oc-mately every month through the winter months and curred on the old road with original base/subbase; and thebiweekly through spring thaw: thermocouple, tensiom- intermediate average displacement occurred on the tran-eter. and groundwater level readings were recorded sition zone (Fig. 7). Heave was relatively uniformweekly; air and pavement surface temperatures were throughout both the newly reconstructed and transitionmonitored daily; and FWD tests were conducted ap- sections, but this was not the case along the old roadproximately biweekly throughout the spring. (station 2+00-station 3+00). Vertical displacements on
8
6 Apr '87-
9 Mar '87
22 Oct '86 1-0
E
6 Apr 87
9 9Mar 87
22 Oct 86 0 -80
-16 -12 -8 -4 0 4 8 12 16
Distance fram Centerline (ft)
6 Apr8'7
9 Mar 87 6 Apr 87
9 9Mci,87
22 Oct'86-0"6
6 Apr 877
9 Mar 87
220Ocr 86 - 0 140
-16 .12 -8 -4 a 4 8 12 16Distance fram Centerline (ft)
6 Apr 87-
9 Mar 87-
0 20-22 Oct '86
c
o 9 Mar '87 -6 Apr *8776
22 Oct86' 0+00
-1 6 -12 -8 -4 0 4 8 12 16
Distance trom Centerline (11t)
a. Stations 0+00() 1 +20.
Figure 7. Frost heave ohbserv(Irions. Nic-hols Rood.

6 Apr '87
9 Mar 87
E 22 Oct '86- 2 20
-16 -12 -8 -4 0 4 8 12 16Distance from Centerline (ft)
6 Apr '87
9 Mar 87-
22 Oct '86 j0
6 Apr 87
9 Mar 87-
22 Oct 86 +I6
-16 -12 -8 -4 0 4 8 12 16Distance from Centerline 0t)
6 Apr '87
9 Mar ' 87
22 Oct 86 140
6 Apr 87
9 9Mar 87
22 Oc 8 +20
-16 -12 .8 -4 0 4 8 12 16Distance from Centerline (ft)
h. Stat ions 1+20 to 2 +80.
Figure 7 (contld). Fr-ost heave observations. Nichols Road.
10

6 Apr '87 \
9 Mar'87
22 Oct '86 3 "0
6 Apr '87"-
9 Mew '877
22Oct ,86 280I I I I 1 I I -
-16 .12 -8 -4 0 4 8 12 16
Distance from Centerline (ft)
9 Mar 87
E _22 Oct '86 2 *60
~~6 Apr '87 /
22 Oct '86 21 40
i 1 I I I I !-16 -12 -8 -4 0 4 8 12 16
Distance from Centerline (ft)
c. Stations 2+80 to 3+15.
Figure 7 (cont'd).
the left were in the range of 3 in. while those on the right Newton Field throughout the freeze-thaw process isapproached 6 in. Generally, a fairly uniform reduction in illustrated by Figure 9. As was also the case at theheave was observed throughout thawing. opposite end of the runway, this area had been extremely
Results of elevation surveys of station 4+00 through wet at the time of construction.station 6+00 at Newton Field showed vertical displace- Surface elevations were periodically taken along thement values somewhat higher than expected. Maximum centerline at 100-ft intervals down the entire length ofdisplacements, occurring in early March, ranged from the runway. The corresponding time vs heave profileabout 2 to 4 in. with the average being 2.7 in. This seen in Figure 10 shows irregularities occurring in theexceeded the average displacement values of l.6 and 2.6 vicinities of stations 5+00 and 17+00. The pavementin. correspondingto NicholsRoad'snewly reconstructed profile at station 5+00 became level following springand transition sections, respectively (Fig. 8). Although thaw, but did not do so at station 17+00-the location ofmore than expected. heave for this particular section of an abandoned railroad line. Since the pavement profilerunway was relatively uniform throughout both the did not become level at station 17+00, it can be assumedfreezing and thawing seasons. Vertical displacement at that this location was eitherconstructed to a grade higher
II

Original Road BaseSto. 2 0 00 to
4 Sta. 3 + 00
Transition Section -Sto. I + 50 toSta. 2 +00
" Newly Reconstructed Sectiono Sto. 0 O0 to Sta. I + 50
-2 Newton FieldSta. 4 + 00 to
Sto. 6 +00
.0
'0 20 10 20 10 20 '0 20 10 20 10 20 10 20 O 20Oct Nov Dec Jon Feb Mar Apr May
Figure 8. Average frost heave-Newton Field and Nichols Road.
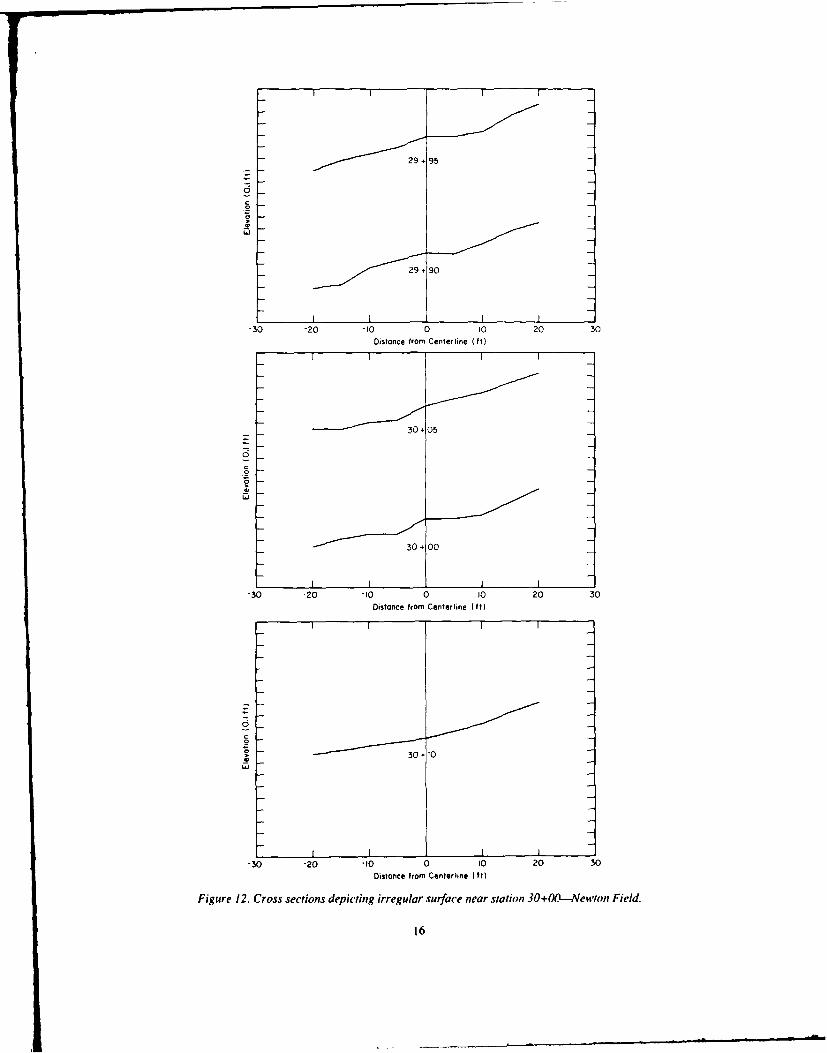
than planned or the underlying railroad bed prevented Figures 12a--c. The two most pronounced cracks in thisstation 17+00 from undergoing the consolidation expe- vicinity area transverse crack extending across the entirerienced by surrounding areas. No initial surface eleva- runway, andadiscontinuous longitudinal crack approxi-tions had been taken along centerline. mately 50 ft in length. Six shorter cracks were also
In contrast to the fairly uniform heave measured on observed.the grid between station 4+00 and station 6+00, there Additional cracks at locations other than the abovewere two areas that exhibited considerable differential include the following:heave. However, no initial surface elevations had been Taxiway -Transverse crack extending across taxi-established in these areas. The first of the two areas was way 3 to 4 ft from and parallel to thein the vicinity of station 8+00, where the pavement runway/taxiway construction joint.surface appeared considerably more uneven in March -Transverse crack extending across taxi-than in April. In addition to the uneven vertical displace- way 60 to 70 ft from and parallel to thement, a transverse crack developed across the entire runway/taxiway construction joint.runway at station 8+22 (Fig. II). This particular area Runway-Station 7+30: longitudinal crack 3 to 4 ftwill be discussed in furtherdetail with regardto ground- in length, approximately 2.5 ft left ofpenetrating radar and falling weight deflectometer tests. centerline.
Even more pronounced than the differential heave -Station 21+00: longitudinal crack, 2 ft innear station 8+00 was the irregular pavement surface length, approximately 2 ft from left edgeextending the last few hundred feet of the runway. This of pavement.roughness was first observed in early March. In contrast -Station 22+85 to station 23+00: twoto the differential heave in the vicinity of station 8+00, no transverse cracks, left ofcenterline, whichimprovement was apparent in April. At that time, a grid appear to be extensions of constructionof 5-ft intervals in each direction was established from joints.station 29+90 to station 30+10. Again, initial surface Figure 13 shows the approximate locations and orien-elevations are unavailable forcomparative purposes. but tations of the observed cracks.elevations as determined on 7 April 1987 are shown in
12

6T
6 Apr '87
9 Mar '87-
6 Apr '87
9 MT,87-7
22 Oct 86 5 -00
TI I I I
6rtoc from Ce8rie1
9. SMaion 4+087+0tiue9 rs ua eNw nFed
c1

6 Apr '87 /i
- 22 Oct O - 6-00
I I-
-16 -12 -8 -4 0 4 8 12 16
Distance from CenterIne (ft)
c __5 -
22 Oct '86 5 150
.stonce from Centerline (ft)
b. Stations 5+50 to 6+00.
Figure 9 (cont'd). Frost heave-Newton Field.
14

10
a
S2
aI 0
Planned Elevotion-
-6
-a0
0.00 4+00 8.00 12.00 16.00 20.00 24+00 28+00Slatiorn NumTber (11)
Figure 10. Sutfce elevations along centerline-Newton Field.
FI~qur, 11. Crack niear station 8+22--Nevvton Field.
15
29,9
LDj
-30 -20 -10 0 10 20 30Distance from Center line ft)
-30 -20 -10 0 10 20 30Distance from Center line (ft)
30 -20 t10 0 10 20 30Distance trom Centerline (tt)
Figure 12. Cross sections depicting irregular suiface near station 30+00L-Newton Field.
16
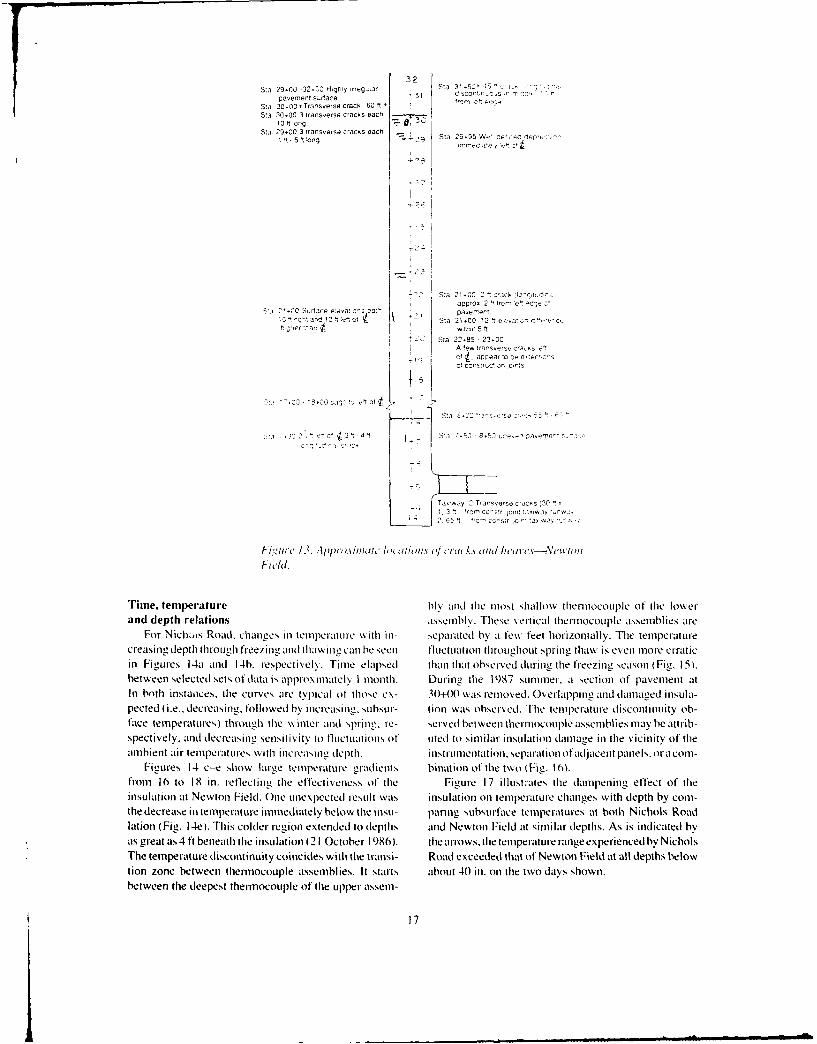
32S:a 29.00 32-00 H grflI rregoiar Sta 3',5C' 40 c r'
pavenrent s-race - 1 cvvvnl 1--,S n
Sia 30 .00 , Transverse Crack 60 t f,m 01 cSia 30.00 3 transverse cracks each
1 0 ft 0oS!a 29.00 3 transverse crackrs each
1 - CgSta 29 .95W,, Ie a, ep~c
approx 2 '1!f 'r t eS2' -~0 Svr3ce e v31! 2v ,0' paverent10 1 lqa0105~v -. la 21 0G 120~~a It c-
p -er :plrr wtny 50fSa 22.-85 - 23-00
A few transverse c'a,-acI e CCr 0vC . Cn1 S
C, Sli 8,53 0.'? re-re v0~ee s
rap a 2 T'csvrseccs (300
3I -~n -s~ n~rr
Fio I -lpprowma/ht, 1lo I IIr/u cr"/( ks 111 ca/r h'ucs- *Vuoll
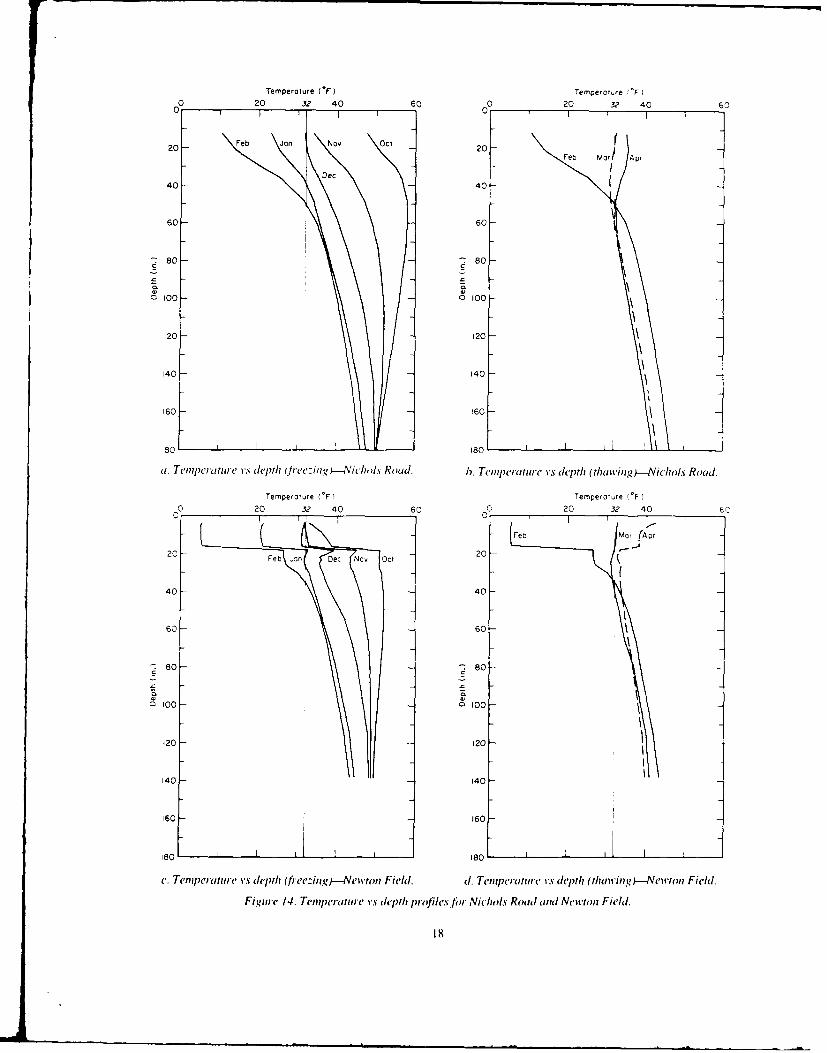
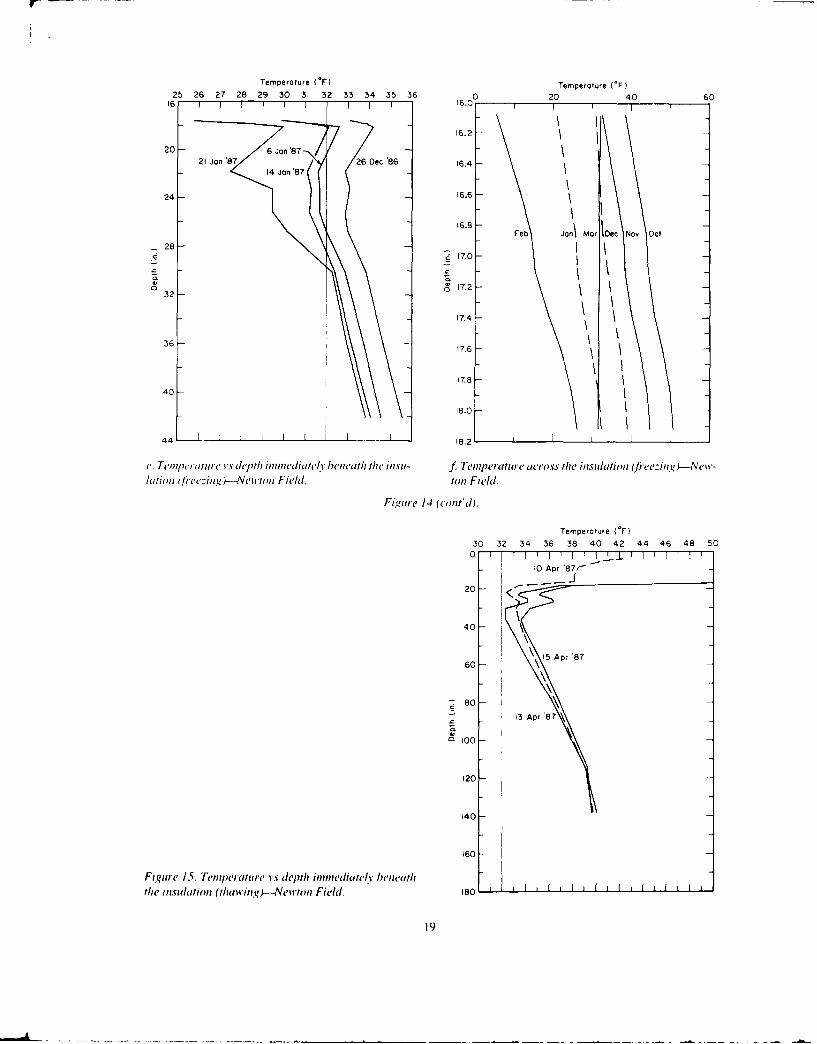
Time, temperature hly and thie mlos"t shallow, therilocouple of [lhe lowerand depth relations asst. mblv. These verical the~nloCOuIple assemblies are
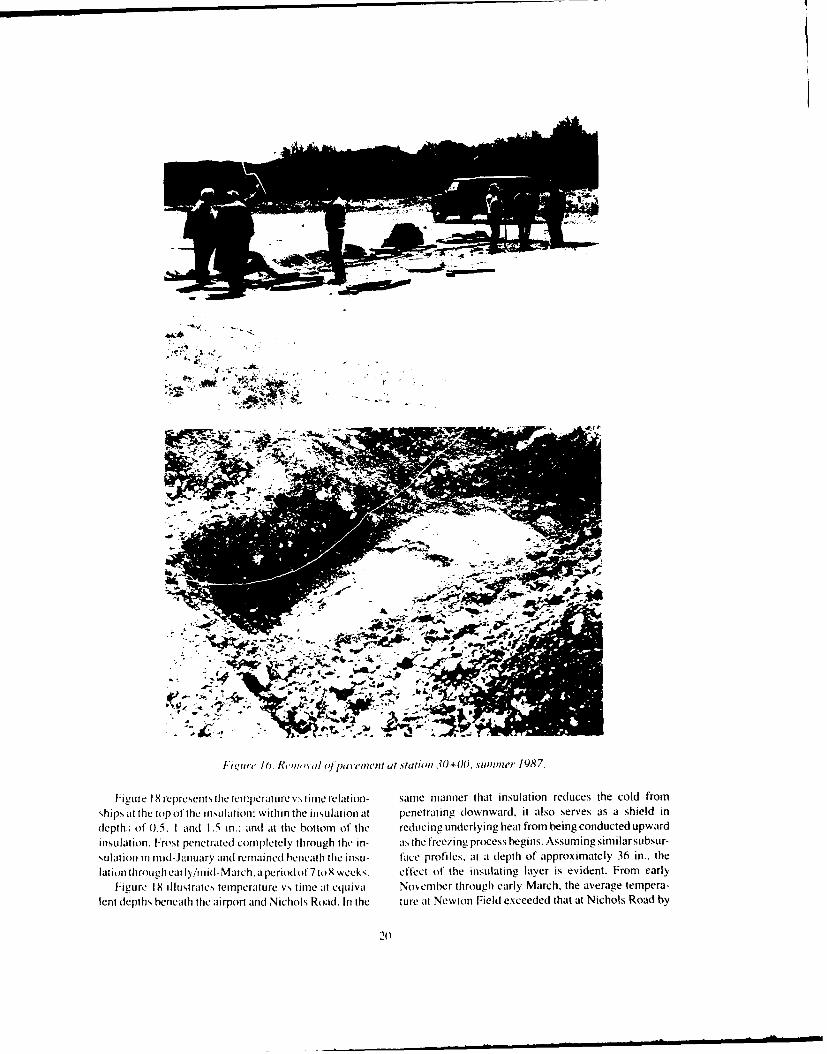
For Nich rrs Road. chares in temiperature w\ith in- separated by a few feet horizontally. The temperaturecreasing depth through treeztor. and thatwing canl be see~n fluctuation throughlout sprimS thaw is evenl more erraticin Fioures 14ai and 1 4b. respectively. Timie elapsed than that obsCee during" the freezing, season (Fig,. 15).between selected sets osf data is approximately I month. During the 19,S7 suimmer, a section of pavement atIn both instances, thle curves ate typical of those C.\- 30+00 wais removed. Overlapping and damaged insula-pected (i.e.. decreasing. followed by increasine". ssr- (ion was observed. Thle temperature discontinuity ob-face temlper'atures) through11 thle wI.inter and spr-ing. Te- Served between thermocouple assemblies may be attrib-specti ye ly. and decreasing sens it vityvt 1 tLi oat s (5of uted to s intli lar i nsu lat ion dailla e in thle v ic iitv of tileambient air temipert Les with i ncreasinrg depth. it ot mllenltaition,.sepa rat ion ot adjaicenlt panlels.or acoli-
Figures 14 c-e show large temperature gradients bination of the two (H.16).fromt 16 to 19 in. reflecting the effectivencss of thle Fi"ttre 17 i llUst:'ates, thle dampening effect of theinsulation at Newton Field. One ut~leXpeCted restilt Was insulation onl tenmperaturte changes with depth by coim-the decrease in temperature immediately below the insu- paring subsuirface temperatures at both Nichols Roadlation ( Fig. I14c). This colder regioni extended to depths and Newton Field at siiilr depthis. As is indicated byats great ts 4 ft beneath the insulation (21 October 1980). the arrows. thle temperature range experienced by NicholsThe temperature discontinuity coincides with thle transi- Road exceeded that of Newton Field at all depths belowtion zone between thermocouple atssembl ies. It starts about 40 in. onl the two days shown.between the deepest thlermnocouple Of thle Lipper assent-
17
Temperature (*F) Temperotre I F)
0 20 32 40 60 0 20 32 40 600 I 0
20 Feb Jon Nov Oct 20 - F Fe Apr
Dec40 40
60- 60
7 80 .80
1 I00 O 100
120 120
140 140
160 160
so 180 ,
a. Temperature Vs d(pth (]i'e-ing )--iVichols Road. h. Temlo-ature vs depth (thawviig--Nhiclols Road.
Temperoture (*Fl Temperoture (*F)
20 32 40 60 0 20 32 40 6CC C
- Feb M arAPt
20 Feb jar Dec Nov Oct 20
40 40
60 60
- 80 - 80
0 00 I 00 /1
120 120 -
140 140
160 160
180 1 180
c. Temperture Vs depth (tee'ingr-ee -Newton Field. d. Temperture vs depth (thawig)--Newton Field.
Figure 14. Tempnerature vs depth profiles fin Nichols Road and Newton Field.
18
Temperature (*F) Temperature ('F)25 26 27 2829 30 31 3233 34 3536 020 40 60
16 1 6.0 1 I
16.2
20 -6 Jan87
21ja'7 1 Jon '87 26 Dec 86 16.4
24 16.6
16.8 Feb Jan\ Mar IDec, Nov Oct
281 ~7.0
32 -~ 17.2
'7.4
36 -17.6 \
40 -17.8
'8.0
44 II I I I I I 18.2'I
e.Tmpctuoc vs deptuh iminedicitelY bc'neutl the initst- f Temperature across rte insulation Ltree--ing')t'wlatin (ftcc:ini i4 )Newi Field. ton Field.
Fig~ure 14 (co/It'd).
Temperature (*F)30 32 34 36 38 40 42 44 46 48 50
0 ' 1 11 1 1 t I.L I 1 1
-10 Apr '87/- -
20
40
615 IAp.-87
80
13 IApr 87\
120-
140
160
Figure /5. Temperatuire vs depth imtmediatel-v beneathrte insulation (fhaiiing )-Nei'on Field. IS0 L
19
I,7'
Fkiurr /16 Rewa cipjjjj~jjt gjtf(iem0J sOtl()Vnllef(' 1987.
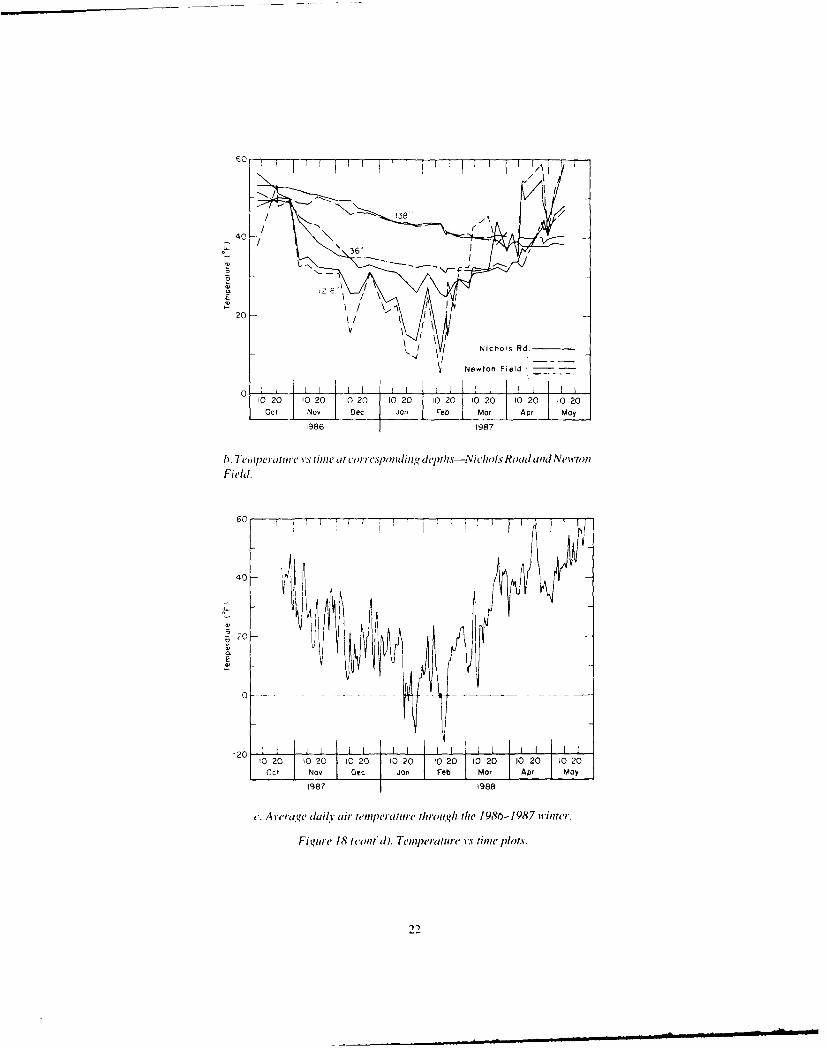
Figure 18 represents the temiperatutre v.,, time relation- same manner that insulation reduces the cold fromships at the top of the insujlation: within the insulation at penetrating downward. it also serves as a shield in(Iepth., of 0.5. 1 and 1.5 in.; and at the bottom of the reducing underlying heat from being conducted upwardinsulation. Frost PenletratedI completely through the in- ats the freezing process begins. Assuming similarsubsur-sulation in mid-January and remiained beneath the insu- faice profiles. at at depth of approximately 36 in.. thelati~n throuitheairly/iid(-iMarch.apecriodofit7toX weeks . effect of the insulating layer is evident. From early
Ficure 18 illustrates temperature vs time at equiva- Nosemiber through early March. the average tempera-lent depths beneath the airport and Nichols Road. In the ture at Newton Field exceeded that at Nichols Road by
20

Temperature (oF)0 20 32 40 60
20 I
40
60- Apr
80 IC ~ Oct
too -
20 1
140 L_160I
180 -
Figure /7. Temperature vs depth--Nic'hols Road andNewton Field.
60 I1 I ! I i I I I I I1
i I I I I I / A, I /
Top of tnsuiotion
40 //Z Fromt Penetration \41" Beneath Insulioon /\/'-
20 Bottom \ tI /
Ci II l i II l I I L
10 20 10 20 10 20 10 20 10 20 to 210 10 20 10 20OctI Nov Dec Jon Feb Mr Apr Moy
1986 1987
a. Temperature vs time through the insulation-Newton Field.
Figure 18. Temperature vs time plots.
21
4.0
13
20
FielNchosd..
60to Field;
10 20 10 20 0 20 '0 20 1020 10 20 0 20 10 20Oct Nov Dec jon Fe 'or Apr May
987 1987
1F emetirevime tit (crrespoingmectr v iepos
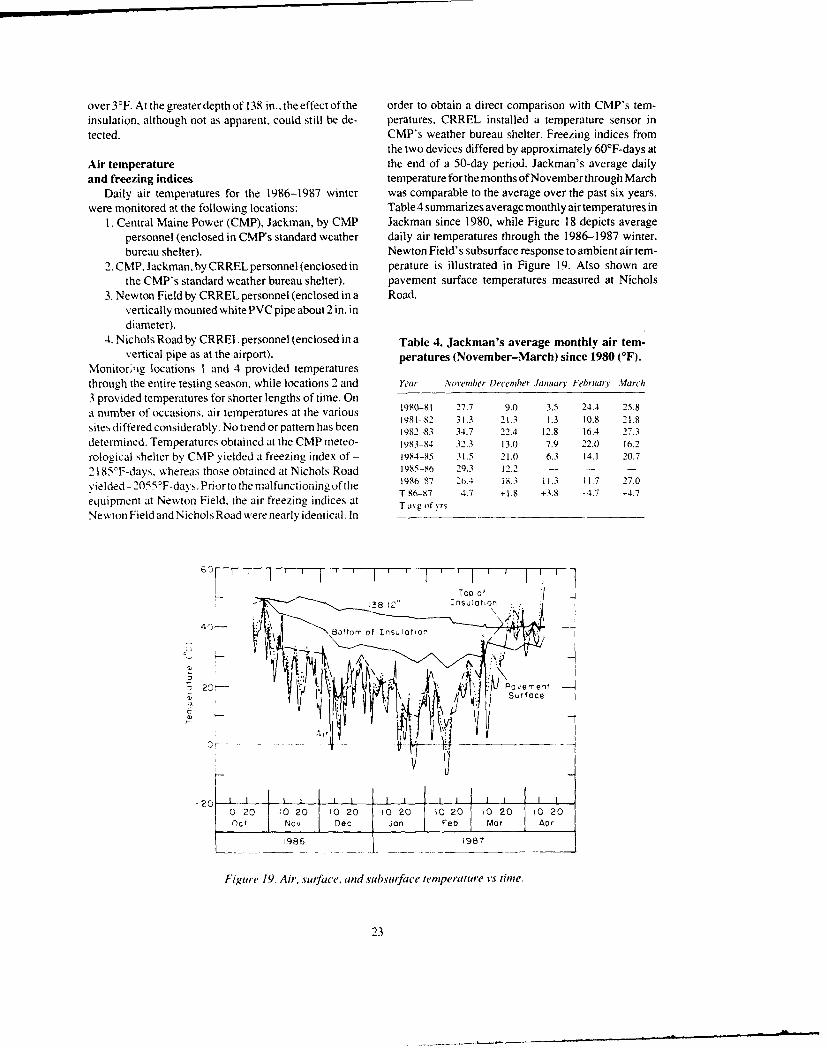
over 3°F. At the greater depth of 138 in., the effect of the order to obtain a direct comparison with CMP's tern-insulation, although not as apparent, could still be de- peratures. CRREL installed a temperature sensor intected. CMP's weather bureau shelter. Freezing indices from
the two devices differed by approximately 60'F-days at
Air temperature the end of a 50-day period. Jackman's average dailyand freezing indices temperature for the months of November through March
Daily air temperatures for the 1986-1987 winter was comparable to the average over the past six years.were monitored at the following locations: Table 4 summarizes average monthly air temperatures in
1. Central Maine Power (CMP), Jackman, by CMP Jackman since 1980, while Figure 18 depicts averagepersonnel (enclosed in CMP's standard weather daily air temperatures through the 1986-1987 winter.bureau shelter). Newton Field's subsurface response to ambient air tem-
2.CMP. Jackman. by CRREL personnel (enclosed in perature is illustrated in Figure 19. Also shown arethe CMP's standard weather bureau shelter). pavement surface temperatures measured at Nichols
3. Newton Field by CRREL personnel (enclosed in a Road.vertically mounted white PVC pipe about 2 in. indiameter).
4. Nichols Road by CRREL personnel (enclosed in a Table 4. Jackman's average monthly air tern-vertical pipe as at the airport). peratures (November-March) since 1980 ('F).
Monitor'ng locations I and 4 provided temperaturesthrough the entire testing season, while locations 2 and Year Novemher Deceniher January February March3 provided temperatures for shorter lengths of time. Ona number of occasions, air temperatures at the various 1980-82 27.7 9.0 3.5 24.4 25.8198t-82 31.3 2t.3 t.3 10.8 21.8sites differed considerably. No trend or pattern has been 1982-83 34.7 22.4 12.8 16.4 27.3detemained. Temperatures obtained at the CMP meteo- 1983-84 32.3 13.0 7.9 22.0 16.2rological shelter by CMP yielded a freezing index of- 1984-85 31.5 21.0 6.3 14.1 20.72185F-days. whereas those obtained at Nichols Road 1985-86 29.3 12.2 - - -
ielded -2055 0F-day.Prior to the malfunctioning of the 1986 87 26.4 i8.3 11.3 11.7 27.0T° 86-87 -4.7 +1.8 +3.8 -4.7 +4.7
equipment at Newton Field. the air freezing indices at4- ~ T iig of Nyrs
Newton Field and Nichols Road were nearly identical. In
60 r I I I I
.38 t2" Insuition • "
Bottom of Insulation
:j" PovementSurface
,o I , I oI I o I ,oI o0 20 ;0 20 10 20 0o 20 0o 20 10 20 0G 20Oct Nov Dec Jon Feo Mar Apr
19861981
Figure 19. Air. surface. and subsuiface temperature vs time.
23

400 --
0-
Nchols Rd-Boo-" - -_
-vi00
-1600-
-2000
0o0 20 10 o 2 10 20 10 20 10 20 10 20-Oct No~ Dec Jo Peb Mor Apr
1986 1987
a. Sufacefree:ing index vs time.
-400- 32'-40( -- Isothermr
Above or Within Below Insiultino80 Insuloon
-(200(
-1600 - Nchos Rd -
- 2000M
-200 1-24o ,' I ,I 1 I I I10 20 10 20 10 20 (0 20 1O 20 tO 20 0 20Oot N_ _ec Join Feb Mor Apr
i986 1987
h. Airfree:ing index vs time.
Fjure 20. Air and sutficefi 'e:ing indices vs fiyneftr Newton Field and Nichils Road.
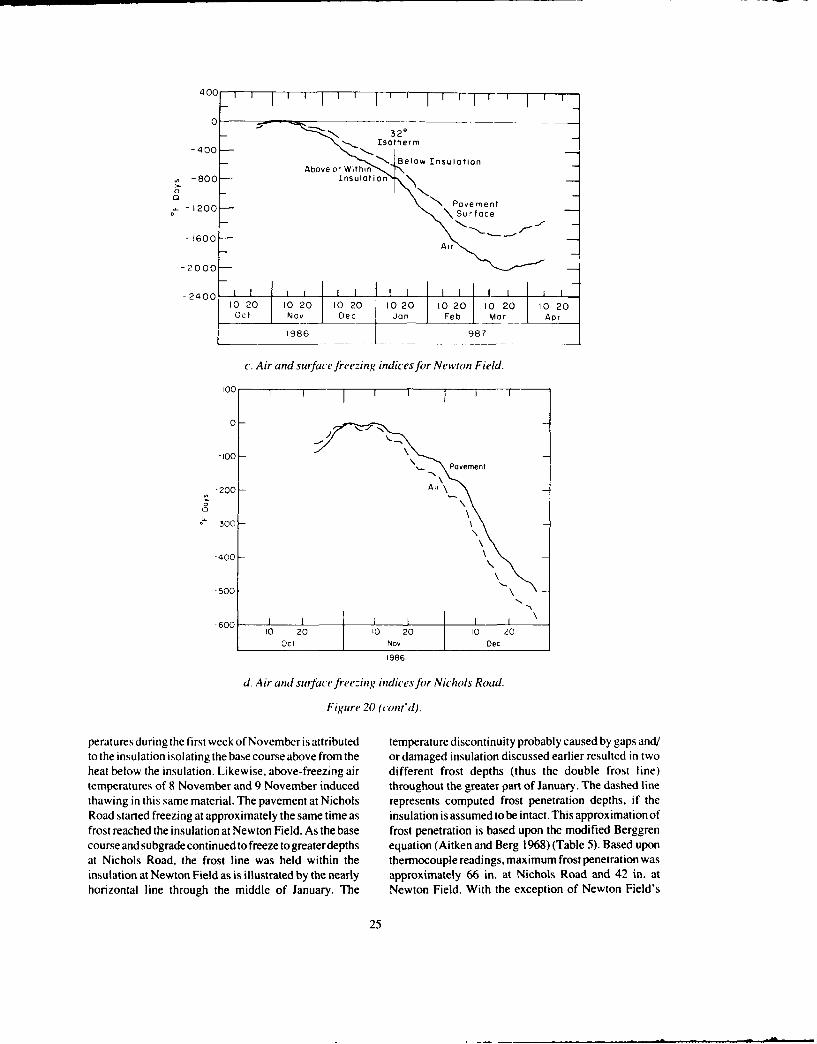
Figure 20 shows relationships among air and surface freezing in Figures 20c and 20d. As discussed in thefreezing indices, time. and location. Figure 20 shows previous section. frost was determined to have pen-surface freezing index as a function of time for both etrated completely through the 2 in. of insulation in mid-Newton Field and Nichols Road; due to malfunctioning January. This frost penetration occurred only halfwayof the Newton Field equipment, airport data are avail- through the freezing season at a freezing index of onlyable only through 29 December 1986. The more nega- half the total freezing index for 1986-1987 (Fig. 20d).tive surface freezing index at Newton Field is indicativeof a higher n-value (ratio of surface to air freezing index) Frost penetrationthan at Nichols Road. Air freezing indices from CMP. Figure 21 a shows the depth ofthe 32°F isotherm as aNewton Field, and Nichols Road can be seen in Figure function of time at both test sites. The initial freezing of20b, and comparisons between air and pavement surface the ground at Newton Field following subfreezing tem-
24
400 I I T--I r 1 - -i7-11
0 -32*
-400 . Isotherm
-0" Below InsulationAbove o' Within N
, 800 - insulation
k Pavement-L1 200 \ Surface
-1600 Nr
Air-2000-
-40 020 10020 10 20 10 20 10 20 10 20 10 20Not v Dec ion Feb Mar A Ar
1986 1987
c. Air and surface freezing indices for Newton Field.
,o I I 1
200
0 --100 - Paement
-200 - Air \
-300
-400
-500
-600tI10 20 10 20 10 20
Oct Nov Dec
1986
d. Air and suiface freezing indices for Nichols Road.
Figure 20 (cont'd).
peratures during the first week of November is attributed temperature discontinuity probably caused by gaps and/to the insulation isolating the base course above from the or damaged insulation discussed earlier resulted in twoheat below the insulation. Likewise, above-freezing air different frost depths (thus the double frost line)temperatures of 8 November and 9 November induced throughout the greater part of January. The dashed linethawing in this same material. The pavement at Nichols represents computed frost penetration depths, if theRoad started freezing at approximately the same time as insulation is assumed to be intact. This approximation offrost reached the insulation at Newton Field. As the base frost penetration is based upon the modified Berggrencourse and subgradecontinuedto freezetogreaterdepths equation (Aitken and Berg 1968) (Table 5). Based uponat Nichols Road, the frost line was held within the thermocouplereadings, maximum frost penetration wasinsulation at Newton Field as is illustrated by the nearly approximately 66 in. at Nichols Road and 42 in. athorizontal line through the middle of January. The Newton Field. With the exception of Newton Field's
25

2- ~Airport--
0
\
60
so -
- Oc No Dec- Jn Fe - mar Apta. Frost depth vs tinie-Nichols Road__98______1987___ and Newton Field.
20 Frost DeptPeneltroton
40
60-
_ 20 0 2C .0 20 0 20 10 20 10 2C
C. c" Dc ( n Fb mr Ap 1) Frosrthaw depth vs tjme--Nichols
- - - Road.
Triaw IDeptht
20- Frost
Penetration
-40-
60
80020 020 020 1020 1020 10 20 10 20Oct No D ec ion Feb Mor Apr
- 986 1987 c. Frost/thaw depth i's time-NewtronField.
Figure 2 1. Dept/i vs time for Nichols Road and Newton Field,
26

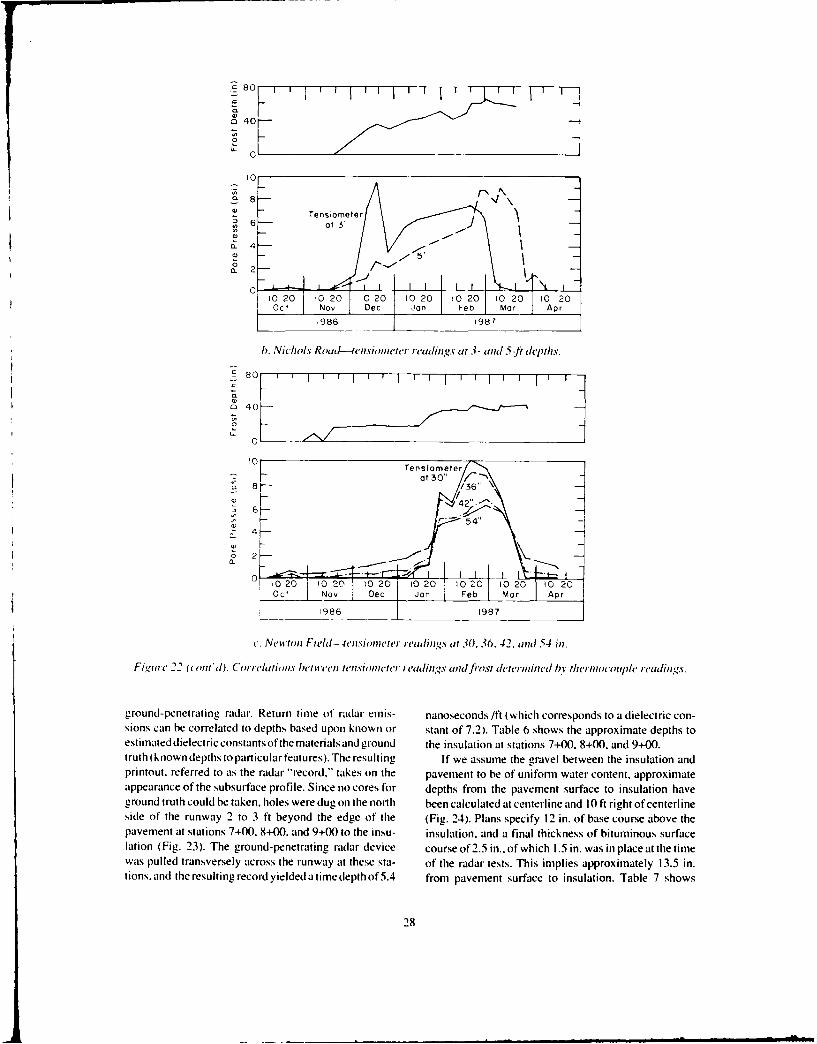
Table 5. Frost penetration depths computed using the double frost derth line (6-28 January 1987), the ratemodified Berggen equation. Newton Field--maximum frost of frost penetration at Newton Field is less than atdepth = 42 in. (thermocouple Readings) Air freezing index = Nichols Road, illustrating the effect of the insulating2185°F'days, length of freezing season = 139 days (CMP) Sur- layer. Figure 21 illustrates thawing as it occurredface freezing index = 1439°F-days (n = 0.85). from the surface downward, as well as from the lower
Thermal frost line upward. Two thermocouple recorders wereWater content conductivity Thickness Frost used during spring thaw. Since one detected some
Dry density of base course of insulation of insulation penetration subfreezing temperatures while the other indicated(PCF) (weight %) (BTUI*F hrft) (in.) (in.) total thaw, depths of frost and thaw through the endof130 6 0.0145 2 24.5 March orbeginning of April have been approximated130 6 *0,015 2 24.7 by the dashed lines.t30 6 **0.01775 1.2 29.8 Depths at which the tensiometers indicated in-130 6 0.0145 t 29.3 creased pore pressures coincided with those at which130 6 - 0 55.1 the thermocouples recorded subfreezing tempera-
130 10 0.0145 2 24.8 tures (Fig. 22). Pore water tensions beneath Nichols130 9 0.0145 2 24.8 Road increased rapidly as the frost line penetrated,130 8 0.0145 2 24.7
130 7 0.0145 2 24.8 indicating a movement of moisture to the freezing130 6 0.0145 2 24.5 front and lowering of the water table. Pore water130 5 0.0145 2 24.5 pressures beneath Newton Field increased rapidly130 4 0.0145 2 24.0 when the frost line penetrated beneath the insulation130 3 0.0145 2 24.0
130 2 0.0145 2 23.8 (Fig. 21 c) because of the large tensions imposed by130 1 0.0145 2 23.2 the subgrade soil as it was frozen.
135 8 0.0145 2 24.8135 6 0.0145 2 24.6 Ground-penetrating radar135 1 0.0145 2 23.3 To understand the reason for the decrease in tem-
120 13 0.0145 2 25.0 peratures beneath the insulation (i.e., the insulation120 8 0.0145 2 24.6 might be damaged or the panels separated) and to120 1 0.0145 2 23.0 obtain a profile of the frost line. ground-penetrating
135 8 - 57.2 radar tests were conducted on 25 and 26 March 1987135 1 - 46 at both Nichols Road and Newton Field. The insula-
120 13 - 56.2 tion was discernible on the radar record, but the frost120 I - 40.5 line could not be detected.
Typically a change in water content occurs at theThermal conducti% it supplied in UC Industries Literature (UC Industries Terae a an y t er contentcoccurs the
1986). interface between any two subsurface layers. This**Thermal conducti'itv for insulation compressed to 1.2 in. change, and thus the interface, can be detected by
60 , -- I-- I FTI,
40
fi20-0
a. Nichols Road--4ensiometer read- -_0ings at 3-re depth.
6 98 18
27 2
~- 4
0Fiur 2.Corlaiosbewente- 0 20 00 20 1200 20 10 20 10 20 10 20
Fiur22Crrlainsbe wele- c Nov De aon Fab Mar Aprsiometer readings and frost deter-19698mined by thermocouple readings.9698
27
C 0
C
0
U. 4
0
rn 40
0
a- 2 -
0 1
02
0
_____________________________ __________________
c. Ne ntn Fit'(diensianiIf,,eans a 6 2 n 4iFi~,,' 2 (a/~d) Crreatan hcrn'enICISja/eh/Teaduns C//d/Flr - ht'/h/'Ib h'/Icipc edn
groud-pnetatin raar.Retun tme f raar mis nansecnds/ft whih crresond toa dilecricconsinsca b orelte o ephsbse uonknw o san f .2. ale6 hos h aprxiae ephst
esim8e dilcrccntns/ftemtrasan3r6"dteislaina ttos7+0 +0 n +0truth~knowndpthstoparticlarfeatures)Theresulti7 lferasm h rvlbtenteislto npritotreerrd o s he adr reord' aks n he avmet o b o uifrm atr onent"aprxiat.tpeaane f hesusufae roil. ine o ors or deth fomth pveen srfcetoinultin 'v
c~oud ruh oud e aknhoeswee ugonth nrt bencacuatd t enerin ad ~f rgh o cntrln
22

lr .
"OAK, I.-- ". .', . ," • .'. ,,1.. .t4-4
Ar
Figure 23. Known depth to insulation usedfor ground-penetrating radar calibration.
Table 7. Depths from groundsurface to top of insulation
Table 6. Times and depths to insulation at cross sections at stations measured alongside the edge
7+00, 8+00, and 9+00 determined by ground-penetrating radar of runway.
tests. Time is in nanoseconds and depth is in inches.) Lqt Right
Station (ini.) f in.)
Ltation (points Station 7+00 Station 8+00 Statlio 9+00
ilong iros. im Dept/ Tinie Dept/i Time Ieep'th 4 + 50 157±+00 16set'lio) tits) fin~l OLtS) fin.) (Its) (ill.) + 017+50 9
Adjacent it) north 8 +00 7edge of A/C pavement S 18 2.5 6 3.5 88 + 17 6 10.5
8+22 7 I1North edge of 8 + 27 7.5 12.5A/C pavement 7.5 17 2.5 6 3.5 8 8+ 50 7.5 12.5
9+00 7 13.5Centerline 6.5 14 3 7 6 3.5 9 + 50 12
Approximatey 8 t 10+00 9 10.5
from south edge of 5+100 13 10.5A/C pavement - 8.5 19 - 20±00 13.5 14
25 + ) 13 15.5
South edge of 27+00 12
A/C pavement 5.5 12 5.5 12 5.5 12 30 + 0 9
actual depths to insulation at either side of the runway, insulation (2nd set of dark banids) to the surface (Fig.and Table 8 shows calibrated depths to insulation at the 25a). The lower insulation surface 5 to 15 ft right of thecenterlineand 10 ft rightofthecenterline.Thetwotables centerline in Figure 25a coincides with a repair patchshow the insulation to be within 6 in. of the pavement which is visible on the pavement surface. This samesurface in the vicinity of station 8+00 to station 9+00. A region is seen longitudinally in Figures 25b and 25c, theradar record parallel to and offset 5 ft from the transverse former representing a centerline run, the latter, parallelcrack at station 8+22 also shows the proximity of the to and 10 ft right of the centerline. In these figures, the
29
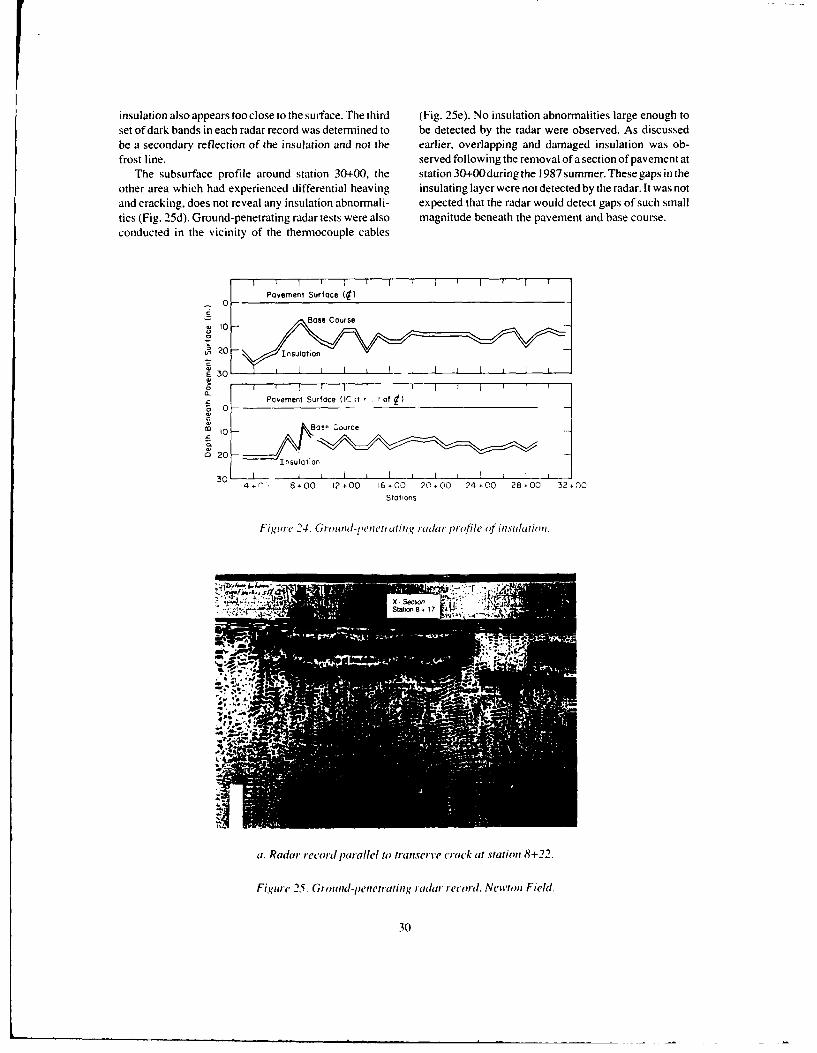
insulation also appears too close to the surface. The third (Fig. 25e). No insulation abnormalities large enough toset of dark bands in each radar record was determined to be detected by the radar were observed. As discussedbe a secondary reflection of the insulation and not the earlier, overlapping and damaged insulation was ob-frost line. served following the removal of a section of pavement at
The subsurface profile around station 30+00. the station 30+O0during the 1987 summer. These gaps in theother area which had experienced differential heaving insulating layer were not detected by the radar.It was notand cracking, does not reveal any insulation abnormnali- expected that the radar would detect gaps of such smallties (Fig. 25d). Ground-penetrating radar tests were also magnitude beneath the pavement and base course.conducted in the vicinity of the thermocouple cables
Pavement Surface 4~)
Bose Course
0-
tPavement Surface (IC it tofz 0 - ______________
Mo 10 os- Cource
~20 _________________Insulataon
4.f- 8.00 12+00 16+00 20.+00 24.00 28+00 32+00St ons
Fiig',ic 24. G,~iwid-J'enericating' ItImkil pretiof ief i idtittti
a.Rdrrcodiaahl ofasrv ic tstto +2
Fi'~c 5.Grud-tce~arn' adr ecrd ei'tn ied
30b +1

11 Ste 8 00 Sta 9 . o
Recoder Ma~urcw.
b,. Lmiki',udinal radar r c ord along c enterline, station 8+00 to station 9+00.
10 ft South f tf
and Parallel to~
Longitudina raa ecr 0tr~h f nprlllt eneln, tto
8+00 o sttion9+00
F*qur 25(onV
31V%

.. 0.
SV 5. - )
d.La 'ruinl aiwi(((lc c/ug~clti~ii' ~it0I ~~~ a tainow 1+0
KF' OwTe D
U-
Ip
A. Raa reor tiis hrloo ecbe ea tto +0Figure~ ~ ~ ~ ~~~~~. 25(ot() aa eod etnFed~ ~ osoc 32
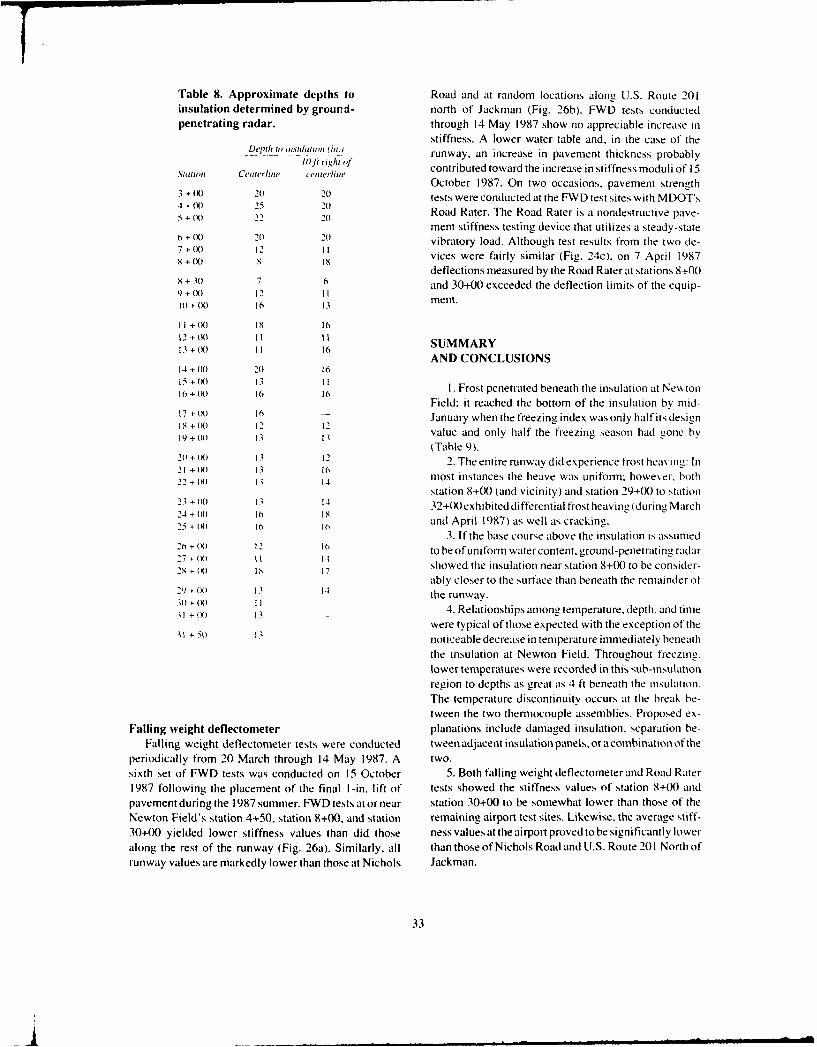
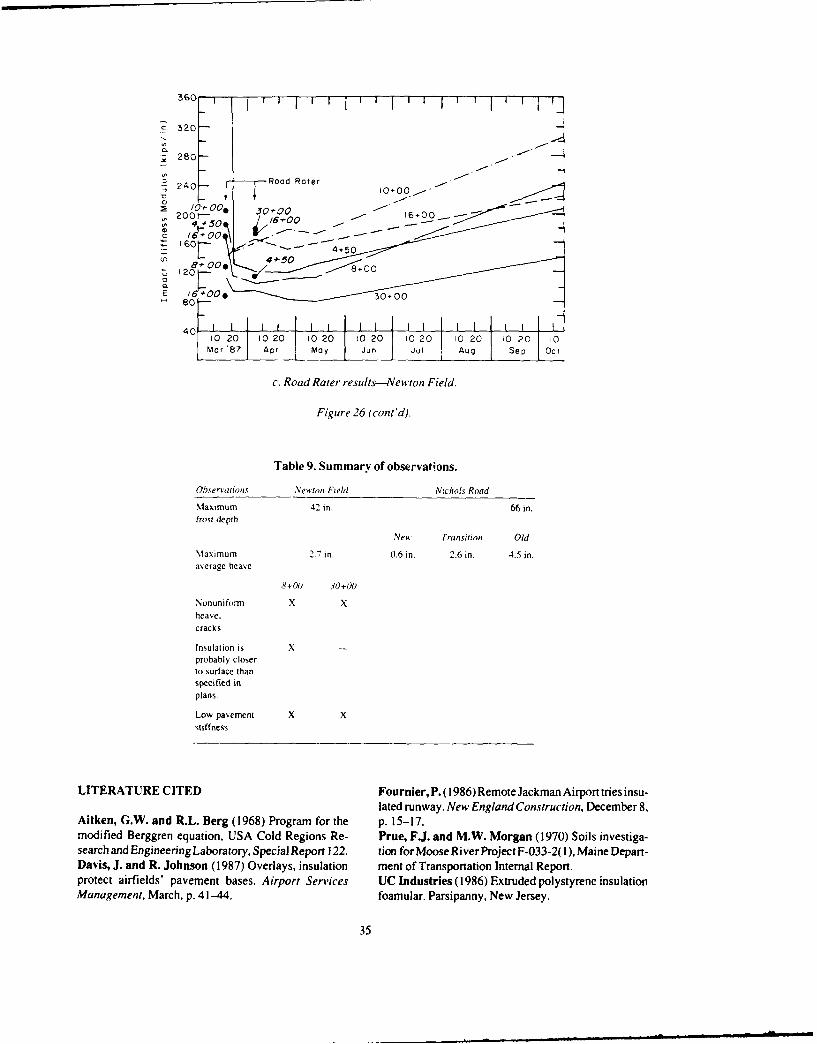
Table 8. Approximate depths to Road and at random locations along U.S. Route 201insulation determined by ground- north of Jackman (Fig. 26b). FWD tests conductedpenetrating radar. through 14 May 1987 show no appreciable increase in
stiffness. A lower water table and, in the case of theDept'h itinsulttian (in, . runway, an increase in pavement thickness probably
1]? right ,tq contributed toward the increase in stiffness moduli of 15October 1987. On two occasions, pavement strength3 + (K) 2(0 20 tests were conducted at the FWD test sites with MDOT's4 + 0) 25 20 Road Rater. The Road Rater is a nondestructive pave-ment stiffness testing device that utilizes a steady-stateo + 1 2) 20 vibratory load. Although test results from the two de-7 + W 12 11 vices were fairly similar (Fig. 24c). on 7 April 1987deflections measured by the Road Rater at stations 8+00, + 30 7 6 and 30+00 exceeded the deflection limits of the equip-9)+ (K) 12 I Iil + t0 12 13 ment.IO+00 16 13
13 + W Is I (6 SUMMARY12 + W{I0 I I SUM ARAND CONCLUSIONSI4+00 20 16(5 + O0( 13 I16 + (K) 16 16 I. Frost penetrated beneath the insulation at NewtonField: it reached the bottom of the insulation by mid-17 + 111 i6 - January when the freezing index was only half its designI' +(K) 12 12 value and only half the freezing season had gone bv19 +( ) 13 13
(Table 9).20 + (K) 13 12 2. The entire runway did experience frost heaving: In2) +1K) 13 1621 + W) 13 46 most instances the heave was uniform: however, bothstation 8+00 (and vicinity) and station 29+(X) to station23 +)0 13 14 32+(X)exhibited differential frost heaving (during March24 +)) O0 1 i24 + 00 it) 8 and April 1987) as well as cracking.2i + O0 J6 I16Z
3. If the base course above the insulation is assumed26 + W 12 16 to be of uniform water content, ground-penetrating radar27 +00O 1 | 14271, +W I's 17 showed the insulation near station 8+00 to be consider-2,±K +(}I S 17
ably closer to the surface than beneath the remainder of29+0) 11 14 the runway.
0+ + ( 13 4. Relationships among temperature, depth, and timewere typical of those expected with the exception of the
+ 3 noticeable decrease in temperature immediately beneath
the insulation at Newton Field. Throughout freezing.lower temperatures were recorded in this sub-insulationregion to depths as great as 4 ft beneath the insulation.The temperature discontinuity occurs at the break be-tween the two thermocouple assemblies. Proposed ex-
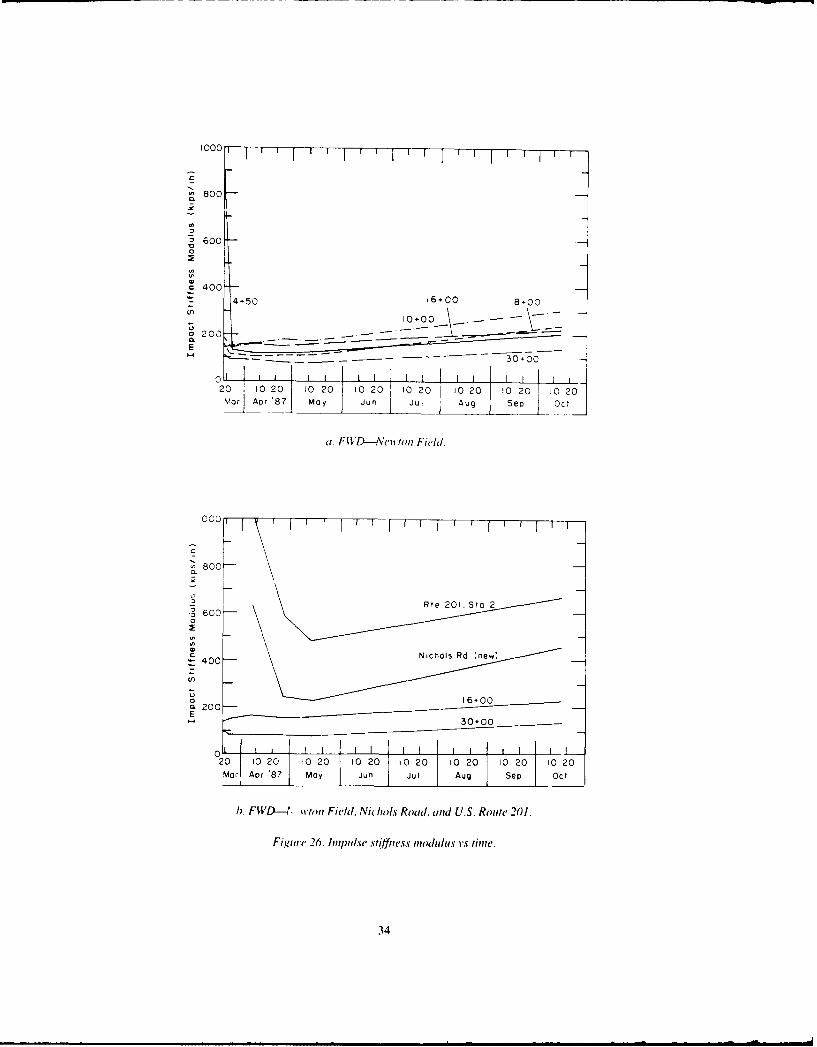
Falling weight deflectometer planations include damaged insulation, separation be-Falling weight deflectometer tests were conducted tween adjacent insulation panels. or acombination of the
periodically from 20 March through 14 May 1987. A two.sixth set of FWD tests was conducted on 15 October 5. Both falling weight deflectometer and Road Rater1987 following the placement of the final I-in. lift of tests showed the stiffness values of station 8+(X) andpavement during the 1987 summer. FWD tests at or near station 30+00 to be somewhat lower than those of theNewton Field's station 4+50, station 8+00. and station remaining airport test sites. Likewise, the average stiff-30+00 yielded lower stiffness values than did those nessvaluesattheairportprovedtobesignificantlylowealong the rest of the runway (Fig. 26a). Similarly. all than those of Nichols Road and U.S. Route 201 North ofrunway values are markedly lower than those at Nichols Jackman.
33
i
*~800
S600
c00
00O
020 0 20 0 20 10 20 10 20 1 0 20 10 20 1 0 20
u. FIVD-Ak'a'tn Field.
800-0
Z400-
(I?
S200E
-~ 30.00
20 0 20 1 0 20 10 20 '0 20 10,20 10 20 10 20Marl Apr '87 May Jun Jul Aug Sep Oct
b,. FWD-4 t-ton Field, Nichls Road, anid U.S. Rowec 201.
Figure 26. Impulsve .vhffiu'ss modulus vs time.
34
c 320-
f 240 Rod Rater040
S /0'- c00. mo200r- 300
160 1
4 0 8+00
E 60 00
'020 1Q20 4020 02 '00 12 '20 0Mar87 Ap My un Ju Ag.ep Oc
4.Ra Rtrreut-Nwo0Fed
Fiur 260 8+00 d)
Tal 9.Sm ay fosrvt0s
Obsrva c.n RodRtrslNewton Field.NcosRa
Mlaximum 42 in. 66 in.frost depth
Newi Transition Old
Mlaximum 2.7 in. 0.6 in. 2.6 in. 4.5 in.average heave
8+00 30+00
Nonuniform X Xheave.cracks
Insulation is Xprobably closerto surface thanspecified inplans.
Low pavement X Xstiffness
LITERATURE CITED Fournier, P. (1986) Remote Jackman Airport tries insu-lated runway. New England Construction, December 8,
Aitken, G.W. and R.L. Berg (1968) Program for the p. 15-17.modified Berggren equation, USA Cold Regions Re- Prue, F.J. and M.W. Morgan (1970) Soils investiga-search and Engineering Laboratory, Special Report 122. tion for Moose Ri ver Project F-033-2( I), Maine Depart-Davis, J. and R. Johnson (1987) Overlays, insulation ment of Transportation Internal Report.protect airfields' pavement bases. Airport Services UC Industries (1986) Extruded polystyrene insulationManagement, March, p. 41-44. foamular. Parsipanny. New Jersey.
35

APPENDIX A: GRADIATION, HYDRAULIC CONDUCTIVITY,AND MOISTURE RETENTION DATA.
20 20
40 40
60 60=D1, 2.067 '3 1.9
80 Gs=27180 Gs = 2.71
100 -4 -3 -, -,I' I -I I~ I-l, I f 111 110L l~f ' )) '
10, i 10- O 1 1 10 105 10, 10- 10- c 10 0t
Hydraulic conductivity (cm/hr) Hydraulic Conduclivity (cm/hr)
Figure Al1. Hydraulic conductivity-Newton Field. gravel base. Figure A4. Hydraulic conductivity-Nichols Road, sand sub-base.
0] 0-- - - T - -i l F I I 1 ,0 1 1 1 111111 ~ 1 11 11 1 1 1 1 11 1 1 1 11 1 1 1
20- 20 [ Id =i 1. 773
a s =2Z74
40' ----240 o Extraction
40 40 H Absorption
Y 1.859 -. 6
& G 2,7 a_80
1010 05 -i OF -3 1 -21010 tO1 10 10-2 t- o 10 ' 10<
Hydraulic Conductivity dcm11) HydraIic Conductivity (cmihr)
Fig~ure A2. HydraulIi c conduct iv ity-Newton Field. sand S ubbase. Figure,10. Hydraulic conduct ivity-Nichols Road. subgrade 3 ft(jeep.
0 0 111 l lJ Iltii 111
20 iod1775 20 Y,=1 874
40 G2 78 1aG = 2,74
Extraction in 40 0Etato40~ AbAborption
60 a 60
80 80
10 5 10 10 -3 10 - 16' 0' to-s 10-4 10-3 10-2 t6 100
Hydraulic Conductivity (cmnihr) Hydraulic Conductivity (cm/hr)
Figure A3. Hydraulic conduct iv ity- Newton Field station 4+55, Figure A6. H-ydraul ic conductivity-Nichols Road. subgrade 4ftsubgrade. deep.
37

0 1 P l IIII I I I 1[11 1 1 u1 t 11 11 1 1 1 1
20
T,40
60 Nichols Rd. (0f) 0a, -. _Nichols Rd. (3t)
a.
80 Airport (bagB8)
1001010 10 10 -2 10 10
Hydraulic Conductivity (cmlhr)
Figure A7. Hydraulic conductivity -subgrade soils.
U.S. Sid. Sieve Size and No Hydrometer U.S. Sid. Sieve Size and No. Hydrometer4 10 40 200 3 ~ 4 t0 40 200
10 11 T M 'l17 il l 100 Trf
06
Z~re -F~e c-se[Me'LM( _ ,, CseI Fin CalMu I FH itCa
in e I .
40 204 ni4 4 10 4 0
10 1 31 01 0001 00100 1 1 1T . .0 0
Gra soem)Ga~ u m
FtgueA8 Grainsied SriuiznNwo~l~uge Figrem)O Grain ize itibto-NwomFed
.5- to 3-ft depth liudo iin =2,plastic liiub2,grade 0fet, liquid limit 2 2, plastic limit = 11asictplasticity~~~inex idx=1plsiciyide. 0
U S Sev Se odNoHyroetr .S51 Sev Szean N Hdr3ee
U S. Std. Sieve Size and No. Hydrometer
100 T 1 30
80 Yd. 1 859
a 2060 Total O
I I 010
~40
20 0 10 2Percent Water (oit)
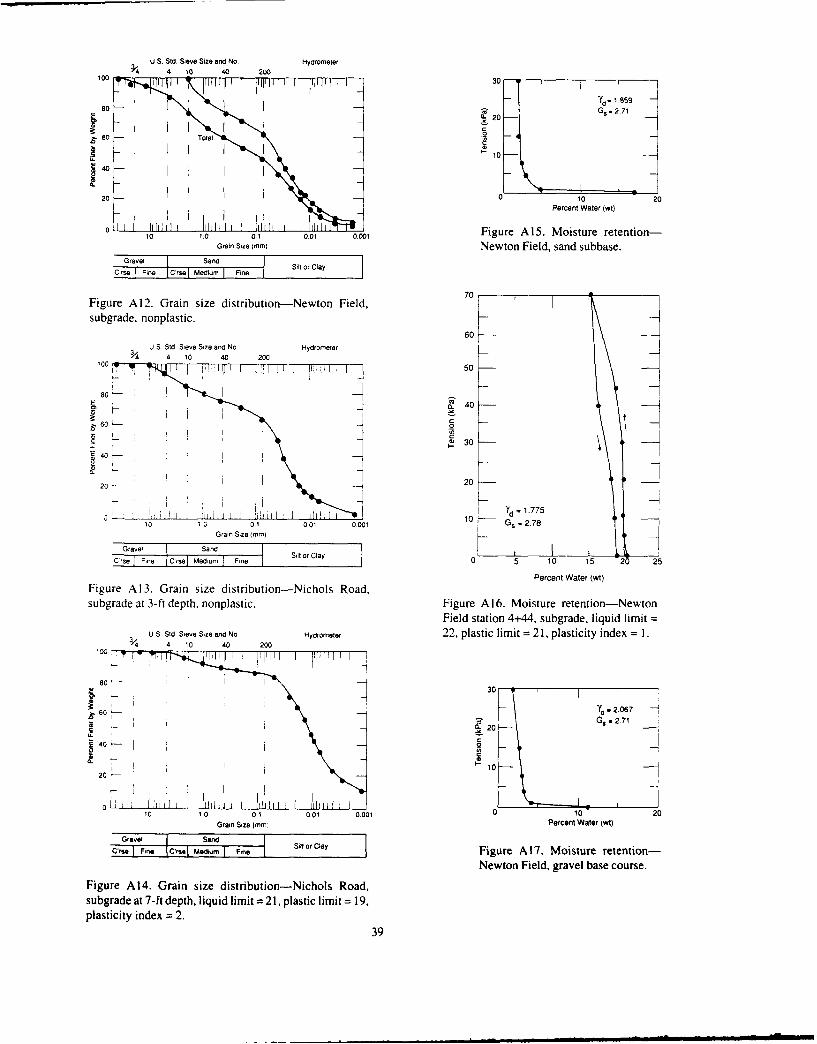
0 o01 0.1 001Figure A15. Moisture retention-GanSize (mm) Newton Field, sand subbase.
Gravel Sand -I Sl rCaOrse Ine C'rse Medium I Fine
Figure A12. Grain size distribution-Newton Field, 7
subgrade, nonpiastic.
60U S. Sid, Sieve Size and No. Hydrometer34 4 10 40 200
100 77 . 50
806 .Q 40
0
20- 20
LK 10 Y 1.775
10 13 0.1 0.01 0.001GS 27Grairn Size (minII
Gia~we SandSilt or ClayC rse IFone Crse Medium I FIne ] 0 5 10 15 20 25
Percent Water (wI)Figure A13. Grain size distribution-Nichols Road,subgrade at 3-ft depth. nonplastic. Figure A16. Moisture retention-Newton
Field station 4+44, subgrade. liquid limitU S Std Sieve Size end No ~ Hydrometer 22. plastic limit 2 21, plasticity index = 1.
;'0 4 10 40 200
80 j 3
[ . Y, -(42,067
SG, -.2.71C60-L -A20
20- '10--
10 10 0101 0,0 10 20GrainSize(mm Percent Water (WI
Gravel Sand Sf rCaCree Fine Crse Medliurn FiHe S~tolyFigure A 17. Moisture retention-
Newton Field, gravel base course.Figure A14. Grain size distribution-Nichols Road,subgrade at 7-ft depth, liquid limit= 21, plastic limit = 19.plasticity index =2.
39
30
Yd- 1.794iG S - 2.71
20
.0
0 10 20Percent Water (wt)
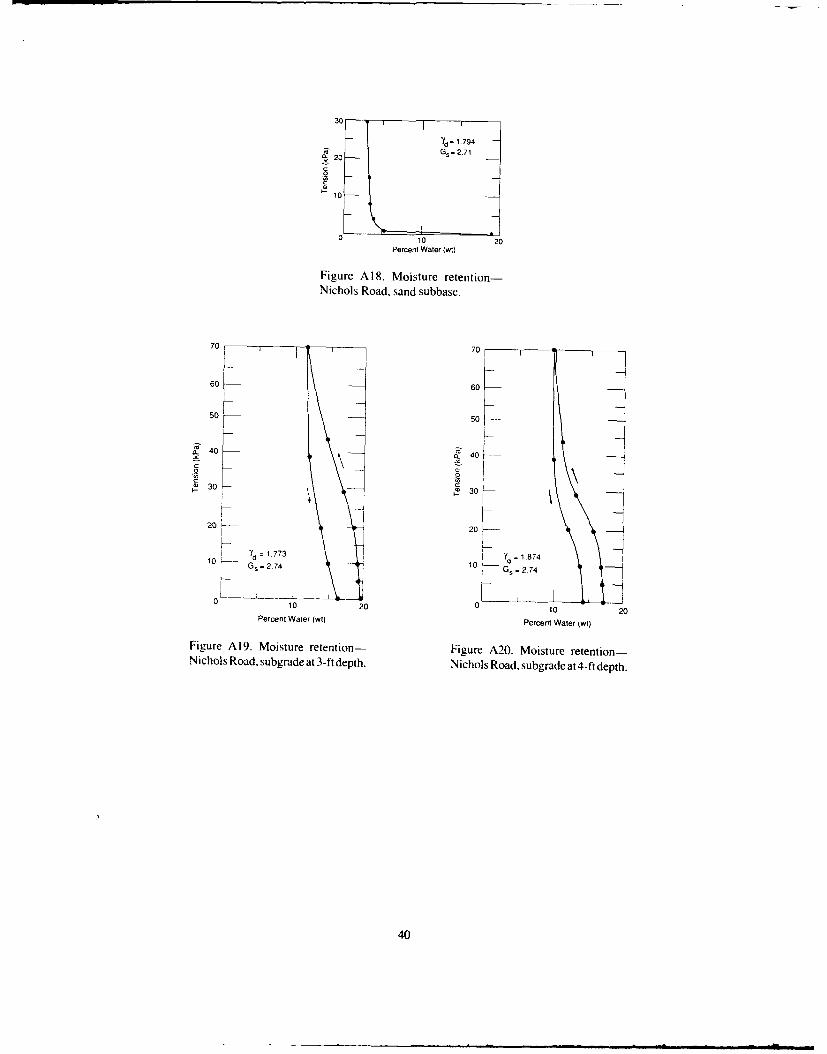
Figure A18. Moisture retention-Nichols Road, sand subbase.
70 70
60 60
50 50
Q 4
~30 ~30
20j
i Y, = 1.773 1 =187410 - G s = 2.74 G10 -- 7
oL
- -I - 0j
0 10 20 10 20Percent Water (wi) Percent Water (w)
Figure A19. Moisture retention- Figure A20. Moisture retention-Nichols Road. subgrade at 3-ft depth. Nichols Road, subgrade at 4-ft depth.
40

W-r -
APPENDIX B: THERMOCOUPLE AND TENSIOMETER DATARECORDED AT CMP, NEWTON FIELD AND NICHOLS ROAD, WINTER 1986--1987.
Table B 1. Air temperatures (°F) CMP, Jackman, Maine.
FR FR
Mat Min A vg Index MLt Min A r IndexDate IF CF F F-day Date F F "F F-day
23 Oct 86 52 35 43.5 -74.50 11 Feb 87 I1 -3 4.0 -1523.0024 Oct 86 57 29 45.0 -63.5 12 Feb 87 10 -12 -1.0 -1556.0025 Oct 86 45 24 34.5 -61,00 13 Feb 87 12 -10 1.0 -1587.0026 Oct 86 48 30 39.0 -54.00 14 Feb 87 -3 -20 -11.5 -1630.5027 Oct 86 53 30 41.5 -14.50 15 Feb 87 -10 -22 -16.0 -1678.5028 Oct 86 45 35 40.0 -36.50 16 Feb 87 0 -20 -10.0 -1720.5029 Oct 86 49 37 43.0 -25.50 17 Feb 87 12 -18 -3.0 -1755.5030 Oct 86 60 37 48.5 -9.00 18 Feb 87 21 -3 9.0 -1778.5031 Oct 86 42 17 29.5 -11.50 19 Feb 87 23 0 11.5 -1799.00
01 Nov 86 38 20 29.0 -14.50 20 Feb 87 20 4 12.0 -1819.0002 Nov 86 53 40 46.5 .00 21 Feb 87 28 6 17.) -1834.0003 Nov 86 38 15 26.5 -5.50 22 Feb 87 26 4 15.0 -1851.0004 Nov 86 42 16 29.0 -8.50 23 Feb 87 31) 0 15.0 -1868.0005 Nov 86 37 I1 24.0 -16.50 24 Feb 87 31 3 17.) -1883.0006 Nov 86 34 10 22.0 -26.50 25 Feb 87 31 9 20.0 -1895.0007 Nov 86 37 21 29.0 -29.50 26 Feb 87 29 9 19.0 -1908o0008 Nov 86 50 40 45.0 -16.50 27 Feb87 30 16 23.0 -1917.0)09 Nov 86 50 4(1 45.0 -;.5) 28 Feb 87 36 10 23.0 -1926.0010 Nov 86 40 22 31.0 -4.50 01 Mat 87 40 7 23.5 -1934.50I1 Nov 86 3(1 22 26.0 -10.50) (12 Mar 87 28 8 18.0 -1948.50(2 Nov 86 35 20 27.5 -15.X 03 Mar 87 26 7 16.5 -1964.0013 Nov 86 39 20 29.5 -17.5(0 (14 Mar 87 40 -25 7.5 -1988.5014 Nov 86 30 3 16.5 -33.00 )5 Mar 87 39 -19 10.) -2010.5015 Nov 86 26 6 16.1 -49.) 06 Mar 87 32 --12 10.0 -2032.51)16 Nov 86 22 12 17.) -64.)0 07 Mar 87 24 4 14.0) -2050.5017 Nov 86 37 24 30.5 -65.5) 08 Mar8 7 38 25 31.5 -2051.0018 Nov 86 40 25 32.5 -65.o (19 Mar 87 46 25 35.5 -2t47.5019 Nov 86 31 10 20.5 -76.50 1 Mar 87 27 -10 8.5 -2071.0020Nov 86 21 2 11.5 -97.(8) II Mar 87 15 - id 2.5 -2 100.50
21 Nov 86 2( 0 10.0 -119.00 12 Mar 87 28 -8 1(1.0) -2122.5022 Nov 86 28 9 18 S -132.5(0 13 Mar.,
7 38 10) 24.0 -2130.50
23 Nov 86 34 19 26.5 -138.00 14 Mar 87 39 8 23.5 -2139.08)24 Nov 86 37 24 3(0.5 -139.50 15 Mar 87 41 -6 17.5 -2153.50)25 Nov 86 44 22 33.01 -138.51 16 Mar 87 37 16 26.5 -2159.()26 Nov 86 32 11 21.5 -149.00 17 Mar 87 32 16 24.0 -2167.D0)27 Nov 86 38 32 35.0 -146.00 18 Mar 87 29 18 23.5 -2175.5128 Nov 86 41 32 36.5 -141.50 19 Mar 87 36 23 29.5 -2178.0029 Nov 86 37 18 27.5 -146.00 21) Mar 87 32 25 28.5 -2181.5030 Nov 86 42 23 32.5 145.5) 21 Mar 87 35 22 28.5 -2185.0)01 Dec 86 41 6 23.0 -154.50 22 Mar 87 38 32 35.0 --2182.(X)(12 Dec 86 35 -7 14.0 -172.50 23 Mar 87 52 25 38.5 -2175,51)03 Dec 86 36 14 25.10 -179,50 24 Mar 87 57 23 40.0 -2167.5004 Dec 86 42 29 35.5 -176.00 25 Mar 87 61 22 41.5 -2158.00(15 Dec 86 38 26 32.0 -176.0) 26 Mar 87 67 27 47.0 -2145.1)06 Dec 86 37 22 29.5 -178.50 27 Mar 87 48 30 39.) -2136.0007 Dec 86 20 10 15.0 -195.50 2.8 Mar 87 40 28 34. -2134.0008 Dec 86 20 -5 7.5 -220.( 29 Mar 87 58 26 42.0 -2124.0009 Dec 86 10 -15 -2.5 -254.50 30 Mar 87 58 24 41.0 -2115.0010 Dec 86 23 -10 6.5 -280.00 31 Mar 87 56 30 43.0 -2104.0011 Dec 86 33 10 21.5 -290.50 01 Apr 87 50 3(0 40.0 -2096.0012 Dec 86 23 -8 7.5 -315.00 02 Apr 87 34 19 26.5 -211.5013 Dec 86 22 - 8,1) -339.00 03 Apr 87 45 21 33.0 -2100.5014 Dec 86 31 4 17.5 -353.50 04 Apr 87 47 27 37.0 -2095.5015 Dec 86 32 -8 12.0 -373.50 05 Apr 87 45 34 39.5 -2088.00
41
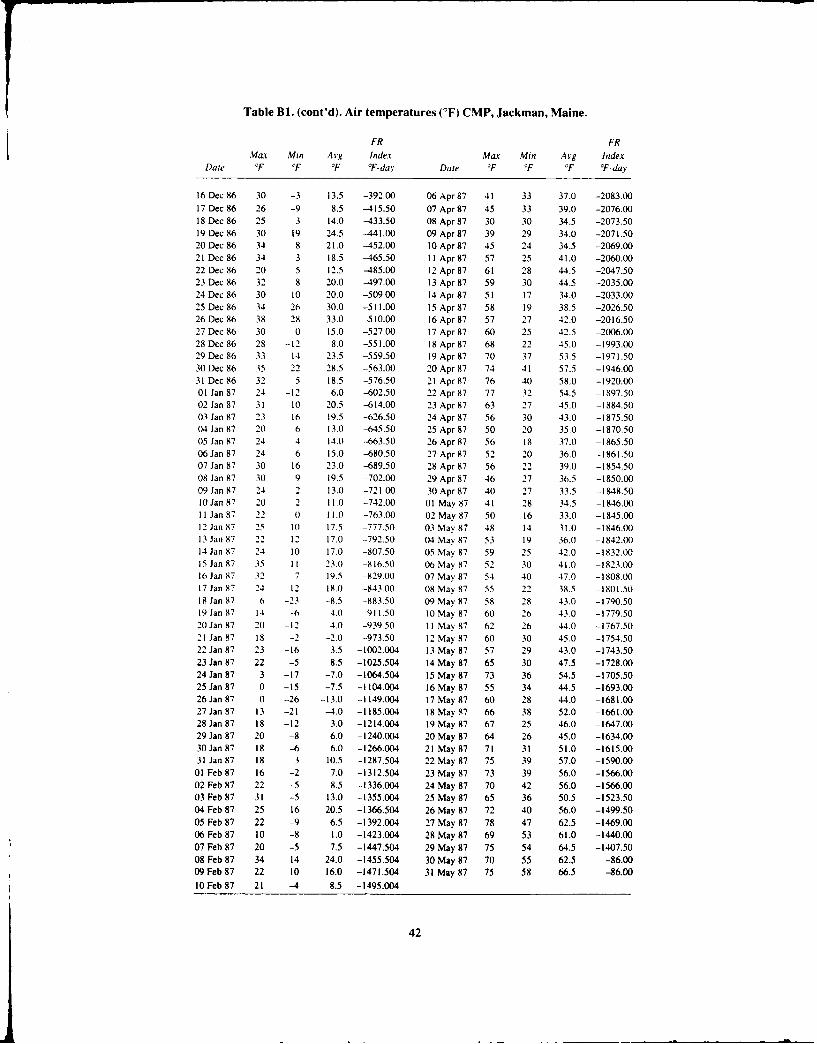
Table BI. (cont'd). Air temperatures (OF) CMP, Jackman, Maine.
FR FRMax Mil Avg Index Max Mil Avg Index
Date oF F F "F-day Date F °F F F-day
16 Dee 86 30 -3 13.5 -392.00 06 Apr 87 41 33 37.0 -2083.0017 Dec 86 26 -9 8.5 -415.50 07 Apr 87 45 33 39.0 -2076.0018 Dec 86 25 3 14.0 -433.50 08 Apr 87 30 30 34.5 -2073.5019 Dec 86 30 19 24.5 -441.00 09 Apr 87 39 29 34.0 -2071.5020 Dec 86 34 8 21.0 -452.00 10 Apr 87 45 24 34.5 -2069.0021 Dec86 34 3 18.5 -465.50 11 Apr87 57 25 41.0 -2060.0022 Dec 86 20 5 12.5 -485.00 12 Apr 87 61 28 44.5 -2047.5023 Dec 86 32 8 20.0 -497.00 13 Apr 87 59 30 44.5 -2035.0024 Dec 86 30 10 20.0 -509.00 14 Apr 87 51 17 34.0 -2033.0025 Dec 86 34 26 30.0 -511.00 15 Apr 87 58 19 38.5 -2026.5026 Dec 86 38 28 33.0 -510.00 16 Apr 87 57 27 42.0 -2016.5027 Dec 86 30 0 15.0 -527.00 17 Apr 87 60 25 42.5 -2006.0028 Dec 86 28 -12 8.0 -551.00 18 Apr 87 68 22 45.0 -1993.0029 Dec 86 33 14 23.5 -559.50 19 Apr 87 70 37 53.5 -1971.5030 Dec 86 35 22 28.5 -563.00 20 Apr 87 74 41 57.5 -1946.0031 Dec 86 32 5 18.5 -576.50 21 Apr 87 76 40 58.0 -1920.0001 Jan 87 24 -12 6.0 -602.50 22 Apr 87 77 32 54.5 -1897.5002 Jan 87 31 10 20.5 -614.00 23 Apr 87 63 27 45.0 -1884.5003 Jan 87 23 16 19.5 -626.50 24 Apr 87 56 30 43.0 -1875.5004 Jan 87 20 6 13.0 -645.50 25 Apr 87 50 20 35.0 -1870.5005 Jan 87 24 4 14.0 -663.50 26 Apr 87 56 18 37.0 -1865.5006 Jan 87 24 6 15.0 -680.50 27 Apr 87 52 20 36.0 -1861.5007 Jan 87 30 16 23.0 -689.50 28 Apr 87 56 22 39.0 -1854.5008 Jan 87 30 9 19.5 -702.00 29 Apr 87 46 27 36.5 -1850.0009 Jan 87 24 2 13.0 -721.00 30 Apr 87 40 27 33.5 -1848.5010 Jan 87 20 2 11.0 -742.00 01 May 87 41 28 34.5 -1846.0011 Jan 87 22 0 11.0 -763.00 02 May 87 50 16 33.0 -1845.0012 Jan 87 25 10 17.5 -777.50 03 May 87 48 14 31.0 -1846.0013 Jan 87 22 12 17.0 -792.50 04 May 87 53 19 36.0 -1842.0014Jan 87 24 10 17.0 -807.50 05 May 87 59 25 42.0 -1832.0015 Jan 87 35 11 23.0 -816.50 06 May 87 52 30 41.0 -1823.0016 Jan 97 32 7 19.5 -829.00 07 May 87 54 40 47.0 -1808.0017 Jan 87 24 12 18.0 -843.00 08 May 87 55 22 38.5 -1801.5018 Jan 87 6 -23 -8.5 -883.50 09 May 87 58 28 43.0 -1790.5019 Jan 87 14 -6 4.0 -911.50 10 May 87 60 26 43.0 -1779.5020 Jan 87 20 -12 4.0 -939.50 11 May 87 62 26 44.0 -1767.5021 Jan 87 18 -2 -2.0 -973.50 12 May 87 60 30 45.0 -1754.5022 Jan 87 23 -16 3.5 -1002.004 13 May 87 57 29 43.0 -1743.5023 Jan 87 22 -5 8.5 -1025.504 14 May 87 65 30 47.5 -1728.0024 Jan 87 3 -17 -7.0 -1064.504 15 May 87 73 36 54.5 -1705.5025 Jan 87 0 -15 -7.5 -I 104.004 16 May 87 55 34 44.5 -1693.0026 Jan 87 0 -26 -13.0 -1149.004 17 May 87 60 28 44.0 -1681.0027 Jan 87 13 -21 -4.0 -1185.004 18 May 97 66 38 52.0 -1661.0028 Jan 87 18 -12 3.0 -1214.004 19 May 87 67 25 46.0 -1647.0029 Jan 87 20 -8 6.0 -1240.004 20 May 87 64 26 45.0 -1634.0030 Jan 87 18 -.6 6.0 -1266,004 21 May 87 71 31 51.0 -1615.0031 Jan 87 18 3 10.5 -1287,504 22 May 87 75 39 57.0 -1590.0001 Feb 87 16 -2 7.0 -1312.504 23 May 87 73 39 56.0 -1566.0002 Feb 87 22 -5 8.5 -1336.004 24 May 87 70 42 56.0 -1566.0003 Feb 87 31 -5 13.0 -1355.004 25 May 87 65 36 50.5 -1523.5004 Feb 87 25 16 20.5 -1366.504 26 May 87 72 40 56.0 -1499.5005 Feb 87 22 -9 6.5 -1392.004 27 May 87 78 47 62.5 -1469.0006 Feb 87 10 -8 1.0 -1423.004 28 May 87 69 53 61.0 -1440.0007 Feb 87 20 -5 7.5 -1447.504 29 May 87 75 54 64.5 -1407.5008 Feb 87 34 14 24.0 -1455.504 30 May 87 70 55 62.5 -86.0009 Feb 87 22 10 16.0 -1471.504 31 May 87 75 58 66.5 -86.0010 Feb 87 21 -4 8.5 -1495.004
42
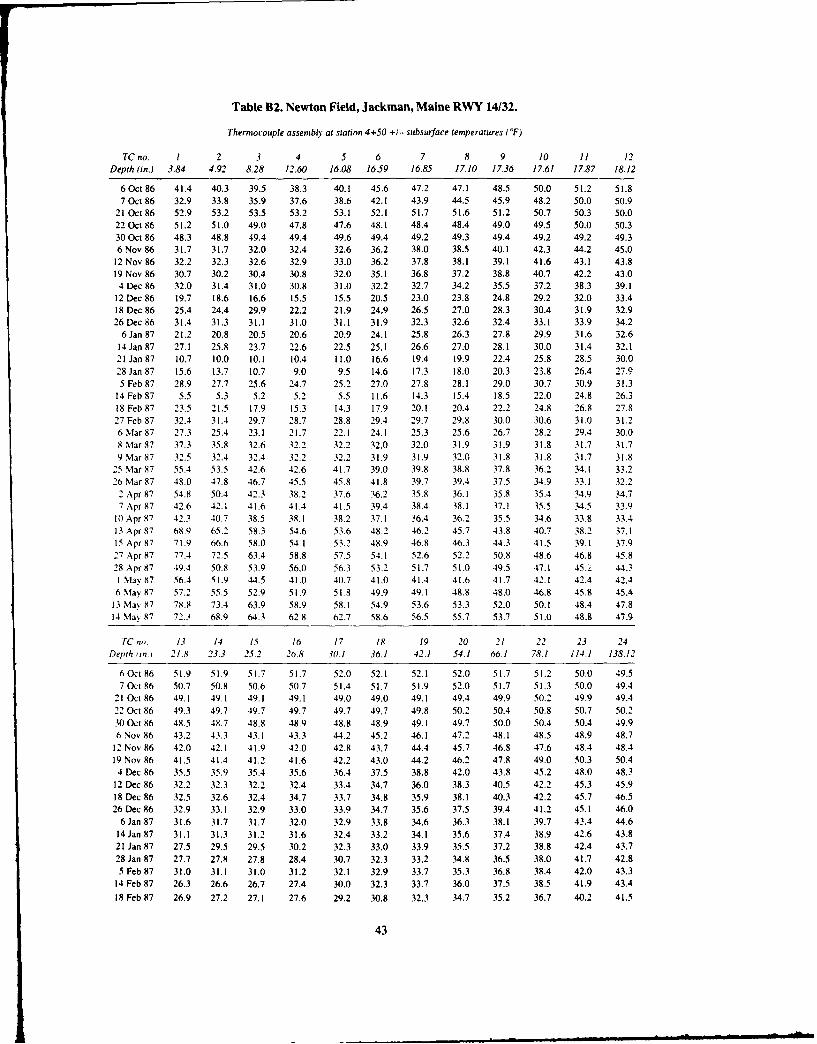
Table B2. Newton Field, Jackman, Maine RWY 14/32.
Thermocouple assembly at station 4+50 +1- subsurface temperatures (F)
TC no, 1 2 3 4 5 6 7 8 9 10 11 12Depth (in.) 3.84 4.92 8.28 12.60 16.08 16.59 16.85 17.10 17.36 17.61 17.87 18.12
6 Oct 86 41.4 40.3 39.5 38.3 40.1 45.6 47.2 47.1 48.5 50.0 51.2 51.87 Oct 86 32.9 33.8 35.9 37.6 38.6 42.1 43.9 44.5 45.9 48.2 50.0 50,9
21 Oct 86 52.9 53.2 53.5 53.2 53.1 52.1 51.7 51.6 51.2 50.7 50.3 50.022 Oct 86 51.2 51.0 49.0 47.8 47.6 48.1 48.4 48.4 49.0 49.5 50.0 50.330 Oct 86 48.3 48.8 49.4 49.4 49.6 49.4 49.2 49.3 49.4 49.2 49.2 49.36 Nov 86 31.7 31.7 32,0 32.4 32.6 36.2 38.0 38.5 40.1 42.3 44.2 45.0
12 Nov 86 32.2 32.3 32.6 32.9 33.0 36.2 37.8 38.1 39.1 41.6 43.1 43.819 Nov 86 30.7 30.2 30.4 30.8 32.0 35.1 36.8 37.2 38.8 40.7 42.2 43.0
4 Dec 86 32.0 31.4 31.0 30.8 31.0 32.2 32.7 34.2 35.5 37.2 38.3 39.112 Dec 86 19.7 18.6 16.6 15.5 15.5 20.5 23.0 23.8 24.8 29.2 32.0 33.418 Dec 86 25.4 24.4 29.9 22.2 21.9 24.9 26.5 27.0 28.3 30.4 31.9 32.926 Dec 86 31.4 31.3 31.1 31.0 31.1 31.9 32.3 32.6 32.4 33.1 33.9 34.2
6 Jan 87 21.2 20.8 20.5 20.6 20.9 24.1 25.8 26.3 27.8 29.9 31.6 32.614 Jan 87 27.1 25.8 23.7 22.6 22.5 25.1 26.6 27.0 28.1 30.0 31.4 32.121 Jan 87 10.7 10.0 10.1 10.4 11.0 16.6 19.4 19.9 22.4 25.8 28.5 30.028 Jan 87 15.6 13.7 10.7 9.0 9.5 14.6 17.3 18.0 20.3 23.8 26.4 27.95 Feb 87 28.9 27.7 25.6 24.7 25.2 27.0 27.8 28.1 29.0 30.7 30.9 31.3
14 Feb 87 5.5 5.3 5.2 5.2 5.5 11.6 14.3 15.4 18.5 22.0 24.8 26.318 Feb 87 23.5 21.5 17.9 15.3 14.3 17.9 20.1 20.4 22.2 24.8 26.8 27.827 Feb 87 32.4 31.4 29.7 28.7 28.8 29.4 29.7 29.8 30.0 30.6 31.0 31.26 Mar 87 27.3 25.4 23.1 21.7 22.1 24.1 25.3 25.6 26.7 28.2 29.4 30.08 Mar 87 37.3 35.8 32.6 32.2 32.2 32.0 32.0 31.9 31.9 31.8 31.7 31.79 Mar 87 32.5 32.4 32.4 32.2 32.2 31.9 31.9 32.0 31.8 31.8 31.7 31.8
25 Mar 87 55.4 53.5 42.6 42.6 41.7 39.0 39.8 38.8 37.8 36.2 34.1 33.226 Mar 87 48.0 47.8 46.7 45.5 45.8 41.8 39.7 39.4 37.5 34.9 33.1 32.2
2 Apr 87 54.8 50.4 42.3 38.2 37.6 36.2 35.8 36.1 35.8 35.4 34.9 34.77 Apr 87 42.6 42.1 41.6 41.4 41.5 39.4 38.4 38.1 37.1 35.5 34.5 33,9
10 Apr 87 42.3 40.7 38.5 38.1 38.2 37.1 36.4 36.2 35.5 34.6 33.8 33.413 Apr 87 68.9 65.2 58.3 54.6 53.6 48.2 46.2 45.7 43.8 40.7 38.2 37.115 Apr 87 71.9 66.6 58.0 54.1 53.2 48.9 46.8 46.3 44.3 41.5 39.1 37.927 Apr 87 77.4 72.5 63.4 58.8 57.5 54.1 52.6 52.2 50.8 48.6 46.8 45.828 Apr 87 49.4 50.8 53.9 56,0 56.3 53.2 51.7 51.0 49.5 47.1 45.2 44.3I May 87 56.4 51.9 44.5 41.0 40.7 41.0 41.4 41.6 41.7 42.1 42.4 42.4
6 May 87 57.2 55.5 52.9 51.9 51.8 49.9 49.1 48.8 48.0 46.8 45.8 45.413 May 87 78.8 73.4 63.9 58.9 58.1 54.9 53.6 53.3 52.0 50.1 48.4 47.814 May 87 72.3 68.9 64.3 62.8 62.7 58.6 56.5 55.7 53.7 51.0 48.8 47.9
TC no, 13 14 15 16 17 /8 19 20 21 22 23 24Depth tn. 1 21.8 23.3 25,2 26.8 30.1 36.1 42.1 54.1 66.1 78.1 114.1 138.12
6 Oct 86 51.9 51.9 51.7 51.7 52.0 52.1 52.1 52.0 51.7 51.2 50.0 49.57 Oct 86 50.7 50.8 50.6 50.7 51.4 51.7 51.9 52.0 51.7 51.3 50.0 49.4
21 Oct 86 49.1 49.1 49.1 49.1 49.0 49.0 49.1 49.4 49.9 50.2 49.9 49.422 Oct 86 49.3 49.7 49.7 49.7 49.7 49.7 49.8 50.2 50.4 50.8 50.7 50.230 Oct 86 48.5 48.7 48.8 48.9 48.8 48.9 49.1 49.7 50.0 50.4 50.4 49.96 Nov 86 43.2 43.3 43.1 43.3 44.2 45.2 46.1 47.2 48.1 48.5 48.9 48.7
12 Nov 86 42.0 42.1 41.9 42.0 42.8 43.7 44.4 45.7 46.8 47.6 48.4 48.419 Nov 86 41.5 41.4 41.2 41.6 42.2 43.0 44.2 46.2 47.8 49.0 50.3 50.4
4 Dec 86 35.5 35.9 35.4 35.6 36.4 37.5 38.8 42.0 43.8 45.2 48.0 48.312 Dec 86 32.2 32.3 32.2 32.4 33.4 34.7 36.0 38.3 40.5 42.2 45.3 45,918 Dec 86 32.5 32.6 32.4 34.7 33.7 34.8 35.9 38.1 40.3 42.2 45.7 46.526 Dec 86 32.9 33.1 32.9 33.0 33.9 34.7 35.6 37.5 39.4 41,2 45.1 46.0
6 Jan 87 31.6 31.7 31.7 32.0 32.9 33.8 34,6 36.3 38.1 39.7 43.4 44.614 Jan 87 31.1 31.3 31.2 31.6 32.4 33.2 34.1 35.6 37.4 38.9 42.6 43.821 Jan 87 27.5 29.5 29.5 30.2 32.3 33.0 33.9 35.5 37.2 38.8 42.4 43.728 Jan 87 27.7 27.8 27.8 28.4 30.7 32.3 33.2 34.8 36.5 38.0 41.7 42.8
5 Feb 87 31.0 31.1 31.0 31.2 32.1 32.9 33.7 35.3 36.8 38.4 42.0 43.314 Feb 87 26.3 26.6 26.7 27.4 30.0 32.3 33.7 36.0 37.5 38.5 41.9 43.4
18 Feb 87 26.9 27.2 27.1 27.6 29.2 30.8 32.3 34.7 35.2 36.7 40.2 41.5
43
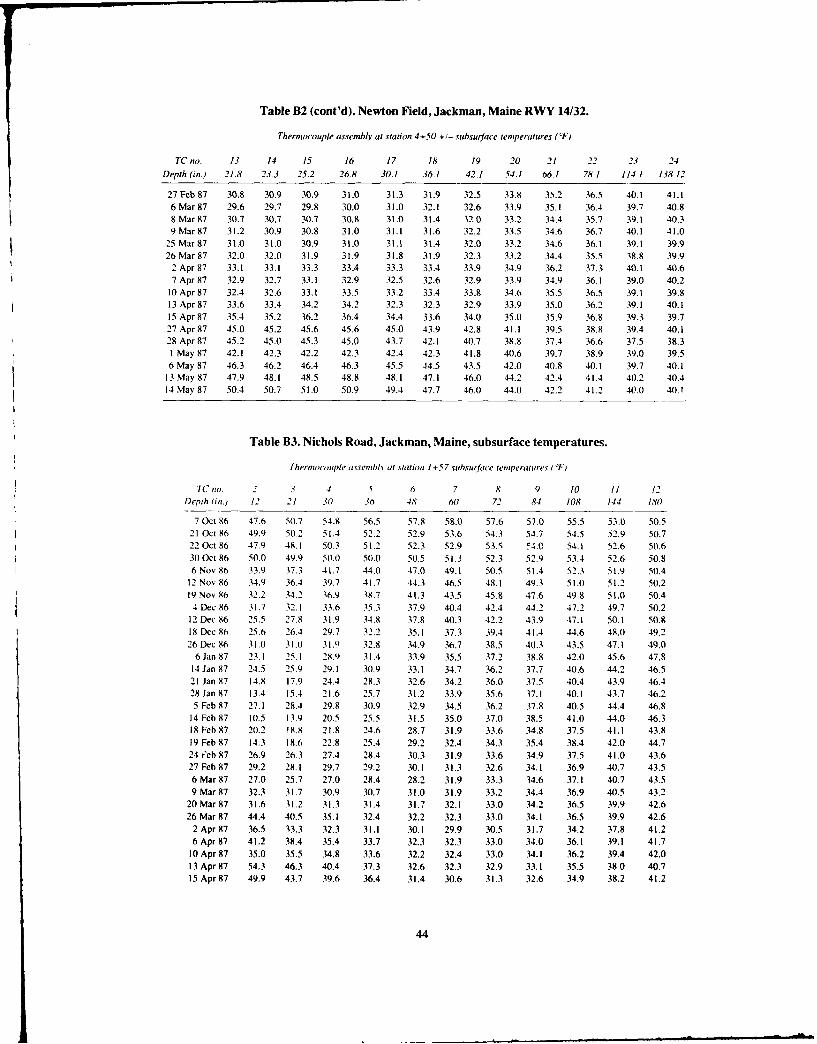
Table B2 (cont'd). Newton Field, Jackman, Maine RWY 14/32.
Thermocouple assembly at station 4+50 +/- subsurface temperatures (IF)
TC no. 13 14 15 16 17 18 19 20 21 22 23 24Depth (in.) 21.8 23.3 25.2 26.8 30.1 36.1 42.1 54.1 66.1 78.1 114.1 138.12
27 Feb 87 30.8 30.9 30.9 31.0 31.3 31.9 32.5 33.8 35.2 36.5 40.1 41.16 Mar 87 29.6 29.7 29.8 30.0 31.0 32.1 32.6 33.9 35.1 36.4 39.7 40.88 Mar 87 30.7 30.7 30.7 30.8 31.0 31.4 32.0 33.2 34.4 35.7 39.1 40.39 Mar87 31.2 30.9 30.8 31.0 31.1 31.6 32.2 33.5 34.6 36.7 40.! 41.0
25 Mar 87 31.0 31.0 30.9 31.0 31.1 31.4 32.0 33.2 34.6 36.1 39.1 39.926 Mar 87 32.0 32.0 31.9 31.9 31.8 31.9 32.3 33.2 34.4 35.5 38.8 39.92 Apr 87 33.1 33.1 33.3 33.4 33.3 33.4 33.9 34.9 36.2 37.3 40.1 40.67 Apr 87 32.9 32.7 33.1 32.9 32.5 32.6 32.9 33,9 34.9 36.1 39.0 40.2
10 Apr 87 32.4 32.6 33.1 33.5 33.2 33.4 33.8 34.6 35.5 36.5 39.1 39.813 Apr 87 33.6 33.4 34.2 34.2 32.3 32.3 32.9 33.9 35.0 36.2 39.1 40.115 Apr 87 35.4 35.2 36.2 36.4 34.4 33.6 34.0 35.0 35.9 36.8 39.3 39.727 Apr 87 45.0 45.2 45.6 45.6 45.0 43.9 42.8 41.1 39.5 38.8 39.4 40. 128 Apr 87 45.2 45.0 45.3 45.0 43.7 42.1 40.7 38.8 37.4 36.6 37.5 38.3I May 87 42.1 42.3 42.2 42.3 42.4 42.3 41.8 40.6 39.7 38.9 39.0 39.56 May 87 46.3 46.2 46.4 46.3 45.5 .14.5 43.5 42.0 40.8 40.1 39.7 40.1
13 May 87 47.9 48.1 48.5 48.8 48.1 47.1 46.0 44.2 42.4 41.4 40.2 40.414 May 87 50.4 50.7 51.0 50.9 49.4 47.7 46.0 44.0 42.2 41.2 40.0 40.1
Table B3. Nichols Road, Jackman, Maine, subsurface temperatures.
Thermocouple assembly at station 1+5 7 subsurfiwe temperatures (FJ
TC no. 2 3 4 5 6 7 8 9 /0 II 12Depth tin.) 12 21 30 36 48 (50 72 84 108 144 180
7 Oct 86 47.6 50.7 54.8 56.5 57.8 58.0 57.6 57.0 55.5 53.0 50.521 Oct 86 49.9 50.2 51.4 52.2 52.9 53.6 54.3 54.7 54.5 52.9 50.722 Oct 86 47.9 48.1 50.3 51.2 52.3 52.9 53.5 54.0 54.1 52.6 50.630 Oct 86 50.0 49.9 50.0 50.0 50.5 51.3 52.3 52.9 53.4 52.6 50.86 Nov 86 33.9 37.3 41.7 44.0 47.0 49.1 50.5 51.4 52.3 51.9 50.4
12 Nov 86 34.9 36.4 39.7 41.7 44.3 46.5 48.1 49.3 51.0 51.2 50.219 Nov 86 32.2 34.2 36,9 18.7 41.3 43.5 45.8 47.6 49.8 51.0 50.44 Dec 86 31.7 32.1 33.6 35.3 37.9 40.4 42.4 44.2 47.2 49.7 50.2
12 Dec 86 25.5 27.8 31.9 34,8 37.8 40.3 42.2 43.9 47.1 50.1 50.8
18 Dec 86 25.6 26.4 29.7 32.2 35.1 37.3 39.4 41.4 44.6 48.0 49.226 Dec 86 31.0 31.0 31.9 32.8 34.9 36.7 38.5 40.3 43.5 47.1 49.06 Jan 87 23.1 25.1 28.9 31.4 33.9 35.5 37.2 38.8 42.0 45.6 47.8
14 Jan 87 24.5 25.9 29.! 30.9 33.1 34.7 36.2 37.7 40.6 44.2 46.521 Jan 87 14.8 17.9 24.4 28.3 32.6 34.2 36.0 37.5 40.4 43.9 46.428 Jan 87 13.4 15.4 21.6 25.7 31.2 33.9 35.6 37.1 40.1 43.7 46.25 Feb 87 27.1 28.4 29,8 30.9 32.9 34.5 36.2 37.8 40.5 44.4 46.8
14 Feb 87 10.5 13.9 20.5 25.5 31.5 35.0 37.0 38.5 41.0 44.0 46.318 Feb 87 20.2 18.8 21.8 24.6 28.7 31.9 33.6 34.8 37.5 41.1 43.819 Feb 87 14.3 18.6 22,8 25.4 29.2 32.4 34.3 35.4 38.4 42.0 44.724 feb 87 26.9 26.3 27.4 28.4 30.3 31.9 33.6 34.9 37.5 41.0 43.627 Feb 87 29.2 28.1 29.7 29.2 30.1 31.3 32.6 34.1 36.9 40.7 43.56 Mar 87 27.0 25.7 27.0 28.4 28.2 31.9 33.3 34.6 37.! 40.7 43.59 Mar 87 32.3 31.7 30.9 30.7 31.0 31.9 33.2 34.4 36.9 40.5 43.2
20 Mar 87 31.6 31.2 31.3 31.4 31.7 32.1 33.0 34.2 36.5 39.9 42.626 Mar 87 44.4 4(.5 35.1 32.4 32.2 32.3 33.0 .34.1 36.5 39.9 42.62 Apr 87 36.5 33.3 32.3 31.1 30.1 29.9 30.5 31.7 34.2 37.8 41.26 Apr 87 41.2 38.4 35.4 33.7 32.3 32.3 33.0 34.0 36.1 39.1 41.710 Apr 87 35.0 35.5 34.8 33.6 32.2 32.4 33.0 34.! 36.2 39.4 42.013 Apr 87 54.3 46.3 40.4 37.3 32.6 32.3 32.9 33.1 35.5 380 40.715 Apr 87 49.9 43.7 39.6 36.4 31.4 30.6 31.3 32.6 34.9 38.2 41.2
44

Table B3 (cont'd).
Thermocouple assembly at station 1 +57 subsurface temperatures (F)
TC no. 2 3 4 5 6 7 8 9 10 11 12Depth (in.) 12 21 30 3o 48 60 72 84 108 144 180
27 Apr 87 55.1 48.5 44.9 42.4 38.1 35.0 33.4 33.5 35.1 38.2 41.228 Apr 87 49.2 50.4 47.8 44.8 40.5 37.5 35.5 35.0 35.8 38.6 41.028 Apr 87 48.9 50.1 47.5 44.5 40.2 37.1 35.2 34.6 35.4 38.1 40.728 Apr 87 48.9 50.1 47.5 44.5 40.3 37.2 35.3 34.7 35.5 38.1 40.7I May 87 44.4 41.0 40.7 40.4 39.2 37.6 36.2 35.5 35.5 38.1 40.86 May 87 50.0 48.5 47.2 45.9 43.3 41.0 39.3 38.1 37.5 38.8 41.0
13 May 87 59.3 52.6 49.9 48.2 45.1 42.2 40.0 38.8 37.5 38.2 40.4
Table B4. Tensiometer data, Newton Field, Table B5. Tensiometer data, NicholsJackman, Maine. Road, Jackman, Maine.
Teniorneter depth (fti Tensitometer depths Ift)Watervell - Waterwell
1 1.5 2 3 depth 2 3 4 depthDate p o psi psi psi .,in Dat psi psi psi (in.)
7 Oct 86 0.0 0.0 0.0 0.0 7 Oct 86 0.00 -0.29 -4).2921 Oct 86 0.0 0.0 0.1 (0.3 21 Oct 86 0.1(5 0.07 0.00 6322 Oct 86 0.3 10.4 0.6 0.7 100.0 22 Oct 86 0,29 03.01) 0.00 65
30 Oct 86 0.0 0.0 (0.0 0.3 101.0 30 Oct 86 0.15 0.00 0.00 60
6 Nov 86 1.0 0.0 0.0 0.4 101.0 6 Nov 86 0.00 0.00 0.00 66
12 Nov 86 0.0 0.0 ).1 0.4 99.1 12 Nov 86 0.00 0.00 0.00 59
19 Nov6 0.0 0.0 0.1 0.6 (((6.0 19 Nov 86 0.15 0.00 0.00 67
4 Dec 86 0.0 0.0 0.4 1.0 104.5 4Dec86 1.32 58
(' Dec8S6 0.0 0.0 0.3 (.0 (8.0 12 Dec 86 7.06 0.8) 1.18 6918 Dec 86 9.26 2.35 2.50 79
26 Dec 86 0.0 0.0 0.6 1.5 148.0 26Dec86 3.23 0.00 2.06 8426 Dc 86 0.0 0.1) 0.6 .8 (48.0 6 Jan 87 5.53 0.00 2.94 89
14 Jan 86 6.17 0.00 3.35 9614 Jan 87 (.9 1.0 1.3 2.4 14N 0 21 Jan 87 10321 Jan 87 1.2 1.3 1.8 2.6 147.0 28 Jan 87 9728 Jan 87 7.4 6.8 5.0 4.6 148.0 5 Feb 87 965 Feb 87 6.5 6.2 5.1 5.0 146.0 14 Feb 87 96
14 Feb 87 9.7 8.7 5.6 5.4 148.0 18 Feb 87 7.35 o.1) 5.59 9718 Feb 87 10.1 9.1 6.( 5.7 147.5 24 Feb 87 6.76 0.00 8.67 -27 Feb 87 9.4 8.8 6.8 6.3 147.0 27 Feb 87 6.17 0.00 8.67 986 Mar 87 7.6 7,4 6.0 5.9 149.0 6 Mar 87 0.74 7.64 978 Mar 87 - 9 Mar 87 0.29 0.00 8.82 -9 Mar 87 6.9 6.8 5.9 5.7 - 20 Mar 87 0.00 0,0(0 6.91 -
25 Mar 87 0.0 0.0 (0.6 1.8 41.5 26 Mar 87 0.0( 0.00 0.88 6526 Mar 87 42.) 2 Apr 87 0.00 0.00 1.32 49
2 Apr 87 Housing box flooded 147.0 6 Apr 87 41
7 Apr 87 131.0 10 Apr 87 0.00 0.00 0.00 37
10 Apr 87 127.0 13 Apr 87 0.00 0.00 -
13Apr87 154 0.0 0.3 L.2 - 15 Apr 87 0.00 0.00 0.00 38
15 Apr 87 0.0 0.0 0.3 ((.9 125.0 27 Apr87 48I May 87 4227 Apr 87 12.0 6 May 87 43
28 Apr 87 1 a 74
I May 87 Housing box flooded (08.0 (3 May 87 46
6 May 87 98.01.s May 87 (05.014 May 87
45

Form ApprovedREPORT DOCUMENTATION PAGE OMB No. 0704-0188Public reporting burden for this collection of information is estimated to average 1 hour per response, including the time for reviewing instructions, searching existing data sources, gathering andmaintaining the data needed, and completing and reviewing the collection of information. Send comments regarding this burden estimate or any other aspect of this collection of information.including suggestion for reducing this burden, to Washington Headquarters Services. Directorate for Information Operations and Reports. 1215 Jefferson Davis Highway. Suite 1204. ArTingtonVA 22202-4302, and to the Office of Management and Budget, Paper ork Reduction Project (0704-0188), Washington. DC 20503
1. AGENCY USE ONLY (Leave blank) 2. REPORT DATE 3. REPORT TYPE AND DATES COVERED
I January 19914. TITLE AND SUBTITLE 5. FUNDING NUMBERS
Interagency AgreementUse of Insulation for Frost Prevention: Jackman Airport, Maine, 1986-1987 Winter DTFA 01-84-2-02038
6. AUTHORS PE: 6.27.84A
Maureen A. Kestler and Richard L. Berg PR: 4A762784AT42TA: BS
_7 Pi- 17WU: 036P1 -. RrMING ORGANIZATION NAME(S) ,'ND ADDRESS(ES) 8. PERFORMING ORGANIZATION
REPORT NUMBER
U.S. Army Cold Regions Research and Engineering Laboratory72 Lyme Road CRREL Report 91-1Hanover. New Hampshire 03755-1290
9. SPONSORING MONITORING AGENCY NAME(S) AND ADDRESS(ES) 10. SPONSORING/MONITORING
AGENCY REPORT NUMBER
U.S. Army U.S. Department of TransportationOffice of the Chief of Engineers Federal Aviation Administration DOT/FAA/RD-91/4Washington, D.C. 20314-1000 Research and Development Service
Washington. D.C. 20591
11 SUPPLEMENTARY NOTES
12a DISTRIBUTION,,AVAILABIL(TY STATEMENT 12b DISTRIBUTION CODE
Approved for public release: distribution is unlimited.
Available from NTIS, Springfield, Virginia 22161
13 ABSTRACT (Maximum 200 words)
In 1986, Newton Field, a small runway in Jackman, Maine, was reconstructed using a 2-in.-thick layer of extruded polystyreneinsulation. At the same time, Nichols Road, a nearby town road, was reconstructed to a conventional, uninsulated crosssection. Both Newton Field and Nichols Road were similarly monitored: thermocouples, tensiometers, and groundwater wellswere installed during construction, and, following construction, a pavement surface elevation grid was established at eachof the test sites for monitoring frost heave. This report discusses the performance of the insulated and uninsulated pavementsduring the first of four winters of observation.
14. SUBJECT TERMS 15. NUMBERF PAGES
Frost heave Pavements 16. PRICE CODEInsulated pavements Runways
17. SECURITY CLASSIFICATION 18. SECURITY CLASSIFICATION 19. SECURITY CLASSIFICATION 20. LIMITATION OF ABSTRACT
OF REPORT OF THIS PAGE OF ABSTRACT
UNCLASSIFIED UNCLASSIFIED UNCLASSIFIED UL
NSN 7540-01-280-5500 Standard Form 298 (Rev. 2-89)Prescribed by ANSI Std Z39-18
,E ,, .r' ,' r., , In. i, ii ',C" r,3 22068 298-102