use of inpatient imaging services by persons without health insurance
TRANSCRIPT

pdiump
Use of Inpatient Imaging Services byPersons Without Health Insurance
James W. Moser, PhDa, Kimberly E. Applegate, MD, MSb
Background: Americans without health insurance generally receive fewer health care services than those withinsurance. Less studied are the specific types of services for which the uninsured face access and utilizationdifferences. This article fills in some of the knowledge gaps by presenting comparisons between uninsured andinsured individuals in the use of imaging services in the hospital inpatient setting.
Methods: The primary data source for this study was the 2003 National Hospital Discharge Survey. Theprincipal source of payment was used to define insurance status. Global relative value units were assigned byimaging procedure. To ensure sufficient numbers of observations, individual imaging procedures were aggre-gated into 6 modalities. Multivariate regression was used to estimate the utilization and value of imagingservices as a function of insurance status and other control variables.
Results: Just over 9% of inpatients were uninsured (range, 15.7% aged 18-24 years to 5.8% aged 55-64years). After controlling for measurable factors, uninsured hospital inpatients who underwent imaging receivedthe same mean number of imaging services (1.51) of the same mean value (11 relative value units) as those forcomparable insured persons. The uninsured received fewer interventional and image-guided procedures butmore CT studies than insured patients (P � .05).
Conclusions: Because insurance status does not seem to significantly influence the quantity or value ofimaging services received by hospital inpatients who receive imaging, efforts to assist uninsured patients withimaging needs would be better directed elsewhere than the hospital inpatient setting.
Key Words: Uninsured, hospital inpatients, imaging services
J Am Coll Radiol 2012;9:42-49. Copyright © 2012 American College of Radiology
psnhwpffsfnsc
swthitheh
INTRODUCTIONApproximately 51 million Americans, or 16.7% of thepopulation, were without health insurance for some or allof 2009 [1]. Lack of insurance is associated with less
reventive care, delays in diagnosis, and unnecessaryeaths. Further exacerbating the plight of the uninsured
s that they face higher fees than the insured because theninsured do not benefit from reduced fees negotiated byanaged care organizations or public payers on behalf of
ersons with insurance.Uninsured Americans are a heterogeneous group [2-
4]. The uninsured differ in their ability to pay for healthcare. Some are able to pay something, while others are“medically indigent” (ie, financially unable to pay formedical care).
Although being without coverage does not prevent a
aEconometrica, Bethesda, Maryland.bDepartment of Radiology and Pediatrics, Emory University School of Med-icine, Atlanta, Georgia.
Corresponding author and reprints: Kimberly E. Applegate, MD, MS,Emory University School of Medicine, Department of Radiology and Pediat-rics, 1364 Clifton Road, NE, Suite D112, Atlanta, GA 30322; e-mail:
42
erson from receiving emergent health care, the unin-ured are less likely than the insured to seek perceivedeeded care. When they do, they usually receive fewerealth care services of possibly lower quality than personsith coverage [5,6]. The uninsured must pay out ofocket or receive uncompensated care; either way, theyace access and financial barriers to needed services. Evenor patients who secure a visit to a primary care doctor, aubstantial proportion are unable to follow up on adviceor prescription medications, laboratory tests, or diag-ostic procedures because of cost [7]. Other research hashown that a lack of insurance significantly reduces thehances of patients undergoing screening tests [8-10].
A finding of no significant difference between unin-ured and insured patients who are otherwise similarould suggest that the health care safety net is working in
he hospital setting among those who are admitted to theospital. Emergency departments in many American cit-
es are overwhelmed, forcing ambulances to divert pa-ients to other settings and delay care [11]. On the otherand, identifying areas in which the uninsured experi-nce deficits would point the way to desirable changes inospital practices, statutes, and other public policies, es-
ecially if it were found that delaying or denying needed© 2012 American College of Radiology0091-2182/12/$36.00 ● DOI 10.1016/j.jacr.2011.08.001

ecusptBStSoamcrpdC(
io
rc
wsoaSad
dUiii
cwmccpsrmus
caM5ys1
cCvpb
ogrft
wfvupe
Moser, Applegate/Use of Inpatient Imaging Services 43
care results in worse long-term health outcomes andhigher health care spending. The United States spendsnearly $100 billion per year to provide uninsured personswith health services, often for preventable diseases ordiseases that physicians could treat more efficiently withearlier diagnosis [12]. Such a situation has been shown inappendicitis care in at least 3 studies in which insurancestatus was linked to different outcomes [13].
These studies notwithstanding, there is a lack ofresearch on the specific types of imaging services forwhich the uninsured face access and utilization defi-cits. This article fills in some of the knowledge gaps bypresenting comparisons between uninsured and in-sured persons in the use of imaging services in thehospital inpatient setting.
METHODSThe primary hypothesis was that patients in the inpatientsetting receive the same type and amount of imagingservices regardless of health insurance status. Testing thathypothesis was the principal focus of the study.
The primary data source for this study is the 2003National Hospital Discharge Survey (NHDS), which an-nually collects medical, demographic, and payment in-formation from a sample of discharge records selectedfrom a national sample of nonfederal, short-stay hospitals[14]. The NHDS collected data from a sample of approx-imately 270,000 inpatient records acquired from a na-tional sample of about 500 hospitals. Only hospitals withaverage lengths of stay of �30 days for all patients, gen-ral hospitals, and children’s general hospitals are in-luded in the survey. Two data collection procedures aresed in the survey. One is a manual system in whichample selection and medical transcription from the hos-ital records to abstract forms is performed by the hospi-al’s staff members or by staff members of the US Censusureau on behalf of the National Center for Healthtatistics. The other data collection procedure is an au-omated system in which the National Center for Healthtatistics purchases electronic data files from commercialrganizations, state data systems, hospitals, or hospitalssociations. The medical abstract form and the auto-ated data tapes contain items that relate to the personal
haracteristics of patients. These items include age, sex,ace, ethnicity, marital status, and expected sources ofayment. Medical information about patients includesiagnoses and procedures coded to the Internationallassification of Diseases, ninth rev, Clinical Modification
ICD-9-CM).Procedure descriptions were obtained from the Amer-
can Medical Association’s Current Procedural Terminol-gy® (CPT®) [15]. An index to procedures was used for
the ICD-9-CM codes [16]. The Web sites of CMS andthe Federal Register were sources for data and informationon relative values of procedures, diagnosis-related group
(DRG) relative weights, major diagnostic categories, and celative values assigned to ambulatory payment classifi-ations from HOPPS [17-20].
The “principal source of payment” field in the NHDSas used to define who was insured and who was unin-
ured. Approximately 91% of discharges had some formf private or public third-party payment; the inpatientsssociated with these records were defined as “insured.”even and one-half percent were categorized as “self-pay”nd 0.6% as “no charge.” These latter two were togetherefined as “uninsured.”Procedures in NHDS records use ICD-9-CM proce-
ure codes. The NHDS contains 4 procedure code fields.sing code descriptions, 151 imaging services codes were
dentified. All records associated with diagnostic imag-ng, interventional radiology, or nuclear medicine werenitially selected for analysis.
The analyses in this study pertain to inpatients who areonsidered imaging patients. An imaging patient is oneho had 1 or more imaging services comprising 1 orore modalities among the 4 (and only 4) procedure
ode fields in the NHDS; this is the definition used foralculating total imaging services received during a hos-italization. For comparisons across modalities, we as-igned to a particular modality only those patients whoeceived at least 1 service of that modality and no otherodality. This approach allowed us to assign unambig-
ously to a modality a patient record with �2 imagingervices.
Persons aged �65 years, virtually all of whom areovered by Medicare insurance, were excluded from thisnalysis because there is no “uninsurance effect” in the
edicare beneficiary population. The 2003 NHDS has,593 imaging-related records for persons aged �65ears, encompassing 103 imaging procedure codes (ie, noervices were recorded in the 2003 NHDS for 48 of the51 total imaging service codes).The top 10 imaging service codes by frequency ac-
ounted for �70% of all imaging services in the NHDS.learly, the relative frequency for many individual ser-
ice codes is small, if not zero. The problem is com-ounded by the fact that the number of services receivedy the uninsured is a small fraction of all services.To facilitate analysis by ensuring sufficient numbers of
bservations, individual imaging services were aggre-ated into 6 modalities: ultrasound, CT, interventionaladiology, MRI, nuclear medicine, and x-rays other thanor mammography that are typically done in the outpa-ient setting.
To compare services and modalities across patients, itas useful to place a value on a given procedure. Values
or ICD-9-CM procedure codes do not exist. However,alues for CPT codes do exist in the form of relative valuenits (RVUs) that have been developed and used forhysician payment purposes by Medicare and other pay-rs [21]. A code crosswalk from ICD-9-CM to CPT was
reated, comparing detailed descriptions of imaging ser-
44 Journal of the American College of Radiology/Vol. 9 No. 1 January 2012
vices for the two systems. The conversion of ICD-9-CMprocedures to CPT procedures resulted in 325 CPT im-aging codes being associated with 151 ICD-9-CM imag-ing codes. In terms of 2003 services provided, a crosswalkwas obtained for 98 imaging ICD-9-CM codes. Thecrosswalk enabled global (ie, comprising both profes-sional and technical components) RVUs for imaging ser-vices to be brought into the analysis.
In cases for which several CPT codes were associatedwith a given ICD-9-CM code, frequency counts by CPTcode were used to calculate weighted average RVUs for agiven ICD-9-CM code. Ultimately, RVUs were ob-tained to go with each of the 98 ICD-9-CM imagingservices codes that were actually performed as indicatedin the 2003 NHDS.
The NHDS includes DRG codes. From a CMS Website, a file was obtained that contains DRG codes, DRGtitles, DRG relative weights, and major diagnostic cate-gory codes and titles [22]. Diagnosis-related group rela-tive weights reflect the average resource cost required tocare for cases in that particular DRG, relative to theaverage resources used to treat cases in all DRGs [19].These additional data were merged with the NHDS fileby DRG code.
Several alternatives to global RVUs were considered asproxies for valuing procedures and modalities. Briefly,these approaches used either (1) relative values assignedto ambulatory payment classifications from HOPPS or(2) DRG relative weights. None of these alternativesproved to be superior to the original approach on statis-tical or methodologic grounds.
Hospital inpatient experiences of imaging patientswere analyzed in the following ways:
● the number (up to 4 in the NHDS survey) of imagingservices received during the inpatient stay and
● the number of global RVUs associated with the imag-ing services received during the inpatient stay.
Descriptive statistics are presented on the likelihood ofuninsurance and the mean number of imaging servicesand RVUs received for persons who undergo one or moreimaging service during an inpatient episode.
Multivariate regression analysis was used to estimatethe effect of insurance status on imaging service utiliza-tion and RVUs, while controlling for severity of illnessand other measurable factors. The approach was to esti-mate models in which imaging service use was explainedby patient demographics, health status, hospital stay ex-periences, hospital characteristics, and, most importantfor this study, insurance status.
The models included the following factors that mightexplain differences in imaging utilization (binary unlessotherwise indicated):
● lack of medical insurance;● patient demographics: age, race, sex, and marital sta-
tus;
● type of admission and source of admission;● severity of illness: DRG relative weight and major di-
agnostic category (in index units);● type of discharge;● length of stay in days; and● hospital characteristics: ownership, number of beds,
and geographic region.
Odds Ratios for Being Uninsured by ModalityAn event with a 50/50 likelihood (ie, P � .50) has anodds ratio (P/[1�P]) of 1. When the probability P ex-ceeds .50, the odds ratio is � 1. This approach was usedto estimate the odds that the recipient of a particularimaging modality was uninsured, where P is the proba-bility of being uninsured.
Logistic regression was used to estimate the likelihoodof being uninsured for the average inpatient recipient ofa particular modality. Only persons who received a par-ticular modality, and that modality only, were used incomputations for that modality. This means that thesubset of patients considered here is different than theone used for other analyses. Chi-square statistics wereused to test whether an odds ratio significantly differedfrom 1 (P � .05).
RESULTS
Characteristics of Hospital InpatientsTable 1 presents information on hospital inpatients whoreceived 1 or more imaging service, by several categories.Just over 9% were uninsured, and this ranged from 5.8%to 15.7% depending on age. More than 90% of theuninsured were self-payers. An average of 1.51 imagingservices and 11.0 imaging RVUs were received by imagedinpatients. These averages do not differ in a statisticallysignificant sense between insured and uninsured. Thepercentage of hospital discharges accounted for by unin-sured imaging inpatients is presented in column 1. Lackof insurance was more likely among young adults, malepatients, African Americans, those who were not mar-ried, and patients in government hospitals. Uninsurancewas less prevalent for persons in the Northeast and Mid-west but more prevalent in the West. These characteris-tics of the uninsured from the NHDS tend to mirrorthose from household-based surveys.
Column 2 of Table 1 presents the mean number ofimaging services received during an inpatient episode.Older persons tended to receive more imaging, as didsome nonwhite groups, marital separates, patients in gov-ernment hospitals, and those in the Northeast. Singles,patients in nonprofit hospitals, and persons in the Southtended to receive fewer than average imaging services.
Column 3 of Table 1 shows the mean number ofimaging RVUs received during an inpatient stay. Thepatterns across various groups tended to mirror those for
the number of imaging services.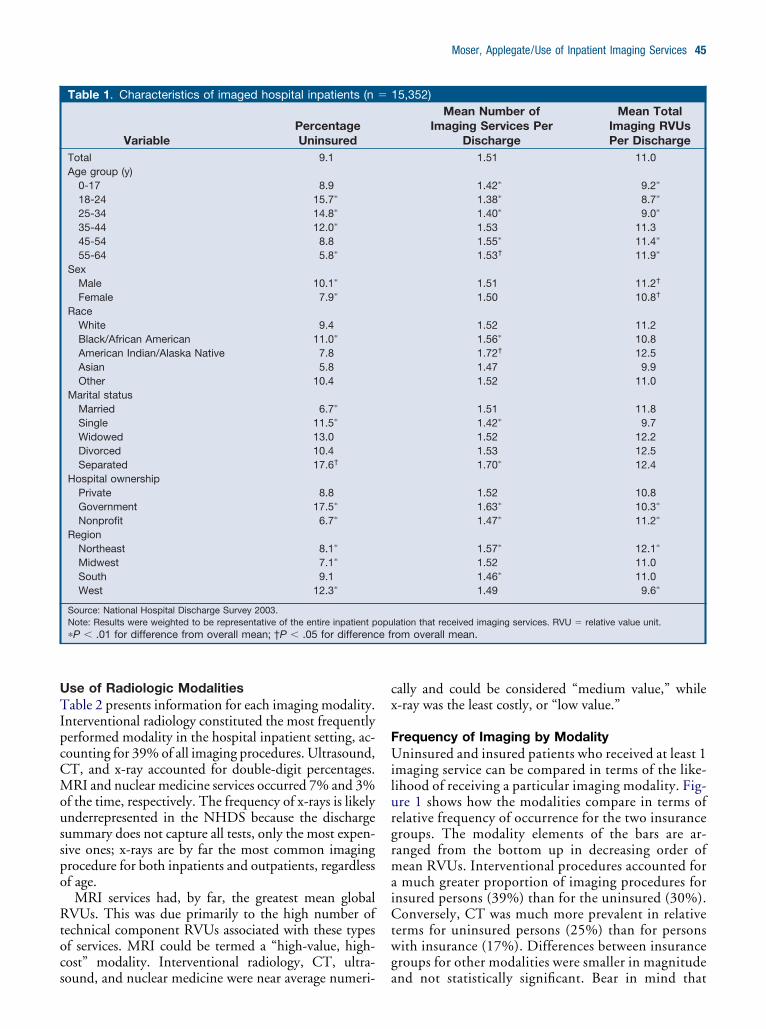
cx
e f
Moser, Applegate/Use of Inpatient Imaging Services 45
Use of Radiologic ModalitiesTable 2 presents information for each imaging modality.Interventional radiology constituted the most frequentlyperformed modality in the hospital inpatient setting, ac-counting for 39% of all imaging procedures. Ultrasound,CT, and x-ray accounted for double-digit percentages.MRI and nuclear medicine services occurred 7% and 3%of the time, respectively. The frequency of x-rays is likelyunderrepresented in the NHDS because the dischargesummary does not capture all tests, only the most expen-sive ones; x-rays are by far the most common imagingprocedure for both inpatients and outpatients, regardlessof age.
MRI services had, by far, the greatest mean globalRVUs. This was due primarily to the high number oftechnical component RVUs associated with these typesof services. MRI could be termed a “high-value, high-cost” modality. Interventional radiology, CT, ultra-
Table 1. Characteristics of imaged hospital inpatients (n
VariablePercentageUninsured
Total 9.1Age group (y)
0-17 8.918-24 15.7�
25-34 14.8�
35-44 12.0�
45-54 8.855-64 5.8�
SexMale 10.1�
Female 7.9�
RaceWhite 9.4Black/African American 11.0�
American Indian/Alaska Native 7.8Asian 5.8Other 10.4
Marital statusMarried 6.7�
Single 11.5�
Widowed 13.0Divorced 10.4Separated 17.6†
Hospital ownershipPrivate 8.8Government 17.5�
Nonprofit 6.7�
RegionNortheast 8.1�
Midwest 7.1�
South 9.1West 12.3�
Source: National Hospital Discharge Survey 2003.Note: Results were weighted to be representative of the entire inpatient p�P � .01 for difference from overall mean; †P � .05 for differenc
sound, and nuclear medicine were near average numeri-
ally and could be considered “medium value,” while-ray was the least costly, or “low value.”
Frequency of Imaging by ModalityUninsured and insured patients who received at least 1imaging service can be compared in terms of the like-lihood of receiving a particular imaging modality. Fig-ure 1 shows how the modalities compare in terms ofrelative frequency of occurrence for the two insurancegroups. The modality elements of the bars are ar-ranged from the bottom up in decreasing order ofmean RVUs. Interventional procedures accounted fora much greater proportion of imaging procedures forinsured persons (39%) than for the uninsured (30%).Conversely, CT was much more prevalent in relativeterms for uninsured persons (25%) than for personswith insurance (17%). Differences between insurancegroups for other modalities were smaller in magnitude
15,352)Mean Number of
Imaging Services PerDischarge
Mean TotalImaging RVUsPer Discharge
1.51 11.0
1.42� 9.2�
1.38� 8.7�
1.40� 9.0�
1.53 11.31.55� 11.4�
1.53† 11.9�
1.51 11.2†
1.50 10.8†
1.52 11.21.56� 10.81.72† 12.51.47 9.91.52 11.0
1.51 11.81.42� 9.71.52 12.21.53 12.51.70� 12.4
1.52 10.81.63� 10.3�
1.47� 11.2�
1.57� 12.1�
1.52 11.01.46� 11.01.49 9.6�
lation that received imaging services. RVU � relative value unit.rom overall mean.
�
opu
and not statistically significant. Bear in mind that

os
46 Journal of the American College of Radiology/Vol. 9 No. 1 January 2012
these figures represent the distribution of imaging pro-cedures actually received but do not address the like-lihood of receiving an imaging procedure in the firstplace. Although not depicted, the distribution ofRVUs across modalities was similar to that for thenumber of procedures.
Insurance status notwithstanding, interventional radi-ology was the predominant modality for hospital inpa-tients in terms of frequency, whereas MRI had the high-est mean RVUs. Uninsured imaged patients receivedroughly the same number of imaging services and RVUsas insured imaged inpatients did. The distribution ofimaging modalities was more concentrated in CT andless concentrated in interventional radiology for unin-sured persons than for insured persons, in terms of bothfrequency and RVUs. Finally, the uninsured received alower concentration of higher valued interventional ra-diology services and a higher concentration of moder-ately valued CT services, in comparison with their in-sured counterparts.
Total Imaging ServicesTo understand how hospital inpatients compared by in-surance group, several multivariate regression modelswere analyzed. When total imaging services was used asthe dependent variable, uninsured imaging patients re-ceived a regression-adjusted average of 1.54 imaging ser-vices per hospitalization, compared with 1.47 for insuredimaging patients. This small difference was not statisti-cally significant, nor is it likely to be clinically important.The magnitude and significance of the insurance groupvariable were unaffected by the inclusion or exclusion ofmost of the control variables.
Total RVUsMean RVUs for all imaging procedures were also esti-mated. Being uninsured had no significant impact on
Table 2. Hospital inpatient imaging modalities:frequency distribution and mean RVUs (n � 15,352)
ModalityRelative
FrequencyMeanRVUs
MRI 6.6 17.9Interventional 39.0 9.5CT 17.5 7.4Ultrasound 21.0 5.4Nuclear medicine 3.0 4.4X-ray (excluding mammography) 12.9 1.9Total 100.0 7.7
Sources: NHDS 2003 and National Physician Fee Schedule RelativeValue File 2003.Notes: Relative frequency uses imaging codes from four procedure fieldsin the NHDS. RVUs are for global procedure codes that include bothtechnical and professional components. Results were weighted to berepresentative of the entire inpatient population. NHDS � National Hos-pital Discharge Survey; RVU � relative value unit.
RVUs, as indicated by the lack of statistical significance
f the coefficient for the insurance class variable (“unin-ured”).
Odds Ratios for Being Uninsured by ModalityFigure 2 displays the estimated odds ratios for beinguninsured for the several modalities. The modalities arearranged in order of mean imaging RVUs, from least tomost. With one exception, all odds ratios differed signif-icantly from 1 (P � .001 for all modalities except CT;P � .05 for CT). There was a clear tendency for thelikelihood of being uninsured to be associated with lowervalued modalities. This means that those who receivedlower valued imaging were more likely to be uninsured.Nuclear medicine, with an odds ratio of nearly 5:1 infavor of uninsured, was an outlier compared with othermodalities.
Influence of Other Factors on Imaging UseIn addition to insurance status, other variables were ex-amined for their influence on total imaging proceduresand RVUs. The number of imaging services and RVUstended to increase with age. There was no differencebetween male and female patients in the number of ser-vices or RVUs. Whites received more RVUs than non-whites. Compared with married persons, singles hadfewer imaging services and RVUs.
Inpatients in government hospitals (excluding federal,military, and US Department of Veterans Affairs) re-ceived more imaging services but fewer RVUs than thosein private hospitals. The opposite was the case for pa-tients admitted to nonprofit hospitals; these inpatientsreceived more RVUs but fewer imaging services thanprivate hospital inpatients. The volume of procedures
Fig 1. Distribution of procedures across modalities. Fourprocedure code variables were used in calculations. Mo-dality bars are arranged from the bottom up in ascendingorder of mean relative value units. Results were weighted tobe representative of the entire inpatient population thatreceived imaging services. Source: National Hospital Dis-
charge Survey 2003.
ltcittutsth
fiecrigt1fidipup
Va
Moser, Applegate/Use of Inpatient Imaging Services 47
was not significantly affected by the number of hospitalbeds; however, as hospital size increased, RVUs in-creased. Persons with longer hospital stays received moreimaging services and RVUs. Patients with more severeillnesses (as proxied by DRG relative weight) receivedfewer imaging services and RVUs.
Persons with emergency or urgent admissions receivedmore imaging but not more RVUs compared with per-sons with elective admissions. Those referred from emer-gency departments received more imaging services andRVUs than persons referred for admission by physicians.
DISCUSSIONUninsured patients who were admitted to the hospitaland received at least one imaging service received roughlythe same number of imaging services during their stayscompared with insured inpatients. Furthermore, thevalue (in terms of RVUs) of imaging services received bythe uninsured tended to be the same as for the insured.Other studies have shown that the uninsured are lesslikely to get timely medical care and consequently likelyto be sicker upon being admitted to the hospital. There-fore, everything else being the same, the uninsured mighthave been expected to get more imaging in the hospitalcompared with insured patients.
Using a subset of the sample containing inpatients whoreceived only one imaging modality, there was a bias towardlower valued modalities for uninsured compared with in-sured patients. The result that inpatient recipients of nuclear
Fig 2. Odds ratio of being uninsured for persons using a giusing a particular modality is uninsured rather than insuModalities are sorted in order from lowest to highest meaSurvey 2003 and National Physician Fee Schedule Relative
medicine imaging in this subset were nearly 5 times more i
ikely to be uninsured than insured stands in stark contrasto the other modalities. Hypotheses for this phenomenonould include that outpatient access to this modality is lack-ng for uninsured persons but medically indicated. In addi-ion, one surprising finding was that sicker patients tendedo have less imaging and fewer RVUs. Although we arencertain of the explanation for this finding, we speculatehat this could be explained by several factors, includinghorter lengths of stay, deaths, transfers, and the facthat some patients may have been too sick to undergoigher RVU procedures.A common belief is that uninsured persons receive
ewer health care services than insured persons. Viewedn that context, one might have expected more differ-nces to emerge. On the other hand, given the specialircumstances of the hospital setting as well as the role ofadiologists in the continuum of care, it may be surpris-ng that any differences were found at all. The Emer-ency Medical Treatment and Active Labor Act, part ofhe Consolidated Omnibus Budget Reconciliation Act of985, makes it illegal for hospitals to turn people awayrom emergency rooms because they cannot pay, impos-ng severe penalties on hospitals that engage in “patientumping.” Yet hospitals may have explicit policies or
mplicit practices that limit services to patients who theyerceive may be unable or not required to pay, such asninsured patients admitted through the emergency de-artment.What might account for the observed similarities in
modality. Height of bar represents the odds that a person. Odds ratios were computed from logistic regression.
relative value units. Sources: National Hospital Dischargelue File 2003.
venredn
nsured and uninsured groups from the provider’s per-

cssbwe[oq
ptup“pcpsde
bitag
psTpl
dhvtRuutal
al
trNbicp
48 Journal of the American College of Radiology/Vol. 9 No. 1 January 2012
spective? We discuss several factors that may explain whyuninsured patients might receive more or less imagingcompared with insured patients.
Referring physicians likely know the insurance statusof hospital inpatients. If they did know that a patient wasuninsured, they might have several factors in mind whenordering imaging studies. Referring physicians might or-der fewer or less expensive procedures in the case ofnoncharged patients [23]. Moreover, referring physi-ians might consciously skimp on ordering in the case ofelf-paying patients, knowing that they would be pre-ented with the bill. Self-payers are usually charged morey hospitals compared with those with insurance, forhom discounts are negotiated by their insurance carri-
rs, notwithstanding how much they negotiate paying24]. For these reasons, less imaging and less care mayccur. None of these rationales is inconsistent with gooduality care.
Another consideration is physicians’ concerns of mal-ractice claims. Such fears could be manifested in doc-ors’ ordering more procedures and tests to produce doc-mentary evidence that they left no stone unturned inroviding diagnosis and treatment, a practice known asdefensive medicine.” The evidence supporting this hy-othesis is mixed [25,26]. Nevertheless, if physicians per-eived that they were less likely to be sued by uninsuredersons, it could encourage less imaging for the unin-ured compared with the insured patient. The NHDSata lack evidence to support or contradict this hypoth-sis.
It seems plausible that the finding that inpatients inoth government and nonprofit hospitals received moremaging procedures but fewer RVUs compared withhose in private hospitals may be due to the largermount of outpatient imaging performed for those withood insurance but not accessible to those without it.
To the extent that service deficits for some uninsuredatients exist, it may not be that they receive too fewervices but that insured patients get too many [27,28].his is a possibility given that insured persons typicallyay only a fraction of the bill and are therefore more
ikely to overutilize health care.More than 90% of the uninsured were self-payers. The
efinition of uninsurance here differs from that used inousehold surveys such as the Current Population Sur-ey and the National Health Interview Survey, which ishe source of most statistics on persons lacking insurance.oughly 8% of hospital discharges were associated withninsured patients, whereas 18% of nonelderly individ-als lacked insurance, according to the Current Popula-ion Survey. Some of the difference is definitional, but itlso may reflect that the uninsured are hospitalized withess frequency than insured persons.
Some persons are uninsured by personal choice, suchs those who are younger, healthier, or between jobs and
acking employment-based benefits. Inpatients aged 18o 24 years had the highest rate of uninsurance (15.8%)elative to those aged 55 to 64 years (5.8%) in theHDS. They may perceive insurance as an unattractive
enefit/cost option. Some of them have ready access tonsurance and could afford it but nevertheless declineoverage [29]. Lack of insurance is not much of an im-ediment to inpatient care for such individuals.
LimitationsThere were several limitations to this study. Little isknown about what “self-pay” really means and how hos-pitals decide whether to classify a patient as self-pay or nocharge. Some self-payers undoubtedly lack insurancecoverage but nevertheless have the financial means to payout of pocket. Other uninsured inpatients may be med-ically indigent, and hospitals use some unknown processfor deciding whether to send them a bill for at least partialpayment or to classify them as charity and not chargethem at all. Furthermore, it is not known in the NHDSwhether the hospital makes this determination upon ad-mission or, alternatively, if the patient record on sourceof payment is amended at a later time to reflect the realityof nonpaying patients.
The data set used has insufficient observations to sep-arate uninsured into self-pay and no-charge subgroups; itmay well be that the findings could differ for these twosubgroups. The study was confined to hospital inpa-tients, and it remains to be seen how results might differfor other settings. The incompleteness of the procedurecode crosswalk prevents making comparisons on the ba-sis of all inpatient procedures. The NHDS measures arelimited to control for diagnosis, socioeconomic status,and health status.
Policy ImplicationsThe Patient Protection and Affordable Care Act(“Obamacare”) was passed in March 2010 [30]. Manyprovisions are not well understood yet and do not go intoeffect for several years. Preliminary estimates of the im-pact on the number of uninsured are widely divergentand therefore unreliable [31,32]. Before the passage ofthis legislation, it was estimated that covering the unin-sured would entail $34 billion to $69 billion (in 2001dollars) in additional annual medical care spending,would increase total health care spending by 3% to 6%,but would increase the proportion of gross domesticproduct devoted to health care by less than 1 percentagepoint [[33]].
CONCLUSIONSThe number of imaging procedures is similar for insuredand uninsured inpatients, as is the procedure intensity asmeasured by global RVUs. Because insurance status doesnot seem to significantly influence the quantity or valueof imaging services received by hospital inpatients, ef-
forts to assist uninsured patients with imaging needs
2
2
2
2
2
2
2
2
2
3
Moser, Applegate/Use of Inpatient Imaging Services 49
would be better directed elsewhere than the hospitalinpatient setting.
ACKNOWLEDGMENTS
We wish to acknowledge the valuable research assistanceof Helen Olkaba. Insightful comments on earlier ver-sions of this article were received from staff members inthe ACR Research Department and the American Med-ical Association Statistical and Economic Research De-partment and attendees at the AcademyHealth AnnualResearch Meeting. Dr Moser completed the bulk of thisresearch while on the staff of the ACR.
REFERENCES
1. US Census Bureau. Current population reports, P60-238, income, pov-erty, and health insurance coverage in the United States: 2009. Washing-ton, DC: US Government Printing Office; 2010.
2. Fronstin P. Sources of health insurance and characteristics of the unin-sured: analysis of the March 2005 Current Population Survey (Issue Brief287). Washington, DC: Employee Benefit Research Institute; 2004.
3. Herrick D. Five myths about the uninsured (Brief Analysis No 339).Dallas, TX: National Center for Policy Analysis; 2000.
4. Laugesen MJ, Paul RR, Luft HS, Aubry W, Ganiats TG. A comparativeanalysis of mandated benefit laws 1949-2002. Health Serv Res 2006;41:1081-103.
5. Hadley J, Cunningham PJ. Perception, reality and health insurance: un-insured as likely as insured to perceive need for care but half as likely to getcare. Washington, DC: Center for Studying Health System Change;2005.
6. Card D, Dobkin C, Maestas N. The impact of nearly universal insurancecoverage on health care utilization: evidence from Medicare. Am EconRev 2008;98:2242-58.
7. Fairbrother G, Gusmano ML, Park HL, Scheinmann R. Care for theuninsured in general internists’ private offices. Health Aff (Millwood)2003;22:217-24.
8. Hsia J, Kemper E, Kiefe C. et al. The importance of health insurance as adeterminant of cancer screening: evidence from the Women’s HealthInitiative. Prev Med 2000;31:261-70.
9. Potosky AL, Breen N, Graubard BI, Parsons PE. The association betweenhealth care coverage and the use of cancer screening tests. Med Care1998;36:257-70.
10. Collins SR, Davis K, Doty MM, Kriss JL, Holmgren AL. Gaps in healthinsurance: an all-American problem. New York: The CommonwealthFund; 2006.
11. Emergency in the emergency rooms. The New York Times. June 21,2006:A16
12. Institute of Medicine. Hidden costs, values lost: uninsurance in America.Washington, DC: National Academies Press; 2003.
13. Braveman P, Schaaf VM, Egerter S, Bennett T, Schecter W. Insurance-related differences in the risk of ruptured appendix. N Engl J Med 1994;331:444-9.
14. Centers for Disease Control and Prevention. National Hospital Discharge
Survey. Available at: http://www.cdc.gov/nchs/nhds.htm. Accessed Sep-tember 20, 2010.15. American Medical Association. Current Procedural Terminology CPT2003, standard edition. Chicago, Ill: American Medical Association;2003.
16. Centers for Disease Control and Prevention, National Center for HealthStatistics. International Classification of Diseases, Ninth Revision, Clin-ical Modification (ICD-9-CM). Available at: http://www.cdc.gov/nchs/icd/icd9cm.htm. Accessed September 20, 2010.
17. Centers for Medicare and Medicaid Services. PFS relative value files.Available at: http://www.cms.gov/PhysicianFeeSched/PFSRVF/. Ac-cessed September 20, 2010.
18. Centers for Medicare and Medicaid Services. Historical DRG weight file.Available at: http://www.cms.gov/AcuteInpatientPPS/FFD/itemdetail.asp?filterType�none&filterByDID�-99&sortByDID�2&sortOrder�ascending&itemID�CMS022531&intNumPerPage�10. AccessedSeptember 20, 2010.
19. US Department of Health and Human Services, Centers for Medicareand Medicaid Services. Medicare program; changes to the Hospital Inpa-tient Prospective Payment Systems and fiscal year 2006 rates; final rule.Fed Reg. Available at: http://edocket.access.gpo.gov/2005/pdf/05-15406.pdf. Accessed August 27, 2011.
20. Centers for Medicare and Medicaid Services. Addendum A and addendum Bupdates. Available at: http://www.cms.gov/HospitalOutpatientPPS/AU/list.asp?listpage�1. Accessed September 20, 2010.
1. US House of Representatives, Committee on Ways and Means. Greenbook: main page. Available at: http://www.gpoaccess.gov/wmprints/green/index.html. Accessed September 20, 2010.
2. Centers for Medicare and Medicaid Services. Acute Inpatient Files forDownload. DRG Relative Weights. Available at: https://www.cms.gov/AcuteInpatientPPS/FFD/list.asp. Accessed September 12, 2011.
3. Mort EA, Edwards JN, Emmons DW, Convery K, Blumenthal D. Phy-sician response to patient insurance status in ambulatory care clinicaldecision-making. Med Care 1996;34:783-97.
4. Tompkins CP, Altman SH, Eilat E. The precarious pricing system forhospital services. Health Aff (Millwood) 2006;25:45-56.
5. Danzon PM. Liability for medical malpractice: incidence and incentiveeffects (working paper). Philadelphia: University of Pennsylvania; 1990.
6. Kessler D, McClellan M. Do doctors practice defensive medicine? Q JEcon 1996;111:353-90.
7. Center for the Evaluative Clinical Services. Effective care. Available at: http://www.dartmouthatlas.org/downloads/reports/effective_care.pdf. AccessedSeptember 20, 2010.
8. Wennberg JE. Practice variations and health care reform: connecting thedots. Health Aff (Millwood). Available at: http://content.healthaffairs.org/cgi/content/abstract/hlthaff.var.140. Accessed September 20, 2010.
9. Short PF, Graefe DR. Battery-powered health insurance? Stability incoverage of the uninsured. Health Aff (Millwood) 2003;22:244-55.
0. US Congress. Patient Protection and Affordable Care Act. Available at:http://frwebgate.access.gpo.gov/cgi-bin/getdoc.cgi?dbname�111_cong_bills&docid�f:h3590enr.txt.pdf. Accessed September 29, 2010.
31. Congressional Budget Office. Cost estimates for H.R. 4872, Reconcilia-tion Act of 2010 (final health care legislation). Washington, DC: Con-gressional Budget Office; 2010.
32. Heritage Foundation. Obamacare: impact on the uninsured. Available at:http://www.heritage.org/research/reports/2010/04/obamacare-impact-on-the-uninsured. Accessed September 29, 2010.
33. Hadley J, Holahan J. Covering the uninsured: how much would it cost?Health Aff (Millwood) 2004:W3-250-65.