use of in-situ tests to identify soil behavior type and ... of in-situ tests to identify soil...
TRANSCRIPT

University of South CarolinaScholar Commons
Theses and Dissertations
2014
Use of In-Situ Tests to identify Soil Behavior Typeand Liquefaction Susceptibility of SCCP SoilsRajshekhar SarkarUniversity of South Carolina - Columbia
Follow this and additional works at: http://scholarcommons.sc.edu/etd
This Open Access Thesis is brought to you for free and open access by Scholar Commons. It has been accepted for inclusion in Theses and Dissertationsby an authorized administrator of Scholar Commons. For more information, please contact [email protected].
Recommended CitationSarkar, R.(2014). Use of In-Situ Tests to identify Soil Behavior Type and Liquefaction Susceptibility of SCCP Soils. (Master's thesis).Retrieved from http://scholarcommons.sc.edu/etd/2713
USE OF IN-SITU TESTS TO IDENTIFY SOIL BEHAVIOR TYPE AND LIQUEFACTION
SUSCEPTIBILITY OF SCCP SOILS
by
Rajshekhar Sarkar
Bachelor of Technology West Bengal University of Technology, 2011
Submitted in Partial Fulfillment of the Requirements
For the Degree of Master of Science in
Civil Engineering
College of Engineering and Computing
University of South Carolina
2014
Accepted by:
Sarah Gassman, Director of Thesis
Charles Pierce, Reader
Pradeep Talwani, Reader
Lacy Ford, Vice Provost and Dean of Graduate Studies

ii
© Copyright by Rajshekhar Sarkar, 2014 All Rights Reserved.
iii
ACKNOWLEDGEMENTS
I would like to express the deepest appreciation to my advisor, Dr. Sarah
Gassman, for her guidance, encouragement and patience during the last two years. She is
definitely the best advisor I could ever have. I am really very grateful to her for having
complete faith in me and guiding me through this path to success. Without her
enthusiasm, motivation and support this research would not have been possible. I am
really indebted to her for giving me the opportunity to present research work on her
behalf at the Geo-Conference 2014 held in Atlanta.
Besides my advisor, I would also like to thank committee members Dr. Charles
Pierce and Dr. Pradeep Talwani for taking their precious time to review this thesis and for
their valuable advice and insightful comments to improve this work.
I would like to give my sincere thanks to Joe Williamson and Michael Hasek for
their combined efforts on laboratory index testing and their research work on SCCP soils
which have been referenced in the scope of this thesis. Much appreciation is also given to
USC former researchers Ke Hu and Lila Leon for their previous work at SCCP research
sites.
Lastly I would like to thank my mother, father, brother and all my dear friends for
their unceasing love, encouragement and support in all my endeavors.

iv
ABSTRACT
For many years, the Cone Penetrometer Test (CPT), Flat Plate Dilatometer Test
(DMT) and Standard Penetration Test (SPT) have been used as in-situ tools to assess the
liquefaction potential of soils. Given the importance of evaluating liquefaction potential
in the South Carolina Coastal Plain (SCCP), research was conducted to study the soil
behavior of soils prone to liquefaction, develop site specific correlations between SPT,
DMT and CPT testing parameters and evaluate the liquefaction susceptibility of the soils
in the SCCP. The SCCP sites studied in this thesis are Sampit (SAM), Gapway (GAP),
Hollywood (HWD), Four Hole Swamp (FHS) and Fort Dorchester (FD). Normalized
Cone Tip Resistance, Q, versus Normalized Friction Ratio, F and Material Index, ID,
versus Dilatometer Modulus, ED; charts were used to determine the soil behavior of soils
prone to liquefaction. The soil behavior obtained from these charts was compared to the
USCS results. From this analysis, the source sand layers at SAM, GAP, HWD and FD
were found to be liquefiable, however, the source sands at FHS were considered as non-
liquefiable due to the high fines content. A new DMT soil behavior chart is proposed
based on the soil behavior of source sands which were classified according to physical
measurements of relative densities obtained from laboratory tests on high quality soil
samples. This chart was found to be in good agreement with the CPT soil behavior chart.
The soil characteristics of the overburden layer and the current prediction of the water
table indicated that the formation of sandblows is unlikely to occur at the Fort

v
Dorchester site in future seismic events. CPT and DMT tests were also used herein to
develop site-specific correlations between Q-KD and Q-ED/σ‟vo for different types of
soils. SPT-DMT correlations were also established for all soil types in the SCCP and
were compared to previously published correlations. New correlations between these
parameters were also developed for source sands at each site as well as for the combined
source sands from all the five sites. Published relations between average Ic and Bq values
were used to determine the soil susceptibility to liquefaction. Finally, a comparison
between the geotechnical properties of the sites studied herein to sites where no
liquefaction features have been found indicated that the sites studied herein are currently
more susceptible to liquefaction than the other sites. Further research is required to
evaluate the liquefaction potential at these sites.
vi
TABLE OF CONTENTS
ACKNOWLEDGEMENTS...................................................................................................iii
ABSTRACT ................................................................................................................... iv
LIST OF TABLES........................................................................................................... viii
LIST OF FIGURES........................................................................................................... ix
CHAPTER 1 INTRODUCTION ............................................................................................ 1
1.1 OVERVIEW...................................................................................................... 1
1.2 SUMMARY OF SCCP RESEARCH TO DATE ......................................................... 1
1.3 RESEARCH OBJECTIVES ................................................................................... 2
1.4 THESIS OUTLINE ............................................................................................. 5
CHAPTER 2 BACKGROUND ............................................................................................. 6
2.1 INTRODUCTION ............................................................................................... 6
2.2 SITE DESCRIPTION........................................................................................... 6
2.3 IN SITU TEST METHODS................................................................................. 14
2.4 SUMMARY .................................................................................................... 26
CHAPTER 3 SOIL BEHAVIOR TYPE ................................................................................ 28
3.1 INTRODUCTION ............................................................................................. 28
3.2 SOIL BEHAVIOR TYPE FROM CPT ................................................................... 28
3.3 SOIL BEHAVIOR TYPE FROM DMT ................................................................. 48
3.4 DISCUSSION .................................................................................................. 58
3.5 ALL SOURCE SANDS ...................................................................................... 64
vii
3.6 OVERBURDEN LAYER .................................................................................... 68
3.7 SUMMARY .................................................................................................... 70
CHAPTER 4 SITE SPECIFIC CORRELATIONS..................................................................... 72
4.1 INTRODUCTION ............................................................................................. 72
4.2 DMT AND CPT CORRELATIONS ..................................................................... 72
4.3 DMT AND SPT CORRELATIONS ..................................................................... 83
4.4 ALL SOURCE SAND CORRELATIONS................................................................ 97
4.5 SUMMARY ...................................................................................................105
CHAPTER 5 LIQUEFACTION SUSCEPTIBILITY .................................................................108
5.1 INTRODUCTION ............................................................................................108
5.2 METHODOLOGY ...........................................................................................108
5.3 RESULTS......................................................................................................109
5.4 DISCUSSION .................................................................................................115
5.5 COMPARISON BETWEEN LIQUEFACTION AND
NON-LIQUEFACTION SITES ...........................................................................118 5.6 SUMMARY ...................................................................................................121
5.7 FUTURE WORK ............................................................................................122
CHAPTER 6 CONCLUSIONS...........................................................................................124
6.1 SUMMARY ...................................................................................................124
6.2 MAJOR FINDINGS .........................................................................................124
6.3 FUTURE WORK ............................................................................................128
REFERENCES ..............................................................................................................129
viii
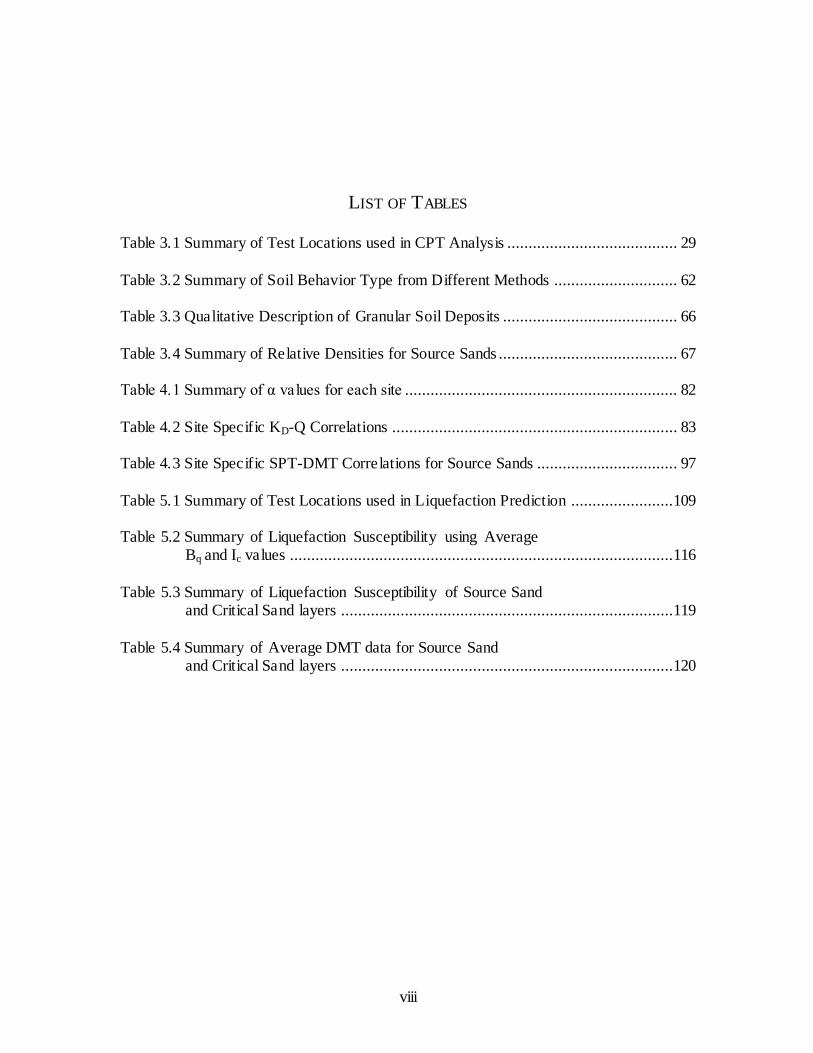
LIST OF TABLES
Table 3.1 Summary of Test Locations used in CPT Analysis ........................................ 29
Table 3.2 Summary of Soil Behavior Type from Different Methods ............................. 62
Table 3.3 Qualitative Description of Granular Soil Deposits ......................................... 66
Table 3.4 Summary of Relative Densities for Source Sands .......................................... 67
Table 4.1 Summary of α values for each site ................................................................ 82
Table 4.2 Site Specific KD-Q Correlations ................................................................... 83
Table 4.3 Site Specific SPT-DMT Correlations for Source Sands ................................. 97
Table 5.1 Summary of Test Locations used in Liquefaction Prediction ........................109
Table 5.2 Summary of Liquefaction Susceptibility using Average Bq and Ic values ..........................................................................................116
Table 5.3 Summary of Liquefaction Susceptibility of Source Sand and Critical Sand layers ..............................................................................119
Table 5.4 Summary of Average DMT data for Source Sand and Critical Sand layers ..............................................................................120

ix
LIST OF FIGURES
Figure 1.1 Location of Paleoliquefaction Features in the South Carolina Coastal Plain................................................................................................. 3 Figure 2.1 Exploration and Test Locations at the Sampit site .......................................... 7
Figure 2.2 Exploration and Test Locations at the Gapway site ........................................ 9
Figure 2.3 Exploration and Test Locations at the Hollywood site .................................. 10
Figure 2.4 Exploration and Test Locations at the Four Hole Swamp site ....................... 12
Figure 2.5 Exploration and Test Locations at the Fort Dorchester site ........................... 13
Figure 2.6 Soil Behavior Type Chart by Marchetti et al. (1980) .................................... 16
Figure 2.7 Normalized Soil Behavior Chart for CPT by Robertson (1990) .................... 20
Figure 2.8 Liquefaction Susceptibility Chart by Hayati and Andrus (2008) ................... 21
Figure 3.1 Soil Stratigraphy from CPT Data at the Sampit Site ..................................... 30
Figure 3.2 CPT Measured and Hydrostatic Pore Pressure at the Sampit Site .................. 31
Figure 3.3 Soil Behavior Type Classification Chart with data from
the Sampit Site............................................................................................ 32 Figure 3.4 Soil Stratigraphy from CPT Data at the Gapway Site ................................... 33
Figure 3.5 CPT Measured and Hydrostatic Pore Pressure at the Gapway Site ................ 34
Figure 3.6 Soil Behavior Type Classification Chart with data from the Gapway Site .......................................................................................... 35
Figure 3.7 Soil Stratigraphy from CPT Data at the Hollywood Site ............................... 37
Figure 3.8 CPT Measured and Hydrostatic Pore Pressure at the Hollywood Site ........... 38
Figure 3.9 Soil Behavior Type Classification Chart with data from the Hollywood Site ........................................................................................... 39

x
Figure 3.10 Soil Stratigraphy from CPT Data at the Four Hole Swamp Site .................. 40
Figure 3.11 CPT Measured and Hydrostatic Pore Pressure at the
Four Hole Swamp Site .............................................................................. 41 Figure 3.12 Soil Behavior Type Classification Chart with data from the Four Hole Swamp Site .............................................................................. 42
Figure 3.13 Soil Stratigraphy from CPT Data at the Fort Dorchester Site ...................... 43
Figure 3.14 CPT Measured and Hydrostatic Pore Pressure at the
Fort Dorchester Site .................................................................................. 44 Figure 3.15 Soil Behavior Type Classification Chart with data from Fort Dorchester Site oriented at E-W direction ........................................... 45
Figure 3.16 Soil Behavior Type Classification Chart with data from Fort Dorchester Site oriented at N-S direction ............................................. 46
Figure 3.17 Ic vs Depth profile at the Sampit, Gapway, Hollywood and Four Hole Swamp site.......................................................................... 47 Figure 3.18 Ic vs Depth profile at the Fort Dorchester site ............................................. 48
Figure 3.19 ID, KD, ED profiles with Depth at the Sampit site ........................................ 49 Figure 3.20 DMT Modulus and Material Index chart with DMT
results at the Sampit Site .......................................................................... 50 Figure 3.21 ID, KD, ED profiles with Depth at the Gapway site....................................... 51
Figure 3.22 DMT Modulus and Material Index chart with DMT results at the Gapway Site ........................................................................ 52 Figure 3.23 ID, KD, ED profiles with Depth at the Hollywood site .................................. 52
Figure 3.24 DMT Modulus and Material Index chart with DMT results at the Hollywood Site ................................................................... 53
Figure 3.25 ID, KD, ED profiles with Depth at the Four Hole Swamp site........................ 54
Figure 3.26 DMT Modulus and Material Index chart with DMT results at the Four Hole Swamp Site ......................................................... 55
Figure 3.27 ID, KD, ED profiles with Depth at the Fort Dorchester EW site ..................... 56

xi
Figure 3.28 ID, KD, ED profiles with Depth at the Fort Dorchester NS site ...................... 57
Figure 3.29 DMT Modulus and Material Index chart with DMT
results at the Fort Dorchester Site oriented at EW direction ....................... 57 Figure 3.30 DMT Modulus and Material Index chart with DMT results at the Fort Dorchester Site oriented at NS direction ........................ 58
Figure 3.31 Soil Behavior Type Classification Chart with Source Sand data at all sites .................................................................................. 65
Figure 3.32 Soil Behavior Type Classification Chart with Overburden Layer data at all sites ................................................................................. 68 Figure 3.33 DMT Modulus and Material Index chart with
Source Sand data at all sites....................................................................... 69 Figure 4.1 Correlations between KD and Q in Fine Grained Soils where Ic>2.6 and ID<1 using data from Sampit Site ...................................... 74
Figure 4.2 Correlations between KD and Q in Fine Grained Soils where Ic>2.6 and ID<1 using data from Gapway Site .................................... 74
Figure 4.3 Correlations between KD and Q in Fine Grained Soils where Ic>2.6 and ID<1 using data from Hollywood Site ................................ 75 Figure 4.4 Correlations between KD and Q in Fine Grained Soils
where Ic>2.6 and ID<1 using data from Four Hole Swamp Site ..................... 76
Figure 4.5 Correlations between ED/σ´vo and Q for all Soil types
using data from the Sampit site.................................................................... 79
Figure 4.6 Correlations between ED/σ´vo and Q for all Soil types using data from the Gapway site .................................................................. 79
Figure 4.7 Correlations between ED/σ´vo and Q for all Soil types using data from the Hollywood site ............................................................. 80
Figure 4.8 Correlations between ED/σ´vo and Q for all Soil types using data from the Four Hole Swamp site ................................................... 80
Figure 4.9 Correlations between ED/σ´vo and Q for all Soil types using
data from the Fort Dorchester site oriented in EW direction.......................... 81
Figure 4.10 Correlations between ED/σ´vo and Q for all Soil types using
data from the Fort Dorchester Site oriented in NS direction ........................ 81

xii
Figure 4.11 SPT-DMT Correlations for Clays at the Sampit site ................................... 86
Figure 4.12 SPT-DMT Correlations for Silts at the Sampit site ..................................... 87
Figure 4.13 SPT-DMT Correlations for Sands at the Sampit site................................... 88
Figure 4.14 SPT-DMT Correlations for all Soils at the Gapway site ............................. 89
Figure 4.15 SPT-DMT Correlations for Silts at the Hollywood site ............................... 91
Figure 4.16 SPT-DMT Correlations for Sands at the Hollywood site ............................ 92
Figure 4.17 SPT-DMT Correlations for Clays at the Four Hole Swamp site .................. 94
Figure 4.18 SPT-DMT Correlations for Silts at the Four Hole Swamp site .................... 95
Figure 4.19 SPT-DMT Correlations for Sands at the Four Hole Swamp site.................. 96
Figure 4.20 Correlations between KD and Q for Source Sand Layer at all sites.................................................................................................. 98
Figure 4.21 Correlation between ED/σ v́o and Q for Source Sand Layer
at all sites.................................................................................................. 98 Figure 4.22 SPT-DMT Correlations for Source Sand Layer at Sampit ..........................100
Figure 4.23 SPT-DMT Correlations for Source Sand Layer at Gapway ........................101
Figure 4.24 SPT-DMT Correlations for Source Sand Layer at Hollywood ...................102
Figure 4.25 SPT-DMT Correlations for Source Sand Layer at Four Hole Swamp ............................................................................................103
Figure 4.26 SPT-DMT Correlations for Source Sand Layer at all sites .........................104
Figure 5.1 CPT-based Liquefaction Susceptibility Chart using data from Sampit site ........................................................................................110
Figure 5.2 CPT-based Liquefaction Susceptibility Chart using data from Gapway site.......................................................................................111
Figure 5.3 CPT-based Liquefaction Susceptibility Chart using data from Hollywood site ..................................................................................112

xiii
Figure 5.4 CPT-based Liquefaction Susceptibility Chart using data from Four Hole Swamp site........................................................................113
Figure 5.5 CPT-based Liquefaction Susceptibility Chart using data from Fort Dorchester site oriented in EW direction .....................................114 Figure 5.6 CPT-based Liquefaction Susceptibility Chart using data
from Fort Dorchester site oriented in NS direction ......................................115
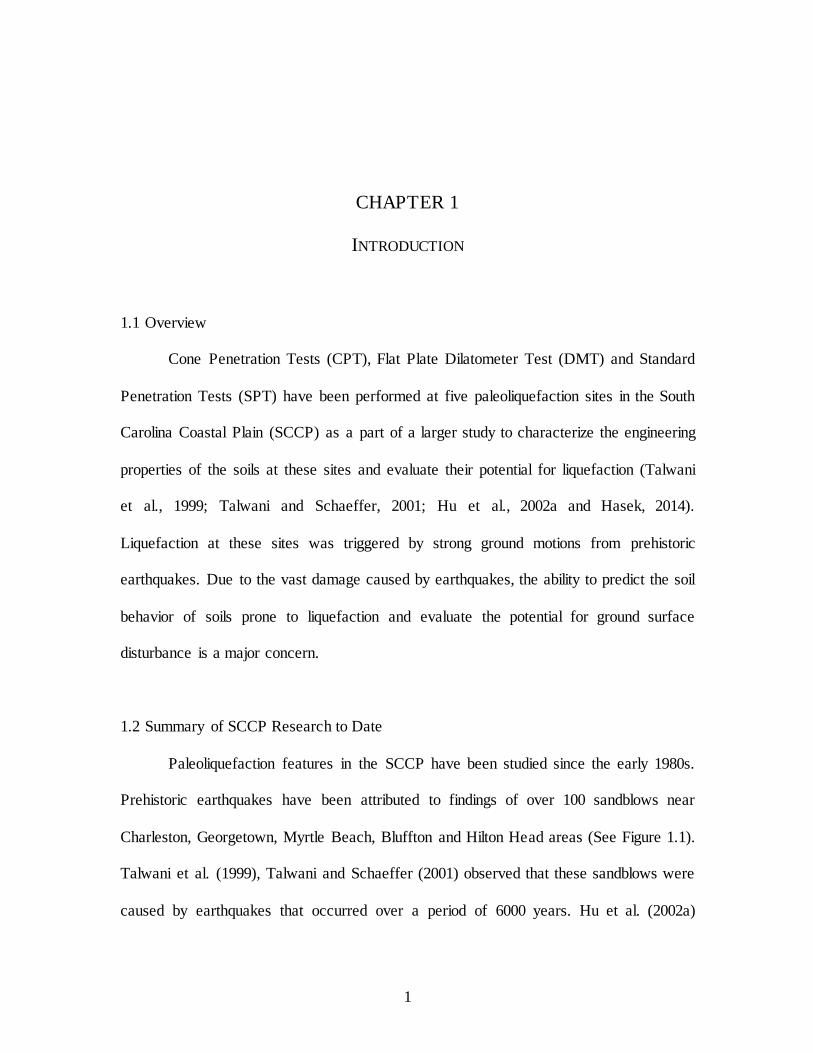
1
CHAPTER 1
INTRODUCTION
1.1 Overview
Cone Penetration Tests (CPT), Flat Plate Dilatometer Test (DMT) and Standard
Penetration Tests (SPT) have been performed at five paleoliquefaction sites in the South
Carolina Coastal Plain (SCCP) as a part of a larger study to characterize the engineering
properties of the soils at these sites and evaluate their potential for liquefaction (Talwani
et al., 1999; Talwani and Schaeffer, 2001; Hu et al., 2002a and Hasek, 2014).
Liquefaction at these sites was triggered by strong ground motions from prehistoric
earthquakes. Due to the vast damage caused by earthquakes, the ability to predict the soil
behavior of soils prone to liquefaction and evaluate the potential for ground surface
disturbance is a major concern.
1.2 Summary of SCCP Research to Date
Paleoliquefaction features in the SCCP have been studied since the early 1980s.
Prehistoric earthquakes have been attributed to findings of over 100 sandblows near
Charleston, Georgetown, Myrtle Beach, Bluffton and Hilton Head areas (See Figure 1.1).
Talwani et al. (1999), Talwani and Schaeffer (2001) observed that these sandblows were
caused by earthquakes that occurred over a period of 6000 years. Hu et al. (2002a)

2
analyzed SPT, CPT and shear wave velocity tests performed at the Sampit (SAM),
Gapway (GAP), Ten Mile Hill (A and B) sites to evaluate liquefaction potential. Soil
samples were also collected to classify the soil and obtain the percentage of fines. The
paleoliquefaction features at these sites in the SCCP were estimated to have been
associated with earthquakes of magnitudes ranging from 5.3 to 7.8 and peak ground
accelerations ranging from 0.14 to 0.42 g by Hu et al. (2002a). Leon et al. (2006)
developed new empirical boundary curves to estimate the Cyclic Resistance Ratio (CRR)
of aged soils and found that when compared to using relations developed for Holocene
soils to find CRR, CRR of SCCP soils was underestimated by as much as 60%. Hasek
(2014) analyzed geotechnical parameters at three additional sites: Hollywood (HWD),
Four Hole Swamp (FHS) and Fort Dorchester (FD) and studied the CRR obtained from
triaxial testing of high quality soil samples.
Williamson (2013) studied the geotechnical properties from DMT data at SAM,
GAP, HWD, FHS and FD and established correlations between CRR and DMT derived
from CRR-SPT and CRR-CPT correlations specific to SCCP to serve as boundary curves
between unliquefiable soils and soils that are prone to liquefaction. These DMT data
along with the CPT and SPT data collected at the five sites will be used herein to further
study the soil behavior and evaluate liquefaction susceptibility in the SCCP.
1.3 Research Objectives
Given the importance of evaluating liquefaction potential in the SCCP the
purpose of this research is to 1) study the soil behavior of soils prone to liquefaction, 2)
develop site specific correlations between SPT, DMT and CPT testing parameters, and 3)

3
evaluate the liquefaction susceptibility of the soils in the SCCP. The five sites studied in
this thesis are Sampit, Gapway, Hollywood, Four Hole Swamp and Fort Dorchester. The
geotechnical properties of the source sand layer are of particular interest to be able to
understand the current and prehistoric liquefaction potential.
Figure 1.1 Locations of Paleoliquefaction Features in the South Carolina Coastal Plain
(after Hu et al. 2002a, as shown in Williamson, 2013)
To study the soil behavior of the soils prone to liquefaction, data from CPT and
DMT tests were used in this research. Normalized Cone Tip Resistance versus
Normalized Friction Ratio and Dilatometer Modulus versus Material Index charts will be
used to find the Soil Behavior Type and compare them to the USCS method of soil
FD Δ

4
classification obtained from grain size distribution. The Soil Behavior Charts proposed by
Robertson (1990) and Marchetti et al. (1980) were used to reflect the mechanical
characteristics of the soil; a different approach than a soil classification based on grain
size distribution and Atterberg limits. Zones 5 and 6 of the CPT based chart represent
clean sands to sands and silt mixtures, soils which are generally considered to be
potentially liquefiable soils. Whether the CPT data of the source sand layers plot within
the specified zones will be determined from the CPT based chart. The soil behavior of
source sands and the overburden layer will be studied to understand whether the
sandblows will form in future seismic events. Furthermore, the physical measurements of
relative densities from laboratory tests will also be used to characterize the soil behavior
of source sands.
The in-situ data that was obtained by Hasek (2014) will be used to develop site
specific correlations between DMT and CPT and DMT and SPT testing parameters for
the SCCP soils. The CPT and DMT data will be used to develop correlations between Q-
KD and Q-ED/σ‟vo parameters for all fine grained soils and for all soil types respectively.
These newly acquired correlations will then be compared to previous published
correlations. SPT-DMT correlations will be developed for three different soil types: silts,
clays and sands and compared to the correlations found by Hajduk (2006) specific to the
Charleston region in the SCCP. In addition to these results, new correlations between the
CPT-DMT and SPT-DMT parameters will also be established for the source sand layers
at each site as well as for combined source sands from all five research sites.
Ic and Bq values from CPT test data will be further analyzed by using the CPT
based susceptibility charts provided by Hayati and Andrus (2008a) to evaluate whether

5
the source sand at each site is susceptible to liquefaction or not. Lastly, a comparison will
be made between the in situ data from the sites studied herein where there is evidence of
liquefaction to sites studied by Geiger (2010) where there is no evidence of liquefaction.
1.4 Thesis Outline
The thesis is organized in six chapters as follows. Chapter 2 presents an overview
of the five geotechnical sites studied in this thesis. The in situ testing procedures, existing
correlations between DMT-CPT and DMT-SPT parameters and methods used to
determine soil behavior type and liquefaction susceptibility of soils are also presented.
Chapter 3 addresses the CPT and DMT methodologies used to determine soil behavior
type for SCCP soils. Chapter 4 presents the DMT-CPT and DMT-SPT correlations
developed for different soil types in the SCCP and compares them to existing correlations
between DMT-CPT and DMT-SPT test parameters. Chapter 5 presents an analysis of the
liquefaction susceptibility at the five sites in the SCCP using CPT based charts by Hayati
and Andrus (2008a). Finally in Chapter 6, conclusions are drawn and recommendations
for future work are given.

6
CHAPTER 2
BACKGROUND
2.1 Introduction
This chapter gives a summary of the five geotechnical investigation sites in the
South Carolina Coastal Plain. The in situ testing procedures and assumptions that are
used in reducing the experimental data for each test are presented. These tests include the
dilatometer test, cone penetration test and standard penetration test. Previous work
presented by other researchers and existing correlations between different test parameters
are also summarized.
2.2 Site Descriptions
2.2.1 Sampit Site
The Sampit site is situated about 9.2 miles west northwest of Georgetown, South
Carolina. As discussed by Williamson (2013), the elevation above mean sea level varies
from 37 to 43 ft (11.3 to 13.1 m) and the topography gently inclines towards the
northwest direction. The geographical test locations and the locations of the three
sandblows in the drainage ditch at the Sampit site are presented in Figure 2.1.
Hu et al. (2002) studied the data from six SCPT and six SPT tests (SAM-01
through 06). Three SCPT tests (SAM-SCPT-1 through 3), two SPTE tests (SAM-SPTE-1

7
and 2), and a DMT test (SAM-DMT) were studied by Hasek (2014). Williamson (2013)
analyzed the data at SAM-SPTE-1, SAM-SCPT-1 and SAM-DMT and performed index
tests on soil samples obtained from SAM-SPTE-1. In addition to the test locations
analyzed by Williamson (2013), this thesis also includes data from SAM-SCPT-2 and
SAM-SCPT-3 of Hasek (2014).
Figure 2.1 Exploration and Test Locations at the Sampit Site (after Hasek, 2014 as shown in Williamson, 2013)

8
Williamson (2013) identified the source sand layer to be from 9 to 22 ft (2.7 to 6.7
m) deep. The source sand layer is overlain by a 9 ft (2.7 m) layer consisting of poorly
graded sand with silt. The groundwater table was located within this layer at a depth of
6.5 ft (1.9 m) below the ground surface. Below the source sand layer, lies a 9 ft (2.7 m)
thick clay layer that overlies a silty sand layer beginning at a depth of 31ft (9.4 m) below
the ground surface.
2.2.2 Gapway Site
The Gapway site is situated about 9 miles northwest of Georgetown and
approximately 1.2 miles north of the Sampit site as shown in Figure 2.2. The ground
elevation ranges from 13 to 16 ft (3.9 to 4.9 m) above mean sea level and the topography
is relatively flat. Figure 2.3 presents a map of the locations of the in situ tests performed
at the Gapway site. All the tests were conducted in the vicinity of four sandblows.
The CPT test (GAP-CPT-1) closest to the DMT (SAM-DMT) and SPT test (GAP-
03) were studied by Williamson (2013). Soil samples obtained from GAP-03 were tested
for grain size distribution by sieve analysis as reported by Hu (2001). In addition to the
data from Williamson (2013), this work examines two CPT test locations (GAP-SCPT-2
and GAP-SCPT-3) of Hasek 2014 and SPT data (GAP-03) of Hu (2001). The site
comprises of a 3 ft (0.9 m) mixed sand layer underlain by a 1 ft (0.3 m) clay layer.
The source sand which extends from a depth of 4 to 7 ft (1.2 to 2.1 m) was
delineated by Hu (2001) and Williamson (2013). The source sand was underlain by an 8
ft (2.4 m) clay layer and coarse sand beginning at a depth of 15 ft (4.6 m). The

9
groundwater table at Gapway was measured at a depth of 4 ft (1.2 m) below the ground
surface (Hasek, 2014).
Figure 2.3 Exploration and Test Locations at the Gapway Site (after Hasek, 2014 as shown in Williamson, 2013)

10
2.2.3 Hollywood Site
The Hollywood site is situated about 0.5 miles northeast of the town of
Hollywood, South Carolina (See Martin, 1990; Williamson, 2013 and Hasek, 2014). The
ground elevations vary from 28 to 35 ft (8.5 to 10.7 m) above mean sea level and the
topography gently inclines from east to west direction. The geotechnical exploration
points and field tests conducted at Hollywood site are presented in Figure 2.3.
The work by Williamson (2013) includes 1 DMT test (HWD-DMT), 1 CPT test
(HWD-CPT-4) and 1 SPT test (HWD-SPTE-1). These tests were conducted in close
proximity to each other and were used in this study as well. Two other CPT tests (HWD-
CPT-5 and -6) studied by Hasek (2014) are also studied in this work.
Figure 2.3 Exploration and Test Locations at the Hollywood Site (after Hasek, 2014 as
shown in Williamson, 2013)

11
The site geology includes a 9 ft (2.7 m) of silty sand layer underlain by the source
sand which extends from 9 to 14 ft (2.7 to 4.3 m) and silty, clayey sand beginning at 14 ft
(4.3 m) below the ground surface. The ground water table depth was estimated at 9 ft (2.7
m) below the ground surface.
2.2.4 Four Hole Swamp Site
The Four Hole Swamp site is situated about 2.6 miles east of Dorchester, South
Carolina near the intersection of State Highways 78 and 178. The site is situated on the
easternmost boundary of Waste Management‟s Oakridge Landfill area (Williamson 2013
and Hasek, 2014). The ground elevation ranges from 57 to 72 ft (17.4 to 21.9 m) above
mean sea level and the topography gently inclines towards northeast. The in situ tests
conducted at different test locations are shown in Figure 2.4.
At this site, three SCPT tests (FHS-SCPT-1 through -3), two SPT tests and a
DMT test (FHS-DMT) have been performed (Hasek, 2014). A piezometer (FHS-PZ) was
used to measure the ground water levels at the site (Hasek, 2014). Williamson (2013)
studied the results from FHS-SPTE-1, FHS-SCPT-1 and FHS-DMT. Soil samples
obtained from FHS-SPTE-1 were used to perform index tests. This study addresses all
the tests analyzed by Williamson (2013) in addition to FHS-SCPT-2 and FHS-SCPT-3.
The source sand was indicated by Williamson (2013) to be approximately 6 ft (1.8
m) deep ranging at a depth of 9 to 15 ft (2.7 to 4.6 m). A 9 ft (2.7 m) thick silty, clayey
sand lies above the source sand and clayey sand lies beneath the source sand starting at a
depth of 15 ft (4.6 m). The ground water table was measured approximately at 9 ft (2.7
m) below the ground surface.
12
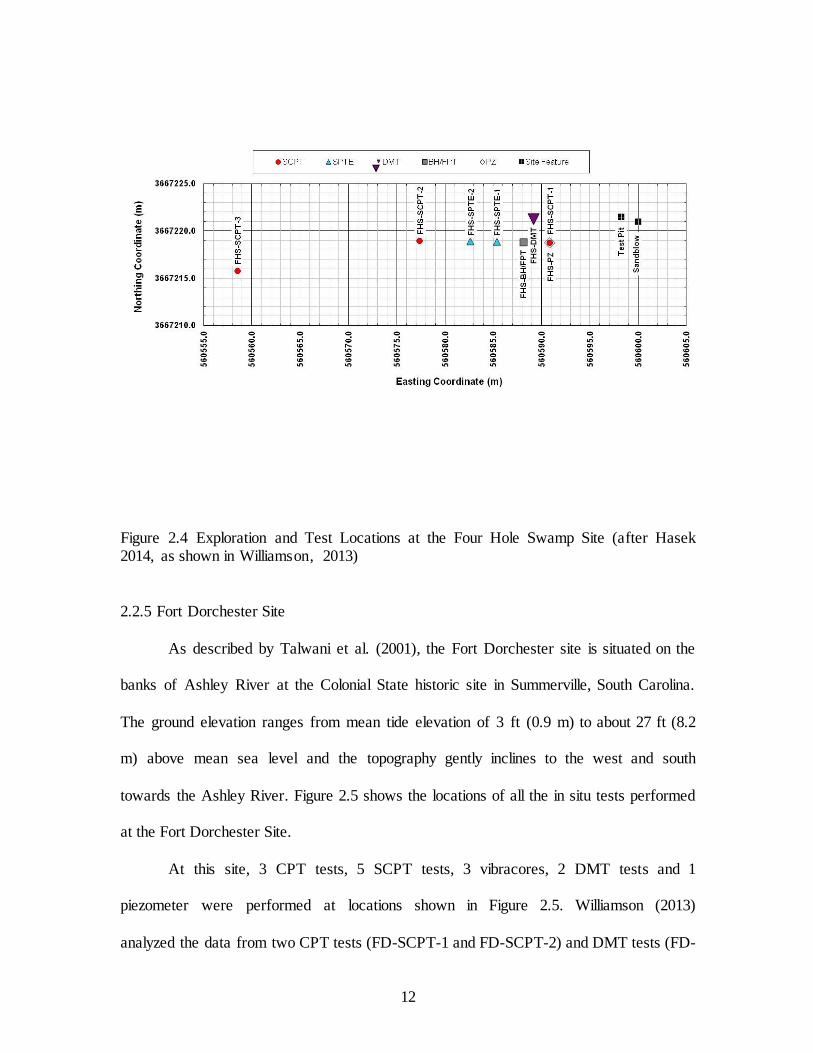
Figure 2.4 Exploration and Test Locations at the Four Hole Swamp Site (after Hasek 2014, as shown in Williamson, 2013)
2.2.5 Fort Dorchester Site
As described by Talwani et al. (2001), the Fort Dorchester site is situated on the
banks of Ashley River at the Colonial State historic site in Summerville, South Carolina.
The ground elevation ranges from mean tide elevation of 3 ft (0.9 m) to about 27 ft (8.2
m) above mean sea level and the topography gently inclines to the west and south
towards the Ashley River. Figure 2.5 shows the locations of all the in situ tests performed
at the Fort Dorchester Site.
At this site, 3 CPT tests, 5 SCPT tests, 3 vibracores, 2 DMT tests and 1
piezometer were performed at locations shown in Figure 2.5. Williamson (2013)
analyzed the data from two CPT tests (FD-SCPT-1 and FD-SCPT-2) and DMT tests (FD-

13
DMT-EW and FD-DMT-NS) where one test was conducted with the dilatometer plate
oriented at east and west direction and the other one oriented north and south direction.
Index testing was performed on samples obtained from vibracore FD-VC-1. This work
further studies the results from test locations previously studied by Williamson (2013).
CPT test locations FD-SCPT-3 and FD-CPT-7a are also examined in this thesis.
Figure 2.5 Exploration and Test Locations at the Fort Dorchester Site (after Talwani et al.
2011)

14
The site consists of a 5 ft (1.5 m) of silty clay layer underlain by 3 ft (0.9 m) of
clayey sand, 8 ft (2.4 m) of source sand, 2 ft (0.6 m) of silty sand and sandy silt starting at
a depth of 18 ft (5.5 m) below the ground surface. As reported by Williamson (2013), the
source sand layer varies from a depth of 8 to 16 ft (2.4 to 4.9 m). Although, it is predicted
that the water table was much closer to the ground surface during paleoseismic events,
the current water table depth was measured at 17 ft (5.2 m) below the ground surface.
2.3 In Situ Test Methods
2.3.1 Dilatometer test
The dilatometer test was first introduced in Italy by Silvano Marchetti (Marchetti
et al., 2001). Today it is used in over 40 countries worldwide. The dilatometer test is
conducted by pushing a flat stainless steel blade into the ground at a rate of 0.02 m/sec
and pushing is stopped at the desired depth of testing. The dilatometer consists of a
circular membrane situated on one side of a flat steel blade which expands horizontally
into the soil using nitrogen gas pressure via pneumatic tubes connected to a control unit.
The control unit includes a pressure regulator, pressure gauge, an audio visual signal and
vent valves.
As described by Marchetti (2001), the test is initiated by inserting the dilatometer
vertically into the ground using field equipment such as drilling rigs. When the desired
depth is reached at intervals of every 1 ft, pushing is halted. At this point the membrane is
flush with the blade and there is no horizontal displacement. The dilatometer is then
allowed to expand and deform. This expansion and deformation continues until the
membrane inflates 0.05 mm into the soil to indicate the lift off pressure reading (p0). The

15
lift off pressure is also defined as the “A pressure”. The pressure on the membrane is
again applied until it reaches a displacement of 1.1 mm. The corresponding pressure at
this point is called the full expansive pressure (p1) and is also referred as the “B
pressure”. After the pressures are recorded, the membrane is allowed to return back to its
original position. An optional reading known as closing pressure (p2) or “C pressure” is
then recorded at zero deformation. Both readings A and B are taken in about 60 seconds.
The entire process is then repeated at the next 1 ft (0.3 m) interval. Correction factors ΔA
and ΔB are applied to the pressure readings from the test to overcome membrane stiffness
(Marchetti et al. 2001). The pressure readings from the DMT ΔA and ΔB along with zero
correction of the pressure gauge (Zm) can be used to obtain values p0 and p1 using the
following equations presented by Marchetti et al. (2001):
p0 = 1.05(A - Zm + ΔA) - 0.05(B - Zm - ΔB) 2.1
p1 = B – Zm – ΔB 2.2
The pressure readings p0 and p1 obtained from DMT can be correlated to various
geotechnical indexes and coefficients. The primary correlations include the material
index (ID), the horizontal stress index (KD), and the dilatometer constrained modulus
(ED). Marchetti‟s (1980) equations for determining these properties are as follows:
ID = (p1 – p0) / (p0 – u0) 2.3
KD = (p1 – p0) / σ v́0 2.4
ED = 34.7 (p1 – p0) 2.5
A soil behavior type chart was introduced by Marchetti et al. (1980) to classify
soils based on the relationship between ID and ED as shown in Figure 2.6. Marchetti
(1980) suggested that ID values reflected the mechanical behavior of soil. In general, ID
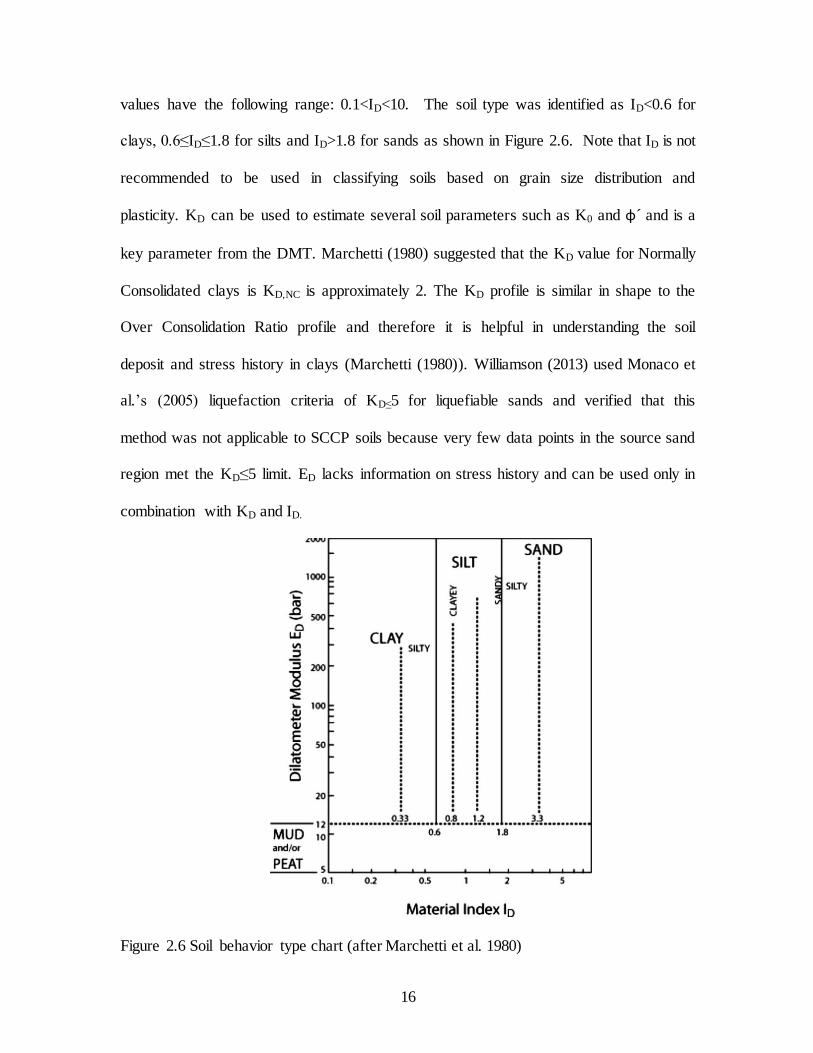
16
values have the following range: 0.1<ID<10. The soil type was identified as ID<0.6 for
clays, 0.6≤ID≤1.8 for silts and ID>1.8 for sands as shown in Figure 2.6. Note that ID is not
recommended to be used in classifying soils based on grain size distribution and
plasticity. KD can be used to estimate several soil parameters such as K0 and ɸ ́and is a
key parameter from the DMT. Marchetti (1980) suggested that the KD value for Normally
Consolidated clays is KD,NC is approximately 2. The KD profile is similar in shape to the
Over Consolidation Ratio profile and therefore it is helpful in understanding the soil
deposit and stress history in clays (Marchetti (1980)). Williamson (2013) used Monaco et
al.‟s (2005) liquefaction criteria of KD≤5 for liquefiable sands and verified that this
method was not applicable to SCCP soils because very few data points in the source sand
region met the KD≤5 limit. ED lacks information on stress history and can be used only in
combination with KD and ID.
Figure 2.6 Soil behavior type chart (after Marchetti et al. 1980)

17
2.3.2 Cone Penetration Test
The cone penetration test involves an electric piezocone penetrometer which is
hydraulically pushed into the soil at a constant rate of 2 cm/sec (ASTM D-5778). Load
cells behind the cone and near the sleeve are used to determine the cone penetration tip
resistance (qc) and sleeve friction (fs). Pore water pressure (u2) is measured behind the
cone with a pressure transducer. The total force acting on the cone (Qc) divided by the
area of the cone (Ac) gives the cone resistance (qc). The total force acting on the friction
sleeve (Fs) divided by the surface area of the sleeve gives the sleeve friction (fs).
The cone tip resistance (qc), sleeve friction (fs) and pore pressure (u2)
measurements from CPT can be used to estimate various index properties and determine
subsurface stratigraphy. To evaluate liquefaction potential, the CPT parameters need to
be normalized to identify soil behavior type (SBT). The index properties included are
stress normalized cone penetration resistance (Q), normalized friction ratio (F),
normalized cone pore pressure ratio (Bq) and soil behavior type index (Ic). Robertson
(2009) recommended the following equations for determining these dimensionless
values:
Q = [(qt – σv0) / Pa)] (Pa / σ v́0) n
2.6
F = [fs / (qt – σ v́0)] * 100 2.7
Ic = [(3.47 – log Q) 2 + (1.22 + log F)
2] 0.5
2.8
Bq = (u2 – u0) / (qt – σv0) 2.9
where Pa is a reference stress of 100 kPa, σv0 is the total overburden stress, σ v́0 is the
effective overburden stress and qt is the field cone penetration resistance at the tip. The
exponent n varies from 0.5 for sand to 1 for clay. The hydrostatic pore pressure u0 is

18
calculated by multiplying the depth below the groundwater table by the unit weight of
water.
Soil behavior type index, Ic, can be found using the following three step iterative
method proposed by Robertson and Wride (1998). Firstly, Q is calculated by assuming
value of n equal to one. The Ic values are then determined. If all the results of Ic are
greater than 2.6, then the soil is considered too clay rich to liquefy and no further
evaluation of these soils is required. However a second iteration is necessary if there are
Ic values less than 2.6 after the first iterative step. The characteristic of such soils are
more granular so an exponent of n=0.5 is applied to the next set of calculations for Q, Ic,
F and Bq. The new Ic values are then examined. For the recalculated Ic values ≤ 2.6 the
soil is considered as nonplastic and granular and these values should be used in the
liquefaction evaluation. For values >2.6 a final iteration is done for soils likely to be silty
and possibly plastic. The resulting Ic values are determined by assigning an intermediate
exponent of n=0.7 to the calculation. Finally, the subsequent Ic values at the end of the
three step iterative process are used in the liquefaction evaluation.
Robertson et al. (1990) suggested a Q-F Soil Behavior type chart to reflect the
mechanical behavior of soil as shown in Figure 2.7. According to the chart, Robertson
(2009) identified that the CPT normalized friction ratio, F was strongly influenced by soil
sensitivity whereas Q was strongly influenced by OCR for clay like soils. In Figure 2.7,
potential liquefiable zones fall within Zone 5, 6 and 7 which consists of sand mixtures
with little fines. Robertson and Wride‟s (1998) liquefaction criteria F<1.0% and
(qc1N)cs<160 indicated that soil is susceptible to liquefaction. Note that (qc1N)cs is clean
sand equivalent normalized CPT tip resistance for soils. Ic can be used to define the

19
boundaries in the CPT SBT chart between different soils types: Clays (Ic>2.95), Silts
(2.05≤Ic≤2.95) and Sands (Ic<2.05).
Robertson and Wride‟s (1998) liquefaction criteria Ic>2.6 and Bq>0.5 are used to
indicate whether a soil is too clay rich to liquefy. Youd et al. (2001) recommended that
soils with Ic of 2.4 to 2.6 needed to be tested to evaluate their liquefaction susceptibility
because the cutoff of Ic>2.6 was overly conservative for some soils. Based on Robertson
and Wride (1998)‟s and Youd et al. (2001)‟s findings, Hayati and Andrus (2008a)
proposed a liquefaction susceptibility chart as shown in Figure 2.8. This chart indicated
that soils with Ic<2.4 and Bq<0.4 are considered to fall in the susceptible zone while soils
with Ic>2.6 and Bq>0.5 fell into the non-susceptible zone. Soils were considered to be
moderately susceptible in between these limits and additional testing is required to
determine susceptibility to liquefaction. The correlation in the chart Ic>5.7-2.3Bq can be
used to identify sensitive fine grained soils.
Kulwawy and Mayne (1990) suggested a formula for estimating relative density:
Dr2 = qc1 / 305Qc.QOCR.QA 2.10
where
qc1 = Dimensionless normalized cone resistance
= (qc/pa) / (σ‟v0/pa)
Qc = Compressibility factor
0.91 < Qc < 1.09
QOCR = Overconsolidation factor
= OCR0.18
For normally consolidated sands OCR=1.

20
QA = Ageing factor
= 1.2 + 0.05 log (t/100)
Zone Soil Behavior Type Zone Soil Behavior Type
1. Sensitive, fine grained; 6. Sands: clean sands to silty sands 2. Organic soils, peats 7. Gravelly sand to sand; 3. Clays: clay to silty clay; 8. Very stiff sand to clayey sand; 4. Silt mixtures: clayey silt to silty clay; 9. Very stiff fine grained
5. Sand mixtures: silty sand to sandy silt;
Figure 2.7 Normalized Soil Behavior Chart for CPT (after Robertson, 1990)

21
Figure 2.8 Liquefaction Susceptibility Chart (after Hayati and Andrus, 2008)
2.3.3 Standard Penetration Test
The Standard Penetration Test involves a 140 lb hammer repeatedly falling
through a distance of 760 mm (30 in.) on an anvil connected to drill rods and a split
spoon sampler (ASTM D1586). The split spoon sampler is driven 6 in. (150 mm) into the
ground and the number of blows required for the sampler to penetrate each 6 in. (150
mm) up to a depth of 18 in. (457 mm) is recorded. As the drill rods are pulled out of the
borehole and the sampler is lowered into the borehole, soil falls into the borehole. This
disturbs the soil and hence the blow count in the upper 6 in. (150 mm) is discounted. The
number of blows for the second and third 6 in. (150 mm) intervals is added together and
is termed as the “Standard Penetration Resistance” or the N value for that particular range
of depth. The N value can be used to estimate the relative density of the subsurface soil

22
and provides empirical geotechnical correlations to determine approximate shear strength
properties of soils.
The SPT blow count N used for geotechnical explorations is affected by various
factors such as overburden pressure, hammer type, blow rate, drill length, type of anvil,
use of liners or bore hole liquid. N is first corrected for energy loss by normalizing N to a
standard energy of 60%. Youd et al. (2001) recommended the following equation to
account for N60:
N60 = N CECBCRCS 2.11
where N is the measured standard penetration resistance; CE is correction for hammer
energy efficiency; CB is a correction factor for bore hole diameter; CR is a correction
factor for rod length; and CS is a correction for samplers with or without liners.
N60 is further corrected with a factor CN to account for increasing overburden
pressure. Kayen et al. (1992) recommended the following equation to determine the
correction factor:
CN = 2.2 / (1.2 + σ v́0/Pa) 2.12
where Pa is atmospheric pressure equal to 100kPa. Youd et al. (2001) provided the
following equation to determine the overburden stress-corrected blow count (N1)60:
(N1)60 = N60 CN 2.13
A correction to (N1)60 was applied to account for the behavior of soil with high
fines content to that of clean sand. This is termed (N1)60cs:
(N1)60cs = α + β (N1)60 2.14
where α and β are coefficients determined by the following relationships:
α = 0 for FC ≤ 5% 2.15

23
α = exp[1.76 – (190/FC2)] for 5% < FC < 35% 2.16
α = 5.0 for FC ≥ 35% 2.17
β = 1.0 for FC ≤ 5% 2.18
β = 0.99 + (FC1.5
/1000) for 5% < FC < 35% 2.19
β = 1.2 for FC ≥ 35% 2.20
and FC is the fines content
Youd et al. (2001) recommended that soil is too dense to liquefy when (N1)60cs ≥
30.
2.3.5 Correlations
2.3.5.1 CPT-DMT Correlations
A review of the literature revealed a series of DMT-CPT correlations for sand-like
and clay-like soils. Sand-like soils were determined based on IC≤2.6 and ID>1 while clay-
like soils were determined based on IC>2.6 and ID<1 (Marchetti (1980), Robertson and
Wride (1998) and Robertson (2009)).
Robertson et al. (1988) provided evidence that horizontal stress index KD
increased slightly with an increase in soil sensitivity due to development of high pore
pressures around the DMT probe during penetration. Based on this evidence, Robertson
(2009) proposed a relationship for fine grained clay like soils between horizontal stress
index, KD and normalized cone penetration resistance, Q, by combining OCR, KD and Q
relations given by Marchetti (1980) and Kulhawy and Mayne (1990)
KD = 0.88 (Q) 0.64
2.21

24
Similarly, Robertson et al (2009) also developed a relation for fine grained soils
between KD and Q by combining OCR, KD and Q relations given by Marchetti (1980)
and Wroth (1984) and Ladd (1991):
KD = 0.8 (Q) 0.80
2.22
Schneider (2008) recommended a series of relations between (u2 / σ v́0) and Q for
insensitive clays as shown below. These relationships were based on the assumption that
DMT lift off pressure (p0) was equal to the CPT measured pore pressure (u2) around the
DMT probe.
u2 / σ v́0 = β (Q) 0.95
+ 1.05 2.23
where KD = u2 / σ v́0 2.24
KD = β (Q) 0.95
+ 1.05 2.25
where, on average, β = 0.3.
Schneider (2008) also presented the following correlation between (u2 / σ v́0) and
Q for excess CPT pore water pressures in sensitive clays as shown below.
KD = 0.67 (Q) 0.91
+ 1.1 2.26
Mayne and Liao (2004) suggested two relationships for piedmont residual soils
(silty sands to sandy silts) between DMT modulus ED and corrected resistance measured
at the tip qt, and ED and net cone resistance, qnet, respectively:
ED = 5 qt 2.27
ED = 5 (qt – σv0) 2.28
where qnet = (qt – σv0) and qt>> σv0.
Robertson (2009) presented the normalized form and a general form according to
the above equations is shown as follows:

25
ED / σ´v0 = 5 Q 2.29
ED / σ´v0 = α Q 2.30
where, α is a factor similar to the variation of CPT modulus factor, αE, and varies with
relative density, age and stress history. Robertson (2009) predicted that α=5 was a
reasonable average for a wide range of soils from coarse grained soils to fine grained
soils where 5<Q<200.
Tsai et al. (2009) provided correlations using DMT and CPT test data in Holocene
soils which are presented below:
The following CPT-DMT correlations for the source sand zones in the five
geotechnical sites previously studied by Williamson (2013) are shown below:
2.3.5.2 DMT-SPT Correlation
Several correlations between DMT and SPT are presented in the literature.
Tanaka and Tanaka (1998) proposed the following correlation between standard
measured blow count N and horizontal stress index ED for sands:
N = ED (MPa) / 2.5 2.35
The following relationships between N60 and ED based on ID values were provided
by Hajduk (2006) for three different soil behavior types.
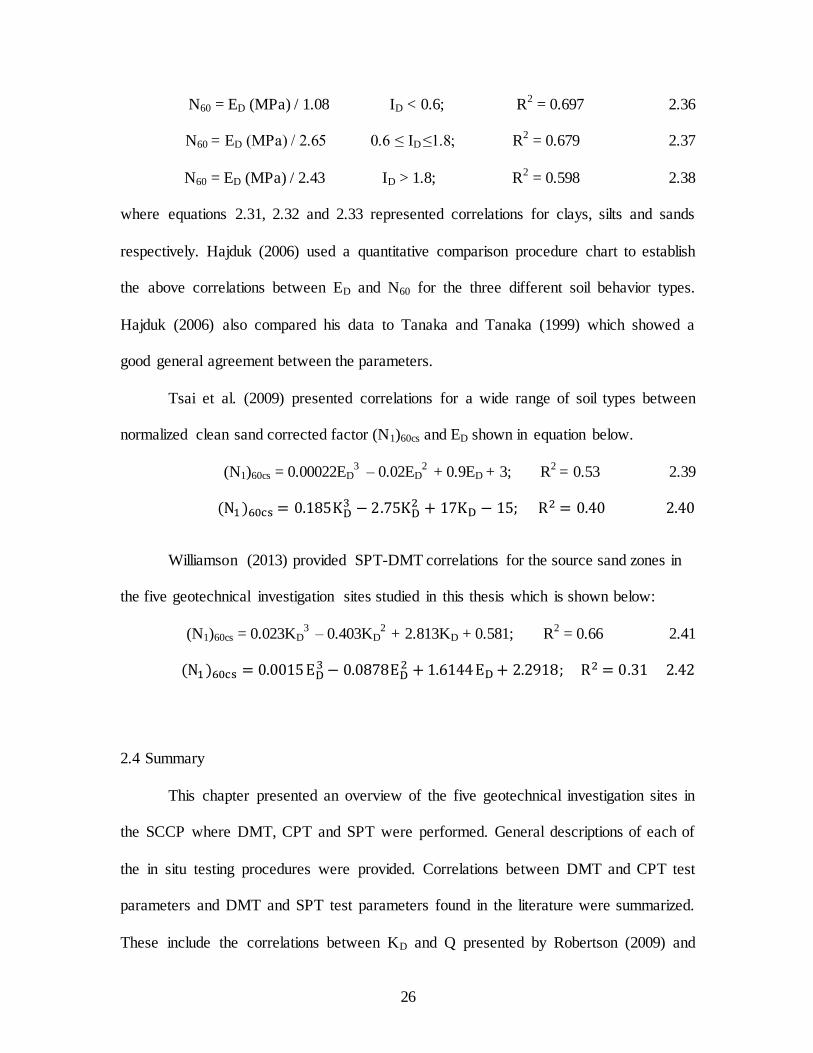
26
N60 = ED (MPa) / 1.08 ID < 0.6; R2 = 0.697 2.36
N60 = ED (MPa) / 2.65 0.6 ≤ ID ≤1.8; R2 = 0.679 2.37
N60 = ED (MPa) / 2.43 ID > 1.8; R2 = 0.598 2.38
where equations 2.31, 2.32 and 2.33 represented correlations for clays, silts and sands
respectively. Hajduk (2006) used a quantitative comparison procedure chart to establish
the above correlations between ED and N60 for the three different soil behavior types.
Hajduk (2006) also compared his data to Tanaka and Tanaka (1999) which showed a
good general agreement between the parameters.
Tsai et al. (2009) presented correlations for a wide range of soil types between
normalized clean sand corrected factor (N1)60cs and ED shown in equation below.
(N1)60cs = 0.00022ED3 – 0.02ED
2 + 0.9ED + 3; R
2 = 0.53 2.39
Williamson (2013) provided SPT-DMT correlations for the source sand zones in
the five geotechnical investigation sites studied in this thesis which is shown below:
(N1)60cs = 0.023KD3 – 0.403KD
2 + 2.813KD + 0.581; R
2 = 0.66 2.41
2.4 Summary
This chapter presented an overview of the five geotechnical investigation sites in
the SCCP where DMT, CPT and SPT were performed. General descriptions of each of
the in situ testing procedures were provided. Correlations between DMT and CPT test
parameters and DMT and SPT test parameters found in the literature were summarized.
These include the correlations between KD and Q presented by Robertson (2009) and

27
Schneider (2008) for fine- grained soils, the correlations between ED and Q by Mayne
and Liao (2004) for a wide range of soils, and the correlations between ED and N60 by
Hajduk (2006) for silts, clays and sands. The SCCP data will be compared to these
correlations in Chapter 4 and used to develop, new site specific correlations. The methods
used to determine the Soil Behavior type from DMT data (Marchetti, 1980) and CPT data
(Robertson, 1990) were summarized and will be used to find the soil behavior types for
the soils at the sites in the SCCP (See Chapter 3). The method to assess liquefaction
susceptibility from CPT test data developed by Hayati and Andrus (2008) was also
summarized and will be used in Chapter 5 to evaluate the liquefaction susceptibility of
the soils at each of the five sites studied in this thesis.

28
CHAPTER 3
SOIL BEHAVIOR TYPE
3.1 Introduction
This chapter presents the methodologies used for CPT and DMT analysis to
characterize the soil behavior type of soils of five geotechnical investigation sites. The
CPT and DMT data were used to develop a soil stratigraphy for each site. A comparison
between the methodologies is presented to identify the differences in classifying soils for
a particular site. The source sand layer delineated by Williamson (2013) was further
analyzed to check the consistency of potential liquefiable zones at each of the test
locations presented in this study.
3.2 Soil Behavior Type from CPT
The test locations at each site used for CPT analysis are listed in Table 3.1. CPT
parameters qt and fs were plotted with depth for all test locations at each site. The
corresponding pore pressure measurements are also shown with depth in separate figures.
Soil layers at each site were delineated by Williamson (2013) using the SCPT test
location in close proximity to the DMT and SPTE samples for index testing. The soil
behavior classification chart by Robertson (1990) was used to determine the soil behavior
type of soils found in each layer of the soil profile at each site. Closed symbols were used
to represent Q and F values calculated for the CPT test location closest to the DMT at

29
depths where DMT data were obtained while open symbols denote Q and F values for all
the CPT test locations (see Table 3.1) calculated at each depth.
Table 3.1 Summary of Test Locations used in CPT Analysis
Site Test Locations
Sampit SAM-SCPT-1 SAM-SCPT-2 SAM-SCPT-3
Gapway GAP-SCPT-1 GAP-SCPT-2 GAP-SCPT-2
Hollywood HWD-CPT-4 HWD-CPT-5 HWD-CPT-6
Four Hole Swamp FHS-SCPT-1 FHS-SCPT-2 FHS-SCPT-3
Fort Dorchester FD-SCPT-1 FD-SCPT-2 FD-SCPT-3 FD-CPT-7a
3.2.1 Sampit
SAM-SCPT-1 was used to delineate the soil layers at Sampit. As shown in Figure
3.1, there are four distinctive layers in the Sampit soil profile labelled as A, B, C and D.
Layer A extends from the ground surface down to a depth of approximately 9 ft (2.7 m).
The ground water table is assumed to be approximately at 6.5 ft (1.9 m) below the ground
surface for all test locations. The CPT measured pore pressure shown in Figure 3.2 does
not rise above the hydrostatic pore pressure indicating Layer A soil mostly varies from
clean sand to silty sand (Zone 6) as suggested by the CPT based soil identification chart
(Robertson, 1990) shown in Figure 3.3. However, the soil in this layer that is above the
ground water table falls within Zone 7 suggesting a soil behavior type that varies from
gravelly sand to sand.
Layer B is the soil layer below 9 ft (2.7 m) which extends down to a depth of 22 ft
(6.7 m). This soil layer was delineated as the source sand layer by Williamson (2013).

30
From Figure 3.3, it is seen that most of the data plots within Zone 6, the region of clean
sand to silty sand. However, there is a slight variation in soil behavior for test location
SAM-SCPT-3. In the upper part of the layer, the soil behavior type indicates a small
fraction of fines due to low tip resistances and the data plots within Zone 3 through 5.
However, most of the data which are from the lower part of the layer plots in Zone 6
which is similar to that of SAM-SCPT-1 and SAM-SCPT-2. This layer showing high tip
resistance and low pore pressures indicate that the soil behaves as silty sands to sands.
Note that for all the three test locations, (qc1N)cs<160 which indicates that the soil layer is
susceptible to liquefaction as per Robertson and Wride (1998).
Figure 3.1 Soil Stratigraphy from CPT Data (qt and fs) at the Sampit Site.
0 0.2 0.4
0
2
4
6
8
10
12
0 5 10152025
fs (MPa)
Depth
(m
)
qt (MPa)
SAM-SCPT-3
qt fs
0 0.2 0.4
0 5 10152025
fs (MPa)
qt (MPa)
SAM-SCPT-1
qt fs
0 0.2 0.4
0 5 10152025
fs (MPa)
qt (MPa)
SAM-SCPT-2
qt fsqt fs qt qt fs fs
C
A
B
D

31
Layer C extends from 22 to 31 ft (6.7 to 9.4 m) deep. As shown in Figure 3.3,
most of the data plots within Zone 4 to 6 and hence the soil varies from clay to silty sand.
The soil behavior in SAM-SCPT-1 shows nearly zero penetration resistance and CPT
measured pore pressures are greater than the hydrostatic pore pressure (see Figure 3.2).
Therefore, it can be inferred from SAM-SCPT-1 that it has considerable amount of fines.
SAM-SCPT-2 and SAM-SCPT-3 show a mixture of sands, silts and clays due to the
variation in tip resistance and sleeve friction.
Figure 3.2 CPT Measured and Hydrostatic Pore Pressure at the Sampit Site.
0
2
4
6
8
10
12
-0.3 0 0.3 0.6 0.9
u0, u2 (MPa)
SAM-SCPT-3
u0 u2
-0.3 0 0.3 0.6 0.9
u0, u2 (MPa)
SAM-SCPT-1
u0 u2
-0.3 0 0.3 0.6 0.9
u0, u2 (MPa)
SAM-SCPT-2
u0 u2u0 u0 u2 u0 u2 u2
A
D
C
B

32
Layer D is located between depths of 31 and 35 ft (9.4 to 10.7 m). The CPT
measured pore pressures do not rise above the hydrostatic pressure. The soil
identification chart in Figure 3.3 indicates that this layer ranges from silty sand to clean
sands (Zone 5 and 6).
Zone Soil Behavior Type Zone Soil Behavior Type
1. Sensitive, fine grained; 6. Sands: clean sands to silty sands 2. Organic soils, peats 7. Gravelly sand to sand; 3. Clays: clay to silty clay; 8. Very stiff sand to clayey sand;
4. Silt mixtures: clayey silt to silty clay; 9. Very stiff fine grained 5. Sand mixtures: silty sand to sandy silt;
Figure 3.3 Soil behavior type classification chart after Robertson (1990) with data from the Sampit site

33
3.2.2 Gapway
Using GAP-SCPT-1 a five layer stratigraphy was delineated and labelled as A, B,
C, D and E. Layer A begins at the ground surface down to an average depth of 3 ft (0.9
m). From the CPT based soil identification chart, Layer A falls within Zone 5 to 7 and is
generally found to vary from silty sand to sand. Some of the data also plots in the stiff
sand region (Zone 8) as shown in Figure 3.6. This layer lies above the groundwater water
table and no pore pressures were detected in this region, as shown in Figure 3.5.
Figure 3.4 Soil Stratigraphy from CPT Data (qt and fs) at the Gapway Site.
0 0.5
0
2
4
6
8
10
12
0 5 10152025
fs (MPa)
Depth
(m
)
qt (MPa)
GAP-SCPT-1
qt fs
0 0.2 0.4
0 5 10152025
fs (MPa)
qt (MPa)
GAP-SCPT-2
qt fs
0 0.2 0.4
0 5 10152025
fs (MPa)
qt (MPa)
GAP-SCPT-3
qt fsfs qt fs qt fs qt
D
C
A
B
E

34
The underlying 1 ft (0.3 m) layer was noted by Williamson (2013) as a small clay
cap layer due to the low tip resistance and pore pressures detected at the site. However,
the soil behavior from Figure 3.6 indicates that it has presence of silts and sands. The
layer falls within Zone 5 and 6 which suggests that the soil has very small amount of
fines. From Figure 3.4, it is clear that GAP-SCPT-3 and GAP-SCPT-2 show a large tip
resistance when compared to GAP-SCPT-1 thereby indicating that soils are denser in
GAP-SCPT-2 and -3.
Figure 3.5 CPT Measured and Hydrostatic Pore Pressure at the Gapway Site.
0
2
4
6
8
10
12
-0.3 0 0.30.60.9
Depth
(m
)
u0, u2 (MPa)
GAP-SCPT-1
u0 u2
-0.3 0 0.30.60.9
u0, u2 (MPa)
GAP-SCPT-2
u0 u2
-0.3 0 0.30.60.9
u0, u2 (MPa)
GAP-SCPT-3
u0 u2u0 u0 u2 u2 u2 u0
C
B
E
D
A

35
Layer C is located between depths of 4 and 7 ft (1.2 and 2.1 m) and is defined as
the source sand layer by Williamson (2013). It is evident from Figure 3.6, that most of
the data plots within the region of clean sand to silty sand (Zone 6) because this layer has
large tip resistance and negligible pore pressures. The water table is found to be at a
depth of 4.5 ft (1.4 m) (see Figure 3.4 and 3.5). Note that (qc1N)cs is less than 160 for all
the three test locations and hence this layer is considered to be liquefiable.
Zone Soil Behavior Type Zone Soil Behavior Type
1. Sensitive, fine grained; 6. Sands: clean sands to silty sands 2. Organic soils, peats 7. Gravelly sand to sand; 3. Clays: clay to silty clay; 8. Very stiff sand to clayey sand;
4. Silt mixtures: clayey silt to silty clay; 9. Very stiff fine grained 5. Sand mixtures: silty sand to sandy silt;
Figure 3.6 Soil behavior type classification chart after Robertson (1990) with data from
the Gapway site
36
Layer D extends from a depth of 7 ft (2.1 m) to a depth of approximately 15 ft
(4.6 m) deep. Figure 3.6 indicates that soil consists of a mixture of clays, silts and sands
as most of the data points fall into Zone 4, 5 and 6. This layer has almost negligible tip
resistance and sleeve friction (See Figure 3.4). The CPT measured pore pressure is above
the hydrostatic pressure as seen in Figure 3.5 and indicates significant amount of fines in
this soil layer.
The next 3 ft (0.9 m) labelled as Layer E primarily consists of sands and a small
fraction of silts. The soil identification chart in Figure 3.6 indicates that the data falls
primarily in Zone 6 and 7 and a small fraction in Zone 4. Based on the CPT analysis,
large tip stress and sleeve friction and significant pore pressures were detected in this
layer.
3.2.3 Hollywood
HWD-CPT-4 was used to delineate the soil layers in Hollywood. The top three
layers in the soil profile are labelled as A, B and C. The top 9 ft (2.7 m) identified as
Layer A lies above the ground water table as presented in Figure 3.7 and has very high tip
resistance and sleeve friction. In Figure 3.8, the CPT measured pore pressure slightly
rises above the hydrostatic pressure for HWD-CPT-4 but it reflects nearly zero pore
pressure measurements for the other two test locations. Layer A is characterized as a sand
layer because most of the data falls into Zone 6 and 7 as shown in Figure 3.9. The
groundwater table is assumed to be at approximately 9 ft (2.7 m) below the ground
surface for all the three test locations.

37
The source sand explained by Williamson (2013) extends from 9 to 14 ft (2.7 to
4.2 m) deep and is identified as Layer B. From the CPT analysis, it is observed that this
layer has high tip resistance but no significant pore pressures (see Figure 3.7 and 3.8). As
presented in Figure 3.9, the data plots in Zone 6 indicating that the source sand consists
of clean sand to silty sand. For all the three test locations, average (qc1N)cs<160 and thus
the soil layer is susceptible to liquefaction.
Figure 3.7 Soil Stratigraphy from CPT Data (qt and fs) at the Hollywood Site.
0 0.2 0.4
0
2
4
6
8
10
12
0 5 10152025
fs (MPa)
Depth
(m
)
qt (MPa)
HWD-CPT-5
qt fs
0 0.2 0.4
0 5 10152025
fs (MPa)
qt (MPa)
HWD-CPT-4
qt fs
0 0.2 0.4
0 5 10152025
fs (MPa)
qt (MPa)
HWD-CPT-6
qt fsqt fs qt fs qt fs
B
A
C

38
The underlying 3 ft (0.9 m) layer is labelled as Layer C and consists of a mixture
of clayey silt to sandy silt based on Figure 3.9 that shows most of the data plotting into
Zone 4 and 5. The tip resistance and sleeve friction profiles shown in Figure 3.7 are
similar for all the three test locations. Excess pore water pressures are observed at HWD-
CPT-4 and -5 but no excess pore pressures develop in HWD-CPT-4 site as seen in Figure
3.8 indicating that the soil layers in HWD-CPT-4 and -5 have higher percentage of fines
content.
Figure 3.8 CPT Measured and Hydrostatic Pore Pressure at Hollywood Site
0
2
4
6
8
10
12
-0.30 0.30.60.9
Depth
(m
)
u0, u2 (MPa)
HWD-CPT-5
u0 u2
-0.3 0 0.30.60.9
u0, u2 (MPa)
HWD-CPT-4
u0 u2
-0.3 0 0.30.60.9
u0, u2 (MPa)
HWD-CPT-6
u0 u2u2 u0 u2 u0 u0 u2
B
A
C

39
Zone Soil Behavior Type Zone Soil Behavior Type
1. Sensitive, fine grained; 6. Sands: clean sands to silty sands 2. Organic soils, peats 7. Gravelly sand to sand; 3. Clays: clay to silty clay; 8. Very stiff sand to clayey sand; 4. Silt mixtures: clayey silt to silty clay; 9. Very stiff fine grained
5. Sand mixtures: silty sand to sandy silt;
Figure 3.9 Soil behavior type classification chart after Robertson (1990) with data from
the Hollywood site
40
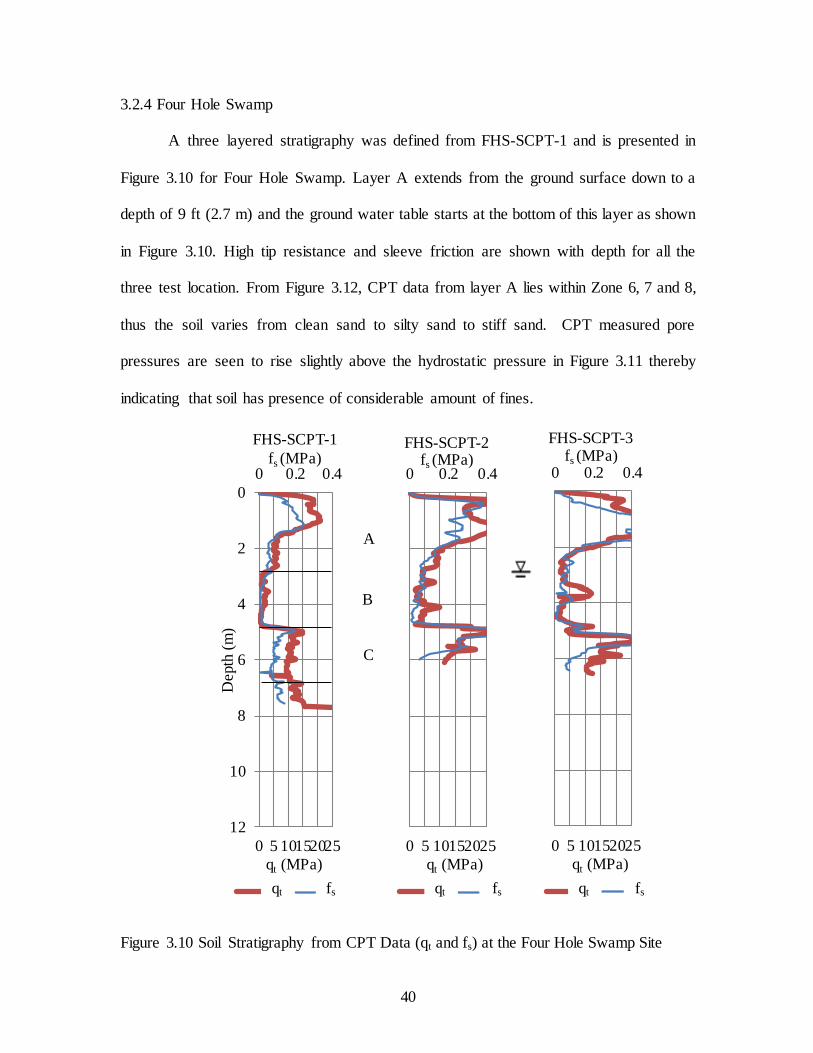
3.2.4 Four Hole Swamp
A three layered stratigraphy was defined from FHS-SCPT-1 and is presented in
Figure 3.10 for Four Hole Swamp. Layer A extends from the ground surface down to a
depth of 9 ft (2.7 m) and the ground water table starts at the bottom of this layer as shown
in Figure 3.10. High tip resistance and sleeve friction are shown with depth for all the
three test location. From Figure 3.12, CPT data from layer A lies within Zone 6, 7 and 8,
thus the soil varies from clean sand to silty sand to stiff sand. CPT measured pore
pressures are seen to rise slightly above the hydrostatic pressure in Figure 3.11 thereby
indicating that soil has presence of considerable amount of fines.
Figure 3.10 Soil Stratigraphy from CPT Data (qt and fs) at the Four Hole Swamp Site
0 0.2 0.4
0
2
4
6
8
10
12
0 5 10152025
fs (MPa)
Depth
(m
)
qt (MPa)
FHS-SCPT-1
qt fs
0 0.2 0.4
0 5 10152025
fs (MPa)
qt (MPa)
FHS-SCPT-2
qt fs
0 0.2 0.4
0 5 10152025
fs (MPa)
qt (MPa)
FHS-SCPT-3
qt fsqt qt fs qt fs fs
B
A
C

41
The underlying source sand layer extends from 9 to 15 ft (2.7 to 4.6 m). As
presented in Figure 3.12, it is observed that soil behavior varies from silty clay to silty
sands as the data plots within Zone 4 through 6. As shown in Figure 3.10 and 3.11, FHS-
SCPT-1 has low tip resistance and slight fluctuation in CPT measured pore pressures.
However, FHS-SCPT-2 and FHS-SCPT-3 show higher tip resistance and no excess pore
water pressures. Data from FHS-SCPT-1 fall within Zone 4 through 6 indicating that soil
has presence of clays and silts while FHS-SCPT-2 and FHS-SCPT-3 fall into Zone 5 and
6 consisting mostly of sand mixtures (see Figure 3.12). This soil layer is considered to be
liquefiable since (qc1N)cs is less than 160 for all the three test locations.
Figure 3.11 CPT Measured and Hydrostatic Pore Pressure at the Four Hole Swamp Site.
0
2
4
6
8
10
12
-0.3 0 0.30.60.9
Depth
(m
)
u0, u2 (MPa)
FHS-SCPT-1
u0 u2
-0.3 0 0.3 0.6 0.9
u0, u2 (MPa)
FHS-SCPT-2
u0 u2
-0.3 0 0.3 0.6 0.9
u0, u2 (MPa)
FHS-SCPT-3
u0 u2u0 u0 u2 u0 u2 u2
B
A
C

42
Layer C lies between depths of 15 and 22 ft (4.6 to 6.7 m). This layer shown has
high tip resistance and sleeve friction. There is an abrupt increase in CPT measured pore
pressure (see Figure 3.11) at a depth of 4.6 m which indicates soil beneath this depth has
sufficient amount of fines. The CPT based soil identification chart as presented in Figure
3.12 implies that most of the data plots in Zones 5 and 6. Hence, Layer C consists of
mixture of sands and silts.
Zone Soil Behavior Type Zone Soil Behavior Type
1. Sensitive, fine grained; 6. Sands: clean sands to silty sands 2. Organic soils, peats 7. Gravelly sand to sand;
3. Clays: clay to silty clay; 8. Very stiff sand to clayey sand; 4. Silt mixtures: clayey silt to silty clay; 9. Very stiff fine grained 5. Sand mixtures: silty sand to sandy silt;
Figure 3.12 Soil behavior type classification chart after Robertson (1990) with data from the Four Hole Swamp site.
43
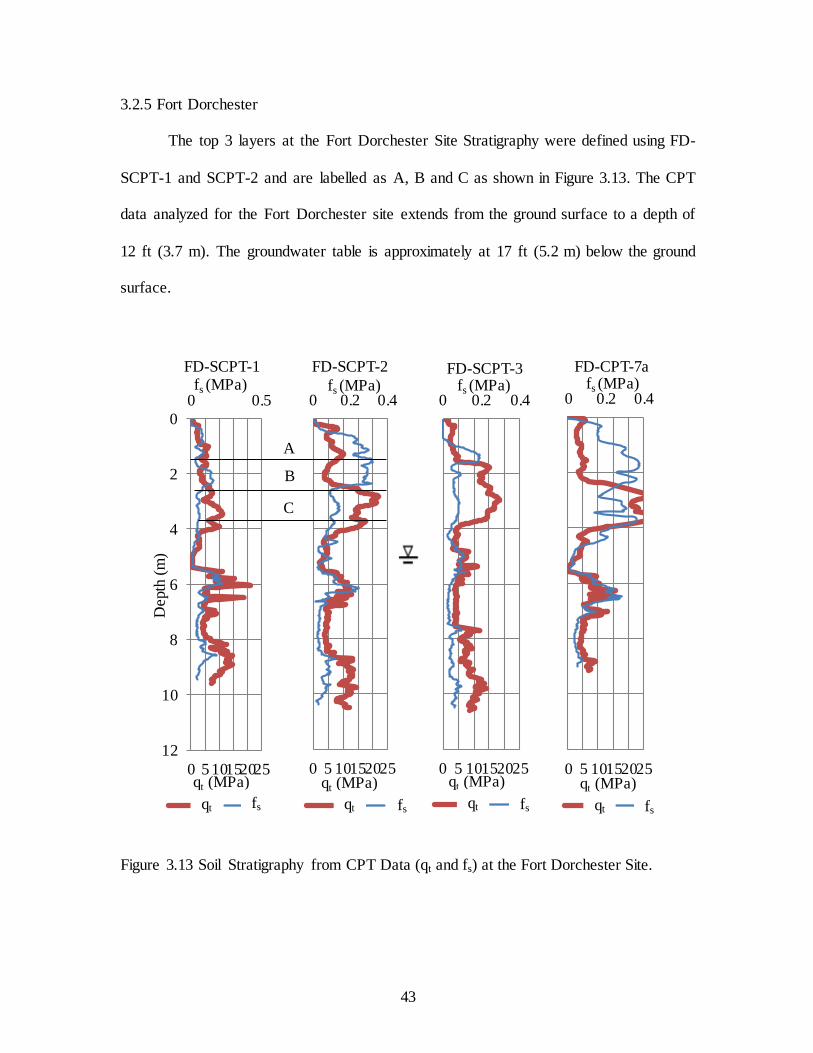
3.2.5 Fort Dorchester
The top 3 layers at the Fort Dorchester Site Stratigraphy were defined using FD-
SCPT-1 and SCPT-2 and are labelled as A, B and C as shown in Figure 3.13. The CPT
data analyzed for the Fort Dorchester site extends from the ground surface to a depth of
12 ft (3.7 m). The groundwater table is approximately at 17 ft (5.2 m) below the ground
surface.
Figure 3.13 Soil Stratigraphy from CPT Data (qt and fs) at the Fort Dorchester Site.
0 0.5
0
2
4
6
8
10
12
0 5 10152025
fs (MPa)
Depth
(m
)
qt (MPa)
FD-SCPT-1
qt fs
0 0.2 0.4
0 5 10152025
fs (MPa)
qt (MPa)
FD-SCPT-2
qt fs
0 0.2 0.4
0 5 10152025
fs (MPa)
qt (MPa)
FD-SCPT-3
qt fs
0 0.2 0.4
0 5 10152025
fs (MPa)
qt (MPa)
FD-CPT-7a
qt fsqt qt qt qt fs fs fs fs
B
A
C
44
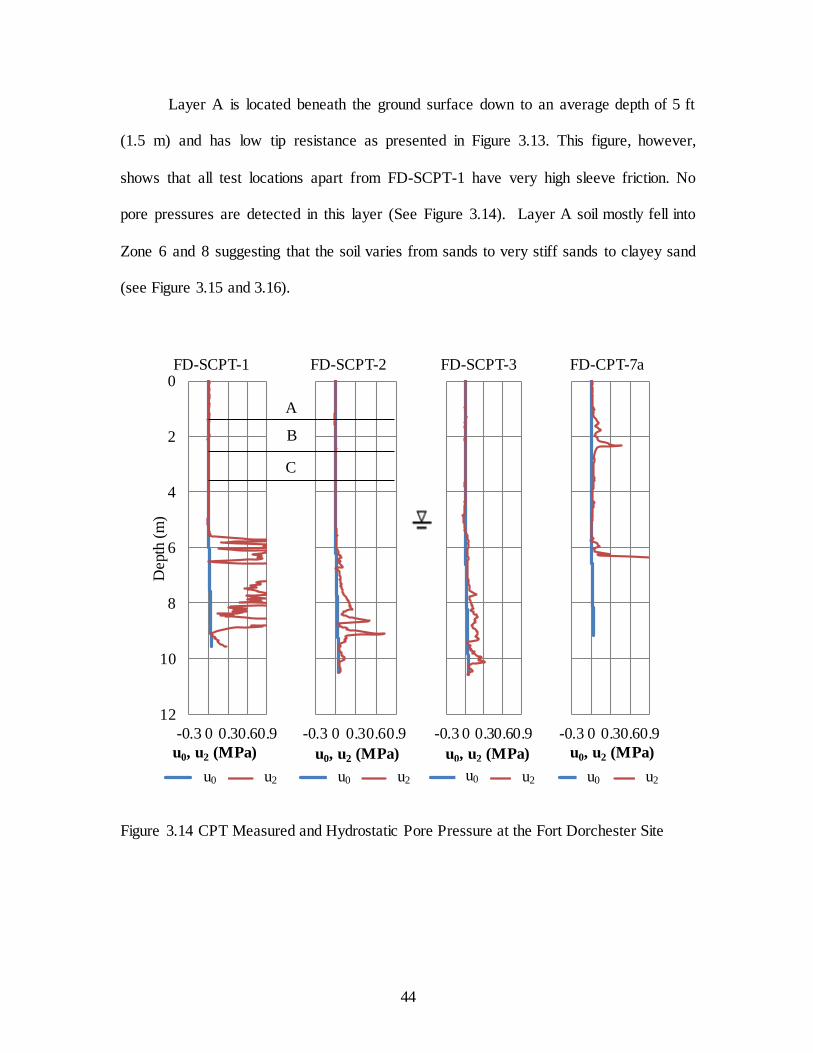
Layer A is located beneath the ground surface down to an average depth of 5 ft
(1.5 m) and has low tip resistance as presented in Figure 3.13. This figure, however,
shows that all test locations apart from FD-SCPT-1 have very high sleeve friction. No
pore pressures are detected in this layer (See Figure 3.14). Layer A soil mostly fell into
Zone 6 and 8 suggesting that the soil varies from sands to very stiff sands to clayey sand
(see Figure 3.15 and 3.16).
Figure 3.14 CPT Measured and Hydrostatic Pore Pressure at the Fort Dorchester Site
0
2
4
6
8
10
12
-0.3 0 0.30.60.9
Depth
(m
)
u0, u2 (MPa)
FD-SCPT-1
u0 u2
-0.3 0 0.30.60.9
u0, u2 (MPa)
FD-SCPT-2
u0 u2
-0.3 0 0.30.60.9
u0, u2 (MPa)
FD-SCPT-3
u0 u2
-0.3 0 0.30.60.9
u0, u2 (MPa)
FD-CPT-7a
u0 u2u0 u0 u0 u0 u2 u2 u2 u2
B
A
C
45
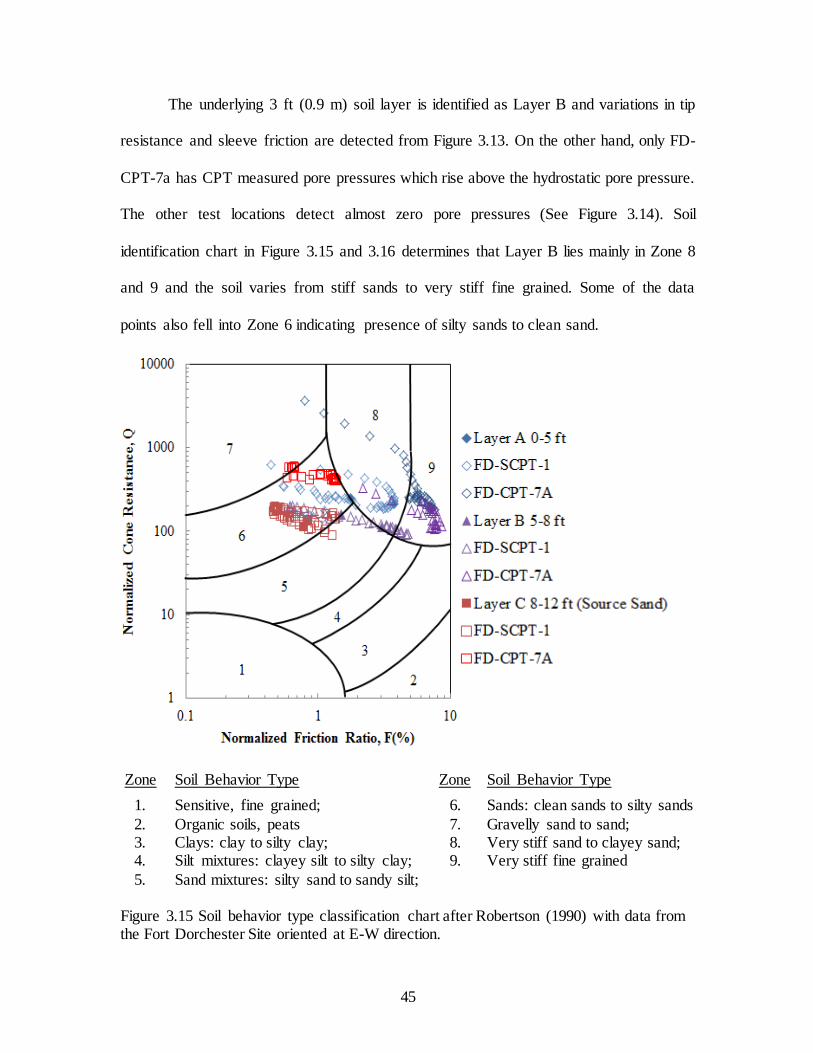
The underlying 3 ft (0.9 m) soil layer is identified as Layer B and variations in tip
resistance and sleeve friction are detected from Figure 3.13. On the other hand, only FD-
CPT-7a has CPT measured pore pressures which rise above the hydrostatic pore pressure.
The other test locations detect almost zero pore pressures (See Figure 3.14). Soil
identification chart in Figure 3.15 and 3.16 determines that Layer B lies mainly in Zone 8
and 9 and the soil varies from stiff sands to very stiff fine grained. Some of the data
points also fell into Zone 6 indicating presence of silty sands to clean sand.
Zone Soil Behavior Type Zone Soil Behavior Type
1. Sensitive, fine grained; 6. Sands: clean sands to silty sands
2. Organic soils, peats 7. Gravelly sand to sand; 3. Clays: clay to silty clay; 8. Very stiff sand to clayey sand; 4. Silt mixtures: clayey silt to silty clay; 9. Very stiff fine grained
5. Sand mixtures: silty sand to sandy silt; Figure 3.15 Soil behavior type classification chart after Robertson (1990) with data from the Fort Dorchester Site oriented at E-W direction.

46
Layer C extends from 8 ft (2.4 m) to a depth of 12 ft (3.7 m) and represents the
source sand layer. Figure 3.13 shows that the soil has high tip resistance and sleeve
friction. Also, no CPT measured pore pressures are observed in this layer as seen in
Figure 3.14. As shown in Figure 3.15 and 3.16, the source sand layer lies in Zone 6 and
the soil behaves as clean sands to silty sands. Even though the soil has high tip resistance
(qc1N)cs is less than 16 MPa, thereby, indicating that this layer is susceptible to
liquefaction if the ground water table were higher than the present day water table.
Zone Soil Behavior Type Zone Soil Behavior Type
1. Sensitive, fine grained; 6. Sands: clean sands to silty sands 2. Organic soils, peats 7. Gravelly sand to sand;
3. Clays: clay to silty clay; 8. Very stiff sand to clayey sand; 4. Silt mixtures: clayey silt to silty clay; 9. Very stiff fine grained 5. Sand mixtures: silty sand to sandy silt;
Figure 3.16 Soil behavior type classification chart after Robertson (1990) with data from the Fort Dorchester Site oriented at N-S direction.
47
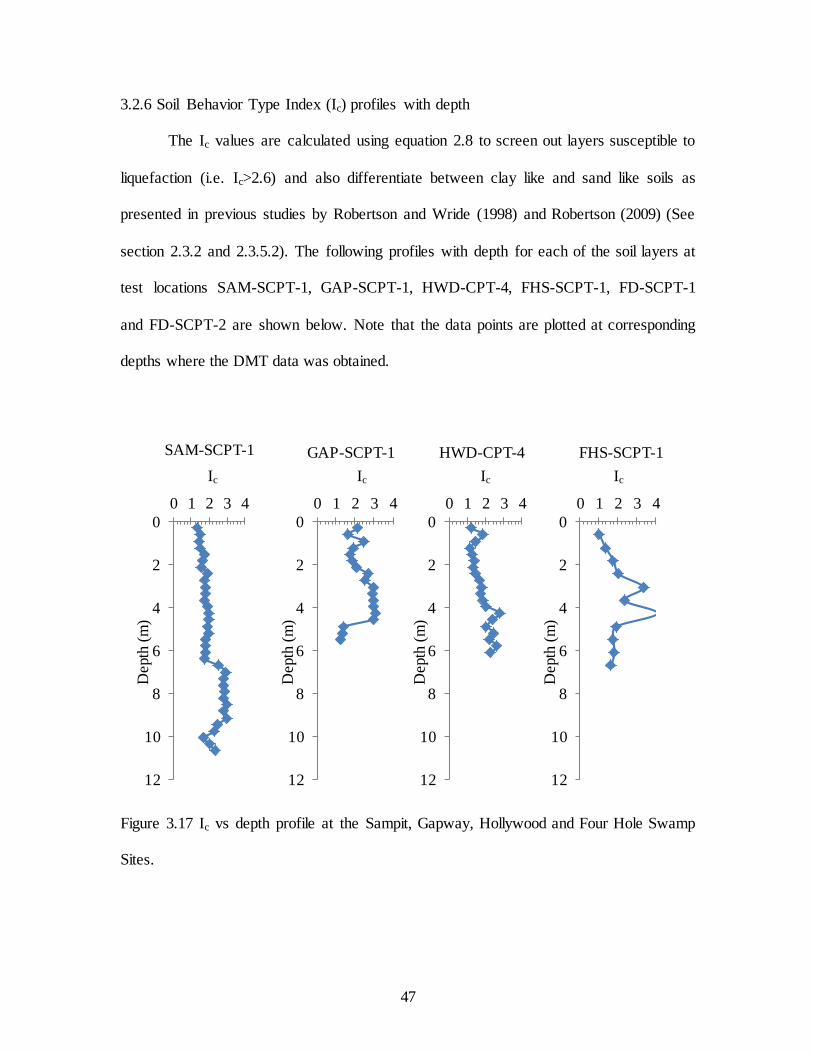
3.2.6 Soil Behavior Type Index (Ic) profiles with depth
The Ic values are calculated using equation 2.8 to screen out layers susceptible to
liquefaction (i.e. Ic>2.6) and also differentiate between clay like and sand like soils as
presented in previous studies by Robertson and Wride (1998) and Robertson (2009) (See
section 2.3.2 and 2.3.5.2). The following profiles with depth for each of the soil layers at
test locations SAM-SCPT-1, GAP-SCPT-1, HWD-CPT-4, FHS-SCPT-1, FD-SCPT-1
and FD-SCPT-2 are shown below. Note that the data points are plotted at corresponding
depths where the DMT data was obtained.
Figure 3.17 Ic vs depth profile at the Sampit, Gapway, Hollywood and Four Hole Swamp
Sites.
0
2
4
6
8
10
12
0 1 2 3 4
Depth
(m
)
SAM-SCPT-1
0
2
4
6
8
10
12
0 1 2 3 4
Depth
(m
)
GAP-SCPT-1
0
2
4
6
8
10
12
0 1 2 3 4
Depth
(m
)
HWD-CPT-4
0
2
4
6
8
10
12
0 1 2 3 4
Depth
(m
)
FHS-SCPT-1
Ic Ic Ic Ic

48
Figure 3.18 Ic vs depth profile at the Fort Dorchester Site
3.3 Soil Behavior from DMT
At the Sampit, Gapway, Hollywood, Four Hole Swamp and Fort Dorchester Sites,
the dilatometer test was conducted to obtain ID, KD and ED values which are plotted with
depth in Figures 3.19, 3.21, 3.23, 3.25, 3.27 and 3.28. The profiles are shown to compare
the results between different soil layers at a particular site. The soil behavior type from
DMT is analyzed using the Soil Identification ED-ID chart (ASTM D6635) shown in
Figure 2.6 in Section 2.3.1.
0
2
4
6
8
10
12
0 1 2 3 4
Depth
(m
)
FD-SCPT-1
0
2
4
6
8
10
12
0 1 2 3 4
Depth
(m
)
FD-SCPT-2
Ic Ic
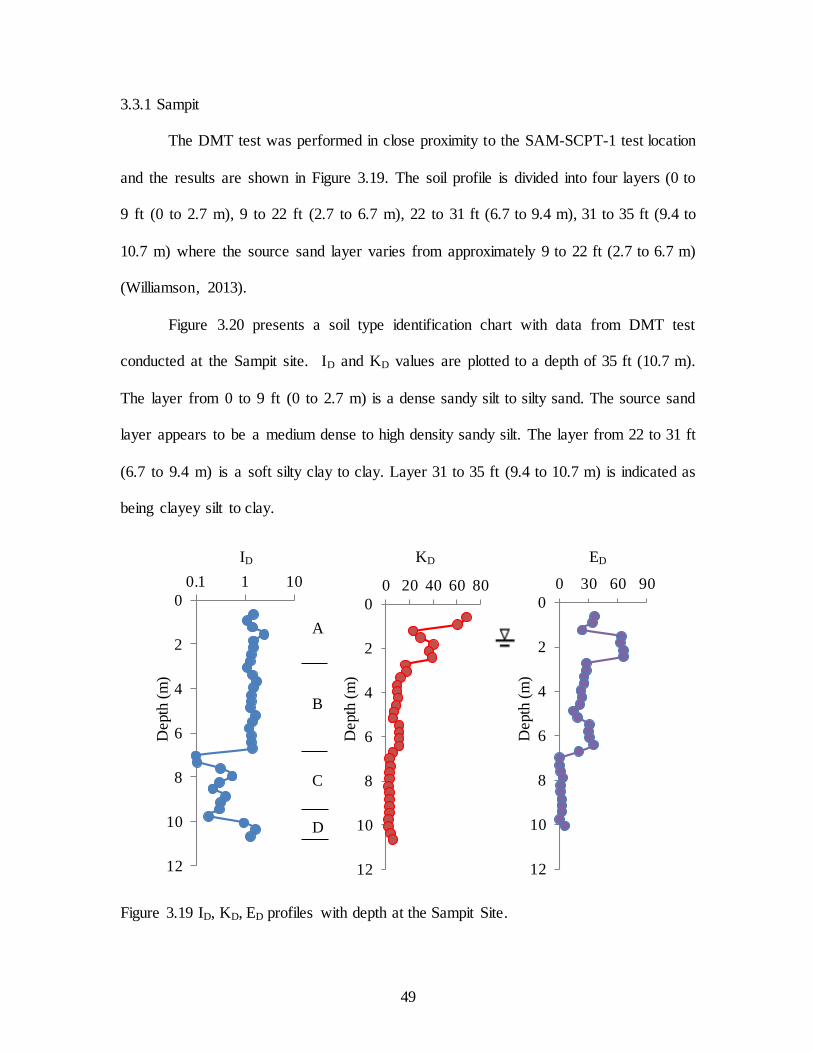
49
3.3.1 Sampit
The DMT test was performed in close proximity to the SAM-SCPT-1 test location
and the results are shown in Figure 3.19. The soil profile is divided into four layers (0 to
9 ft (0 to 2.7 m), 9 to 22 ft (2.7 to 6.7 m), 22 to 31 ft (6.7 to 9.4 m), 31 to 35 ft (9.4 to
10.7 m) where the source sand layer varies from approximately 9 to 22 ft (2.7 to 6.7 m)
(Williamson, 2013).
Figure 3.20 presents a soil type identification chart with data from DMT test
conducted at the Sampit site. ID and KD values are plotted to a depth of 35 ft (10.7 m).
The layer from 0 to 9 ft (0 to 2.7 m) is a dense sandy silt to silty sand. The source sand
layer appears to be a medium dense to high density sandy silt. The layer from 22 to 31 ft
(6.7 to 9.4 m) is a soft silty clay to clay. Layer 31 to 35 ft (9.4 to 10.7 m) is indicated as
being clayey silt to clay.
Figure 3.19 ID, KD, ED profiles with depth at the Sampit Site.
0
2
4
6
8
10
12
0.1 1 10
Depth
(m
)
0
2
4
6
8
10
12
0 20 40 60 80
Depth
(m
)
0
2
4
6
8
10
12
0 30 60 90
Depth
(m
)
ID KD ED
A
D
C
B

50
Figure 3.20 DMT modulus and material index chart (ASTM D 6635) with DMT results at the Sampit Site
3.3.2 Gapway
The DMT test was performed closest to the GAP-SCPT-1 test location and was
previously analyzed by Williamson (2013). As shown in Figure 3.21, the soil profile is
divided into five layers (0 to 3 ft (0 to 0.9 m), 3 to 4 ft (0.9 to 1.2 m), 4 to 7 ft (0.9 to 2.1
m), 7 to 15 ft (2.1 to 4.6 m), 15 to 18 ft (4.6 to 5.5 m) where the source sand layer was
identified to range from 4 to 7 ft (0.9 to 2.1 m).
Figure 3.22 presents the soil type identification chart with data from DMT test
conducted at the Gapway site. ID and KD values are plotted to a depth of 18 ft (5.5 m). It
is seen from the figure that layer 0 to 3 ft (0 to 0.9 m) ranges from a medium to dense

51
sandy silt to sand. The layer from 3 to 4 ft (0.9 to 1.2 m) has only one data point which
shows that this layer behaves as a low density sandy silt. The source sand layer materials
behave as a medium dense clayey silt to silty sand. The layer from 7 to 15 ft (2.1 to 4.6
m) has a wide range of soil types varying from soft silty clay to clay to clayey silt. The
layer 15 to 18 ft (4.6 to 5.5 m) consists of high density silty sand with a small fraction of
clay content.
Figure 3.21 ID, KD, ED profiles with depth at the Gapway Site.
3.3.3 Hollywood
The DMT test was conducted next to the HWD-CPT-4 sounding and the results
are presented in Figure 3.23. The soil profile is divided into three layers (0 to 9 ft (0 to
2.7 m), 9 to 14 ft (2.7 to 4.2 m), 14 to 20 ft (4.2 to 6.1 m) and the source sand layer
extends from 9 to14 ft (2.7 to 4.2 m) (Williamson, 2013).
0
2
4
6
8
10
12
0.1 1 10
Depth
(m
)
0
2
4
6
8
10
12
0 20 40 60 80
Depth
(m
)
0
2
4
6
8
10
12
0 30 60 90
Depth
(m
)
ID KD ED
D
C
A
B
E

52
Figure 3.22 DMT modulus and material index chart (ASTM D 6635) with DMT results at
the Gapway Site.
Figure 3.23 ID, KD, ED profiles with depth at the Hollywood Site.
0
2
4
6
8
10
12
0.1 1 10
Depth
(m
)
0
2
4
6
8
10
12
0 20 40 60 80
Depth
(m
)
0
2
4
6
8
10
12
0 30 60 90
Depth
(m
)
ID KD ED
B
A
C

53
Figure 3.24 shows the soil type identification chart with data from DMT test
performed at the Hollywood site. The soil behavior type for the layer from 0 to 9 ft (0 to
2.7 m) is shown to vary from a medium dense sand to a dense silty sand. The source sand
layer from 9 to 14 ft (2.7 to 4.2 m) is a silty sand of medium density. The layer from 14 to
20 ft (4.2 to 6.1 m) below the source sand has a wide range of soil types from low density
clayey silt to sandy silt to silty sand.
Figure 3.24 DMT modulus and material index chart (ASTM D 6635) with DMT results at
the Hollywood Site.
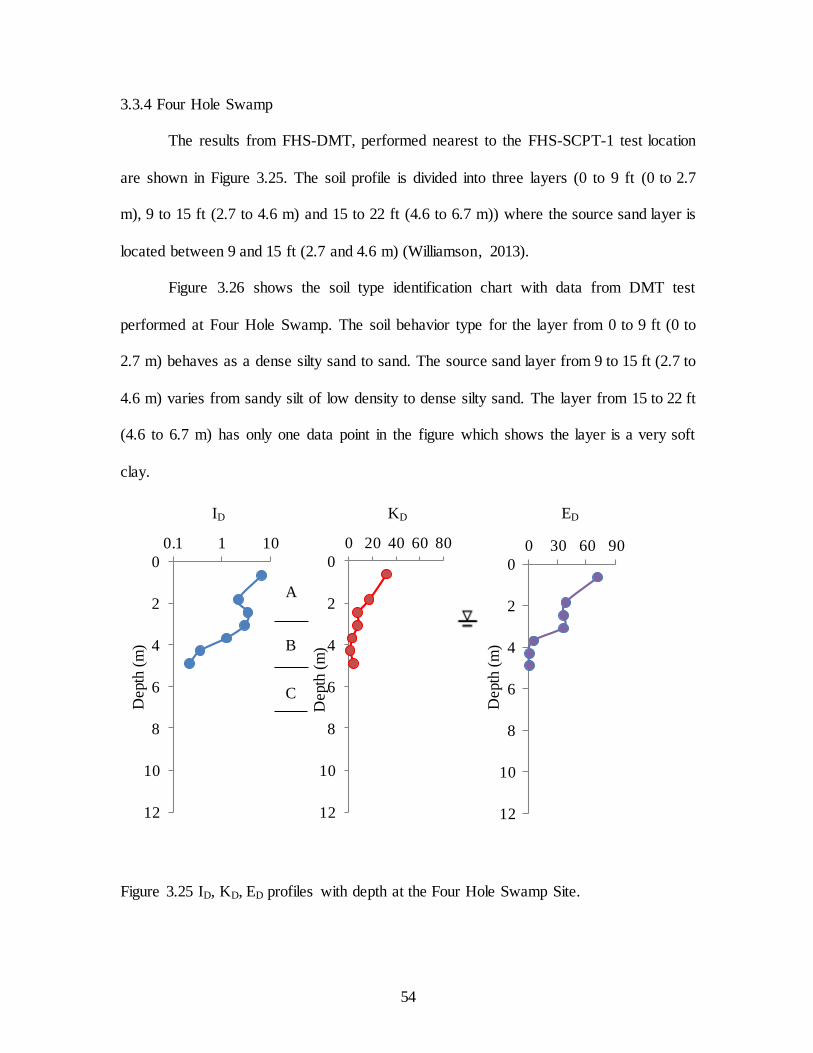
54
3.3.4 Four Hole Swamp
The results from FHS-DMT, performed nearest to the FHS-SCPT-1 test location
are shown in Figure 3.25. The soil profile is divided into three layers (0 to 9 ft (0 to 2.7
m), 9 to 15 ft (2.7 to 4.6 m) and 15 to 22 ft (4.6 to 6.7 m)) where the source sand layer is
located between 9 and 15 ft (2.7 and 4.6 m) (Williamson, 2013).
Figure 3.26 shows the soil type identification chart with data from DMT test
performed at Four Hole Swamp. The soil behavior type for the layer from 0 to 9 ft (0 to
2.7 m) behaves as a dense silty sand to sand. The source sand layer from 9 to 15 ft (2.7 to
4.6 m) varies from sandy silt of low density to dense silty sand. The layer from 15 to 22 ft
(4.6 to 6.7 m) has only one data point in the figure which shows the layer is a very soft
clay.
Figure 3.25 ID, KD, ED profiles with depth at the Four Hole Swamp Site.
0
2
4
6
8
10
12
0.1 1 10
Depth
(m
)
0
2
4
6
8
10
12
0 20 40 60 80
Depth
(m
)
0
2
4
6
8
10
12
0 30 60 90
Depth
(m
)
ID KD ED
B
A
C

55
Figure 3.26 DMT modulus and material index chart (ASTM D 6635) with DMT results at the Four Hole Swamp Site.
3.3.5 Fort Dorchester
The results for DMT tests FD-EW and FD-NS, closest to FD-SCPT-1 and FD-
SCPT-2 respectively are presented in Figures 3.27 and 3.28. For both DMT test locations,
the soil profile is divided into three layers (0 to 5 ft (0 to 1.5 m), 5 to 8 ft (1.5 to 2.4 m),
and 8 to 16 ft (2.4 to 4.9 m) where the source sand layer lies within 8 to 16 ft (2.4 to 4.9
m) (Williamson, 2013).
The soil type identification charts for FD-DMT-EW and FD-DMT-NS are shown
in Figures 3.29 and 3.30 respectively. DMT data is only available down to a depth of 12
ft (3.7 m), thus data from 8 to 12 ft (2.4 to 3.7 m) is used to characterize the source sand
in this case. For the FD-NS test location, the soil behavior type for the layer from 0 to 5 ft
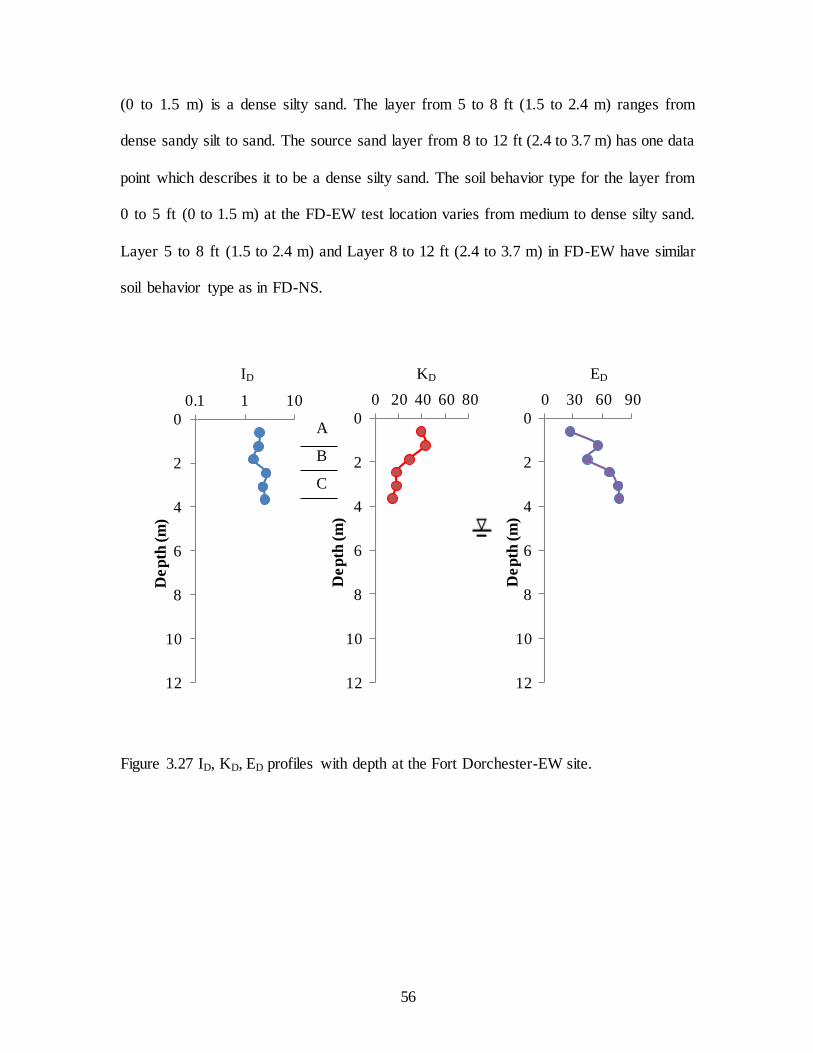
56
(0 to 1.5 m) is a dense silty sand. The layer from 5 to 8 ft (1.5 to 2.4 m) ranges from
dense sandy silt to sand. The source sand layer from 8 to 12 ft (2.4 to 3.7 m) has one data
point which describes it to be a dense silty sand. The soil behavior type for the layer from
0 to 5 ft (0 to 1.5 m) at the FD-EW test location varies from medium to dense silty sand.
Layer 5 to 8 ft (1.5 to 2.4 m) and Layer 8 to 12 ft (2.4 to 3.7 m) in FD-EW have similar
soil behavior type as in FD-NS.
Figure 3.27 ID, KD, ED profiles with depth at the Fort Dorchester-EW site.
0
2
4
6
8
10
12
0.1 1 10
De
pth
(m
)
0
2
4
6
8
10
12
0 20 40 60 80
De
pth
(m
)
0
2
4
6
8
10
12
0 30 60 90
De
pth
(m
)
ID KD ED
B
A
C
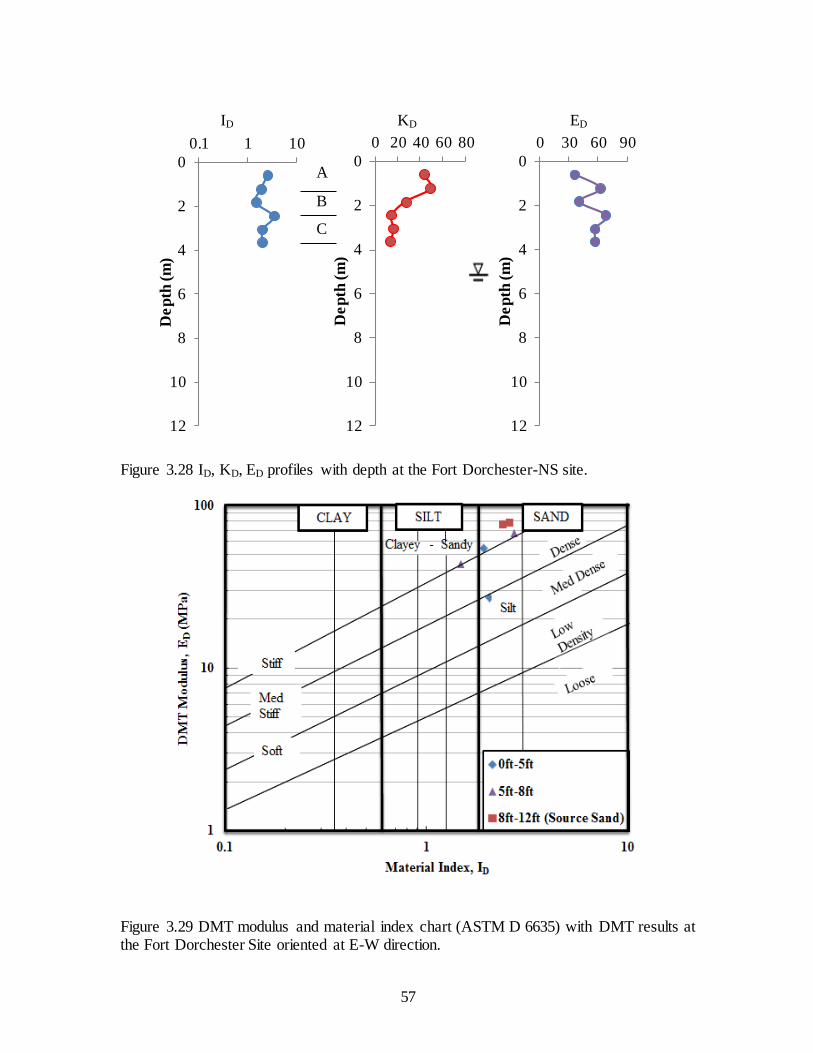
57
Figure 3.28 ID, KD, ED profiles with depth at the Fort Dorchester-NS site.
Figure 3.29 DMT modulus and material index chart (ASTM D 6635) with DMT results at the Fort Dorchester Site oriented at E-W direction.
0
2
4
6
8
10
12
0.1 1 10
De
pth
(m
) 0
2
4
6
8
10
12
0 20 40 60 80
De
pth
(m
)
0
2
4
6
8
10
12
0 30 60 90
De
pth
(m
)
ID KD ED
B
A
C
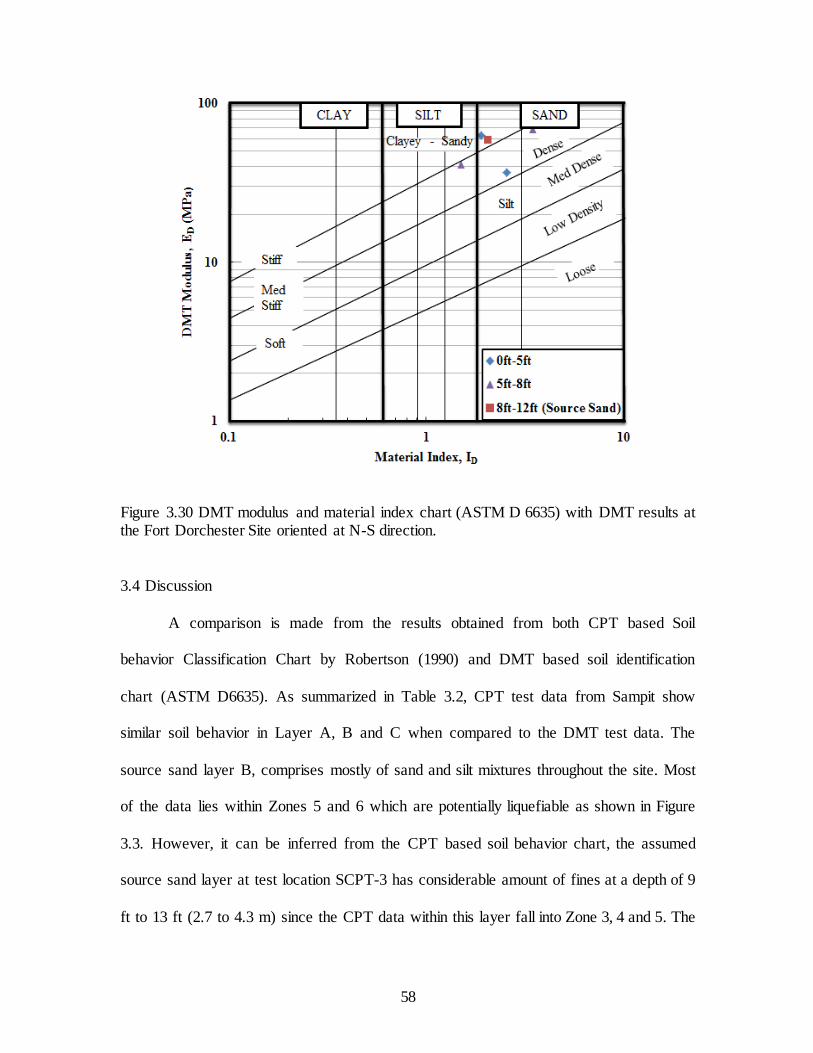
58
Figure 3.30 DMT modulus and material index chart (ASTM D 6635) with DMT results at the Fort Dorchester Site oriented at N-S direction.
3.4 Discussion
A comparison is made from the results obtained from both CPT based Soil
behavior Classification Chart by Robertson (1990) and DMT based soil identification
chart (ASTM D6635). As summarized in Table 3.2, CPT test data from Sampit show
similar soil behavior in Layer A, B and C when compared to the DMT test data. The
source sand layer B, comprises mostly of sand and silt mixtures throughout the site. Most
of the data lies within Zones 5 and 6 which are potentially liquefiable as shown in Figure
3.3. However, it can be inferred from the CPT based soil behavior chart, the assumed
source sand layer at test location SCPT-3 has considerable amount of fines at a depth of 9
ft to 13 ft (2.7 to 4.3 m) since the CPT data within this layer fall into Zone 3, 4 and 5. The

59
soil layer in this zone may be too clay rich to liquefy and hence the top boundary of the
source sand layer at this this test location may need to be shifted to a depth below 13 ft
(4.3 m). The soil behavior in Layer D consists of coarse sands and silts in the CPT based
chart whereas the DMT recognized the soil behavior type as mostly clays.
The CPT based SBT chart and ID-ED chart analyzed for Gapway both show that
Layer A has presence of mixed sands. It is, however, evident from both charts that Layer
B contains mostly sand and silt mixtures which undermine the clay cap layer defined by
Hu (2001). The source sand layer behaves differently when a comparison is made
between the two methods. The DMT test data suggests that the source sand layer has
presence of medium dense clays and silty sands while CPT data shows that it has only
sand mixtures. It can be inferred from the CPT data, that soils in the source sand layer
are granular with less amount of fines and can be considered to be potentially liquefiable.
The data invariably falls into the liquefiable zone as presented in Figure 3.6. However,
the results from DMT are closer to the USCS classification of soils provided earlier by
Williamson (2013) and can be considered to further validate the boundary of the source
sand layer. It is observed from the CPT based chart that the test location SCPT-1 which is
closest to the DMT exhibit clayey soil behavior in Layer D as obtained from the ID-ED
chart. The other two CPT test locations SCPT-1 and -3 which are located further away
from the DMT consist of silt and sand mixtures respectively. This indicates the soil
variability in Layer D for the three test locations across the site. Both DMT and CPT
charts indicate the presence of sand mixtures with a very small fraction of clays in Layer
E.

60
At Hollywood, both CPT and DMT methodologies show the best agreement for
all soil layers in comparison to the rest of the sites. As shown in the CPT based soil
identification chart, Layer A, B and C show the same soil behavior type for the three test
locations across the site and are also similar to the soil behavior classification presented
in the DMT ID-ED chart (See summary Table 3.2). The soil behavior for the source sand
layer from both these charts also compares well with the USCS Soil classification chart
used by Williamson (2013). As shown in Figure 3.9, the source sand layer fell into Zone
6 which is considered to be a potentially liquefiable zone. Hence, the source sand layer
interface for the three CPT test locations is considered to be a good assumption and soils
within this region can be considered as susceptible to liquefaction.The CPT and DMT
results obtained from Four Hole Swamp show similar soil behavior in Layer A. Layer A
produces the highest tip resistance and sleeve friction when compared to rest of the sites
and therefore is considered to have very dense and stiff sands in this region. The source
sand layer, B, from the CPT data shows that it consists of a wide range of soils and has a
high percentage of fines. ID-ED chart shows similar behavior characteristics since it
comprises of low density silt mixtures. Figure 3.12 indicates that the source sand layer
falls within Zone 4, 5 and 6, hence, it may be considered unliquefiable due to the
presence of large amount of fines. Further analysis on liquefaction susceptibility is
presented in Chapter 5. The CPT based SBT chart indicates that Layer C lies within
Zone 5, 6 and consists of sand mixtures while ID-ED chart indicates that soil comprises of
very soft clay. Hence, there is a clear discrepancy between both the charts. While
analyzing the DMT data only one data point at a depth of 16 ft (4.9 m) was used to
represent layer C therefore ID-ED chart may not be considered to classify soils in this case

61
even though this layer was classified as a clay layer from the USCS Soil Classification
chart used by Williamson (2013).
At the Fort Dorchester site, soil behavior in SCPT-1 and CPT-7a test locations is
compared to the E-W oriented DMT while soil behavior in SCPT-2 and SCPT-3 test
locations is compared to the N-S oriented DMT. From the CPT and DMT based charts,
Layer A for all the CPT test locations was considered to have very stiff sands to clayey
sands whereas both DMT-NS and DMT-EW consists of high density silty sands. The
CPT based method was analogous to the USCS soil classification unlike the DMT. Layer
B showed similar CPT soil behavior type to that of Layer A and compared well with the
DMT test results in a similar manner. However, in this case, the USCS soil classification
used by Williamson (2013) indicated that this layer has presence of high plasticity clays.
The source sand layer, C, comprised of silty sands as indicated by both the CPT and
DMT charts. As shown in Figures 3.15 and 3.16, the source sand layer plotted in Zone 6
indicating that the layer is susceptible to liquefaction. Both the DMT and CPT charts
confirmed the soil behavior type obtained from USCS soil classification by Williamson
(2013).

62
Table 3.2 Summary of Soil Behavior Type from Different Methods
Site Depth Layer
USCS Soil Classification (Williamson,
2013)
ED-ID Soil Identification
Chart (ASTM D
6635)
CPT SBT Chart
(Robertson, 1990)
Sampit
0-9ft A SP-SM High Density
Sandy Silt to Silty Sand
Clean Sands to Silty Sand;
Zone 6, Zone 7
(above WT)
9ft-22ft (Source
Sand)
B SP, SP-SC
Medium Dense to High
Density Sandy Silt
Clean Sands to Silty Sand;
Zone 6
22ft-31ft C CL Soft Silty Clay
to Clay
Mixture of clay, silt and
Sand; Zones 4, 5, 6
31ft-35ft D SP-SM Soft Clay to Clayey Silt
Clean Sands to Silty Sand to Sandy Silt;
Zone 5, 6
Gapway
0-3ft A Mixed Sands
Medium Density to
High Density Sandy Silt to
Sand
Clean Sands to
Silty Sand; Stiff sand; Zones 5, 6;
Zone 7(above
WT)
3ft-4ft B Clay Cap Low Density
Sandy Silt
Clean Sands to Silty Sand to Sandy Silt; Zones 5, 6
4ft-7ft (Source
Sand)
C SP-SC/SM Medium dense Clayey Silt to
Silty Sand
Clean Sands to Silty Sands;
Zone 6
7ft-15ft D Clay Soft Clay to Clayey Silt
Mixed clays, silts and sands; Zones 4, 5, 6
15ft-18ft E Coarse Sand High Density Silty Sand;
Soft Clay
Gravelly Sand to Sand; Clean
sand to silty
sand; Zones 6, 7

63
Hollywood
0-9ft
A
SM
Medium Dense Sand to High
Density Silty Sand
Clean Sands to Silty Sand;
Gravelly Sand Zones 6; Zone
7 (above WT) 9ft-14ft
(Source Sand)
B SP-SM
Medium
Density Silty Sand
Clean sands to
silty sands; Zone 6
14ft-20ft C SC-SM
Low Density Clayey silt to Sandy Silt to
Silty Sand
Clayey silt to
sandy silt; Zones 4, 5
Four Hole Swamp
0-9ft A SC-SM
Dense Silty
Sand to Sand
Clean Sands to
Silty Sand to Stiff Sand; Zones 6; Zone
7, 8 (above
WT)
9ft-15ft
(Source Sand)
B SP-SC
Low Density to High Density Sand Silt to
Silty Sand
Silty Clay to
silty sands; Zones 4, 5, 6
15ft-22ft C SC Very Soft Clay
Clean Sands to Silty Sand
to Sandy Silt; Zones 5, 6
Fort Dorchester
0-5ft A SC High Density
Silty sand
Sands to Very Stiff Sand to
clayey sand; Zones 6,8
5ft-8ft B CH High Density
Sandy Silt
to Sand
Sands to Very Stiff Sand to
stiff fine
grained; Zones 6, 8,9
8ft-12ft (Source Sand)
C SC-SM High Density
Silty Sand
Clean Sands to Silty sands;
Zone 6

64
3.5 All Source Sands
3.5.1 Soil Behavior Type from CPT
As shown in Figure 3.31, the source sand data for all the sites at test locations
closest to the DMT are plotted on the CPT Soil Behavior Chart by Robertson and Wride
(1990). As per earlier discussion in Section 3.2, the majority of the source sand data for
GAP, HWD, SAM plot within Zones 6 and 7 indicating presence of clean sands to silty
sands. The source sand data at FD fall mostly within Zones 7 and 8 and thus indicates
gravelly sands to very stiff sands. FHS site has a wide range of soils from clayey silts to
silty sands since it plots within Zones 4, 5 and 6. The closed square symbols falling into
Zone 5 for Hollywood and Sampit represent depths at 14 ft (4.3 m) and 22 ft (6.7 m)
respectively and both lie on the boundary of the source sand layer and can be neglected
for this analyses. The source sand data at SAM, GAP, HWD and FD sites are potentially
liquefiable according to Robertson and Wride‟s (1998) liquefaction criteria F<1% (See
section 2.3.2). However, there is an anomaly at the FHS site and may not be considered
susceptible to liquefaction since it contains considerable amount of fines.
3.5.2 Consideration of Relative Density Measurements
The maximum, minimum and average relative densities for the source sands as
summarized in Table 3.4 are calculated using Equation 2.10 suggested by Kulhawy and
Mayne (1990). The relative densities obtained from the CPT data for source sands is
found to be in the range 9-39% for SAM, 27-65% for GAP, 3-32% for HWD and 2-17%
for FHS, 17-41% for FD-SCPT-1 and 40-90% for FD-SCPT-2.

65
Zone Soil Behavior Type Zone Soil Behavior Type
1. Sensitive, fine grained; 6. Sands: clean sands to silty sands 2. Organic soils, peats 7. Gravelly sand to sand;
3. Clays: clay to silty clay; 8. Very stiff sand to clayey sand; 4. Silt mixtures: clayey silt to silty clay; 9. Very stiff fine grained 5. Sand mixtures: silty sand to sandy silt;
Figure 3.31 Soil behavior type classification chart after Robertson (1990) with Source Sand data at all sites.
The results of DMT soil behavior classification summarized in Table 3.2 are
related to Table 3.3 to predict the range of relative densities for all source sands.
According to Table 3.4, the source sands at all sites show higher relative densities using
DMT data in comparison to the CPT. As per Table 3.3, the CPT test results indicate that
Sampit, Hollywood and Four Hole Swamp consists of very loose to loose soil deposits.
However, the DMT test results show that the source sands consist of medium to dense

66
soil deposits. For Gapway and Fort Dorchester site, CPT test results show that the source
sands have medium and medium to dense soil deposits respectively while the
corresponding DMT results indicate presence of medium to dense and dense to very
dense soil deposits. Hence, there is a clear discrepancy between the relative densities
obtained from both these methods.
Furthermore, as shown in Table 3.4, the relative density obtained from laboratory
tests (ASTM D 4254) performed on high quality samples collected at SAM, HWD and
FHS sites (Hasek, 2014). As shown in Table 3.2, the relative densities obtained for the
source sands is found to be in the range 40 to 75% for SAM, 16 to 61% for HWD and 24
to 52% for FHS. The average relative densities calculated for the source sands at SAM,
HWD and FHS are 63, 46 and 41 respectively. Therefore, based on physical
measurements, it is indicated from Table 3.3 that the source sands have presence of loose
to medium density sands. Note that the source sands were previously classified as
medium dense to high density sands as shown in Table 3.2 and 3.3.
Table 3.3 Qualitative Description of Granular Soil Deposits (Das, 1990)
Relative Density Dr (%) Description of soil deposit
0-15 Very loose
15-50 Loose
50-70 Medium
70-85 Dense 85-100 Very dense

67
Table 3.4 Summary of Relative Densities, Dr (calculated in %) for Source Sands
Site CPT
DMT
Laboratory Measurements
Min Avg Max Min Avg Max
Sampit 9 27 39 50-85 40 63 75
Gapway 27 48 65 50-70 - - -
Hollywood 3 20 32 50-70 16 46 61
Four Hole Swamp 2 6 17 15-85 24 41 52
Fort Dorchester
FD-SCPT-1 17 30 41 85-100 - - -
FD-SCPT-2 40 70 90 85-100 - - -
1 Dr obtained from CPT data using Kulhawy and Mayne (1990) relation.
2 Dr obtained from DMT data using Table 3.2 and 3.3
3.5.3 Soil Behavior from DMT
Based on the discrepancy between the relative densities calculated from the CPT
data, the DMT data and the physical measurements, a new DMT soil behavior chart is
proposed and shown in Figure 3.32. The figure contains the DMT data for the source
sand layers at SAM, GAP, HWD, FHS and FD sites and the chart is modified by shifting
the degree of density (e.g. Loose in place of Low density, Low in place of Medium
density, etc…) using the laboratory measurements of relative density. Note that the
modified DMT chart is now in good agreement with the CPT Soil Behavior Chart.
Based on the modified DMT Soil Behavior Chart shown in Figure 3.32, the
source sand layer for SAM consists of low density to medium density sandy silt. For
GAP, it appears to have low density silts to silty sands. The source sand layer at HWD is
a low density to medium density silty sand. This layer at FHS represents a wide range of
soils from soft silty clays to loose sandy silts to medium density silty sands. Source sand
layer at FD is composed of dense silty sands. As previously discussed in Chapter 2, the

68
water table at the FD site was predicted to be closer to the ground surface during
Paleoliquefaction events. According to the current prediction of the water table at FD, it
is evident that the soil layers above the water table have densified over the years. Hence,
the source sand layer for both the test locations at FD plots in the dense region.
Figure 3.32 DMT modulus and material index chart (ASTM D 6635) with Source Sand
data at all sites.
3.6 Overburden Layer
The soil layers above the source sand layer are plotted on the CPT soil behavior
chart for all test locations closest to the DMT for all the sites as presented in Figure 3.33.

69
It is indicated from the figure that the overburden soil for SAM, GAP, HWD and FHS
mostly fall within Zones 6 and 7 and has presence of clean sands to silty sands to gravelly
sands. If the source sand layer liquefies during a future earthquake, sandblows would
form since the ejection of liquefied sand will occur onto the surface easily due to the
freely draining sands present in the overburden layer.
Zone Soil Behavior Type Zone Soil Behavior Type
1. Sensitive, fine grained; 6. Sands: clean sands to silty sands 2. Organic soils, peats 7. Gravelly sand to sand; 3. Clays: clay to silty clay; 8. Very stiff sand to clayey sand;
4. Silt mixtures: clayey silt to silty clay; 9. Very stiff fine grained 5. Sand mixtures: silty sand to sandy silt;
Figure 3.33 Soil behavior type classification chart after Robertson (1990) with Overburden Layer data at all sites.

70
As shown in Figure 3.33, the overburden layer at FD site lies within Zones 8 and
9. Note that the water table depth at FD site is currently found at 17 ft (5.2 m) and hence
the source sand is not susceptible to liquefaction due to its unsaturated state. According to
the topography at this site, it is unlikely that the water table would rise above the source
sand layer. If the water table rises, it would require a large magnitude earthquake and
high peak ground acceleration for the liquefied sand to break through the thick overlying
dense clayey sand and stiff fine grained layer.
3.7 Summary
This chapter included a summary of the DMT and CPT methodologies used to
identify the soil behavior type of soils at five sites in the SCCP. A summary of qs, fs, u0,
u2, Ic, ID, KD and ED profiles with depth were presented to show how these parameters
vary with depth and illustrate the soil stratigraphy for each of the sites. As shown in
Table 3.2, in general, the soil behavior type found from both the CPT Soil Behavior chart
of Robertson (1990) and the DMT Soil Identification Chart (ASTM D6635) were in good
agreement with the USCS Soil classification provided by Williamson (2013). However,
several discrepancies including soil behavior type for soils above the groundwater table
and relative densities between CPT and DMT test results were also observed.
The source sands for all the sites provided higher relative densities using DMT
data when compared to relative densities obtained from CPT test results. The DMT based
soil behavior chart for source sands was modified based on physical measurements of
relative densities obtained from laboratory tests. This modified chart was observed to be
71
in good agreement with the soil classification presented in the CPT Soil Behavior chart
for source sands.
Of interest to the study of liquefaction susceptibility it is important to note that the
data from the source sand layers at the SAM, GAP, HWD and FD sites plotted within
Zones 5 and 6 on the CPT Soil Behavior Charts which indicated clean sands to silty sands
to sandy silts which are potentially liquefiable soils. The source sand layer at FHS data,
however, plotted within Zones 4, 5 and 6 indicating the presence of a large amount of
fines which are non-susceptible to liquefaction. Since, the overburden soil layer at SAM,
GAP, HWD and FHS consists of mostly free draining clean sands to gravelly sands,
formation of sandblows would be a common phenomenon in future seismic events.
However, such a phenomenon would be less likely possible at the FD site due to the
densification and unsaturated state of the source sand layer. Further analyses on the
liquefaction susceptibility of the source sand layers will be presented in Chapter 5.

72
CHAPTER 4
SITE SPECIFIC CORRELATIONS
4.1 Introduction
In this chapter, DMT, SPT and CPT tests that were conducted in close proximity
to each other provide in situ data which have been used to classify soils and identify
possible correlations between normalized in situ test parameters specific to SCCP. The
CPT and DMT data specific to SCCP is used to compare with previously published
correlations provided for coarse grained and fine grained soils. New SPT-DMT
correlations specific to SCCP are also developed from existing published correlations
presented for a wide range of soils. In this study, the data from CPT and DMT test
performed in close proximity to each other is used to develop site specific relations
between KD and Q and ED and Q for the 5 sites in the SCCP.
4.2 DMT and CPT Correlation
4.2.1 KD-Q Relation
The values of KD and Q are calculated for each site using equation 2.4 and 2.6
respectively (See section 2.3.1 and 2.3.2). Certain values have been neglected due to
insufficient data at the DMT site. Relations between log KD versus log Q were developed
based on the Q-KD chart recommended by Robertson (2009). This chart is generally used
to characterize fine grained soils for IC > 2.6 and ID < 1.0 and can also be used to screen
73
out soil layers that are too clay rich to liquefy. A best overall fit is drawn over the range
of values to compare the data with published average values derived from Equations
2.21, 2.22, 2.25 and 2.26 (See Section 2.3.5.1). Equations 2.21 and 2.22 were derived by
Robertson (2009) from previous studies for fine grained soils by Marchetti (1980) and
Kulhawy and Maine (1990); and Marchetti (1980) and Wroth (1984) and Ladd(1991)
respectively. Schneider et al. (2008) provided correlations for insensitive or soft clays and
insensitive clays given by Equation 2.25 and 2.26 respectively. Equations 2.21, 2.22 and
2.25 gave similar KD and Q values and hence can be used to represent soft clays while the
upper bound correlation 2.26 is used to represent insensitive clays for Q<10.
The KD and Q values for SAM-DMT and SAM-SCPT-1 respectively are plotted
in the Q-KD chart recommended by Robertson (2009) as shown in Figure 3.23. The
values plotted on the chart based on Ic>2.6 represent the soil layer which extends from 22
to 31 ft (6.7 m to 9.4 m). This layer is located beneath the source sand layer. The trend
line included in Figure 4.1 appears to be similar to the linear trends from the relationships
represented by Equations 2.21, 2.22 and 2.25. According to the chart, this layer shows
presence of very soft clays.
The Q-KD values from GAP-DMT and GAP-SCPT-1 for the soil layer located at
a depth of 7 ft to a depth of 15 ft are shown in Figure 4.2. The trend line drawn in Figure
3.24 is closer to the upper bound correlations from Equation 2.26 and 2.22. Hence, the
soil layer has a mixture of sensitive and insensitive clays. It is predicted that this layer
generates higher excess pore pressures around the DMT probe (See Section 2.3.5.1).

74
Figure 4.1 Correlations between KD and Q in fine grained soils where Ic >2.6 and
ID<1using data from Sampit Site.
Figure 4.2 Correlations between KD and Q in fine grained soils where Ic >2.6 and ID<1using data from Gapway Site.
1
10
100
1 10 100
DM
T, K
D
CPT, Q
1
10
100
1 10 100
DM
T, K
D
CPT, Q
Eq. 2.22
Eq. 2.21
Eq. 2.25
Eq. 2.26
IC >2.60
Eq. 2.22 IC >2.60
Eq. 2.26
Eq. 2.25
Eq. 2.21
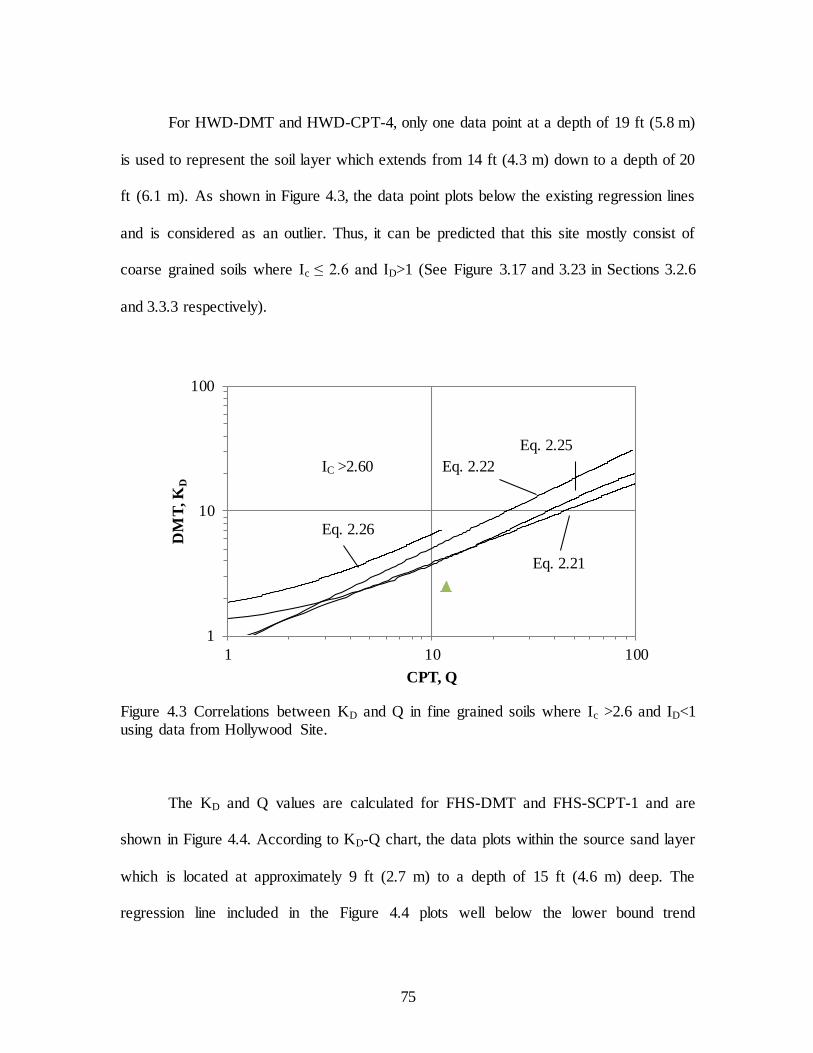
75
For HWD-DMT and HWD-CPT-4, only one data point at a depth of 19 ft (5.8 m)
is used to represent the soil layer which extends from 14 ft (4.3 m) down to a depth of 20
ft (6.1 m). As shown in Figure 4.3, the data point plots below the existing regression lines
and is considered as an outlier. Thus, it can be predicted that this site mostly consist of
coarse grained soils where Ic ≤ 2.6 and ID>1 (See Figure 3.17 and 3.23 in Sections 3.2.6
and 3.3.3 respectively).
Figure 4.3 Correlations between KD and Q in fine grained soils where Ic >2.6 and ID<1 using data from Hollywood Site.
The KD and Q values are calculated for FHS-DMT and FHS-SCPT-1 and are
shown in Figure 4.4. According to KD-Q chart, the data plots within the source sand layer
which is located at approximately 9 ft (2.7 m) to a depth of 15 ft (4.6 m) deep. The
regression line included in the Figure 4.4 plots well below the lower bound trend
1
10
100
1 10 100
DM
T, K
D
CPT, Q
IC >2.60
Eq. 2.26
Eq. 2.25
Eq. 2.21
Eq. 2.22
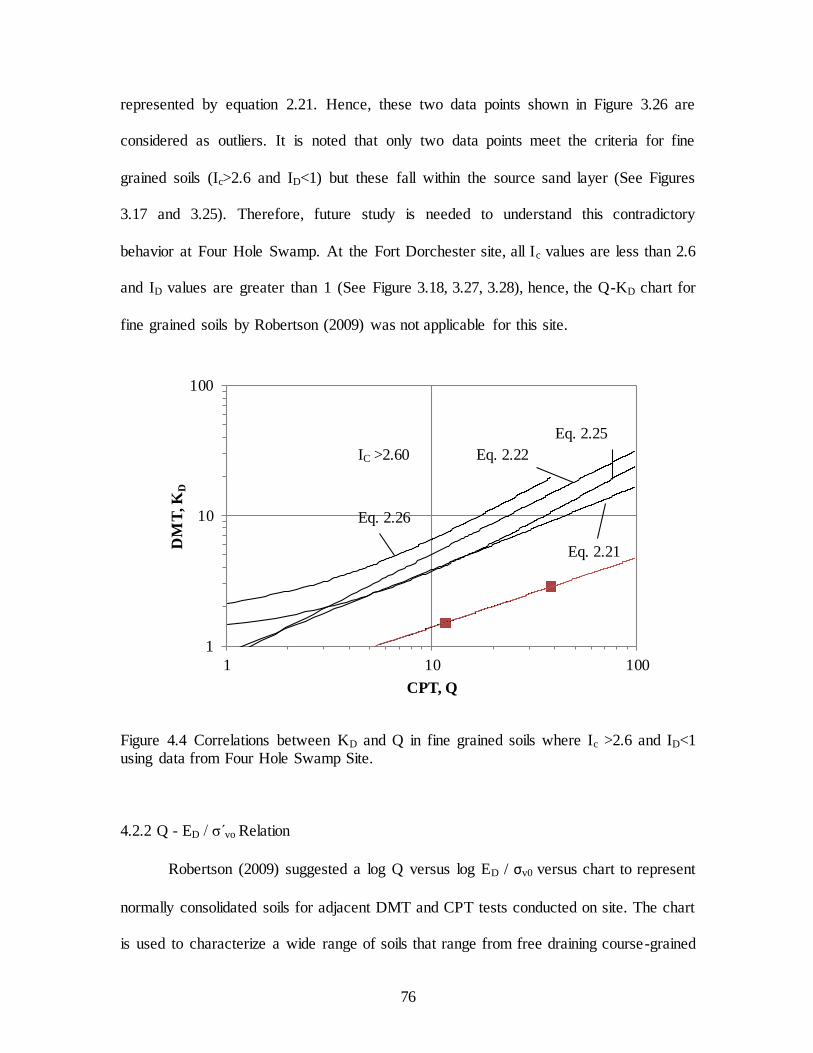
76
represented by equation 2.21. Hence, these two data points shown in Figure 3.26 are
considered as outliers. It is noted that only two data points meet the criteria for fine
grained soils (Ic>2.6 and ID<1) but these fall within the source sand layer (See Figures
3.17 and 3.25). Therefore, future study is needed to understand this contradictory
behavior at Four Hole Swamp. At the Fort Dorchester site, all Ic values are less than 2.6
and ID values are greater than 1 (See Figure 3.18, 3.27, 3.28), hence, the Q-KD chart for
fine grained soils by Robertson (2009) was not applicable for this site.
Figure 4.4 Correlations between KD and Q in fine grained soils where Ic >2.6 and ID<1 using data from Four Hole Swamp Site.
4.2.2 Q - ED / σ v́o Relation
Robertson (2009) suggested a log Q versus log ED / σv0 versus chart to represent
normally consolidated soils for adjacent DMT and CPT tests conducted on site. The chart
is used to characterize a wide range of soils that range from free draining course-grained
1
10
100
1 10 100
DM
T, K
D
CPT, Q
IC >2.60
Eq. 2.26
Eq. 2.25
Eq. 2.21
Eq. 2.22

77
soils to undrained fine grained soils. ED / σv0 and Q values are calculated for each of the
sites and are plotted on the ED / σv0 -Q chart recommended by Robertson (2009). A best
fit trend line was drawn for each of the soil layers for each site with the purpose of
comparing the data with average published values from Equation 2.29 and 2.30 (See
section 2.3.5.1).
The Q - ED / σ v́o chart proposed by Robertson (2009) is used in this study to
determine the correlation for each soil layer and compare them to previously published
data. The trend line drawn for each of the soil layers at each site is compared to the
overall best fit for a wide range of soils represented by Equation 2.29 (Maine and Liao
(2004)). The chart indicated that α lies within the range from 2 to 10 (See Section
2.3.5.1). The correlations from the plot were compared to α value from Equation 2.30
provided by Robertson (2009).
At the Sampit site, the trend lines drawn for each soil layer are compared to the
existing correlation. As shown in Figure 4.5, it is seen that the bottom layer which is
located between 31 and 35 ft (9.4 and 10.7 m) gives α value equal to 1.9 which does not
fall within the specified range. The topmost layer which lies between 0 and 9 ft (0 and
2.7 m( gives α value of 5.5 which is nearest to the existing correlation (where α = 5) and
hence the layer may vary from free draining coarse grained soils to undrained fine
grained soils.
The trend lines for each of the soil layers at Gapway are shown in Figure 4.6. It is
observed that α value for the topmost layer which extends from 0 to 3 ft (0 to 0.9 m) does
not fall within the specified range. The source sand data plots closer to the existing

78
regression line but has α value of 2.5 which tends to be very close to lower limit of the
specified range.
The trend lines drawn for each of the soil layers at Hollywood nearly merges with
the existing regression line. In Figure 4.7, it is indicated that α value for all the soil layers
fall within the given range. The layer from 14 to 20 ft (4.3 to 6.1 m) gives α value equal
to 5.4 and can be considered to represent a wide range of soils.
The regression line drawn for each of the soil layers at Four Hole Swamp is
shown in Figure 4.8. The source sand layer is located between 9 ft and 15 ft (2.7 and 4.6
m) and gives α value equal to 11.6 which does not fall within specified limits. The top 9
ft (2.7 m) layer gives α value equal to 4.5 and can be considered as a reasonable average
for a wide range of soils.
Figures 4.9 and 4.10 present the trend line drawn for each of the soil layers at the
Fort Dorchester Site. According to the data in FD-SCPT-1 it is observed from Figure 4.9
that the α value for all the soil layer which extends from the ground surface to 12 ft (3.7
m) does not fall within the specified range. However, it is evident from the data in FD-
SCPT-2 as shown in Figure 4.10 that α value for the entire soil layer falls within the
specified range. The correlation is not well established due to insufficient data points at
this site.

79
Figure 4.5 Correlations between ED/σ v́0 and Q for all soil types using data from Sampit
Site.
Figure 4.6 Correlations between ED/σ v́0 and Q for all soil types using data from Gapway Site.
ED/σ´v0 = 5.5Q
ED/σ'v0 = 3.9Q
ED/σ´v0 = 3.6Q
ED/σ´v0 = 1.9Q
10
100
1000
10000
1 10 100 1000
DM
T, E
D/σ
' v0
CPT, Q
ED/σ´v0= 5Q
ED/σ´v0 = 10.4Q
ED/σ´v0 = 2.5Q ED/σ´v0 = 8.3Q
ED/σ´v0 = 2.5Q
10
100
1000
10000
1 10 100 1000
DM
T, E
D/σ
' v0
CPT, Q
ED/σ´v0= 5Q

80
Figure 4.7 Correlations between ED/σ v́0 and Q for all soil types using data from
Hollywood Site.
Figure 4.8 Correlations between ED/σ v́0 and Q for all soil types using data from Four Hole Swamp Site.
ED/σ´v0 = 6.8Q
ED/σ´v0 = 6.1Q
ED/σ´v0 = 5.4Q
10
100
1000
10000
100000
1 10 100 1000 10000
DM
T, E
D/σ
' v0
CPT, Q
ED/σ'v0 = 5Q
ED/σ´v0 = 4.5Q
ED/σ´v0 = 11.6Q
10
100
1000
10000
1 10 100 1000 10000
DM
T, E
D/σ
' v0
CPT, Q
ED/σ´v0 = 5Q

81
Figure 4.9 Correlations between ED/σ v́0 and Q for all soil types using DMT data from
Fort Dorchester Site oriented in E-W direction.
Figure 4.10 Correlations between ED/σ v́0 and Q for all soil types using DMT data from Fort Dorchester Site oriented in NS direction.
ED/σ´v0 = 12.3Q
ED/σ´v0 = 11.8Q
ED/σ´v0 = 11.8Q
10
100
1000
10000
1 10 100 1000
DM
T, E
D/σ
' v0
CPT, Q
ED/σ´v0 = 5Q
ED/σ´v0= 7.8Q
ED/σ´v0 =7.7Q
ED/σ´v0 = 3.2Q
10
100
1000
10000
1 10 100 1000
DM
T, E
D /σ
' v0
CPT, Q
ED/σ´v0 = 5Q
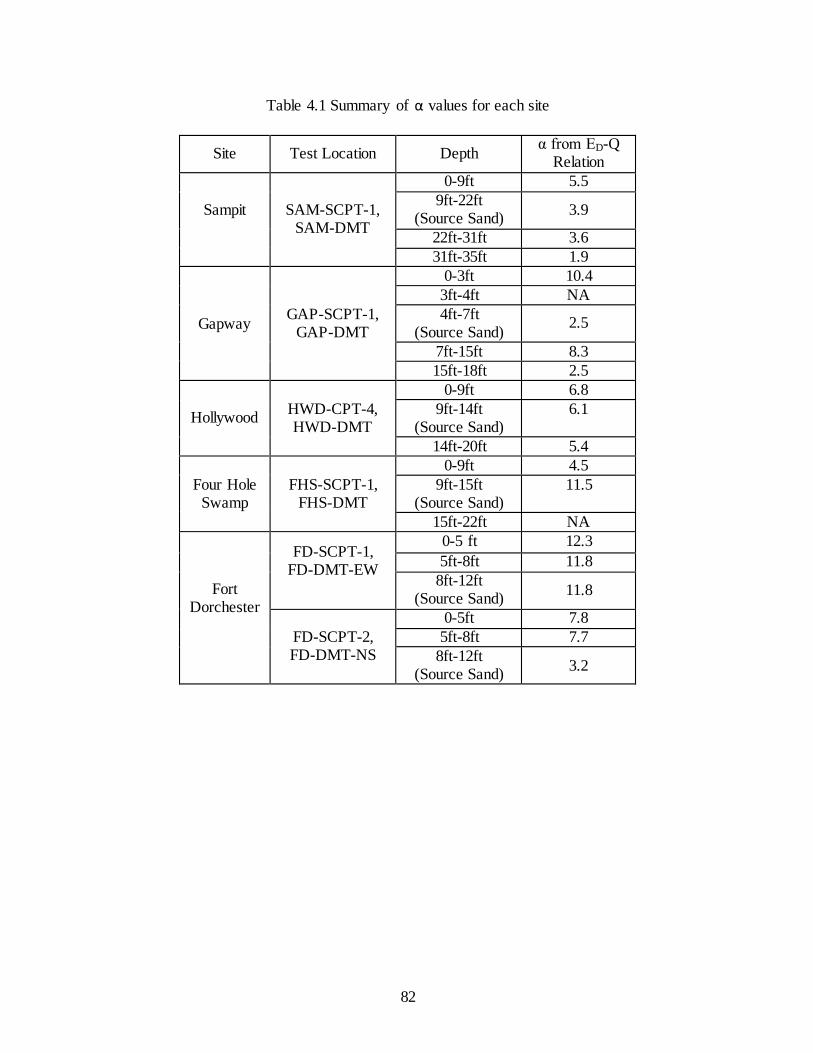
82
Table 4.1 Summary of α values for each site
Site Test Location Depth α from ED-Q
Relation
Sampit
SAM-SCPT-1, SAM-DMT
0-9ft 5.5
9ft-22ft (Source Sand)
3.9
22ft-31ft 3.6
31ft-35ft 1.9
Gapway GAP-SCPT-1,
GAP-DMT
0-3ft 10.4
3ft-4ft NA
4ft-7ft (Source Sand)
2.5
7ft-15ft 8.3
15ft-18ft 2.5
Hollywood HWD-CPT-4, HWD-DMT
0-9ft 6.8
9ft-14ft (Source Sand)
6.1
14ft-20ft 5.4
Four Hole Swamp
FHS-SCPT-1, FHS-DMT
0-9ft 4.5
9ft-15ft (Source Sand)
11.5
15ft-22ft NA
Fort Dorchester
FD-SCPT-1, FD-DMT-EW
0-5 ft 12.3
5ft-8ft 11.8
8ft-12ft (Source Sand)
11.8
FD-SCPT-2, FD-DMT-NS
0-5ft 7.8
5ft-8ft 7.7
8ft-12ft (Source Sand)
3.2

83
Table 4.2 Site Specific KD-Q correlations
Site Layer KD-Q relations
Sampit 22-31 ft (6.7-9.4 m) KD = 0.88 (Q)
0.64
KD = 0.8 (Q) 0.80
KD = 0.3 (Q) 0.95
+ 1.05
Gapway 7-15 ft (2.6-4.6 m) KD = 0.8 (Q)
0.80
KD = 0.67 (Q) 0.91
+ 1.1
Hollywood 14-20ft (4.3-6.3 m) NA
Four Hole Swamp
9-15ft (2.7-4.6 m) KD = 0.4Q
Fort
Dorchester NA NA
1No correlation at Hollywood since only one data point plots below the
existing regression lines and is considered to be an outlier
2 No correlation at Dort Dorchester since ID and IC values are out of range
4.3 DMT and SPT Correlations
In this study, the procedure outlined by Hajduk (2006) (See Section 2.3.5.2) was
followed for the SCCP sites to establish new correlations between DMT and SPT test
data specific to SCCP soils. First, the N and ED values were selected according to ID
values showing the three different soil behavior types. Some of the data was neglected
due to insufficient N values corresponding to specific depths where DMT data was
obtained. Since the SPT N values were corrected for overburden, N60, (N1)60 and (N1)60cs
values were also plotted with ED to develop new correlations specific to SCCP soils. This
data was then compared to existing N60-ED relation for all soil types by Hajduk (2006)
and N-ED relation for sands by Tanaka and Tanaka (1990) (See Section 2.3.5.2). The
corrected blow count (N1)60 and (N1)60cs values were assumed to be similar to N60 values
and hence can be used to compare the data with N60 values provided by Hajduk (2006).
The analysis is restricted to four sites (Gapway, Sampit, Four Hole Swamp and
Hollywood) because SPT tests were not performed at the Fort Dorchester site.
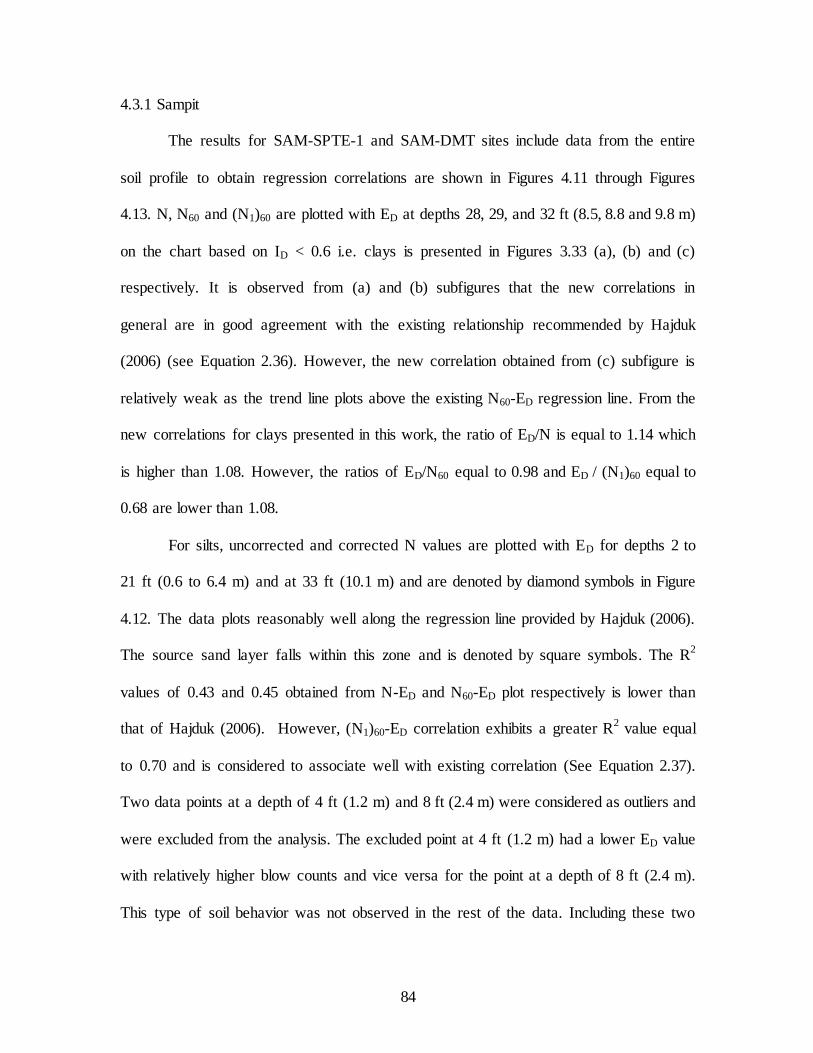
84
4.3.1 Sampit
The results for SAM-SPTE-1 and SAM-DMT sites include data from the entire
soil profile to obtain regression correlations are shown in Figures 4.11 through Figures
4.13. N, N60 and (N1)60 are plotted with ED at depths 28, 29, and 32 ft (8.5, 8.8 and 9.8 m)
on the chart based on ID < 0.6 i.e. clays is presented in Figures 3.33 (a), (b) and (c)
respectively. It is observed from (a) and (b) subfigures that the new correlations in
general are in good agreement with the existing relationship recommended by Hajduk
(2006) (see Equation 2.36). However, the new correlation obtained from (c) subfigure is
relatively weak as the trend line plots above the existing N60-ED regression line. From the
new correlations for clays presented in this work, the ratio of ED/N is equal to 1.14 which
is higher than 1.08. However, the ratios of ED/N60 equal to 0.98 and ED / (N1)60 equal to
0.68 are lower than 1.08.
For silts, uncorrected and corrected N values are plotted with ED for depths 2 to
21 ft (0.6 to 6.4 m) and at 33 ft (10.1 m) and are denoted by diamond symbols in Figure
4.12. The data plots reasonably well along the regression line provided by Hajduk (2006).
The source sand layer falls within this zone and is denoted by square symbols. The R2
values of 0.43 and 0.45 obtained from N-ED and N60-ED plot respectively is lower than
that of Hajduk (2006). However, (N1)60-ED correlation exhibits a greater R2 value equal
to 0.70 and is considered to associate well with existing correlation (See Equation 2.37).
Two data points at a depth of 4 ft (1.2 m) and 8 ft (2.4 m) were considered as outliers and
were excluded from the analysis. The excluded point at 4 ft (1.2 m) had a lower ED value
with relatively higher blow counts and vice versa for the point at a depth of 8 ft (2.4 m).
This type of soil behavior was not observed in the rest of the data. Including these two

85
points would reduce the R2
values and therefore is exempt from the regression analysis.
The ratios ED/N and ED/N60 obtained from the new correlations is equal to 4.1 and 3.2
respectively which is higher than 2.65 while ED / (N1)60 gives a lower value equal to 2.07.
Figure 3.35 presents N values plotted with ED based on ID>1.8 for sands. There
is only one data point available at a depth of 5 ft shown in Figure 4.13 (a), (b), (c) and
(d). Even though the data point plots very close to the regression lines for sands
recommended by Tanaka and Tanaka (1999) and Hajduk (2006) (See Equation 2.35 and
2.38), the relationship is very weak and no new correlations can be obtained from it.
4.3.2 Gapway
Hu et al. (2002) presented the (N1)60 values but not the raw N data for GAP-03 in
his work (Refer to Williamson (2013)). Therefore, only the (N1)60 data has been used
herein. Figure 3.36 (a), (b) and (c) show (N1)60-ED plots for clays, silts and sands
respectively. It can be inferred from subfigure (a) that the data point at 16 ft (4.9 m) has a
very high blow count with a very low ED value and it plots above Hajduk (2006)‟s
relation. The source sand denoted by square symbols is shown in subfigure (b). The new
correlations exhibits a low R2 value of 0.36 which suggests that the relationship is weak
when compared to existing relations proposed by Hajduk (2006). The correlation for
sands obtained at depths 2 and 17 ft (0.6 and 5.2 m) shown in subfigure (c) is almost the
same as presented by Hajduk (2006). The ratio of ED/N60 obtained for silts is equal to
0.98 which is lower than 2.65. For sands, the new correlation gives the ratio of ED/ N60
equal to 2.4 and is in good agreement with Hajduk (2006)‟s ED/N60 value of 2.43 and
Tanaka and Tanaka (1999)‟s ED/N value of 2.5.

86
(a) (b)
(c)
Figure 4.11 SPT-DMT Correlations for Clays at Sampit Site: a) N vs ED, b) N60 vs ED and c) (N1)60 vs ED
0
10
20
30
40
50
60
0 25 50 75 100
SP
T
N (
bp
f)
ED (MPa)
ID<0.6
0
10
20
30
40
50
60
0 25 50 75 100
SP
T
N60 (
bp
f)
ED (MPa)
ID<0.6
0
10
20
30
40
50
60
0 25 50 75 100
SP
T
(N1) 6
0 (
bp
f)
ED (MPa)
ID<0.6
This work Hajduk (2006)
ED / N = 1.14 ED / N60 = 1.08 R2 = 0.697
ED / N60 = 0.98
ED / (N1)60 = 0.68

87
(a) (b)
(c)
Figure 4.12 SPT-DMT Correlations for Silts at Sampit Site: a) N vs ED, b) N60 vs ED and c) (N1)60 vs ED
0
10
20
30
40
50
60
0 25 50 75 100
SP
T
N (
bp
f)
ED (MPa)
0.6<=ID<=1.8
0
10
20
30
40
50
60
0 25 50 75 100
SP
T
N60 (
bp
f)
ED (MPa)
0.6<=ID<=1.8
0
10
20
30
40
50
60
0 25 50 75 100
SP
T
(N1) 6
0 (
bp
f)
ED (MPa)
0.6<=ID<=1.8
This work Hajduk (2006)
ED / N = 4.1 R2 = 0.43 ED / N60 =2.65 R
2 = 0.679
ED / N60 = 3.2 R2
= 0.45
ED / (N1)60 = 2.07 R2 = 0.71
Source Sand

88
(a) (b)
(c) (d)
Figure 4.13 SPT-DMT Correlations for Sands at Sampit Site: a) N vs ED, b) N60 vs ED, c)
(N1)60 vs ED and d) (N1)60cs vs ED
0
10
20
30
40
50
60
0 25 50 75 100
SP
T
N (
bp
f)
ED (MPa)
ID>1.8
0
10
20
30
40
50
60
0 25 50 75 100
SP
T
N6
0 (
bp
f)
ED (MPa)
ID>1.8
0
10
20
30
40
50
60
0 25 50 75 100
SP
T
(N1) 6
0 (
bp
f)
ED (MPa)
ID>1.8
0
10
20
30
40
50
60
0 25 50 75 100
SP
T
(N1) 6
0cs
(b
pf)
ED (MPa)
ID>1.8
This work Hajduk (2006)
ED / N = NA ED / N60 = 2.43 R2
= 0.598
ED / N60 = NA Tanaka and Tanaka (1999)
ED / (N1)60 = NA ED / N = 2.5
ED / (N1)60cs = NA

89
(a) (b)
(c)
Figure 4.14 SPT-DMT Correlations for All Soils at Gapway Site: a) N vs ED, b) N60 vs
ED and c) (N1)60 vs ED
0
10
20
30
40
50
60
0 25 50 75 100
SP
T
(N1) 6
0 (
bp
f)
ED (MPa)
ID<0.6
0
10
20
30
40
50
60
0 25 50 75 100
SP
T
(N1) 6
0 (
bp
f)
ED (MPa)
0.6<=ID<=1.8
0
10
20
30
40
50
60
0 25 50 75 100
SP
T
(N1) 6
0 (
bp
f)
ED (MPa)
ID>1.8
This work Hajduk (2006)
ED / (N1)60 = NA (Clays) ED / N60 = 1.08 R2
= 0.697 (Clays)
ED / (N1)60 = 0.98(Silts) ED / N60 = 2.65 R2 = 0.679 (Silts)
R2 = 0.36 (Silts) ED / N60 = 2.43 R
2 = 0.598 (Sands)
ED / (N1)60 = 2.4 (Sands) Tanaka and Tanaka (1999)
Source Sand ED / N = 2.5 (Sands)

90
4.3.3 Hollywood
Figures 4.15 and 4.16 show SPT-DMT correlations using data obtained from
HWD-SPTE-1 and HWD-DMT sites. While selecting ED and N values based on ID
values for the entire soil layer up to a depth of 20 ft (6.1 m), it was observed that all
calculated ID values were greater than 0.6. Therefore, N, N60, (N1)60 and (N1)60cs values
were plotted versus ED for only silts and sands and new correlations were found.
Subfigures (a), (b) and (c) of Figure 4.15 includes data from 16 ft (4.9 m) through 20 ft
(6.1 m) and plots above and below the existing regression line (Hajduk, 2006). (N1)60-ED
plot gives a correlation which is closest to the existing relationship as seen in subfigure
(c). ED/N and ED/N60 ratios determined from new correlations are equal to 3.5 and 2.9
respectively and are higher than 2.65 while the ratio ED/(N1)60 has a lower value equal to
2.4.
For sands, the corrected N60 and (N1)60 values were plotted versus ED at depths 1
to 2 ft (0.3 to 0.6 m) and 10 to 18 ft (3 to 5.5 m) and (N1)60cs-ED plot at depths 10 to18 ft
(3 to 5.5 m) and are denoted by diamond symbols. The data shown in Figure 4.16 (a), (b),
(c) and (d), produces similar trends and plots well below the existing relation. The source
sand layer falls within this Zone and is denoted by square symbols. Subfigure (b) and (c)
both display a low R2 value of 0.49 while subfigure (a) and (d) display R
2 values of 0.56
and 0.53 respectively. Even though subfigure (a) has a R2 value closest to that of Hajduk
(2006), it is evident from subfigure (d) that (N1)60cs-ED plot provides a stronger
relationship when compared to the relations derived by Hajduk (2006) and Tanaka and
Tanaka (1999). The ratios ED/N, ED/N60, ED/(N1)60, ED/(N1)60cs obtained from the new
correlations are equal to 6.3, 5.6, 3.8 and 3.5 respectively which are found to be higher

91
than that of Hajduk (2006)‟s ED/N60 value of 2.43 and Tanaka and Tanaka (1999)‟s ED/N
value of 2.5.
(a) (b)
(c)
Figure 4.15 SPT-DMT Correlations for Silts at Hollywood Site: a) N vs ED, b) N60 vs ED
and c) (N1)60 vs ED
0
10
20
30
40
50
60
0 25 50 75 100
SP
T
N (
bp
f)
ED (MPa)
0.6<=ID<=1.8
0
10
20
30
40
50
60
0 25 50 75 100
SP
T
N60 (
bp
f)
ED (MPa)
0.6<=ID<=1.8
0
10
20
30
40
50
60
0 25 50 75 100
SP
T
(N1) 6
0 (
bp
f)
ED (MPa)
0.6<=ID<=1.8
This work Hajduk (2006)
ED / N = 3.5 ED / N60 =2.65 R2 = 0.679
ED / N60 = 2.9
ED / (N1)60 = 2.4
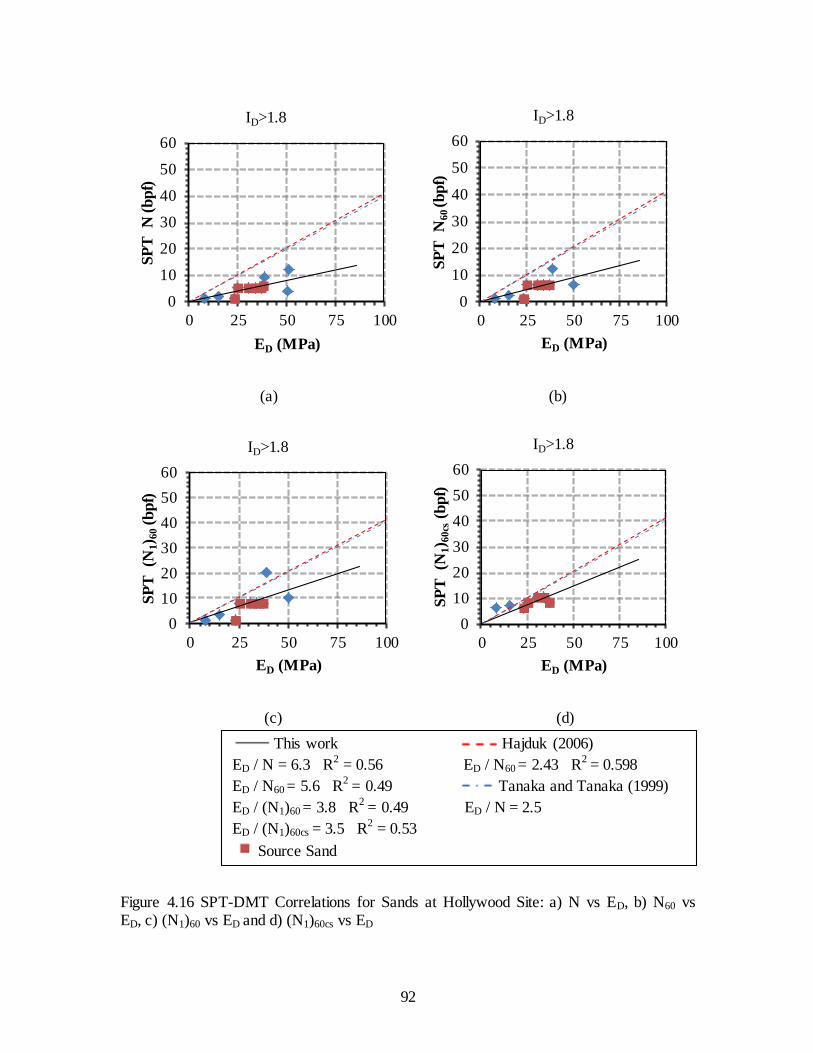
92
(a) (b)
(c) (d)
Figure 4.16 SPT-DMT Correlations for Sands at Hollywood Site: a) N vs ED, b) N60 vs ED, c) (N1)60 vs ED and d) (N1)60cs vs ED
0
10
20
30
40
50
60
0 25 50 75 100
SP
T
N (
bp
f)
ED (MPa)
ID>1.8
0
10
20
30
40
50
60
0 25 50 75 100
SP
T
N60 (b
pf)
ED (MPa)
ID>1.8
0
10
20
30
40
50
60
0 25 50 75 100
SP
T
(N1) 6
0 (
bp
f)
ED (MPa)
ID>1.8
0
10
20
30
40
50
60
0 25 50 75 100
SP
T
(N1) 6
0cs
(b
pf)
ED (MPa)
ID>1.8
This work Hajduk (2006)
ED / N = 6.3 R2 = 0.56 ED / N60 = 2.43 R
2 = 0.598
ED / N60 = 5.6 R2 = 0.49 Tanaka and Tanaka (1999)
ED / (N1)60 = 3.8 R2 = 0.49 ED / N = 2.5
ED / (N1)60cs = 3.5 R2 = 0.53
Source Sand

93
4.3.4 Four Hole Swamp
The results derived from SPT-DMT data for FHS-SPTE-1 and FHS DMT sites
are presented in Figures 4.17 through 4.19. For clays, ED was plotted versus N, N60,
(N1)60 and (N1)60cs at depths 14 ft (4.3 m) and 16 ft (4.9 m). The data plotted in Figures
4.17 (a), (b) and (c) showed that they were in close proximity to the existing regression
line. However, since there is only two data points the relationship is weak and no new
correlations can be obtained from it.
The SPT-DMT plot shown in Figures 4.18 (a), (b), (c) and (d) based on
0.6<=ID<=1.8 included only one data point at a depth of 12 ft (3.7 m). This data point
plotted close to the existing regression line for silts. Since, there is one data point
available, it was not possible to get new correlations from the data set.
The SPT N value versus ED was plotted at depths 2, 6, 8 and 10 ft (0.6, 1.8, 2.4
and 3 m) while ED was plotted with N60, (N1)60 and (N1)60cs at depths 6, 8 and 10 ft (1.8,
2.4 and 3 m) to obtain new correlations for sands. Hajduk (2006) underestimated the
correlations obtained from this data set. The data plotted below the existing regression
lines as shown in Figure 4.19 (a), (b), (c) and (d). (N1)60-ED plot provided an R2 value of
0.55 which is closest to that of Hajduk (2006). Figures 4.17 through 4.19 suggest that the
source sand layer denoted by square symbols consists of a mixture of clays, silts and
sands. The ratios ED/N, ED/N60, ED/(N1)60, ED/(N1)60cs obtained from the new correlations
are equal to 6.9, 9.9, 5.8 and 5.4 respectively which are found to be higher than that of
Hajduk (2006)‟s ED/N60 value of 2.43 and Tanaka and Tanaka (1999)‟s ED/N value of
2.5.

94
(a) (b)
(c)
Figure 4.17 SPT-DMT Correlations for Clays at Four Hole Swamp Site: a) N vs ED, b) N60 vs ED and c) (N1)60 vs ED
0
10
20
30
40
50
60
0 25 50 75 100
SP
T N
(b
pf)
ED (MPa)
ID<0.6
0
10
20
30
40
50
60
0 25 50 75 100
SP
T
N60 (
bp
f)
ED (MPa)
ID<0.6
0
10
20
30
40
50
60
0 25 50 75 100
SP
T
(N1) 6
0 (
bp
f)
ED (MPa)
ID<0.6
This work Hajduk (2006)
ED / N = NA ED / N60 = 1.08 R2
= 0.697
ED / N60 = NA
ED / (N1)60 = NA
Source Sand

95
(a) (b)
(c)
Figure 4.18 SPT-DMT Correlations for Silts at Four Hole Swamp Site: a) N vs ED, b) N60 vs ED and c) (N1)60 vs ED
0
10
20
30
40
50
60
0 25 50 75 100
SP
T N
(b
pf)
ED (MPa)
0.6<=ID<=1.8
0
10
20
30
40
50
60
0 25 50 75 100
SP
T
N60 (
bp
f)
ED (MPa)
0.6<=ID<=1.8
0
10
20
30
40
50
60
0 25 50 75 100
SP
T (
N1) 6
0 (
bp
f)
ED (MPa)
0.6<=ID<=1.8
This work Hajduk (2006)
ED / N = NA ED / N60 = 2.65 R2
= 0.679
ED / N60 = NA
ED / (N1)60 = NA
Source Sand

96
(a) (b)
(c) (d)
Figure 4.19 SPT-DMT Correlations for Sands at Four Hole Swamp Site: a) N vs ED, b) N60 vs ED, c) (N1)60 vs ED and (N1)60cs vs ED
0
10
20
30
40
50
60
0 25 50 75 100
SP
T N
(b
pf)
ED (MPa)
ID>1.8
0
10
20
30
40
50
60
0 25 50 75 100
SP
T N
60 (
bp
f)
ED (MPa)
ID>1.8
0
10
20
30
40
50
60
0 25 50 75 100
SP
T (
N1) 6
0 (
bp
f)
ED (MPa)
ID>1.8
0
10
20
30
40
50
60
0 25 50 75 100
SP
T
(N1) 6
0cs
(bp
f)
ED (MPa)
ID>1.8
This work Hajduk (2006)
ED / N = 6.9 R2 = 0.68 ED / N60 = 2.43 R
2 = 0.598
ED / N60 = 9.9 R2 = 0.47 Tanaka and Tanaka (1999)
ED / (N1)60 = 5.8 R2 = 0.55 ED / N = 2.5
ED / (N1)60cs = 5.4 R2 = 0.37
Source Sand

97
Table 4.3 Site Specific SPT-DMT correlations for Source sands
Site Soil Type ED-N relations
Sampit Silts ED / N = 4.1 ED / N60 = 3.2 ED / (N1)60 = 2.07
Gapway Silts ED / (N1)60 = 0.98
Hollywood Sands
ED / N = 6.3
ED / N60 = 5.6 ED / (N1)60 = 3.8 ED / (N1)60cs = 3.5
Four Hole Swamp
Sands
ED / N = 6.9 ED / N60 = 9.9 ED / (N1)60 = 5.8
ED / (N1)60cs = 5.4
Fort Dorchester
NA NA
1 No correlation at Fort Dorchester since SPT were not performed at this site
4.4 All Source Sand Correlations
4.4.1 DMT-CPT
The entire source sand data is plotted on the KD-Q and ED/σ‟vo-Q chart
irrespective of the IC and ID values as shown in Figure 4.20 and 4.21 respectively. Since,
the source sands are composed of generally granular soils with little fines, hence, these
values can be used to represent wide range of soil types. Therefore, the KD-Q chart for all
source sands cannot be used to make comparisons with existing correlations based on
KD-Q chart recommended by Robertson (2009) which have been used to characterize
only fine grained soils. As shown in Figure 4.20, a new DMT-CPT correlation i.e KD =
0.877Q0.5104
is established for soil types representing the source sand data for all the sites.
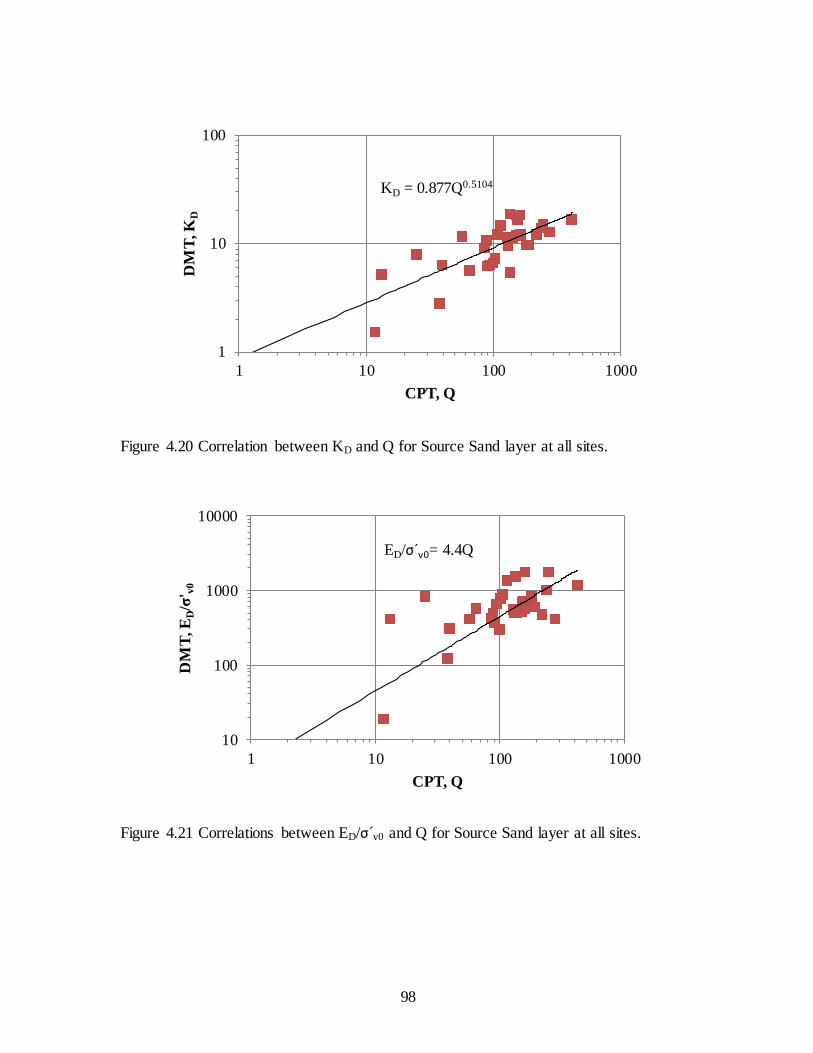
98
Figure 4.20 Correlation between KD and Q for Source Sand layer at all sites.
Figure 4.21 Correlations between ED/σ v́0 and Q for Source Sand layer at all sites.
KD = 0.877Q0.5104
1
10
100
1 10 100 1000
DM
T, K
D
CPT, Q
ED/σ´v0= 4.4Q
10
100
1000
10000
1 10 100 1000
DM
T, E
D/σ
' v0
CPT, Q

99
As shown in Figure 4.21, the entire source sand data for all sites gives a new
correlation ED/σ v́0 = 4.4 Q and can be compared to the existing correlation based on ED-
Q chart recommended by Robertson (2009) for all soil types. The ratio α = 4.4 in this
case falls within the range 2<α<10 recommended by Robertson (2009) and hence is a
good assumption to represent a wide range of soils.
4.4.2 DMT-SPT
As presented in Figures 4.22 through 4.25, the SPT-DMT correlations for source
sands is obtained for SAM, GAP, HWD and FHS respectively irrespective of Hajduk
(2006)‟s soil classification based on ID values. At Sampit, the ratios ED/N and ED/N60 are
equal to 3.4 and 2.7 and both have the highest R2 value of 0.74. Both the ratios ED/(N1)60
and ED/(N1)60cs are equal to 1.9 and have lower R2 values of 0.65 and 0.66 respectively.
Due to insufficient data points, the correlation at Gapway is considered to be relatively
weak since ED/(N1)60 value equals 0.92. The ratios ED/N, ED/N60, ED/(N1)60, ED/(N1)60cs
obtained from the source sand correlations at the Hollywood site are equal to 6.9, 5.9, 4.5
and 3.6. The ED-N relation provides a higher R2 value of 0.52 while ED-(N1)60cs relation
has the lowest R2
value of 0.33. Both ED-N60 and ED-(N1)60 relations give a R2 value of
0.42. At Four Hole Swamp, the data points are limited and hence the relationship is weak.
The ratios ED/N and ED/N60 are equal to 13.9 and the ratios ED/(N1)60 and ED/(N1)60cs are
12.3 and 10.9 respectively. From this analysis, stronger relationships are obtained at
SAM when compared to the relations obtained using Hajduk (2006)‟s methodology
(Refer to Table 4.3). However, the regression correlations at GAP, HWD, and FHS are
still considered to be weak.

100
(a) (b)
(c) (d)
Figure 4.22 SPT-DMT Correlations for Source Sand Layer at Sampit: a) N vs ED, b) N60 vs ED, c) (N1)60 vs ED and d) (N1)60cs vs ED
ED/N = 3.4 R² = 0.74
0
10
20
30
40
50
60
0 25 50 75 100
SP
T
N (
bp
f)
ED (MPa)
ED/N60 = 2.7 R² = 0.74
0
10
20
30
40
50
60
0 25 50 75 100
SP
T
N60 (
bp
f)
ED (MPa)
ED/(N1)60 = 1.9 R² = 0.65
0
10
20
30
40
50
60
0 25 50 75 100
SP
T
(N1) 6
0 (
bp
f)
ED (MPa)
ED/(N1)60cs = 1.9 R² = 0.66
0
10
20
30
40
50
60
0 25 50 75 100
SP
T
(N1) 6
0cs
(b
pf)
ED (MPa)

101
The correlations for the combined source sand data for all the sites are also
obtained from SPT-DMT plots shown in Figure 4.26. In this analysis, four points were
considered outliers in the SPT-DMT plots. This included the data points at a depth of 9 ft
and 14 ft below the ground surface at HWD. Both these points lie on the boundary of the
source sand layer. An additional outlier is also found at depth of 10 ft below the source
sand layer at FHS which has a very high ED value of 37 MPa and very low blow count of
2 and hence is an anomaly when compared to the rest of the data. Again, the data point on
the boundary of the source sand layer at 4 ft was also excluded from the analysis. These
outliers were excluded from the analysis since it reduced the R2 values. It is noted that the
data points at Gapway were restricted to the (N1)60-ED plot. The ratios ED/N, ED/N60,
ED/(N1)60, ED/(N1)60cs obtained from the combined source sand data are equal to 3.7, 3,
2.1 and 2.1. The corresponding R2 values obtained are 0.43, 0.44, 0.36, and 0.37
respectively. The R2 value of 0.37 from (N1)60cs-ED plot shown in Figure 4.26 (d) is
greater when compared to previously published results by Williamson (2013) (Equation
2.42) but lower than that presented by Tsai et. al (2009) (Equation 2.39).
Figure 4.23 SPT-DMT Correlations for Source Sand Layer at Gapway
ED/(N1)60 = 0.92
0
10
20
30
40
50
60
0 25 50 75 100
SP
T
(N1) 6
0 (
bp
f)
ED (MPa)

102
(a) (b)
(c) (d)
Figure 4.24 SPT-DMT Correlations for Source Sand Layer at Hollywood: a) N vs ED, b) N60 vs ED, c) (N1)60 vs ED and d) (N1)60cs vs ED
ED/N = 6.9 R² = 0.52
0
10
20
30
40
50
60
0 25 50 75 100
SP
T
N (
bp
f)
ED (MPa)
ED/N60 = 5.9 R² = 0.42
0
10
20
30
40
50
60
0 25 50 75 100
SP
T
N60 (
bp
f)
ED (MPa)
ED/(N1)60 = 4.5 R² = 0.42
0
10
20
30
40
50
60
0 25 50 75 100
SP
T
(N1) 6
0 (
bp
f)
ED (MPa)
ED/(N1)60cs = 3.6 R² = 0.33
0
10
20
30
40
50
60
0 25 50 75 100
SP
T
(N1) 6
0cs
(b
pf)
ED (MPa)

103
(a) (b)
(c) (d)
Figure 4.25 SPT-DMT Correlations for Source Sand Layer at Four Hole Swamp: a) N vs ED, b) N60 vs ED, c) (N1)60 vs ED and d) (N1)60cs vs ED
ED/N = 13.9
0
10
20
30
40
50
60
0 25 50 75 100
SP
T N
(b
pf)
ED (MPa)
ED/N60 = 13.9
0
10
20
30
40
50
60
0 25 50 75 100
SP
T
N60 (
bp
f)
ED (MPa)
ED/(N1)60 = 12.3
0
10
20
30
40
50
60
0 25 50 75 100
SP
T
(N1) 6
0 (
bp
f)
ED (MPa)
ED/(N1)60cs = 10.9
0
10
20
30
40
50
60
0 25 50 75 100
SP
T (
N1) 6
0cs
(b
pf)
ED (MPa)

104
(a) (b)
(c) (d)
Figure 4.26 SPT-DMT Correlations for Source Sand Layer at all Sites: a) N vs ED, b) N60 vs ED, c) (N1)60 vs ED and d) (N1)60cs vs ED
ED/N = 3.7 R² = 0.43
0
10
20
30
40
50
60
0 25 50 75 100
SP
T N
(b
pf)
ED (MPa)
ED/N60 = 3 R² = 0.44
0
10
20
30
40
50
60
0 25 50 75 100
SP
T
N6
0 (
bp
f)
ED (MPa)
ED/(N1)60 = 2.1 R² = 0.36
0
10
20
30
40
50
60
0 25 50 75 100
SP
T (
N1) 6
0 (
bp
f)
ED (MPa)
ED/(N1)60cs = 2.1 R² = 0.37
0
10
20
30
40
50
60
0 25 50 75 100
SP
T (
N1) 6
0cs
(b
pf)
ED (MPa)

105
4.4 Summary
CPT-DMT and SPT-DMT correlations that are specific to SCCP were derived
from adjacent CPT, DMT and SPT profiles for different soil types and compared to the
correlations developed by other researchers that were presented in Chapter 2. CPT-DMT
correlations include relations between Q and KD for fine-grained soils and relations
between Q and ED for a wide range of soils similar to those presented by Robertson
(2009). SPT-DMT correlations include relations between ED/σ v́0 and N60 for three
different soil types: clays, silts and sands similar to those provided by Hajduk (2006). The
trend lines in the Q-KD charts showed that the correlations for Sampit and Gapway are in
good agreement with those existing correlations for insensitive and sensitive clays,
respectively as shown in Table 4.2. Similar CPT-DMT and SPT-DMT correlations were
also established for all source sands irrespective of ID and Ic criteria suggested by
Robertson (2009) and Hajduk (2006).
CPT-DMT correlations specific to SCCP were used to estimate α, the ratio
between ED/σ v́0 and Q, given by Robertson (2009). α was found to vary with relative
density, age and stress history in a manner similar to the variation of the CPT modulus
factor αE (Baldi et al. 1989; Lunne et al. 1997). A summary of α values for all the sites
are presented in Table 4.1. The source sand layer at Sampit, Hollywood and Gapway
provided α values that fell within specified limits (2<α<10) defined by Robertson (2009).
α values for Four Hole Swamp and Fort Dorchester sites were found to be 11.5 and 11.8
respectively and did not fall within this previously published range. The combined source
sand layer for all sites provided α value of 4.4 and hence is a reasonable assumption to
represent a wide range of soils.

106
The source sand layer at Sampit and Gapway has ID values which lie within the
range of 0.6 to 1.8 and therefore was compared to the N60-ED charts for silts given by
Hajduk (2006). The source sand data at Sampit was shown to plot reasonably well along
the existing SPT-DMT regression line. The ratios ED/N, ED/N60 and ED/(N1)60 obtained
from correlations for silts at the Sampit site were found to be 4.1, 3.2 and 2.07
respectively. At this site, ED/(N)60 equal to 3.2 is higher than Hajduk (2006)‟s ED/N60
value of 2.65. While analyzing only the source sand data, the ED/N60 ratio was however
found to be 2.7 which also provided the highest R2 value of 0.74. Again, the ratio ED/N
was found to be 3.4 whereas both ED/(N1)60 and ED/(N1)60 were equal to 1.9. The
correlation for silts at the Gapway site presented a ratio ED/(N1)60 equal to 0.98 which
were lower than Hajduk (2006)‟s ED/N60 value of 2.65 whereas for sands the ratio
ED/(N1)60 of 2.4 was comparable to Hajduk (2006)‟s ED/N60 value of 2.43 and Tanaka
and Tanaka (1999)‟s ED/N value of 2.5. The correlation for source sands at this site
provided a low ED/(N1)60 value of 0.92.
The source sand layer at Hollywood had ID values greater than 1.8 and was shown
to plot on the ED-N60 charts for sands. The ratios ED/N, ED/N60, ED/(N1)60, ED/(N1)60cs
derived from the correlations for sands at the Hollywood site were found to be 6.3, 5.6,
3.8 and 3.5 respectively which were relatively higher than that of Hajduk (2006)‟s
ED/N60 value of 2.43 and Tanaka and Tanaka (1999)‟s ED/N value of 2.5. However, R2
value of 0.53 from the (N1)60cs-ED relation was closer to Hajduk (2006)‟s R2 value of
0.598 which indicated a strong relationship between both the correlations. The ratios
ED/N, ED/N60, ED/(N1)60, ED/(N1)60cs obtained from the correlations for source sands at
HWD were found to be 6.9, 5.9, 4.5 and 3.6 respectively which were slightly higher than

107
the correlations for silts. However, the correlations for silts yielded higher R2 values than
those obtained from correlations for source sands.
ED/N, ED/N60, ED/(N1)60, ED/(N1)60cs ratios derived from correlations of sands at
the Four Hole Swamp site were equal to 6.9, 9.9, 5.8 and 5.4 respectively. These values
were much higher than Hajduk (2006)‟s ED/N60 value of 2.43 and Tanaka and Tanaka
(1999)‟s ED/N value of 2.5. Even the R2 value of 0.47 obtained from ED-N60 relation was
lower than Hajduk (2006)‟s R2
value of 0.598. Given the low R2 value the relationship for
source sands at Four Hole Swamp was found to be weak. Also, the analysis of the source
sands at this site provided ED/N values > 10 which were extremely higher than those
obtained from sands.
The ED/N, ED/N60, ED/(N1)60, ED/(N1)60cs ratios derived from correlations of
combined source sands for all the sites were found to be 3.7, 3, 2.1 and 2.1 respectively.
The combination of source sands at all sites provided relatively lower R2 values with a
range of 0.36 to 0.44. Further analysis of the source sands showed that (N1)60cs-ED
relation provided a higher R2 value of 0.37 when compared to existing R
2 value of 0.33
previously determined by Williamson (2013).
108
CHAPTER 5
LIQUEFACTION SUSCEPTIBILITY PREDICTION
5.1 Introduction
A CPT based liquefaction susceptibility chart recommended by Hayati and
Andrus (2008) is used to screen out layers that are too clay rich for liquefaction. This
chart shown in Figure 2.9 in Section 2.3.2 and was based on the revised criteria by
Robertson and Wride (1998) where Ic> 2.6 or Bq>0.5 represented soils that are non-
susceptible to liquefaction. Soils with Ic<2.4 and Bq<0.4 are considered susceptible. Soils
between these limits are considered moderately susceptible or another test run may be
required for further assessment.
5.2 Methodology
In this thesis, the following two step procedure was used to evaluate liquefaction
susceptibility. First, Ic and Bq values were plotted for the CPT test location closest to the
DMT. The CPT parameters were selected corresponding to the comparable depths given
in DMT. The next step was to calculate average Bq and Ic values for each layer at all the
test locations performed at each site as shown in Table 5.1. Note that the test locations at
each site were divided into soil layers as previously discussed in Chapter 3. Average
values of Bq and Ic were used to represent a specified soil layer at each of the test

109
locations for each site. The CPT data was then analyzed to determine which soil layers
fell into the susceptible, non-susceptible and test required zones.
Table 5.1 Summary of Test Locations used in Liquefaction Susceptibility Prediction
Site Test Locations
Sampit SAM-SCPT-1 SAM-SCPT-2 SAM-SCPT-3
Gapway GAP-SCPT-1 GAP-SCPT-2 GAP-SCPT-2
Hollywood HWD-CPT-4 HWD-CPT-5 HWD-CPT-6
Four Hole Swamp FHS-SCPT-1 FHS-SCPT-2 FHS-SCPT-3
Fort Dorchester FD-SCPT-1 FD-SCPT-2 FD-SCPT-3 FD-CPT-7a
5.3 Results
SAM-SCPT-1 was conducted in close proximity to the SAM-DMT at the Sampit
site. Figure 5.1 shows the Ic-Bq chart proposed by Hayati and Andrus (2008) with data
from the Sampit site. The chart indicates that the top 9 ft (2.7 m) thick silty sand layer
defined for SAM-SCPT-1 falls into the susceptible zone. Nearly all the source sand data
fell into the susceptible zone except the data point plotted at 22 ft (6.7 m). This data point
at 22 ft (6.7 m) fell into the moderately susceptible to test required zone because it lies on
the boundary of the source sand layer and the clay layer below the source sand. The 9 ft
(2.7 m) thick clay layer below the source is considered too clay rich to liquefy and hence
the data plots in the non-susceptible zone. The silty sand layer from 31 to 35 ft (9.4 to
10.7 m) falls into the susceptible zone. Average Ic and Bq values were found for Layer A,
B, C and D for all the three test locations at Sampit. Layer A, B and D defined for SAM-
SCPT-1 as shown in Figure 5.1 are susceptible to liquefaction. Layer C, however, plots in

110
the non-susceptible zone and hence is too clay rich to liquefy. The average Ic-Bq values
suggest that for test locations SAM-SCPT-2 and SAM-SCPT-3, all the layers A, B, C and
D are susceptible to liquefaction.
Figure 5.1 CPT-based liquefaction susceptibility chart after Hayati and Andrus (2008) with data from Sampit site
GAP-SCPT-1 was performed closest to GAP-DMT and the CPT data was
analyzed to evaluate liquefaction susceptibility. As shown in Figure 5.2, the top 3 ft (0.9
m) mixed sand layer fell into the susceptible zone. However, the data point at 3 ft (0.9 m)
fell into the test required zone since it lies on the boundary of the mixed sand layer and
the thin clay cap layer. For the thin clay cap layer, CPT data was considered at a depth of
4 ft (1.2 m) which fell into the susceptible zone. This data point lies on the boundary of
the source sand layer and plots very near to the data points used to represent the source
sand layer. The source sand layer plots in the susceptible region while the clay layer
1
1.5
2
2.5
3
3.5
4
0 0.2 0.4 0.6 0.8 1 1.2 1.4
I c
Bq
0ft-9ft9ft-22ft(Source Sand)22ft-31ft31ft-35ftLayer ALayer BLayer CLayer DSusceptible
Sensitive, Fine
Grained Not Susceptible
Test R
eq
uire
d

111
beneath the source sand layer is not susceptible to liquefaction. The coarse sand layer
from 15 to 18 ft (4.6 to 5.5 m) plots in the susceptible region. The average Ic and Bq
values were calculated for Layer A, B, C, D and E at each of the test locations at
Gapway. In Figure 5.2, it is observed that layers A, B, C and E for the three test locations
are susceptible to liquefaction. The average Ic-Bq values for the three test locations
indicate that Layer D is the only layer which is not susceptible to liquefaction.
Figure 5.2 CPT-based liquefaction susceptibility chart after Hayati and Andrus (2008) with data from Gapway site
The CPT data at HWD-CPT-4 was studied for liquefaction at depths where DMT
data was obtained. The top 9 ft (2.7 m) silty sand layer has Ic values less than 2.4 and Bq
values less than 0.4 and hence falls within the susceptible zone as shown in Figure 5.3.
All of the data except one in the source sand layer falls in the susceptible zone. The data
point is at a depth of 14 ft (4.3 m) lies on the boundary of the source sand layer and the
1
1.5
2
2.5
3
3.5
4
0 0.2 0.4 0.6 0.8 1 1.2 1.4
I c
Bq
0ft-3ft3ft-4ft4ft-7ft(Source Sand)7ft-15ft15ft-18ftLayer ALayer BLayer CLayer DLayer ESusceptible
Sensitive, Fine
Grained
Not Susceptible
Test R
eq
uire
d

112
layer beneath the source sand. Since, it plots in the non-susceptible zone the data point
can be used to represent the layer below the source sand. The data from the silty clayey
sand layer from 14 to 20 ft (4.3 to 6.1 m) plots mostly in the susceptible zone but also in
the non-susceptible zone. However, average Ic and Bq values plotted in the Figure 5.3
show that Layer C defined for HWD-CPT-4, -5 and -6 plots within the test required zone.
As shown in Figure 5.3, Layer A and B for each of the test locations is susceptible to
liquefaction.
Figure 5.3 CPT-based liquefaction susceptibility chart after Hayati and Andrus (2008) with data from Hollywood site
The CPT liquefaction susceptibility chart is presented in Figure 5.4 for Four Hole
Swamp. The top 9 ft (2.7 m) thick silty clayey sand defined for FHS-SCPT-1 plots in the
susceptible zone. However, the majority of the data in the source sand region has Ic
values >2.6, thereby, indicating that soil is not susceptible to liquefaction. Only one data
1
1.5
2
2.5
3
3.5
4
0 0.2 0.4 0.6 0.8 1 1.2 1.4
I c
Bq
0ft-9ft
9ft-14ft (Source Sand)
14ft-20ft
Layer A
Layer B
Layer CSusceptible
Sensitive, Fine
Grained
Not Susceptible
Test R
eq
uire
d

113
point at a depth of 12 ft (3.7 m) indicates that the source sand layer falls within the
susceptible zone. The clayey sand layer from 15 to 22 ft (4.6 to 6.7 m) plots mostly in the
test required zone. Only one data point at a depth of 16 ft (4.9 m) fell into the susceptible
zone. The average Ic-Bq values used for layers A and C indicate that the soils at each of
the test locations are susceptible to liquefaction. The source sand layer, B, defined for
FHS-SCPT-1 fell into the non-susceptible zone. However, the average Ic-Bq values
plotted in Figure 5.4 shows that Layer B at FHS-SCPT-2 and -3 is susceptible to
liquefaction.
Figure 5.4 CPT-based liquefaction susceptibility chart after Hayati and Andrus (2008)
with data from Four Hole Swamp site
FD-SCPT-1 and FD-SCPT-2 was performed in close proximity to FD-DMT-EW
and FD-DMT-NS respectively and the results for liquefaction susceptibility are shown in
Figures 5.5 and 5.6. Both the charts indicated that the top 5 ft (1.5 m) silty clay layer and
1
1.5
2
2.5
3
3.5
4
0 0.2 0.4 0.6 0.8 1 1.2 1.4
I c
Bq
0ft-9ft9ft-15ft (Source Sand)15ft-22ftLayer ALayer BLayer C
Susceptible
Sensitive, Fine
Grained
Not Susceptible T
est R
eq
uire
d

114
source sand layer fell into the susceptible zone. The clayey sand layer from 5 to 8 ft (1.5
to 2.4 m) plotted in the susceptible region as well as in the test required zone for both test
locations FD-SCPT-1 and -2. Average Ic-Bq values for SCPT-1 and CPT-7a were plotted
in Figure 5.5 while average values for SCPT-2 and SCPT-3 were plotted in Figure 5.6.
Layer A and C for all the four test locations are susceptible to liquefaction. Layer B
defined for FD-CPT-7A and FD-SCPT-2 showed low susceptibility as the data plotted in
the test required zone whereas layer B defined for FD-SCPT-1 and -3 data is susceptible
to liquefaction.
Figure 5.5 CPT-based liquefaction susceptibility chart after Hayati and Andrus (2008a) with data from Fort Dorchester site oriented in E-W direction.
1
1.5
2
2.5
3
3.5
4
0 0.2 0.4 0.6 0.8 1 1.2 1.4
I c
Bq
0ft-5ft5ft-8ft8ft-12ft (Source Sand)Layer ALayer BLayer CSusceptible
Sensitive, Fine
Grained
Not Susceptible T
est R
eq
uire
d

115
Figure 5.6 CPT-based liquefaction susceptibility chart after Hayati and Andrus (2008)
with data from Fort Dorchester site oriented in N-S direction.
5.4 Discussion
The CPT liquefaction susceptibility chart was provided by Hayati and Andrus
(2008) to predict whether a soil layer is likely to liquefy or not. The results obtained from
the charts showed that the source sand layer delineated for test locations at Sampit,
Gapway, Hollywood and Fort Dorchester Site fell into the susceptible zone as shown in
Table 5.2. The source sand layer at these sites consists of clean sand to silty sands and
had Ic values less than 2.6 thereby indicating that the soil is susceptible to liquefy. At the
Hollywood site, the data point at a depth of 14 ft (4.3 m) lying on the boundary of the
source sand layer and the clayey silty layer, falls on the non-susceptible zone and hence
can be considered to represent the clayey silty layer. From Figure 3.12 in Section 3.2.4 ,
the source sand layer at Four Hole Swamp is considered to have presence of clays which
1
1.5
2
2.5
3
3.5
4
0 0.2 0.4 0.6 0.8 1 1.2 1.4
I c
Bq
0ft-5ft
5ft-8ft
8ft-12ft (Source Sand)
Layer A
Layer B
Layer CSusceptible
Sensitive, Fine
Grained
Not Susceptible
Test R
eq
uire
d

116
has Ic>2.6 suggesting that the soil is not capable of liquefying. On the other hand, average
Ic-Bq values for test locations FHS-SCPT-2 and -3 indicate that Four Hole Swamp can be
considered susceptible to liquefaction.
Table 5.2 Summary of liquefaction susceptibility using average Bq and Ic values
Site Layer Liquefaction
Susceptibility Chart
Sampit
A Susceptible
B (source
sand)
Susceptible
C Susceptible to Non
Susceptible
D Susceptible
Gapway
A Susceptible
B Susceptible
C (Source
Sand)
Susceptible
D Not Susceptible
E Susceptible
Hollywood
A Susceptible
B (Source Sand)
Susceptible
C Test Required
Four Hole Swamp
A Susceptible
B (Source
Sand)
Susceptible to Not Susceptible
C Susceptible
Fort Dorchester
A Susceptible
B Susceptible to
Test Required
C (Source Sand)
Susceptible

117
From this research, it was observed that clayey soils at both Sampit and Gapway
had Ic values greater than 2.6 indicating that soil is not susceptible to liquefaction. It is
noted that Layer C defined for Hollywood and Four Hole Swamp site show similar soil
behavior type (see Figure 3.9 in Section 3.2.3 and Figure 3.12 in Section 3.2.4). In
Hollywood, the clayey sand layer plots mostly in the susceptible zone but the average
data for all the three test locations (see Table 5.1) plot in the test required zone. While
comparing this data to Four Hole swamp, the clayey sand layer falls within the test
required zone and the average data used to represent Layer C plots in the susceptible
zone. Therefore, this layer at both sites can be considered as moderately susceptible to
liquefaction or additional testing may be required to determine susceptibility to
liquefaction.
Since the source sand layer for Fort Dorchester site was delineated above the
predicted water table, Ic and Bq values above the groundwater table was also analyzed for
the rest of the four sites. Even though these layers comprised of dense stiff sands and had
higher penetration resistance, soil layers above the groundwater table for SAM, HWD,
and FHS fell into the susceptible zone. For Gapway, however, the data point at 3 ft (0.9
m) falls in the test required zone because it lies on the boundary of a sand and clay layer.
Average Ic-Bq values used at this site indicated that the layer above the groundwater table
is susceptible to liquefaction. The CPT liquefaction susceptibility chart provided by
Hayati and Andrus (2008) is used to represent soil layers below the water table. However,
the water table depth may fluctuate depending on seasonal variability and hence the
charts used in this work have been shown to represent all the soil layers below the ground
surface. Soil above the groundwater table is generally not considered for liquefaction

118
analyses because liquefaction potential is best evaluated for cohesionless saturated soils.
However, the liquefaction potential for unsaturated sands is a valuable topic of research.
Note that there are a few differences in the method used herein compared to
Geiger (2010)‟s method. In comparison to Geiger‟s work, the liquefaction susceptibility
charts used in this thesis examined all the data points from the CPT test which was
conducted in close proximity to the DMT. The scatter obtained from these data points
gives a better visualization in characterizing the soil layers in the susceptibility chart.
However, the average Bq and Ic values for each layer at test locations for each site are
also presented in these charts similar to that of Geiger (2010). It was found that the soils
above the groundwater table were considered not susceptible according to Geiger (2010).
The average values, however, for topmost Layer A fell into the susceptible zone similar
to the results obtained in this thesis.
5.5 Comparison between Liquefaction and Non-Liquefaction Sites
The geotechnical investigation sites presented in this thesis can be used to
compare the results with Geiger (2010)‟s work. Geiger (2010) studied sites where no
liquefaction features have been observed; whereas, there is evidence of liquefaction at the
sites studied herein. Previous studies by Talwani et al. (1999) attribute to findings of
sandblows in the SCCP which show evidence of paleoliquefaction at SAM, GAP, HWD,
FHS and FD sites. The most prolific evidence of paleoliquefaction was observed at the
Hollywood site where Obermeir et al. (1985, 1986 and 1987) identified 162 liquefaction
features in this site associated with prehistoric earthquakes.

119
Similar to Geiger (2010), the source sand layer for each of the five sites exhibited
lower tip resistances than other susceptible layers and is located close to the ground
surface below the water table. The critical sand layer selected for liquefaction analysis at
the Hobcaw Barrow, Rest Area Ponds and the Lowcountry Sand and Gravel Site had
higher average tip resistances but lower Ic values in comparison to the source sand layer
at SAM, GAP, HWD, FHS and FD sites as shown in Table 5.3. The Lowcountry Sand
and Gravel site showed the highest average tip resistance values of 21.6 MPa while the
lowest average tip resistance of 1.52 MPa was observed at the Four Hole Swamp site.
Table 5.3 Summary of liquefaction susceptibility of source sand and critical sand layers
Type Site Test Location Average CPT data Liquefaction
Susceptibility Chart
qt
(MPa) Ic Bq
Liquefaction Sites
Sampit SAM-SCPT-1 6.8 1.92 0.000 Susceptible
Gapway GAP-SCPT-1 4.3 1.91 0.001 Susceptible Hollywood HWD-CPT-1 4.9 2.01 0.01 Susceptible
Four Hole Swamp
FHS-SCPT-1 1.52 3.28 0.03 Non-
Susceptible
Fort Dorchester
FD-SCPT-1 7.8 1.92 0.000 Susceptible
FD-SCPT-2 16.6 1.63 0.000
Non-
liquefaction Sites
Hobcaw Barrow
HB-1 8.7 1.66 0.006 Susceptible
Rest Area
Ponds SC-3 8.1 1.86 -0.002 Susceptible
Lowcountry
Sand and Gravel
SC-1 21.6 1.67 0.000 Susceptible
The average tip resistances for SAM, GAP and HWD sites were found to be 6.8,
4.3 and 4.9 respectively whereas the average qt for Hobcaw Barrow and Rest Area Ponds
site were found to be 8.7 and 8.1 respectively. At the Fort Dorchester site, the source sand

120
layer for FD-SCPT-1 showed an average tip resistance of 7.8 MPa while FD-SCPT-2
showed higher average qt value of 16.6 MPa. Four Hole Swamp was observed to have the
highest average Ic value of 3.28. The lowest average Ic value was measured as 1.63 at the
FD-SCPT-2 test location. Average Ic values of 1.66, 1.86 and 1.67 were measured at
Hobcaw Barrow, Rest Area Ponds and Lowcountry Sand and Gravel sites respectively.
GAP and HWD sites showed average Ic values equal to 1.91 and 2.01. Test locations
SAM-SCPT-1 and FD-SCPT-1 both showed similar average Ic values equal to 1.92.
While Ic was equal to less than 2.6 at all liquefiable and non-liquefiable sites, SCCP sites
and the sites presented by Geiger (2010) are all susceptible to liquefaction.
Table 5.4 Summary of average DMT data for source sand and critical sand layers
Type Site Average DMT data E
D
(MPa) ID K
D
Liquefaction
Sites
Sampit 26 1.4 10.9 Gapway 13.5 1.3 12
Hollywood 30 2.7 6 Four Hole
Swamp 14.7 1.5 4.1
Fort
Dorchester 73.5 2.5 17.4 61.5 2.5 15.2
Non-
LiquefactionSites
Hobcaw
Barrow 35 3.5 12
Rest Area
Ponds 62.2 3.8 42.9
Lowcountry
Sand and
Gravel 313.4 3.1 27.9

121
According to Table 5.4, the average ED, ID and KD values for the critical sand
layers at the non-liquefaction sites are higher than the source sand layers at the sites
where there is previous evidence of liquefaction. Since, the average tip resistances, ED,
KD and ID values measured at the liquefaction sites were lower, these sites are considered
to be more susceptible to liquefaction in comparison to Geiger (2010)‟s non-liquefaction
sites.
5.6 Summary
In this chapter, the soil layers at Sampit, Gapway, Hollywood, Four Hole Swamp
and Fort Dorchester sites were assessed for liquefaction susceptibility using the Ic-Bq
chart proposed by Hayati and Andrus (2008) based on the revised criteria recommended
by Robertson and Wride (1998). Ic and Bq values were plotted on the chart for the CPT
test location closest to the DMT to identify all the soil layers susceptible to liquefaction.
Average Ic-Bq values were determined for all soil layers at three CPT test locations for
each site which also included the CPT test location in close proximity to the DMT (See
Table 5.1). The source sand layers for all test locations at SAM, GAP, HWD and FD
were susceptible to liquefaction. The source sand layer at FHS-SCPT-1 was found to be
non-susceptible but the average values for FHS-SCPT-2 and -3 were in the susceptible
zone (See Table 5.2). At all sites, the charts indicated that layers above the groundwater
table were found to be potentially liquefiable; however, these layers need to be excluded
since the soil is unsaturated. Layers beneath the source sand were either too clay rich to
liquefy or were moderately susceptible and required additional testing to assess
susceptibility. The average values presented in the charts confirm that the source sand

122
layer at each of the five sites is susceptible to liquefaction. Although liquefaction has
occurred at the sites in the past, the sites are more likely to experience it again in the
future.
When comparing the results from the sites presented herein where there is
evidence of liquefaction to those sites studied by Geiger (2010) where there is no
evidence of liquefaction, it was observed that the critical sand layer identified by Geiger
(2010) from the CPT Susceptibility Charts at the Hobcaw Barrow, Rest Area Ponds and
the Lowland Sand and Gravel Site had higher average tip resistances, ED, ID and KD and
lower Ic, values than the source sands for Sampit, Gapway, Four Hole Swamp, Hollywood
and Fort Dorchester sites. Therefore, the sites presented herein were considered to be
more susceptible to liquefaction than the non-liquefaction sites.
5.7 Future Work
Geiger (2010) used the liquefaction susceptibility chart to determine the soil layer
most likely to liquefy at three sites located in the SCCP: Hobcaw Barony Borrow Pit,
Rest Area Ponds and the Lowland Sand and Gravel Site. Geiger (2010) used average Ic
and Bq values to characterize the soil layers at the test locations for each site. The
saturated soil layer closest to the ground surface that fell into the susceptible zone and
had lower penetration resistance was selected to evaluate liquefaction potential. Geiger
(2010) used several methods to find CRR based on Vs1cs, (N1)60cs and (qt1N)cs for
liquefaction potential analysis. The results from the study indicated that each of the three
sites did not have the potential for liquefaction during the 1886 Charleston earthquake.
However, Geiger (2010) found that the sites were most likely to liquefy during a future

123
earthquake estimated using the Magnitude (M) and Peak Ground Acceleration (PGA)
from the 2008 USGS Hazard Maps. Similar studies can be done at the five sites studied
herein to estimate the liquefaction potential.

124
CHAPTER 6
CONCLUSIONS
6.1 Summary
The main objective of this thesis was to study the soil behavior type of soils using
in situ test data, develop new site specific correlations between CPT, SPT and DMT
parameters and evaluate liquefaction susceptibility at the five geotechnical sites in the
SCCP where evidence of paleoliquefaction has been observed. Normalized Q and F
parameters from CPT tests and ED and ID parameters from the DMT tests were used to
determine the Soil Behavior type from the CPT Soil Behavior Chart (Robertson, 1990)
and DMT Soil Identification Chart data (Marchetti, 1980) for the five sites in the SCCP.
DMT, CPT and SPT parameters were used to develop correlations between KD and Q for
fine- grained soils, ED and Q for a wide range of soils, and ED and N60 for silts, clays and
sands in the SCCP. These correlations between the different test parameters were
compared to previously published correlations. Based on Robertson and Wride (1998)‟s
revised criteria, Ic and Bq parameters from CPT tests were used to assess the liquefaction
susceptibility from CPT charts developed by Hayati and Andrus (2008a) in the SCCP.
6.2 Major Findings
The following conclusions were drawn based on the work presented in this thesis:
125
6.2.1 Soil Behavior Type
The CPT data from the source sand layers at SAM, GAP, HWD, and FD sites fell
into Zones 5 and 6 of Robertson (1990)‟s CPT Soil Behavior Charts indicating
that these layers are composed of clean sands to silty sands to sandy silts and may
be susceptible to liquefaction. The source sand layer at FHS fell into Zones 4, 5
and 6 indicating a high percentage of fines and thus would not be considered
susceptible to liquefaction.
The DMT Soil Identification Chart (ASTM D6635) identified the source sand
layers at the SAM, HWD, FHS and FD to contain mostly medium to high density
sand and silt mixtures; whereas loose sands are generally susceptible to
liquefaction. Most of the data in the source sand layer at GAP plotted in the
clayey silty region indicating the presence of a significant amount of fines. These
results would indicate a low susceptibility to liquefaction.
Multiple methods such as CPT, DMT and USCS used herein should be used
together to provide a comprehensive characterization of the source sand.
The relative densities calculated from CPT data indicated that the source sand
layer consists of very loose to loose soil deposits for SAM, HWD and FHS,
medium soil deposits for GAP and medium to dense soil deposits for Fort
Dorchester. These densities were in good agreement with the laboratory
measurements of relative densities for source sands at SAM, HWD and FHS. The
DMT data predicted higher relative densities for all the sites.
Relative densities found from the new DMT soil behavior chart that was modified
based on laboratory measurements of relative densities for source sands at SAM,

126
HWD and FHS were found to be in good agreement with the relative densities
obtained from CPT data.
The soil behavior of the overburden layer and the current prediction of the water
table at the FD site indicated that sandblows are less likely to form during a future
seismic event, however, the overburden layer at SAM, GAP, HWD and FHS
indicated presence of clean sands to silty sands which would allow the ejection of
liquefied sands freely onto the surface.
6.2.2 Site Specific Correlations
The ratio, α, between ED and Q for the source sand layers for SAM, GAP and
HWD were found to be 3.9, 2.5 and 6.1 respectively which fell within the
observed range of 2<α<10 defined by Robertson (2009) for a wide range of soils.
However, α for Four Hole Swamp and Fort Dorchester sites were found to be 11.5
and 11.8 respectively and did not fall within this range. The combined data for all
source sands provided an α value of 4.4.
The relations between Q-KD for Sampit and Gapway were in good agreement
with previously published correlations by Robertson (2009) and Schneider (2008)
for insensitive and sensitive clays. The relations between Q and KD for
Hollywood and Four Hole Swamp were not in agreement with these published
correlations. More CPT and DMT data is needed to define site specific relations
for two sites. A new correlation for Q-KD was found for all source sands specific
to SCCP soils irrespective of ID and Ic parameters.

127
For Sampit, the ratio between ED and N60 for silts was found to be 3.2 which is
higher than Hajduk (2006)‟s ED/N60 value of 2.65, however, the source sand data
provided ED/N60 value of 2.7 along with the highest R2 value of 0.74. The ratio
between ED and (N1)60 for silts and source sands at Gapway was found to be 0.98
and 0.92 which is lower than Hajduk (2006)‟s ED/N60 value of 2.65. The ratios
ED/N60 at HWD and FHS for sands were found to be 5.6 and 9.9 which are higher
than both Hajduk (2006)‟s ED/N60 value of 2.43 and Tanaka and Tanaka (1999)‟s
ED/N value of 2.5. However, the ratios at HWD and FHS for source sands were
found to be higher but exhibited lower R2 values.
The ED/N, ED/N60, ED/(N1)60, ED/(N1)60cs ratios derived from correlations of
combined source sands for all the sites were found to be 3.7, 3, 2.1 and 2.1
respectively. The (N1)60cs-ED relation displayed a higher R2 value of 0.37 when
compared to existing R2 value of 0.33 previously determined by Williamson
(2013).
6.2.3 Liquefaction Susceptibility
From the liquefaction susceptibility chart developed by Andrus and Hayati
(2008a), it was found that the source sand layers for all test locations at SAM,
GAP, HWD and FD were susceptible to liquefaction. At FHS, the data for the
source sand layer at FHS-SCPT-1 was found to be non-susceptible but the
average values for FHS-SCPT-2 and -3 were found to be susceptible to
liquefaction.

128
The source sand layers at SAM, GAP, HWD, FHS and FD sites where there is
evidence of liquefaction, were generally found to have lower average qt, ID, KD
and ED values in comparison to the critical sand layers at Hobcaw Barrow, Rest
Area Ponds, and Lowcountry Sand and Gravel sites where no evidence of
liquefaction has been found. The critical sand layers at Rest Area Ponds and
Lowcountry Sand and Gravel had higher average blow counts than the source
sands for sites presented in this study. No SPT tests were performed in the Fort
Dorchester and Lowcountry Sand and Gravel site. From the comparisons made
above, it can be concluded that the source sand layers at the sites where there is
previous evidence of liquefaction are more susceptible to liquefaction than those
sites where there is no evidence of liquefaction.
6.3 Future Work
Further research can be conducted to evaluate the liquefaction potential at the five
sites in the SCCP using peak ground acceleration and magnitudes of two
earthquake scenarios from 2008 USGS Hazard Maps to evaluate liquefaction
potential similar to work by Geiger (2010) for the non-liquefaction sites.
This work can be used with the incoming results of Hasek (2014) on the CRR
found from triaxial tests and the petrography studies to better understand the
chemical and mechanical mechanisms (“aging”) at each site and their relation to
the CPT and DMT results.
129
REFERENCES
Amick, D.C. (1990). “Paleoliquefaction investigations along the Atlantic Seaboard with emphasis on the prehistoric earthquake chronology of coastal South Carolina.” Ph.D. thesis, University of South Carolina, Columbia.
Campanella, R.G. and Robertson, P.K. (1991). “Use and interpretation of a research dilatometer.” Soil Mechanics Series No. 127, University of British Columbia, Civil Engineering Department.
Doar, III, W.R. (2007). “Vibracore logs from the Fort Dorchester site”. South Carolina Department of Natural Resources, South Carolina Geological Survey (personal communication).
Gibbs, H.J., Holtz, W.G. (1957). “Research on determining the density of sands by
spoon penetration testing.” Proceedings of the 4th ICSMFE, 1, 35–39.
Grasso, S., Maugeri, M. (2006). “Using KD and Vs from seismic dilatometer (SDMT) for evaluating soil liquefaction.” Proceedings of the 2nd International Flat Dilatometer Conference, 281–288.
Hasek, M.J. (2013). “Liquefaction potential as a related to the aging of South Carolina outer coastal plain sands.” Ph.D. dissertation to be submitted to the University of South Carolina, Columbia, South Carolina.
Hu, K., Gassman, S.L., and Talwani, P. (2002a). “In-situ properties of soils at
paleoliquefaction sites in the South Carolina Coastal Plain.” Seismological Research Letters, 73(6), 964-978.
Idriss, I.M. and Boulanger, R.W. (2006). “Semi-empirical procedures for evaluating
liquefaction potential during earthquakes.” Soil Dynamics and Earthquake Engineering, 26, 115–130.
Kulhawy, F. and Mayne, P. (1990). "Manual on estimating soil properties for foundation
design." Report No. EL-6800, Electric Power Research Institute, Palo Alto, California, 306.
Lacasse, S. and Lunne, T. (1986). "Dilatometer tests in sand." Proceedings of In Situ '86,
ASCE Specialty Conference on "Use of In Situ Tests in Geotechnical Engineering." Virginia Tech, Blacksburg, Virginia, June, ASCE Geotechnical Special Publication, 6, 686-699.
130
Leon, E., Gassman, S.L., and Talwani, P. (2006). “Accounting for soil aging when assessing liquefaction potential.” Journal of Geotechnical and Geoenvironmental Engineering, ASCE, 132(3), 363-377.
Marchetti S. (1975). "A new in situ test for the measurement of horizontal soil
deformability." Proceedings Conference on "In Situ Measurement of Soil Properties", ASCE Specialty Conference, Raleigh, North Carolina, 2, 255 259.
Marchetti, S. (1980). "In situ tests by flat dilatometer." Journal of the Geotechnical Engineering Division, ASCE, 106 (GT3), March, 299-321.
Marchetti, S., Monaco, P., Totani, G., and Calibrese, M. (2001). “The flat dilatometer (DMT) in soil investigations (ISSMGE TC16).” Proceedings of the International Conference on In-Situ Measurement of Soil Properties and Case
Histories, Bali, Indonesia, 95–131.
Marchetti S. (2010). "Sensitivity of CPT and DMT to stress history and aging in sands for liquefaction assessment." Proceedings of the CPT 2010 International
Symposium, Huntington Beach, California
Marchetti S. (2011). Discussion of "CPT-DMT correlations" by Robertson P.K., Journal of Geotechnical and Geoenvironmental Engineering, ASCE, 137(4), April,
441-442.
Mayne, P.W., and Liao, T. (2004). “CPT-DMT interrelationships in piedmont residuum.” Proceedings of the 2nd International Conference on Geophysical and
Geotechnical Site Characterization, ISC-2, Porto, Portugal, Millpress, Rotterdam, the Netherlands, 345–350.
Monaco and Marchetti (2007). "Evaluating liquefaction potential by seismic dilatometer
(SDMT) accounting for aging." Proceedings of the 4th International Conference on Earthquake Geotechnical Engineering, Thessaloniki, Greece, June
Monaco and Schmertmann (2007). “Discussion of „Accounting for soil aging when assessing liquefaction potential‟ by Leon, E. et al.” Journal of Geotechnical and Geoenvironmental Engineering, ASCE 133(9), 1177-1178.
Monaco, P., Marchetti, S., Totani, G., and Calabrese, M. (2005). “Sand liquefiability assessment by flat dilatometer test.” Proceedings of the 16th ICSMGE, 4,
Osaka, Japan, 2693–2697.
Obermeier, S.F., Gohn, G.S., Weems, R.E., Gelinas, R.L., and Rubin, M. (1985). “Geologic evidence for recurrent moderate to large earthquakes near
Charleston, South Carolina.” Science, 277, January, 408-411.

131
Obermeier, S.F., Jacobson, R.B., Powars, D.S., Weems, R.E., Hallbick, D.C., Gohn, G.S., and Markewich, H.W. (1986). “Holocene and late Pleistocene earthquake
induced sand blows in coastal South Carolina.” Proceedings of the 3rd U.S. National Earthquake Engineering Conference, 197-208.
Obermeier, S.F., Weems, R.E., and Jacobson, R.B. (1987). “Earthquake-induced
liquefaction features in the coastal South Carolina region.” US Geological Survey Open File Report, 87, 504.
Rajendran, C.P. and Talwani, P. (1993). “Paleoseismic indicators near Bluffton, South
Carolina: An appraisal of their tectonic implications.” Geology, 21, 987-990.
Schmertmann, J.H. (1981). “A general time-related soil friction increase phenomenon.” Laboratory Shear Strength of Soil, ASTM Standard Test Procedure 740,
R.N. Yong and F.C. Townsend, Eds., American Society for Testing and Materials, 456-484.
Schmertmann, J.H. (1987). “Discussion of „Time-dependent strength gain in freshly
deposited sand,‟ by James K. Mitchell and Zoltan V. Solymar.” Journal of Geotechnical Engineering, ASCE, 113(2), 173-175.
Seed, H.B., and Idriss, I.M. (1971). “Simplified procedure for evaluating soil liquefaction potential” Journal of the Soil Mechanics and Foundation Division, 97(9), 1249 1273.
Seed, H.B., Tokimatsu, K., Harder, L.F., and Chung, R.M. (1985). „„The influence of SPT procedures in soil liquefaction resistance evaluations.‟‟ Journal of Geotechnical Engineering, ASCE, 111(12), 1425–1445.
Skempton, A.W. (1986). “Standard penetration test procedures and the effects in sands
of overburden pressure, relative density, particle size, aging, and overconsolidation.” Geotechnique, 36(3), 426-447.
Talwani, P., Amick, D.C. and Schaeffer, W.T. (1999). “Paleoliquefaction studies in the
South Carolina Coastal Plain.” Technical Report NUREG/CR-6619, Nuclear Regulatory Commission, Washington, D.C., 109.
Talwani, P., and Cox, J. (1985). "Paleoseismic evidence for recurrence of earthquakes near Charleston, South Carolina." Science, 229 (4711), 379-381.
Talwani, P., Hasek, M., Gassman, S.L,. Doar, III, W.R. and Chapman, A. (2011). “Discovery of a sand blow and associated fault in the epicentral area of the 1886 Charleston earthquake.” Seismological Research Letters, 82(4), July/August, 561-570.

132
Talwani, P., and Schaeffer, W.T. (2001). “Recurrence rates of large earthquakes in the South Carolina Coastal Plain based on paleoliquefaction data.” Journal of Geophysical Research, 106(B4), 6621–6642.
Tsai P., Lee D., Kung G.T., and Juang C.H. (2009). "Simplified DMT-based methods for evaluating liquefaction resistance of soils." Engineering Geology, 103, 13 22.
Tanaka, H. and Tanaka, M. (1998). "Characterization of sandy soils using CPT and
DMT". Soils and Foundations, Japanese Geotechnical Society, 38(3), 55-65.
Weems, R.E., and Lemon, Jr., E.M. (1984). “Geologic map of the Mount Holly Quadrangle, Berkeley and Charleston Counties, South Carolina.” US Geological Survey Geologic Quadrangle Map.” GQ-1579, scale, 1(24), 000.
Weems, R.E. and Lemon, Jr., E.M. (1986). “Geology of the Bethera, Cordesville, Huger, and Kitteredge Quadrangles, Berkeley County, South Carolina.” US Geological Survey, Miscellaneous Investigation Series, Map I-1854, 2 sheets.
Weems, R.E., Obermeier, S.F., Pavich, M.J., Gohn, G.S. and Rubin, M. (1986). “Evidence for three moderate to large prehistoric Holocene earthquakes near
Charleston, South Carolina.” Proceedings of the 3rd
U.S. National Conference on Earthquake Engineering, Charleston, South Carolina, Earthquake Engineering Research Institute, Oakland, California, 1, 3-13.
Weems, R.E., Lemon, E.M., and Nelson, M.S. (1997). ”Geology of the Pringletown, Ridgeville, Summerville, and Summerville Northwest Quadrangles, Berkeley, Charleston, and Dorchester Counties, South Carolina.” US Geological Survey, Miscellaneous Investigation Series, Map I-2502, 2 sheets.
Hu, K. (2001). “Magnitudes of Prehistoric Earthquakes from a Study of Paleoliquefaction Features” M.S. Thesis University of South Carolina, Columbia.
Williamson, J. (2013). “Liquefaction Potential of South Carolina Coastal Plain Soils using Dilatometer Data” M.S. Thesis University of South Carolina, Columbia. Geiger, A.J. (2010). “Liquefaction Analysis of Three Pleistocene Sand Deposits that did
not Liquefy During the 1886 Charleston, South Carolina Earthquake Based on Shear Wave Velocity and Penetration Resistance,” M.S. Thesis, Clemson University, Clemson, SC, 257 p.
Robertson P.K. (2009). "CPT-DMT correlations." Journal of Geotechnical and Geoenvironmental Engineering, ASCE, 135, 1762-1771.

133
Robertson, P.K., and Wride, C.E. (1998). „„Evaluating cyclic liquefaction potential using the cone penetration test.‟‟ Canadian Geotechnical Journal, Ottawa, 35(3),442–459.
Hayati, H., and Andrus, R.D. (2008). “Liquefaction Susceptibility of Fine-Grained Soils in Charleston, South Carolina Based on CPT.” Proc., 2008 GeoCongress: The Challenge of Sustainability of the Geoenvironment, held in New Orleans,
Louisiana, March 9-12, K.R. Reddy, M.V. Khire, and A.N. Alshawabkeh, eds., ASCE, Reston,VA,pp.327-334. Hajduk, E.L., Meng, J., Wright, W.B., and Zur, K.J. (2006). “Dilatometer Experience in
the Charleston, South Carolina Region.” Second International Conference on the Flat Dilatometer, Washington, D.C., April 2-5, 2006 Robertson, P.K. 1990. “Soil classification using the cone penetration test.” Canadian
Geotechnical Journal, 27 (1), 151-8. Robertson, P. K. (2010a) “Soil behavior type from the CPT: an update.” 2
nd International
Symposium on Cone Penetration Testing, CPT‟10, Huntington Beach, CA, USA.
Youd, T.L., and Idriss, I.M. (1997). “Summary report.” Proceedings of the NCEER Workshop on Evaluation of Liquefaction Resistance of Soils, Technical Report NCEER-97-0022, National Center for Earthquake Engineering
Research, State University of New York, Buffalo, 1–40.
Youd, T.L., Idriss, I.M., Andrus, R.D., Arango, I., Castro, G., Christian, J.T., Dobry, R., Finn,W.D.L., Harder, L.F., Hynes, M.E., Ishihara, K., Koester, J.P., Liao, S.C., Marcuson III,W.F., Martin, G.R., Mitchell, J.K., Moriwaki, Y., Power, M.S., Robertson, P.K., Seed, R.B., Stokoe II, K.H (2001). "Liquefaction
Resistane of Soils: Summary Report from the 1996 NCEER and 1998 NCEER/NSF Workshops on Evaluation of Liquefaction Resistance of Soils." Journal of Geotechnical and Geoenvironmental Engineering, ASCE, 127(10),October, 817-833.