use of gravity post-processing and accurate 3d … · total of 100 km of pc trough of the possible...
TRANSCRIPT

Proceedings World Geothermal Congress 2015
Melbourne, Australia, 19-25 April 2015
1
Use of Gravity Post-Processing and Accurate 3D Forward Modeling to Identify and
Characterize Geothermal Target
Yassine Abdelfettah1,2
and Eva Schill1
1 Institute of Nuclear Waste Disposal, Karlsruhe Institute of Technology KIT, D-76021 Karlsruhe, Germany
2 Institut de Physique du Globe de Strasbourg, CNRS UMR7516, University of Strasbourg, Strasbourg, France
[email protected], [email protected]
Keywords: Gravity, post-processing, pseudo-tomography, Permo-Carboniferous graben, Switzerland
ABSTRACT
Among others, geothermal heat flow anomalies in central Europe are linked to graben structures at the top of the crystalline
basement. For example, geochemical analyses or thermo-hydraulic models strongly suggest that these anomalies are linked to
hydrothermal circulation on local and regional level. These so-called Permo-Carboniferous troughs present a challenge in
exploration geophysics, since they show little difference in seismic impedance with respect to the crystalline basement. They are,
however, characterized by low mean density compared to the crystalline basement. To demonstrate the potential of the gravity
exploration method to characterize such as structures, accurate and detailed sensitivity analyses were conducted. Qualitative and
quantitative interpretation is obtained mainly applying gravity post-processing including accurate forward modeling and filtering.
The added value of the application of the data filtering and full 3D finite element simulation, to identify and characterize these
structures is emphasized by the following achievements.
The sensitivity study shows that i) the gravity effects generated by shallower structures can be identified and separated from those
generated by deeper one. ii) The application of the high- and band- pass Butterworth filter, allows for identifying the distribution of
the PC grabens in the crystalline basement. iii) 3D forward modelling using FE discretization, in conjunction with gravity filtering
using different wavelength of Butterworth filter is an important tool to characterize any density heterogeneities at depth.
1. INTRODUCTION
Several temperature anomalies in central Europe are proved to be linked to the hydrothermal advection phenomena occur in the
fractured zones (Illies and Greiner 1979; Kohl et al 2000; Pribnow and Schellschmidt 2000; Bächler 2003). In total, hydrothermal
advection has been estimated to contribute by about 75-85% to the temperature anomalies in the Upper Rhine Graben (URG,
Baillieux et al., 2013). In the western URG, upflow typically localizes along a N-S trending and westward dipping fault zones
(Kohl et al 2000; Bächler 2003; Baillieux et al., 2014). However, it is suspected from geochemical analyses that deeply situated
regional flow occurs in approximately E-W direction (Sanjuan et al., 2010). It is the objective of this study to develop a tool to
visualize such basement structures that provide potential flow paths for this regional flow. The tool is tested in the comparatively
simple geological setting of the Swiss molasses basin that reveals similar deep graben structures, but less complex overburden.
These Permo-Carboniferous (PC) structures are complex grabens that extend over tens of kilometers in width. For example, the
Northern Swiss trough striking approximately ENE-WSW and extending from E of Basel to the lake of Constance reveals Permian
to Stephanian basin fill (Matter 1987, Abdelfettah et al., 2014) and a multiphase tectonic history (e.g. Diebold et al., 1991). A
challenge on the localization of these structures using a seismic reflection is well reported in Marchant et al., (2005). These
difficulties are also documented in Seismic Atlas of Swiss Molasse Basin (Sommaruga et al., 2012), where on 16 seismic lines
across the entire Swiss molasses basin a total of about 465 km of the basement has been labelled “possible” PC trough identified by
seismic reflection in the basement and a total of 995 km are labeled “uncertain extension”, identified by intermediate reflection. A
total of 100 km of PC trough of the possible PC is confirmed by the wells Entlebuch-1 and Weiach-1. Thus, these established
criteria provide indication for PC, but need to be combined with further available information in order to establish whether or not
PC deposits are present.
Gravity and magnetics have been successfully used to characterize the distribution of inhomogeneities in the crystalline basement
in general (Edel 2004; Edel & Schulmann 2009) and information with respect to geothermal anomalies on regional (e.g. Baillieux
et al. 2013) and local studies (e.g. Guglielmetti et al. 2013). In previous study, gravity has been successfully applied according to
the Permo-carboniferious context to the Northern Swiss trough (Klingele & Schwendener 1984) and more recently to northern part
of Switzerland (Abdelfettah et al., 2014). Density measurements in deep boreholes (e.g. Weiach-1) show a mean density value of
2450 kg.m-3 whereas the mean density of the crystalline basement is about 2600-2700 kg.m-3. This important density contrast
increases the efficiency of the gravity method and makes it more suitable.
In this paper, we will show the sensitivity study results of Butterworth filter using advanced gravity forward modeling with finite
element modeling after analyzing residual anomalies by Butterworth filter having different wavelength. It is the same filter and the
same approach developed and used in Abdelfettah et al. (2014). The aim is to try to more understand the qualitative and
quantitative results provided by this filter. The sensitivity study is achieved using a complex 3D model, where realistic situations
were reproduced.
2. SET UP OF THE SENSITIVITY STUDY
In order to achieve quantitative sensitivity study of our preferential Butterworth filter, 3D geological model (40 x 30 km2) was built
(Fig.1). It comprises a background with homogeneous density, in which seven 3D bodies were embedded known to represent a

Abdelfettah and Schill
2
challenge for gravity methods. Those are characterized by density differences with respect to the homogenous background (see
numbers in Fig.1). Topography is equal to zero and gravity stations are placed at level z=0.
The filtering and modelling approach is described in detail by Abdelfettah et al. (2013, 2014) and includes simulation of 3D gravity
response for several possible anomalies presenting different density contrasts. In a second step, Butterworth filter (Butterworth,
1930) is applied on the obtained gravity response, typically the Bouguer anomaly, using different wavelength from high- to band-
pass. These residual anomalies are presented as pseudo-tomography, where the variation of the wavelength describes the lateral and
vertical variations of geological units.
Additionally to the sensitivity study discussed in Abdelfettah et al. (2013), in this study we investigate the possibility to quantify
size and geometry from pseudo-tomography. Near-surface bodies A1 to A3 represent possible Quaternary deposits at shallow depth
and a high differential density. Deep bodies represent the target structures for geothermal exploration, the PC graben structures.
Their density typically differs only slightly from the one of the crystalline basement (Klingele & Schwendener 1984). For the
bodies A1 and A3, the thickness is set to 0.1 km starting from an altitude of z=0. A3 is located above A7 and kept separate from it.
A2 can produce both short and long wavelength effects. Its dimension is x=9 x y=2.5 x z=0.1 km3 (Fig.1). With respect to effects a
long wave length filters, the bodies A5 to A7 have been built with the following criteria: 1) the depth of bottom of A5 is equal to
the depth of the top of A7, and also equal to the depth of top of A6. 2) the thickness of A6 is twice than the thickness of A7, and 3)
the thickness of A5 is equal to A7. A5 extends vertically from 1 to 3 km depth, A7 from 3 to 5 km depth and A6 from 3 to 7 km
depth. A4 extends from 1 to 4.5 km depth with a thickness of 0.5 km, only. Effects for short and long wavelengths are expected
according to the density contrasts of A1 to A7 with respect to the homogenous background, allows for quantifying the gravity
changes with dimensions as well as density contrasts (Fig.1b).
The 3D model (Fig.1) is meshed with gmsh (version 2.8.3) finite element meshing using tetrahedron shape (Geuzaine & Remacle
2009).
Figure 1: 3D geological model used to simulate gravity data used in the sensitivity study. a) View from S-SE and b) top view.
The bodies are numbered from A1 to A7, where values mean the density contrast in kg.m-3 used for each body. These
heterogeneities are embedded in homogeneous background having constant density. Representative resulting
meshing is also showed in a.
3. SIMULATION RESULTS AND DISCUSSION
3.1 Bouguer anomaly
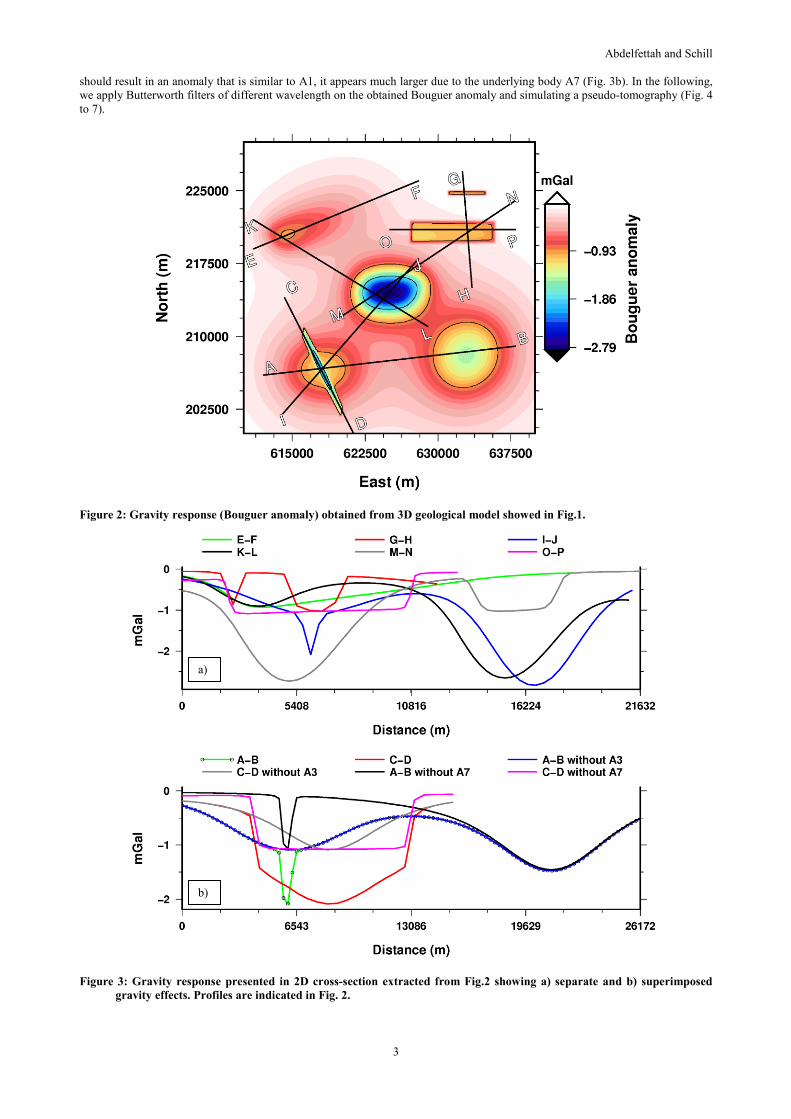
The Bouguer anomaly obtained from geological model discussed above is shown in Fig. 2. Their amplitudes range between 0 to -
2.83 mGal. It depends on the interplay of density contrast, depth and volume. In the following, we will first discuss the effect on
Bouguer gravity caused by the deep bodies A5 to A7 that are characterized by equal density differences of 100 kg m-3, but located
at different depth (Fig. 1 and 2). As expected, the largest anomaly reaching -2.83 mGal is observed for A5 (Fig. 2 and 3a). The
second largest anomaly of up to -1.6 mGal originates from A6 (Fig. 3b). The gravity effect of A7 is separated from A3 in Fig. 3b
(AB without A3). These bodies indicate the effect of depth and thickness of the volumes. Although characterized by a high
differential density of up to 270 mGal, A1 to A3 reveal gravity effects in the order of 1 mGal, only (Fig. 3a; GH and Fig. 3b; AB
without A7). The lateral extension of the bodies is relatively accurately defined by the wavelength of the anomaly that bound
laterally by the steep gradients. The effect of depth for a thin body is indicated by body A4 revealing a difference in Bouguer
anomaly of about 1 mGal for depths between 1 and 4.5 km.
Apart from the non-unique solution for potential methods by definition, the qualitative and/or quantitative interpretation of the
obtained Bouguer anomaly can lead to additional wrong conclusion when bodies are superposed (Fig. 1 to 3). Although A3 by itself
Abdelfettah and Schill
3
should result in an anomaly that is similar to A1, it appears much larger due to the underlying body A7 (Fig. 3b). In the following,
we apply Butterworth filters of different wavelength on the obtained Bouguer anomaly and simulating a pseudo-tomography (Fig. 4
to 7).
Figure 2: Gravity response (Bouguer anomaly) obtained from 3D geological model showed in Fig.1.
Figure 3: Gravity response presented in 2D cross-section extracted from Fig.2 showing a) separate and b) superimposed
gravity effects. Profiles are indicated in Fig. 2.
a)
b)

Abdelfettah and Schill
4
3.2 Residual anomalies
Different sets of Butterworth filter wavelengths are shown in Fig. 4 and 5. A first set of high-pass filters with wavelengths between
2.5 and 150 km visualize best the shallow structures in the smallest wavelength and show increasing contribution of the deeper
structures with increasing wavelength (Fig. 4). The lateral extension of A1 to A3 can be most accurately mapped in the < 7.5 km
wavelength filters (Fig. 4a-c). Starting from the smallest filter wavelength (2.5 km), we are imaging the top of A4 and A5 at 1 km
depth and in case of A5 are able to trace its geometry. Increasing the cut-off wavelengths from 2.5 km, we increase the contribution
from the parts of the bodies at > 1 km depth. The deepest part of A4 is, however, hardly mapped even at very large wavelength due
to its flat geometry (Fig. 4e and f). For the bodies with a depth to top > 1 km the geometry cannot be traced from high-pass filters.
The larger volume of A6 with respect to A7 appears already at short wavelength, in contrast to A7 that appears at wavelengths >30
km, only (Fig. 4).
Figure 4: Pseudo-tomography N1 obtained using high-pass Butterworth filter using the following wavelength; a) 2.5, b) 5, c)
7.5, d) 10, e) 50 and f) 150 km.
Abdelfettah and Schill
5
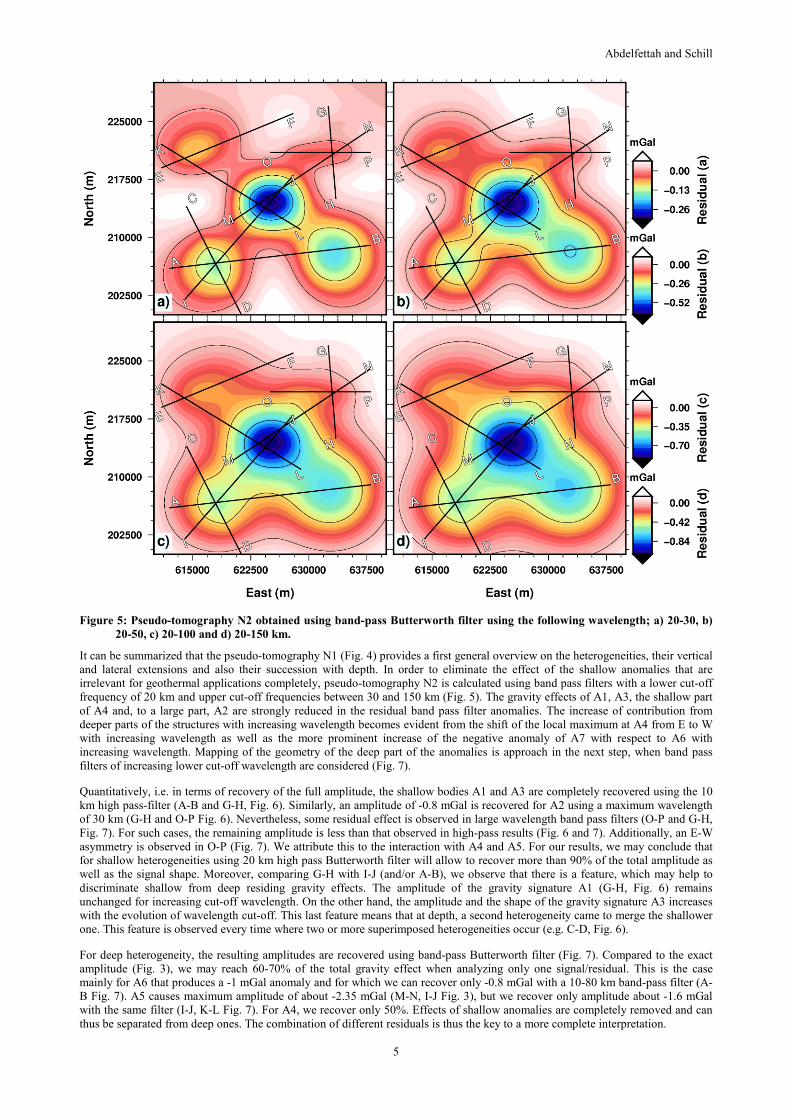
Figure 5: Pseudo-tomography N2 obtained using band-pass Butterworth filter using the following wavelength; a) 20-30, b)
20-50, c) 20-100 and d) 20-150 km.
It can be summarized that the pseudo-tomography N1 (Fig. 4) provides a first general overview on the heterogeneities, their vertical
and lateral extensions and also their succession with depth. In order to eliminate the effect of the shallow anomalies that are
irrelevant for geothermal applications completely, pseudo-tomography N2 is calculated using band pass filters with a lower cut-off
frequency of 20 km and upper cut-off frequencies between 30 and 150 km (Fig. 5). The gravity effects of A1, A3, the shallow part
of A4 and, to a large part, A2 are strongly reduced in the residual band pass filter anomalies. The increase of contribution from
deeper parts of the structures with increasing wavelength becomes evident from the shift of the local maximum at A4 from E to W
with increasing wavelength as well as the more prominent increase of the negative anomaly of A7 with respect to A6 with
increasing wavelength. Mapping of the geometry of the deep part of the anomalies is approach in the next step, when band pass
filters of increasing lower cut-off wavelength are considered (Fig. 7).
Quantitatively, i.e. in terms of recovery of the full amplitude, the shallow bodies A1 and A3 are completely recovered using the 10
km high pass-filter (A-B and G-H, Fig. 6). Similarly, an amplitude of -0.8 mGal is recovered for A2 using a maximum wavelength
of 30 km (G-H and O-P Fig. 6). Nevertheless, some residual effect is observed in large wavelength band pass filters (O-P and G-H,
Fig. 7). For such cases, the remaining amplitude is less than that observed in high-pass results (Fig. 6 and 7). Additionally, an E-W
asymmetry is observed in O-P (Fig. 7). We attribute this to the interaction with A4 and A5. For our results, we may conclude that
for shallow heterogeneities using 20 km high pass Butterworth filter will allow to recover more than 90% of the total amplitude as
well as the signal shape. Moreover, comparing G-H with I-J (and/or A-B), we observe that there is a feature, which may help to
discriminate shallow from deep residing gravity effects. The amplitude of the gravity signature A1 (G-H, Fig. 6) remains
unchanged for increasing cut-off wavelength. On the other hand, the amplitude and the shape of the gravity signature A3 increases
with the evolution of wavelength cut-off. This last feature means that at depth, a second heterogeneity came to merge the shallower
one. This feature is observed every time where two or more superimposed heterogeneities occur (e.g. C-D, Fig. 6).
For deep heterogeneity, the resulting amplitudes are recovered using band-pass Butterworth filter (Fig. 7). Compared to the exact
amplitude (Fig. 3), we may reach 60-70% of the total gravity effect when analyzing only one signal/residual. This is the case
mainly for A6 that produces a -1 mGal anomaly and for which we can recover only -0.8 mGal with a 10-80 km band-pass filter (A-
B Fig. 7). A5 causes maximum amplitude of about -2.35 mGal (M-N, I-J Fig. 3), but we recover only amplitude about -1.6 mGal
with the same filter (I-J, K-L Fig. 7). For A4, we recover only 50%. Effects of shallow anomalies are completely removed and can
thus be separated from deep ones. The combination of different residuals is thus the key to a more complete interpretation.

Abdelfettah and Schill
6
Figure 6: 2D cross-sections extracted from 3D gravity response showed in Fig. 4 obtained using high-pass Butterworth
filter.
4. CONCLUSION
The main results of this study can be summarized in the following points;
1) Butterworth filter has potential to separate gravity effects generated by shallow structures from those generated by deeper ones.
For gravity effect from shallow structures, the amplitude of the specific structure can be recovered up to 100% using only one
residual anomaly.
2) The application of the high- and band- pass Butterworth filter, allows for identifying the distribution of the deeper structures.
Utilization of sequential Butterworth filter as the pseudo-tomography allows recovering the deep gravity effect up to 100% of the
total anomaly. However, the interpretation of the only one residual anomaly, allows recovering maximum 60-70% of the exact
amplitude value.
3) 3D forward modeling using FE discretization, in conjunction with gravity filtering using different wavelength of Butterworth
filter and presented as a pseudo-tomography is an important tool to characterize density heterogeneities at depth.

Abdelfettah and Schill
7
Figure 7: 2D cross-sections extracted from 3D gravity response obtained using band-pass Butterworth filter.
REFERENCES
Abdelfettah Y., Schill E. & Kuhn P., 2014. Characterization of geothermally relevant structures at the top of crystalline basement in
Switzerland by filters and gravity forward modelling. Geophys. J. Int. 199, 226–241. doi: 10.1093/gji/ggu255.
Abdelfettah, Y. & Schill, E., 2013. Exploration of geothermally relevant structures in the crystalline basement of Switzerland using
gravity constrained by seismic data. Proceed. European Geothermal Congress, EGC 2013, Pisa, 1-9, ISBN 978-2-8052-0226-
1.
Bächler, D., 2003. Coupled Thermal-hydraulicchemical modeling at the Soultz-sous-Forêts HDR reservoir (France). PhD thesis,
Swiss Federal Institute of Technology, Switzerland.
Baillieux, P., Schill, E., Edel, J-B, & Mauri, G., 2013. Localization of temperature anomalies in the Upper Rhine Graben: insights
from geophysics and neotectonic activity, International Geology Review; 55, 1744.
Baillieux, P., Schill, E., Abdelfettah, Y. & Dezayes, C, 2014. Possible natural fluid pathways from gravity pseudo-tomography in
the geothermal fields of Northern Alsace (Upper Rhine Graben). Geothermal Energy, 2:16. doi:10.1186/s40517-014-0016-y.
Butterworth, S., 1930. On the theory of filter amplifiers, Wireless Engineering, 1, 536-541.
Diebold, P., Naef, H. & Ammann, M., 1991. Zur Tektonik der Zentralen Nordschweiz - Interpretation aufgrund regionaler Seismik,
Oberflächengeologie und Tiefbohrungen. Nagra Technischer Bericht NTB 90-41.
Edel, J.B., 2004. Structure et évolution du Fossé Rhénan, du Carbonifère à nos jours – apports de la géophysique: Bulletin de la
société d’histoire naturelle et d’éthnographie de Colmar, 65, 21–50.

Abdelfettah and Schill
8
Edel, J.B. & Schulmann, K., 2009. Geophysical constraints and model of the “Saxothuringian and Rhenohercynian subductions –
magmatic arc system” in NE France and SW Germany, Bulletin de la Société Géologique de France, 180, 545–558.
Geuzaine, C. & Remacle, J.-F., 2009. Gmsh: a three-dimensional finite element mesh generator with built-in pre- and post-
processing facilities, International Journal for Numerical Methods in Engineering, 79, 11, 1309-1331.
Guglielmetti, L., Comina, C., Abdelfettah, Y., Schill, E. & Mandrone, G., 2013. Integration of 3D geological modeling and gravity
surveys for geothermal prospection in an Alpine Region, Tectonophysics, 608, 1025–1036, doi: 10.1016/j.tecto.2013.07.012.
Illies, H.J. & G. Greiner, 1979. Holocene movements and state of stress in the rhinegraben rift system, Tectonophysics, 52, 349-
359.
Klingelé, E. & Schwendener, H., 1984. Geophysikalisches Untersuchungsprogramm Nordschweiz: Gravimetrische Messungen
81/82, Nagra, Baden.
Kohl, T., Bächler, D. & Rybach, L., 2000. Steps towards a comprehensive thermo-hydraulic analysis of the HDR test site Soultz-
sous- Forêts, Proc. World Geothermal Congress 2000, Kyushu-Tohoku, Japan, May–June 2000, 2671–2676.
Marchant, R., Ringgenberg, Y., Stampfli, G., Birkhäuser, P., Roth, P. & Meier, B., 2005. Paleotectonic evolution of the Zürcher
Weinland (northern Switzerland), based on 2D and 3D seismic data, Eclogae geologica Helvetica, 98, 345-362.
Matter, A., 1987. Faciesanalyse und Ablagerungsmilieus des Permokarbons im Nordschweizer Trog, Eclogae Geologicae
Helvetiae, 80, 345-367.
Pribnow, D. & Schellschmidt, R., 2000. Thermal tracking of upper crustal fluid flow in the Rhine Graben, Geophysical Research
Letters, 27, 1957-1960.
Sanjuan, B., Millot, R., Dezayes, C., and Brach, M., 2010. Main characteristics of the deep geothermal brine (5 km) at Soultz-sous-
Forets (France) determined using geochemical and tracer test data. Compte Rendue Geoscience 342, 546-559
Sommaruga, A., Eichenberger, U. & Marillier, F., 2012. Seismic Atlas of the Swiss Molasse Basin, Matér. Géol. Suisse, Géophys.
44.