use of ergonomics as a quality improvement tool in a ...r1998...2. improvement in bolt tightening on...
TRANSCRIPT

INTERNATIONAL JOURNAL OF OCCUPATIONAL SAFETY AND ERGONOMICS 1998, VOL. 4, NO. 1, 19-42
Use of Ergonomics as a Quality Improvement Tool in a Manual Assembly Task
Holly S. Wick Donald S. Bloswick
University of Utah, USA
This study attempted to identify a direct relationship between the design characteristics of a manually-assembled product, exposure to work-related ergonomic risk factors, and improvement in product quality. The study considered (a) Accessibility (ease of approach) and Guidance (ease of alignment and positioning) as Design Variables, (b) Shoulder Abduction, Trunk Lateral Flexion, Rate-Normalized Percentage of Maximal Voluntary Contraction (%MVC) of the Wrist Flexors, Wrist Extensors, and Deltoids, and Frequency of Attachment as Ergonomics Variables, and (c) Percentage of Attachment Too Loose, Too Tight, and Misaligned as Quality Variables. Postural data, surface EMG data, and quality data were collected from 10 participants performing four 10-min repetitive manual assembly tasks with plastic threaded nuts, bolts, flat parts, and open-box parts. Unobstructed accessibility of manually-assembled parts was associated with decreased exposure to awkward trunk posture, decreased activity of the wrist flexors and extensors, increased frequency of repetitive motion, and a decrease in the tendency to attach parts too loosely. Accessibility had no effect on misalignment defects as measured. Part guidance decreased the number of parts attached too tightly and aided in increasing the rate of assembly of parts when there was unobstructed access to parts.
quality ergonomics assembly design
1. INTRODUCTION
1.1. Statement of the ProblemA claim frequently made is that the use of ergonomic interventions in the workplace will lead to improvements in product quality (Budnick, Bloswick, & Brown, 1996; UAW-Ford, 1988). One contention is that if a product is designed such that assembly of the product allows for reduced risk of hazards related to ergonomics (ergonomic risk factors), then improved product quality will result. Anecdotal reports of quality improvement support the claim that ergonomic changes can improve product quality; however, there is little empirical data to reinforce the claim. It would, therefore, be beneficial to clarify the relationship between factors involved with ergonomic interventions and product quality improvement.
Correspondence and requests for reprints should be sent to Donald Bloswick, University of Utah, Department of Mechanical Engineering, 50 S Campus Center Dr., Rm. 2202, Salt Lake City, UT 84112-9208, USA. E-mail: < [email protected]> .

20 H.S. WICK AND D.S. BLOSWICK
Design for Assembly (DFA) features proposed by Boothroyd, Dewhurst, and K night (1994) such as unobstructed accessibility of assembly location and ease of alignment between parts being assembled have been shown to reduce the time necessary to assemble parts manually. Anecdotal reports by Boothroyd et al. (1994) of improved quality through use of Design for Assembly (DFA) principles lead to the hope that the product design features of accessibility and guidance can be used to improve product quality.
Ergonomic risk factors associated with manual assembly tasks include awkward postures, highly repetitive motions, and high levels of generated force. This study investigated the relationship between exposure to ergonomic risk factors and product quality defects due to improper assembly techniques related to product design.
1.2. Review of Literature
Much of the literature linking ergonomics with quality has been anecdotal. In one Swedish auto plant, jobs considered to have “ergonomics problems” yielded three times the rate of quality deficiencies than did jobs without ergonomics problems, and “designs involving difficult assembly ... accounted for the largest proportion of quality deficiencies” (Eklund, 1995, p. 17). The study covered a large number of jobs over a long time period, and identified that “fitting” problems during assembly accounted for at least 40% of the quality errors. Subjective judgments were used for the measures of both “jobs with ergonomic problems” and “quality deficiencies.” The author made no conclusion regarding which of the ergonomic factors studied were related most strongly to a higher rate of quality problems.
Whereas there have been no controlled studies directly linking product design changes to both an abatement of ergonomic risk factors and an improvement in product quality, there are some examples of reduction in exposure to ergonomic risk factors through product design changes and of improvement in quality due to a decrease in ergonomically-related hazards.
1.2.1. Reduction o f ergonomic risk factors through product design
Three reports in the literature discuss reduction of ergonomic risk factors through product design. Joines and Ayoub (1995) designed a method, Expanded Product Comparison (EPC), to employ DFA, by utilizing ergonomic intervention in the design process to reduce the risk of cumulative trauma disorders.
Christmansson (1994) confirmed that tasks requiring high amounts of repetitive manual force and accuracy proved to be more stressful than tasks not requiring as much force and accuracy.
Lindberg, Frisk-Kempe, Linderhed, and Eklund (1993) provided experimental data indicating that appropriate product design in sewing tasks reduced exposure to ergonomic risk factors associated with neck flexion and trapezius activity.

ERGONOMICS AS A QUALITY IMPROVEMENT TOOL IN MANUAL ASSEMBLY 21
1.2.2. Quality improvement through ergonomics
A number of authors have published information relating ergonomics to improvements in product quality. Changes made to an inspection station for medical and surgical needle packaging (Benden, 1994) including improving visibility and lighting, enlarging and raising the work surface, improving chair adjustability, and adding a footrest and viewing apparatus led to a 20% decrease in “quality assurance rejections” of defective needles. Wick (1987) reported a 136% improvement in production resulting from changes in worker posture in response to ergonomically-related workstation improvements. Parenmark, Malmkvist, and Ortengren (1993) documented a design of a new chainsaw-manufacturing facility in which workstation design, work pace, work technique, wage systems, and work shift organization were modified to reduce employee turnover, injuries, and absenteeism.
A reduction in direct material handling and labor costs in a sheet metal fabrication plant was reported (Priest, 1985) through “ergonomic changes” such as minimization of material handling and lifting, improved tool rack design, job enlargement, and facilitation of material location through a color-coded plant layout.
Redesign of tasks requiring stressful lifting, frequent and long reaches, contact with sharp workstation edges, and limited clearances in the performance of surgical device assembly was reported to allow for a “10-12 percent increase in productivity” and a “greatly diminished” rate of medical problems (Longmate & Hayes, 1990, p. 30). Enhancing workstation adjustability has also led to “higher quality” computer disk drive assemblies for a major computer manufacturer (Beck, 1986).
Other reports relating ergonomics to quality improvement include
1. reduction or elimination of tolerance defects in air conditioner blower shafts and aesthetic defects in automotive instrument panels through modifications in workstation lifting and reach requirements (Naderi & Baggerman, 1992);
2. improvement in bolt tightening on electronic relay assemblies through training and increased availability of replacement tools (Nenzen, 1987);
3. improved product quality and productivity in a manual drilling operation on “small parts” through use of a height-adjustable vice that reduced stress on the hands and arms (Getty, 1993); and
4. improvement in the defect detection rate in glass inspection through increased inspector training and changes in workstation lighting and background color (Konz, Peterson, & Joshi, 1981).
1.3. Purpose of the Study
The purpose of this study was to attempt to identify a direct relationship between improvement in the design characteristics of a manually-assembled product (i.e., accessibility and guidance [or ease of alignment] as among those identified by Boothroyd et al., 1994), a decrease in the exposure to ergonomic risk factors involved in the manual assembly, and a resulting improvement in the quality of the manually-assembled product.
22 H.S. WICK AND D.S. BLOSWICK
2. STUDY DESIGN
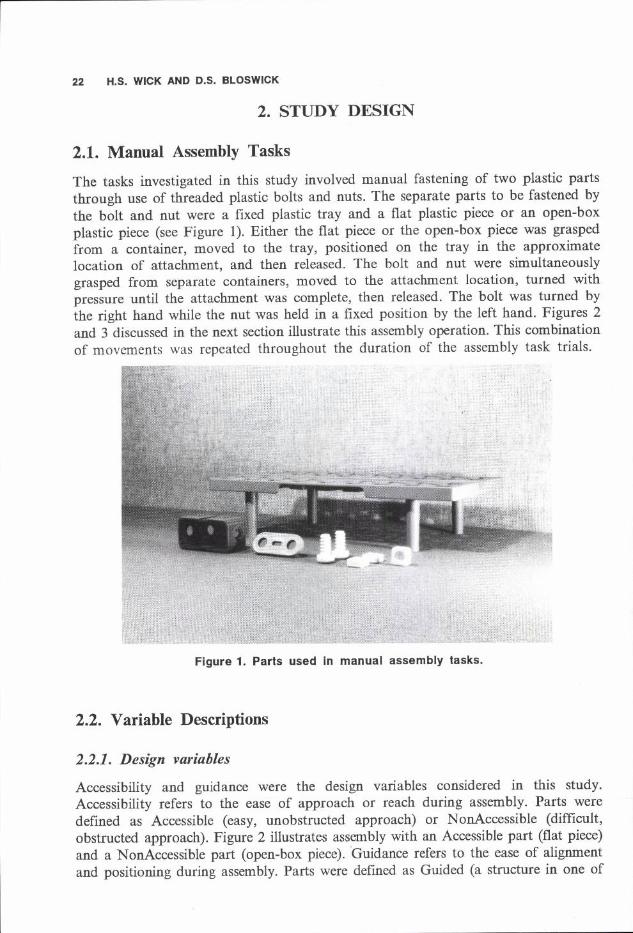
2.1. Manual Assembly TasksThe tasks investigated in this study involved manual fastening of two plastic parts through use of threaded plastic bolts and nuts. The separate parts to be fastened by the bolt and nut were a fixed plastic tray and a flat plastic piece or an open-box plastic piece (see Figure 1). Either the flat piece or the open-box piece was grasped from a container, moved to the tray, positioned on the tray in the approximate location of attachment, and then released. The bolt and nut were simultaneously grasped from separate containers, moved to the attachment location, turned with pressure until the attachment was complete, then released. The bolt was turned by the right hand while the nut was held in a fixed position by the left hand. Figures 2 and 3 discussed in the next section illustrate this assembly operation. This combination of movements was repeated throughout the duration of the assembly task trials.
Figure 1. Parts used in manual assembly tasks.
2.2. Variable Descriptions
2.2.1. Design variables
Accessibility and guidance were the design variables considered in this study. Accessibility refers to the ease of approach or reach during assembly. Parts were defined as Accessible (easy, unobstructed approach) or NonAccessible (difficult, obstructed approach). Figure 2 illustrates assembly with an Accessible part (flat piece) and a NonAccessible part (open-box piece). Guidance refers to the ease of alignment and positioning during assembly. Parts were defined as Guided (a structure in one of

ERGONOMICS AS A QUALITY IMPROVEMENT TOOL IN MANUAL ASSEMBLY 23
the parts positioned and aligned the part as it was being assembled to a second part) or NonGuided (no structure in any of the parts being assembled created a positioning or aligning effect). Figure 3 illustrates assembly with a Guided part and a NonGuided part. Thus, the four assembly task conditions were Accessible/Guided (AG), Accessible/Non Guided (AN), NonAccessibie/Guided (NG), and NonAccess- ible/NonGuided (NN).
a
Figure 2. (a) Accessible (flat) and (b) NonAccessible (open-box) assembly.

24 H.S. WICK AND D.S. BLOSWICK
a
Figure 3. (a) Guided and (b) NonGuided assembly.
2.2.2. Ergonomic variables
Six ergonomic variables were considered in this study: Maximum Shoulder Abduction Angle (Shoulder Abduction), Maximum Trunk Lateral Flexion Angle (Trunk Lateral Flexion), Rate-Normalized Percentage of the Maximal Voluntary Contraction of the Wrist/Finger Extensor Group (%MVC Extensors), Rate-Normalized Percentage of the Maximal Voluntary Contraction of the Wrist/Finger Flexor Group (%MVC Flexors), Rate-Normalized Percentage of the Maximal Voluntary Contraction of the

Deltoid Group (%MVC Deltoids), and the Number of Attachments Completed (Frequency of Attachments). These variables are defined in more detail later.
The Shoulder Abduction Angle and Trunk Lateral Flexion Angle are shown in Figure 4.
The method of determination of %MVC Extensors, %MVC Flexors, and %MVC Deltoids is discussed in the section on data analysis in the Methods Section.
ERGONOMICS AS A QUALITY IMPROVEMENT TOOL IN MANUAL ASSEMBLY 25
Figure 4. (a) Shoulder Abduction Angle and (b) Trunk Lateral Flexion Angle.
2.2.3. Quality variables
Four variables describing the quality of the assembled product were investigated in this study: Percentage of Attachments Too Loose (PATL), Percentage of Attachments Too Tight (PATT), Percentage of Attachments Misaligned (PAM), and Tolerance of Tightness Index (TTI). The PATL is the ratio of the number of attachments tightened by the participant requiring less than 16 inch-ounces (10.0 Ncm) of torque to dislodge to the total number of attachments completed. The PATT is the ratio of the number of attachments tightened by the participant requiring more than 32 inch-ounces (20.1 Ncm) of torque to dislodge to the total number of attachments completed. The PAM is the ratio of the number of attachments tightened by the participant such that the angle between the nut edge and the base edge of the attachment location was greater than 10 degrees to the total number of attachments completed. The TTI was considered to be the sum of the PATL and the PATT.
2.3. Hypotheses Under Investigation
The relationship between product design, exposure to ergonomic risk factors, and product quality was investigated.
The following hypotheses were investigated for Shoulder Abduction, Trunk Lateral Flexion, %MVC Extensors, %MVC Flexors, %MVC Deltoids, PATL PATT PAM and TTI: ’
26 H.S. WICK AND D.S. BLOSWICK
Ha: //AG < //AN; //AG < //NG; //AG # //NN; //A N ^ //NG; //AN < //N N ; //N G < //N N
and the following hypotheses were investigated for Frequency of Attachments:
Ha: //AG > //AN; //AG > //NG; /A G ^ //NN; //AN ^ //NG; //AN > //NN; //NG > //NN.
In some cases inequalities were used because the interaction effects of Guidance and Accessibility are not predictable.
2.4. Conditions of Rejection of the Null Hypotheses
For the purposes of this study, a 95% interval of confidence was required in order for the null hypotheses to be rejected. Thus, for an analysis for which all assumptions were met and which yielded a /7-value of less than or equal to .05, the null hypotheses under consideration could be rejected.
3. METHODS
3.1. Participants
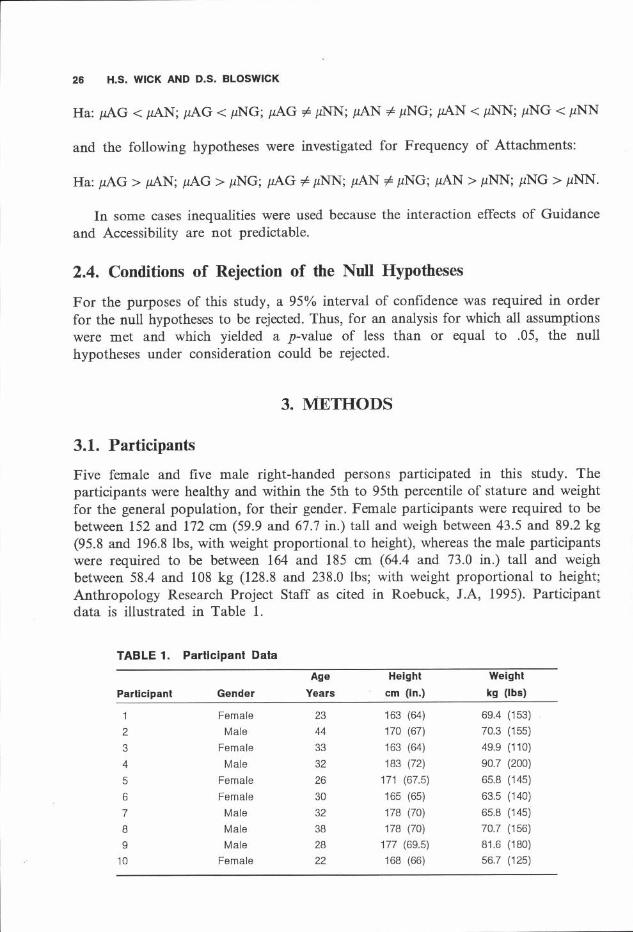
Five female and five male right-handed persons participated in this study. The participants were healthy and within the 5th to 95th percentile of stature and weight for the general population, for their gender. Female participants were required to be between 152 and 172 cm (59.9 and 67.7 in.) tall and weigh between 43.5 and 89.2 kg (95.8 and 196.8 lbs, with weight proportional, to height), whereas the male participants were required to be between 164 and 185 cm (64.4 and 73.0 in.) tall and weigh between 58.4 and 108 kg (128.8 and 238.0 lbs; with weight proportional to height; Anthropology Research Project Staff as cited in Roebuck, J.A, 1995). Participant data is illustrated in Table 1.
TABLE 1. Participant Data
Participant GenderAge
YearsHeight
cm (in.)Weight kg (lbs)
1 Female 23 163 (64) 69.4 (153)
2 Male 44 170 (67) 70.3 (155)
3 Female 33 163 (64) 49.9 (110)
4 Male 32 183 (72) 90.7 (200)
5 Female 26 171 (67.5) 65.8 (145)
6 Female 30 165 (65) 63.5 (140)
7 Male 32 178 (70) 65.8 (145)
8 Male 38 178 (70) 70.7 (156)9 Male 28 177 (69.5) 81.6 (180)
10 Female 22 168 (66) 56.7 (125)

ERGONOMICS AS A QUALITY IMPROVEMENT TOOL IN MANUAL ASSEMBLY 27
3.2. Apparatus
In order to quantify the performance of each participant in the assembly tasks of this study, videographic, electromyographic, and quality parameter data were collected. A schematic of the instrumentation used in this study is shown as Appendix A.
3.2.1. Videographic data collection equipment and materials
Maximum Shoulder Abduction and Trunk Lateral Flexion angles were determined using a video analysis with retro-reflective markers on the participant’s joint centers of interest (neck, shoulder, elbow, hip, low back). (Joint locations are discussed in more detail later). Shoulder Abduction and Trunk Lateral Flexion joint angles were determined through use of a protractor placed on the screen.
3.2.2. Electromyographic equipment and materials
Surface EMG data of the activity of the Wrist/Finger Flexor, Wrist/Finger Extensor, and Deltoid muscle groups of the right arm of each participant were collected using Silver/Silver-Chloride Surface Electrodes. For each muscle group, one set of two differential electrodes and one ground electrode were placed on the participant. All EM G data were collected at 500 Hz and amplified with a Measurement Systems Incorporated (MSI) preamplifier and amplifier, and processed through an analog/ digital data acquisition board.
3.2.3. Quality parameter data collection equipment
Each participant was asked to perform assembly tasks involving attachment of plastic nuts, bolts, flat pieces, and open-box pieces to a plastic tray. All of the pieces used in the assembly tasks in this study were from Meccano Erector Junior number 1720 toy sets. Figure 1 shows a photograph of the pieces used in the study. At the completion of each task, the attachments were assessed for alignment and tightness. Alignment was assessed via a clear plastic template, which had an angle of 10 degrees drawn in permanent black ink on it. Tightness was assessed with a PROTO 6104 torque screwdriver set first at 16 inch-ounces (10.0 Non), then at 32 inch-ounces (20.1 Ncm).
3.2.4. Organization o f equipment
The participants performed the tasks of this study while seated at a workstation with a surface height of 76 cm (30 in.) and a workpiece height of 97 cm (38 in.). The video camera was placed at the rear of the participant in order to be perpendicular to the posterior frontal plane of the participant’s body.
3.3. Experimental Procedure
3.3.1. Determination o f data collection duration
Using Methods-Time Measurement (MTM) data it was estimated that one attachment would take 4.4 s to complete. In order to maintain an allowance for reaction time

28 H.S. WICK AND D.S. BLOSWICK
and response time to trigger the data collection, the data collection duration was set at 6.0 s.
3.3.2. Data collection
Participants were not allowed to observe the performance of any other participant. A 1-hr practice session was completed by each participant on the day prior to data collection. The practice session involved having the participant practice each of the four assembly tasks required in this study until the participant was comfortable with his or her ability at the tasks. Feedback regarding the participant’s ability to maintain the tightness specifications (i.e., tightness between 16 inch-ounces [10.0 Ncm] and 32 inch-ounces [20.1 Ncm] of torque required to loosen attachment) was given after every four attachments.
Upon arrival for testing the following day, the participant was prepared for data collection in the following manner:
1. Hemispherical retro-reflective markers were taped on the skin superficial to the posterior aspect of the centers of the participant’s right gleno-humeral joint, elbow joint, hip joint, sacro-lumbar joint, and the seventh cervical vertebra (at the base of the neck).
2. The skin of the participant located superficial to the right wrist/finger extensor group, the right wrist/finger flexor group, and the right deltoid group was cleaned with soap and water, shaved, and slightly abraded. Two EMG electrodes were placed on the skin superficial to each of the muscle bellies and one on the skin of the ear as a ground.
3.3.3. Obtaining baseline EMG data
In order to determine the baseline or “resting” average value of the EMG signal from each muscle group, one 5-s trial of EMG data was collected with the participant’s hand resting comfortably in the participant’s lap, while the participant was seated at the workstation.
3.3.4. Obtaining maximal voluntary contraction data
In order to determine the average value of the maximal voluntary contraction, the participant was asked to complete three separate 5-s trials of maximal isometric contractions:
1. one trial of maximal isometric wrist flexion, with the upper arm held down at the participant’s side (no flexion or abduction of the shoulder), the elbow in 90 degrees of flexion, the wrist in 30 degrees of extension, and the fingers loosely flexed;
2. one trial of maximal isometric wrist extension, with the shoulder, elbow and fingers, in the same positions as noted in point 1 but the wrist in 30 degrees of flexion; and

3. one trial of maximal isometric deltoid contraction (arm abduction), with the upper arm held in 30 degrees of shoulder abduction and the elbow in 90 degrees of flexion.
ERGONOMICS AS A QUALITY IMPROVEMENT TOOL IN MANUAL ASSEMBLY 29
For each of the three trials, the arm of the participant was restrained to resist movement.
After completion of the baseline and maximal voluntary contraction trials, the participant was allowed to rest for approximately 10 min before beginning the assembly task trials.
3.3.5. Assembly task trial data collection
Each participant completed a 10-min assembly task trial under each of the four conditions: Accessible/Guided Parts (AG); Accessible/NonGuided Parts (AN); Non- Accessible/Guided Parts (NG); and NonAccessible/NonGuided Parts (NN). Figures 2 and 3 illustrate these conditions. The condition order was determined through random number assignment.
Within each 10-min assembly task trial, five 6-s sample trials of EMG data werecollected at 500 Hz, one sample after the first 2 min of the assembly task trial andone sample at every 2-min interval thereafter. Following the completion of each10-min trial, the Quality Variable data were collected and the participant wasinstructed to rest. The number of attachments completed by the participant for thetrial was counted and recorded. The following data were recorded: (a) the number ofattachments misaligned (i.e., angle of greater than 10 degrees between nut edge and
ase edge), (b) the number of attachments too loose (loosening torque less than 16mch-ounces [10.0 Nan]) measured with the PROTO torque screw-driver, and (c) thenumber of attachments too tight (loosening torque greater than 32 ’ inch-ounces [20.1 Ncm]).
3.4. Data Analysis
3.4.1. Postural parameters
For each of the five 6-s sample “EMG trials” within each 10-min assembly task trial, the maximum values of shoulder abduction and trunk lateral flexion (Figure 4) were obtained from the videotape. For each participant and for each assembly task condition, the mean maximum angles of shoulder abduction and trunk lateral flexion for the block of five 6-s trials were calculated.
3.4.2. EMG parameters
The EMG parameters of interest in this study were the average percentage of maximal voluntary contraction (%MVC) attained by the muscles (wrist/finger flexors, wrist/finger extensors, and deltoids) during the assembly tasks. A rate-normalized average value of the %MVC was used to account for inter- and intraparticipant differences in rate of attachment. The normalized %MVC was calculated for the assembly task trial data as

30 H.S. WICK AND D.S. BLOSWICK
Mean Assembly Task EMG — Mean Baseline EMG Normalized %MVC = ------ M ean MVC EMG - Mean Baseline EMG
where,Mean Baseline EMG = average EMG of 1.5-4.5 s of the 5-s baseline test,Mean MVC EMG = average EMG of 1.5-4.5 s of the 5-s maximum test,Mean Assembly Task EMG = average EMG of 1.5-4.5 s of the 6-s sample period
during the assembly task.
The normalized %MVC was then normalized again for the rate of attachments completed by the participant for the given assembly task condition as
Normalized %MVCRate-Normalized %MVC = Number of Attaehements Completed ( >
3.5. AssumptionsThe following assumptions were made relative to the data collection equipment:
1. The markers were placed on the joint centers such that the centroid of the marker indicated the centroid of the joint center.
2. There was minimum skin movement during the assembly tasks so the markers were consistently over the joint centers.
3. Body segments moved in the frontal plane.4. The protractor and monitor combination resulted in no parallax errors when
measuring joint angles.5. There was optimum EMG signal with minimal cross-talk from other muscle
groups, and no appreciable electrical noise.
3.6. Statistical Analysis MethodsA statistical analysis was completed using the Statistics Package for the Social Sciences (SPSS) Version 4.1. A multivariate analysis of variance (MANOVA) was done using Pillai’s trace, Hotelling’s trace, and Wilks’ lambda as the test statistics, with the Design Variables (Accessibility and Guidance) as the independent variables and the Ergonomics Variables (Shoulder Abduction, Trunk Lateral Flexion, %MVC Extensors, %MVC Flexors, %MVC Deltoids, and Frequency of Attachment) as dependent variables. A MANOVA was done using Pillai’s trace, Hotelling s trace, and Wilks’ lambda as the test statistics, with the Design Variables as the independent variables and the Quality Variables (PATL and PATT) as the dependent variables. An analysis of variance (ANOVA) was completed for the Design Variables as the independent variables and TTI as the dependent variable. The separate ANOVA was run for TTI because the TTI was the sum of PATL and PATT and, thus, was not considered to be independent from PATL and PATT. A multiple regression analysis was completed for the Ergonomics Variables as the independent variables and the

Quality Variables (PATL, PATT, and TTI) as the dependent variables. A two-tailed Mest was completed for Accessibility as the independent variable and PAM as the dependent variable. Determination of misalignment was possible for the NonGuided test conditions only. Because of this limitation, the cells for the Guided test conditions were empty and a MANOVA could not be accomplished with accuracy. Thus, the Quality Variable of PAM was analyzed separately by comparison of means using a /-test.
Conditions for independence and randomness were met by all of the data. Normality was assessed using normal plots of the actual data values versus the expected normal values and detrended-normal plots of the actual data values versus the deviation from the normal. Lack of normality was indicated through observation of a lack of linearity on the normal plot, appearance of a trend on the detrended plot, or both.
Homogeneity-of-variance was assessed using Cochran’s C test and Bartlett’s Box F test. Lack of homogeneity of variance was indicated by a probability of greater than .05 for both of the two tests. For the variables for which normality and homogeneity-of-variance were not observed, the data were transformed before analysis could be carried out. This procedure is presented in Appendix B.
A Pearson’s product moment correlation matrix was used to determine if the groups of dependent variables (i.e., the Ergonomics Variables and the Quality Variables) could be considered as one variable (or univariate).
3.7. Study Limitations
The following can be considered as limitations in this study:
1. The variables investigated were only a small portion of all possible ergonomic risk factors.
2. Participant ability and motivation levels were not considered.3. Learning time (1 hr) may not have been adequate.4. This study dealt only with changes in the design of two components of the
assembled product and did not consider, for example, participant hand size.5. The postural variables of Shoulder Abduction and Trunk Lateral Flexion were
investigated from a two-dimensional observation.6. The limits of looseness and tightness of attachment were chosen arbitrarily.7. There were only 10 participants involved in the study.
4. RESULTS
4.1. Relationships of Ergonomics With Design
The results of the MANOVA for the independent variables of Design and dependent variables of Ergonomics is shown in Table 2. There was no interaction effect between Design Variables and the Ergonomics Variables as a group (^(6,24) = 1.516,P .215). When Frequency of Attachment was considered alone, there was an interaction effect between the Design and Ergonomics Variables (F(l,29) = 5.782,
ERGONOMICS AS A QUALITY IMPROVEMENT TOOL IN MANUAL ASSEMBLY 31

32 H.S. WICK AND D.S. BLOSWICK
TABLE 2. MANOVA for Ergonomics Variables With Design Variables
Design Variables/Assembly Task Conditions
Ergonomics Variables AG AN NG NN df F P
Shoulder Abduction (deg)M 39.75 39.12 42.44 40.12
(SD) (23.56) (10.99) (11.19) (13.39)
Accessibility 1,29 0.194 .663
Guidance 1,29 0.123 .728
Interaction 1,29 0.041 .841
Trunk Lateral Flexion (deg)M 7.25 12.25 18.11 16.50
(SD) (3.28) (4.28) (8.62) (6.30)
Accessiblity 1,29 12.274 .002
Guidance 1,29 0.617 .438
Interaction 1,29 2.349 .136
%MVC ExtM -0.61 -0 .60 -0 .0 8 -0.41
(SD) (0.40) (0.45) (0.45) (0.33)
Accessiblity 1,29 6.402 .017
Guidance 1,29 1.260 .271
Interaction 1,29 1.456 .231
%MVC FlexM -0 .67 -0 .5 8 -0 .2 4 -0 .40(SD) (0.37) (0.31) (0.27) (0.23)
Accessiblity 1,29 8.501 .007
Guidance 1,29 0.128 .723
Interaction 1,29 1.388 .248
%MVC DeltM -0 .8 8 -0 .80 -0 .3 9 -0 .8 2(SD) (0.46) (0.36) (0.34) (0.32)
Accessiblity 1,29 3.189 .085
Guidance 1,29 1.870 .182
Interaction 1,29 3.870 .059
Frequency of AttachmentM 55.88 46.12 25.78 32.38
(SD) (9.98) (12.73) (5.61) (9.81)
Accessiblity 1,29 41.599 .000
Guidance 1,29 0.215 .646
Interaction 1,29 5.782 .023
All VariablesAccessiblity 6,24 6.645 .000
Guidance 6,24 0.614 .717
Interaction 6,24 1.516 .215
Notes. Means and standard deviations of %MVC are for transformed data. AG— Accessible/Guided, AN— Accessible/NonGuided, NG— NonAccessible/Guided, and NN— NonAccessible/NonGuided.
ERGONOMICS AS A QUALITY IMPROVEMENT TOOL IN MANUAL ASSEMBLY 33
p = .023). Accessibility did have a main effect on the Ergonomics Variables as a group (.F(6,24) = 6.645, p < .001), Accessibility had a main effect on Trunk Lateral Flexion (F(l,29) = 12.274, p = .002), %MVC Extensors CF(1,29) = 6.402, P = -017), %MVC Flexors (F(1,29) = 8.501, p = .007), and Frequency of Attachment (F(l,29) = 41.599, p < .001), when considered individually.
There was no main effect of Guidance on any of the Ergonomics Variables, when considered individually or as a group (7^(6,24) = .614, p = .717).
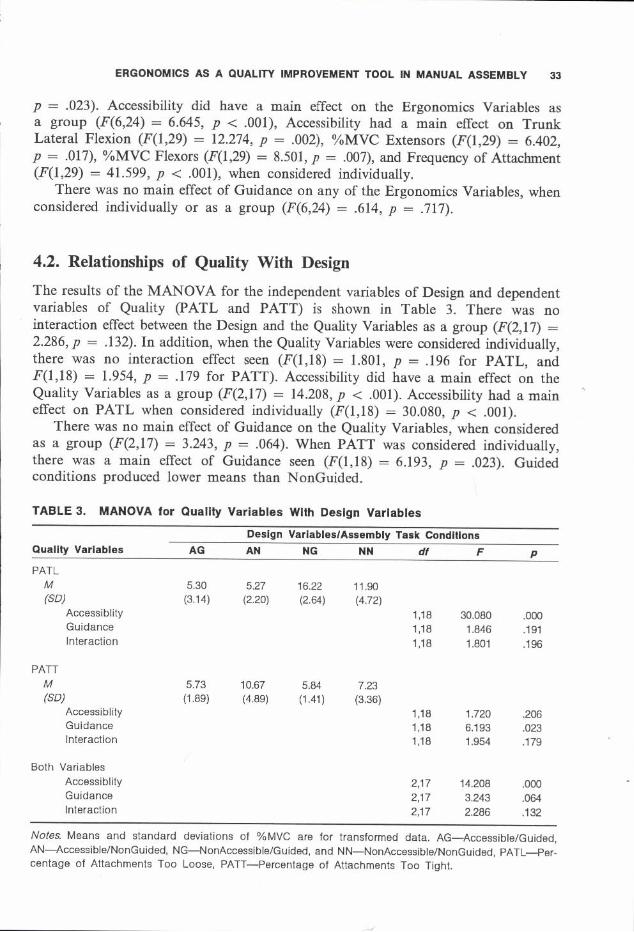
4.2. Relationships of Quality With Design
The results of the MANOVA for the independent variables of Design and dependent variables of Quality (PATL and PATT) is shown in Table 3. There was no interaction effect between the Design and the Quality Variables as a group (F(2,17) = 2.286, p = .132). In addition, when the Quality Variables were considered individually, there was no interaction effect seen ( f ( l ,1 8 ) = 1.801, p = .196 for PATL, and ^(1,18) = 1.954, p = .179 for PATT). Accessibility did have a main effect on the Quality Variables as a group (F(2,17) = 14.208, p < .001). Accessibility had a main effect on PATL when considered individually (F(l,18) = 30.080, p < .001).
There was no main effect of Guidance on the Quality Variables, when considered as a group (F(2,17) = 3.243, p = .064). When PATT was considered individually, there was a main effect of Guidance seen (F(l,18) = 6.193, p = .023). Guided conditions produced lower means than NonGuided.
TABLE 3. MANOVA for Quality Variables With Design Variables
Design Variables/Assembly Task Conditions Quality Variables AG AN NG NN df F p
PATLM 5.30 5.27 16.22 11.90(SD) (3.14) (2.20) (2.64) (4.72)
Accessiblity 1,18 30.080 .000Guidance 1,18 1.846 .191Interaction 1,18 1.801 .196
PATTM 5.73 10.67 5.84 7.23(SD) (1.89) (4.89) (1.41) (3.36)
Accessiblity 1,18 1.720 .206Guidance 1,18 6.193 .023Interaction 1,18 1.954 .179
Both VariablesAccessiblity 2,17 14.208 .000Guidance 2,17 3.243 .064Interaction 2,17 2.286 .132
Notes. Means and standard deviations of %MVC are for transformed data. AG-—Accessible/Guided,AN— Accessible/NonGuided, NG— NonAccessible/Guided, and NN— NonAccessible/NonGuided, PATL— Percentage of Attachments Too Loose, PATT--Percentage of Attachments Too Tight.
34 H.S. WICK AND D.S. BLOSWICK
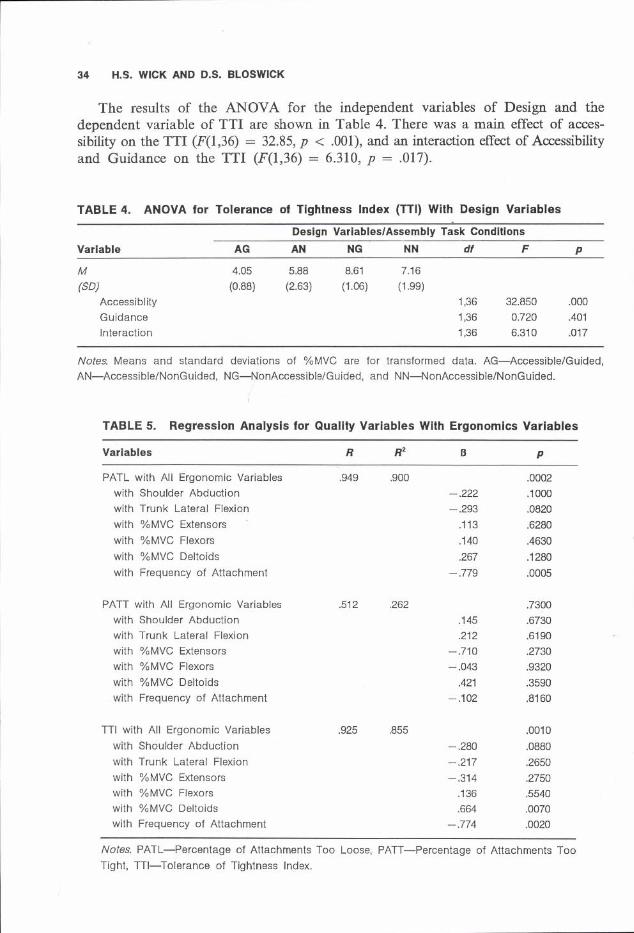
The results of the ANOVA for the independent variables of Design and the dependent variable of TTI are shown in Table 4. There was a main effect of accessibility on the TTI (^(l ,36) = 32.85, p < .001), and an interaction effect of Accessibility and Guidance on the TTI (^(1,36) = 6.310, p = .017).
TABLE 4. ANOVA for Tolerance of Tightness Index (TTI) With Design Variables
Design Variables/Assembly Task Conditions
Variable AG AN NG NN df F P
M 4.05 5.88 8.61 7.16(SD) (0.88) (2.63) (1.06) (1.99)
Accessiblity 1,36 32.850 .000Guidance 1,36 0.720 .401Interaction 1,36 6.310 .017
Notes. Means and standard deviations of %MVC are for transformed data. AG— Accessible/Guided, AN— Accessible/NonGuided, NG— NonAccessible/Guided, and NN— NonAccessible/NonGuided.
TABLE 5. Regression Analysis for Quality Variables With Ergonomics Variables
Variables R R2 I) P
PATL with All Ergonomic Variables .949 .900 .0002with Shoulder Abduction -.222 .1000with Trunk Lateral Flexion -.293 .0820with %MVC Extensors .113 .6280with %MVC Flexors .140 .4630with %MVC Deltoids .267 .1280with Frequency of Attachment -.779 .0005
PATT with All Ergonomic Variables .512 .262 .7300with Shoulder Abduction .145 .6730with Trunk Lateral Flexion .212 .6190with %MVC Extensors -.710 .2730with %MVC Flexors -.043 .9320with %MVC Deltoids .421 .3590with Frequency of Attachment -.102 .8160
TTI with All Ergonomic Variables .925 .855 .0010with Shoulder Abduction -.280 .0880with Trunk Lateral Flexion -.217 .2650with %MVC Extensors -.314 .2750with %MVC Flexors .136 .5540with %MVC Deltoids .664 .0070with Frequency of Attachment -.774 .0020
Notes. PATL— Percentage of Attachments Too Loose, PATT— Percentage of Attachments Too Tight, TTI— Tolerance of Tightness Index.

ERGONOMICS AS A QUALITY IMPROVEMENT TOOL IN MANUAL ASSEMBLY 35
4.3. Relationships of Quality With Ergonomics
The results of the multiple regression analysis for Ergonomics Variables as independent variables and the tightness Quality Variables as dependent variables is shown in Table 5. The multiple regression analysis revealed that the effect of differences in the means of the Ergonomics Variables resulted in statistically significant differences in the means of PATL (p < .001) and TTI (p = .001), but not PATT (p = .730). The variability of the Ergonomics Variables can explain 90% of the variability of PATL and 86% of the variability of the TTI.
4.4. Relationship of PAM With Accessibility
The two-tailed Mest completed for the independent variable of Accessibility on the dependent variable of PAM indicates that Accessibility showed no effect on the PAM for the experimental condition of NonGuidance (/(l 8) = —.07, p = .942).
4.5. Considering All Dependent Variables as Univariate
Table 6 shows the correlation matrix obtained for the Ergonomics Variables and the Quality Variables. One unexpected result was that of only a moderately positive correlation between %MVC Deltoids and Shoulder Abduction (r = .317). A much higher positive correlation would be expected. This correlation between %MVC Deltoids and Shoulder Abduction is significant at the p < .05 level and Shoulder Abduction did correlate more highly with %MVC Deltoids than with any other dependent variable.
TABLE 6. Correlation Matrix for Ergonomics Variables and Quality Variables
ShAbd TLFIx %Exl %Flex %Delt Freq PATL PATT PAM TTI
ShAbd 1.000TLFIx 0.291 1.000%Ext 0.125 0.531 + 1.000%Flex 0.123 0.428 + 0.716 + 1.000%Delt 0.317* 0.405 + 0.751 + 0.652 + 1.000Freq -0.151 -0 .647 + -0.561 + 0.442 + -0 .280 1.000PATL -0 .200 0.370* 0.632 + 0.536 + 0.357* -0.747 + 1.000PATT 0.020 -0.098 -0.391* -0.148 -0 .127 0.252 -0.260 1.000PAM -0 .148 0.184 -0 .185 0.050 -0 .030 0.085 -0.226 0.273 1.000TTI -0 .148 0.357* 0.496 + 0.464 + 0.356* -0 .627 + 0.888 + 0.193 -0 .067 1
Notes. p < .05, + p < .01. ShAbd— Shoulder Abduction, TLFIx— Trunk Lateral Flexion, %Ext— %MVC Extensors, %Flex— %MVC Flexors, %Delt— %MVC Deltoids, Freq— Frequency of Attachment, PATL— Percentage of Attachments Too Loose, PATT— Percentage of Attachments Too Tight, PAM— Percentage of Attachments Misaligned, TTI— Tolerance of Tightness Index.
An examination of the correlation matrix seems to indicate that it is not possible to consider the Ergonomics Variables as one group, nor the Quality Variables as one

36 H.S. WICK AND D.S. BLOSWICK
group, as within their groups, these sets of dependent variables did not all highly correlate with each other.
5. DISCUSSION
This study identified a possible direct relationship between improvement in the design characteristics of a manually-assembled product (accessibility of assembly), a significant decrease in the exposure to ergonomic risk factors (awkward trunk posture, increased forearm muscle activity), and a significant improvement in the quality of the product (tightness of part attachment within required specifications).
5.1. Effects of Part Accessibility on Ergonomics and Quality
This study supports the notion that designing a product for good accessibility during assembly will reduce ergonomic stresses and improve quality. Accessibility was found to have a significant positive effect on (a) the Ergonomics and Quality Variables investigated as a group, (b) individual Ergonomics Variables of Trunk Lateral Flexion, %MVC Extensors, %MVC Flexors, and Frequency of Attachments, and (c) the individual Quality Variable of PATL. Thus, for the tasks investigated in this study, good accessibility resulted in a decrease in maximal trunk lateral flexion and muscular activity of the wrist/finger extensors and flexors, an increase in the number of attachments made, and a decrease in the tendency for attachments to be tightened below the specified torque.
Trunk Lateral Flexion, %MVC Extensors, and %MVC Flexors, all correlated highly positively with each other and highly negatively with Frequency of Attachment. PATL correlated highly positively with %MVC Extensors, %MVC Flexors, and highly negatively with Frequency of Attachments. These relationships, coupled with the result that variability in PATL could explain 90% of the variability in Ergonomics Variables as a group, indicate that those tasks that required increased muscular activity of the wrist/finger extensors and flexors and yielded a decreased total number of attachments could produce an increase in the number of those attachments tightened too loosely. Interestingly, Accessibility had no significant effect on the number of misaligned attachments (PAM). The number of nuts misaligned on the bottom of the tray was not affected by obstruction of the bolt by the attachment part. This may be related to the required method of assembly. The participants’ right hands were placed to turn the bolts on the top of the tray and were, thus, “exposed” to the obstruction; their left hands aligned the nuts on the bottom of the tray and were not exposed to the obstruction.
5.2. Effects of Part Guidance on Ergonomics and Quality
The results of this study did not strongly support the contention that inclusion of guides in parts to be assembled will help to improve product quality. Guidance, as defined in this study, had no significant effect on the Ergonomics Variables considered as a group or individually, or on the Quality Variables considered as a group. The
ERGONOMICS AS A QUALITY IMPROVEMENT TOOL IN MANUAL ASSEMBLY 37
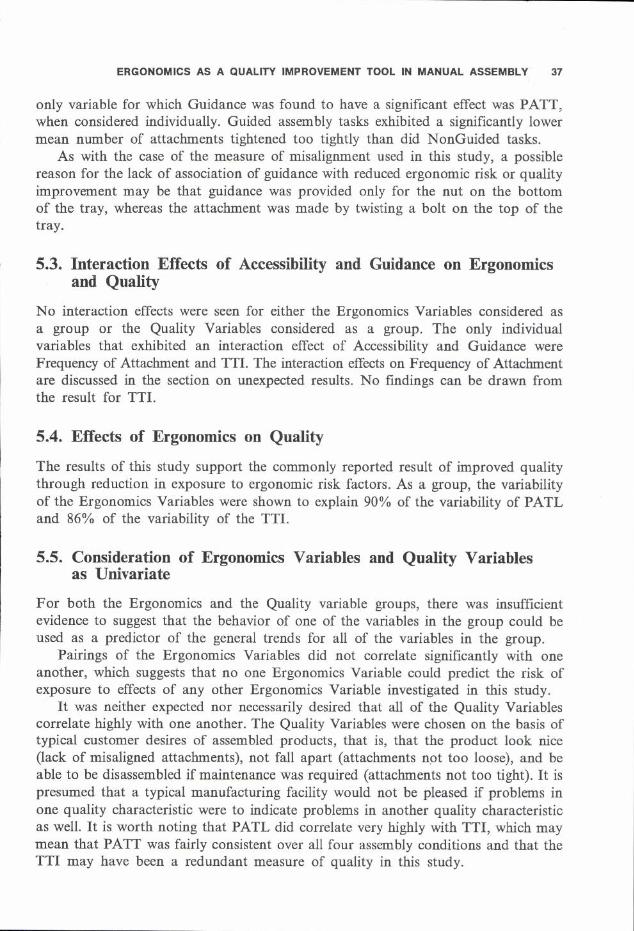
only variable for which Guidance was found to have a significant effect was PATT, when considered individually. Guided assembly tasks exhibited a significantly lower mean number of attachments tightened too tightly than did NonGuided tasks.
As with the case of the measure of misalignment used in this study, a possible reason for the lack of association of guidance with reduced ergonomic risk or quality improvement may be that guidance was provided only for the nut on the bottom of the tray, whereas the attachment was made by twisting a bolt on the top of the tray.
5.3. Interaction Effects of Accessibility and Guidance on Ergonomics and Quality
No interaction effects were seen for either the Ergonomics Variables considered as a group or the Quality Variables considered as a group. The only individual variables that exhibited an interaction effect of Accessibility and Guidance were Frequency of Attachment and TTI. The interaction effects on Frequency of Attachment are discussed in the section on unexpected results. No findings can be drawn from the result for TTI.
5.4. Effects of Ergonomics on Quality
The results of this study support the commonly reported result of improved quality through reduction in exposure to ergonomic risk factors. As a group, the variability of the Ergonomics Variables were shown to explain 90% of the variability of PATL and 86% of the variability of the TTI.
5.5. Consideration of Ergonomics Variables and Quality Variables as Univariate
For both the Ergonomics and the Quality variable groups, there was insufficient evidence to suggest that the behavior of one of the variables in the group could be used as a predictor of the general trends for all of the variables in the group.
Pairings of the Ergonomics Variables did not correlate significantly with one another, which suggests that no one Ergonomics Variable could predict the risk of exposure to effects of any other Ergonomics Variable investigated in this study.
It was neither expected nor necessarily desired that all of the Quality Variables correlate highly with one another. The Quality Variables were chosen on the basis of typical customer desires of assembled products, that is, that the product look nice (lack of misaligned attachments), not fall apart (attachments not too loose), and be able to be disassembled if maintenance was required (attachments not too tight). It is presumed that a typical manufacturing facility would not be pleased if problems in one quality characteristic were to indicate problems in another quality characteristic as well. It is worth noting that PATL did correlate very highly with TTI, which may mean that PATT was fairly consistent over all four assembly conditions and that the TTI may have been a redundant measure of quality in this study.

38 H.S. WICK AND D.S. BLOSWICK
5.6. Unexpected Results
Two of the Ergonomics Variables—Frequency of Attachment and Shoulder Abduction—displayed unexpected results and, thus, are of special interest.
5.6.1. Frequency o f attachment
The mean value of Frequency of Attachment was shown to be greater for the Accessible/Guided assembly task condition than for the Accessible/NonGuided condition (which was expected) but was shown to be less for the NonAccessible/ Guided condition than for the NonAccessible/NonGuided condition (which was not expected). This latter result indicates that, for the conditions in this study, a guide did help to increase the assembly rate when access was not obstructed, but did not help to increase the assembly rate when access was obstructed. (This result is born out by the interaction effect of Accessibility and Guidance exhibited for Frequency of Attachment).
Thus, under the conditions of this study, the assembly tasks with unobstructed access would lead to higher productivity, with guidance having a mixed effect on productivity.
5.6.2 Shoulder abduction
The other unanticipated result was that of only a moderately positive correlation between Shoulder Abduction and %MVC Deltoids (although the correlation of Shoulder Abduction with %MVC Deltoids was the highest for any variable). A highly positive correlation between the angle of shoulder abduction and the level of deltoid muscular activity is expected (Chaffin & Andersson, 1991). A number of factors may have, either separately or in combination, created this result.
First, the EMG data obtained in this study were for dynamic contractions and the velocity of the arm may have varied within and between participants. The single postural configuration of the shoulder and elbow joints in which the maximal voluntary contraction (MVC) trial data were obtained was not necessarily the same as the postures in which the EMG data were collected in the assembly task trials.
Second, it is possible that the MTM may have underestimated the time required to attach parts in the NonAccessible assembly conditions (which some participants found extremely difficult). The use of the EMG value averaged over the middle 4.0 s of attachment time was intended to serve as a measure of participant exposure to muscular activity for a constant exposure duration. Thus, even if the participants could not complete an entire attachment within the allotted data collection period the %MVC measurements can still be considered valid for the purposes of this study.
Finally, all of the participants in this study were required to use the same nonadjustable workstation, which could explain why the participants used such varied upper arm postures.
ERGONOMICS AS A QUALITY IMPROVEMENT TOOL IN MANUAL ASSEMBLY 39
6. CONCLUSIONS
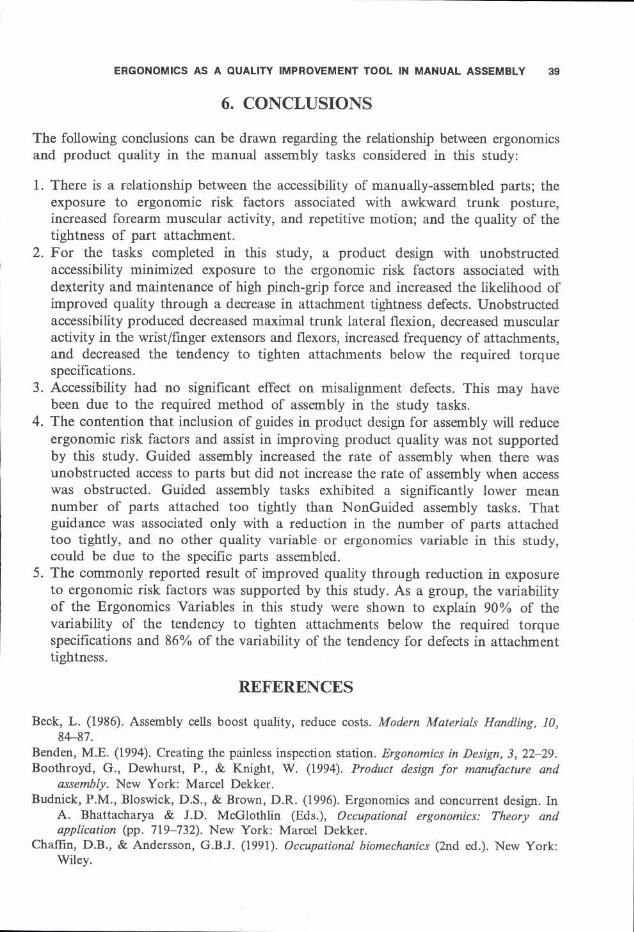
The following conclusions can be drawn regarding the relationship between ergonomicsand product quality in the manual assembly tasks considered in this study:
1. There is a relationship between the accessibility of manually-assembled parts; the exposure to ergonomic risk factors associated with awkward trunk posture, increased forearm muscular activity, and repetitive motion; and the quality of the tightness of part attachment.
2. For the tasks completed in this study, a product design with unobstructed accessibility minimized exposure to the ergonomic risk factors associated with dexterity and maintenance of high pinch-grip force and increased the likelihood of improved quality through a decrease in attachment tightness defects. Unobstructed accessibility produced decreased maximal trunk lateral flexion, decreased muscular activity in the wrist/finger extensors and flexors, increased frequency of attachments, and decreased the tendency to tighten attachments below the required torque specifications.
3. Accessibility had no significant effect on misalignment defects. This may have been due to the required method of assembly in the study tasks.
4. The contention that inclusion of guides in product design for assembly will reduce ergonomic risk factors and assist in improving product quality was not supported by this study. Guided assembly increased the rate of assembly when there was unobstructed access to parts but did not increase the rate of assembly when access was obstructed. Guided assembly tasks exhibited a significantly lower mean number of parts attached too tightly than NonGuided assembly tasks. That guidance was associated only with a reduction in the number of parts attached too tightly, and no other quality variable or ergonomics variable in this study, could be due to the specific parts assembled.
5. The commonly reported result of improved quality through reduction in exposure to ergonomic risk factors was supported by this study. As a group, the variability of the Ergonomics Variables in this study were shown to explain 90% of the variability of the tendency to tighten attachments below the required torque specifications and 86% of the variability of the tendency for defects in attachment tightness.
REFERENCES
Beck, L. (1986). Assembly cells boost quality, reduce costs. Modern Materials Handling, 10, 84-87.
Benden, M.E. (1994). Creating the painless inspection station. Ergonomics in Design, 3, 22-29.Boothroyd, G., Dewhurst, P., & Knight, W. (1994). Product design fo r manufacture and
assembly. New York: Marcel Dekker.Budnick, P.M., Bloswick, D.S., & Brown, D.R. (1996). Ergonomics and concurrent design. In
A. Bhattacharya & J.D. McGlothlin (Eds.), Occupational ergonomics: Theory and application (pp. 719-732). New York: Marcel Dekker.
Chaffin, D.B., & Andersson, G .BJ. (1991). Occupational biomechanics (2nd ed.). New York: Wiley.

40 H.S. WICK AND D.S. BLOSWICK
Christmansson, M. (1994). Repetitive and manual jobs—Content and effects in terms of physical stress and work-related musculoskeletal disorders. International Journal o f Human Factors in Manufacturing, 4 (3), 281-292.
Eklund, J.A.E. (1995). Relationships between ergonomics and quality in assembly work. Applied Ergonomics, 26(1), 15-20.
Getty, R.L. (1993). The integration of ergonomics in a safety improvement program: Design and implementation of an ergonomics initiative. In Proceedings o f the Human Factors and Ergonomics Society 37th Annual Meeting (pp. 891-895). Santa Monica, CA: Human Factors and Ergonomics Society.
Joines, S., & Ayoub, M.A. (1995) Design for assembly: An ergonomic approach. Industrial Engineering, 1, 42—4-6.
Konz, S., Peterson, G., & Joshi, A. (1981). Reducing inspection errors. Quality Progress, 7, 26.Lindberg, M., Frisk-Kempe, K., Linderhed, H., & Eklund, J. (1993). Musculoskeletal disorders,
posture and EMG temporal pattern in fabric-seaming tasks. International Journal o f Industrial Ergonomics, 11, 267-276.
Longmate, A.R., & Hayes, T J. (1990). Making a difference at Johnson & Johnson: Some ergonomic intervention case studies. Industrial Management, 32(2), 27-30.
Naderi, B., & Baggerman, M. (1992). The result of ergonomics at the forefront in manufacturing: Quality. Industrial Engineering, 4, 42—46.
Nenzen, B. (1987). Replace worn tools. Working Environment, 22—23.Neter, J., Wasserman, W., & Kutner, M.H. (1985). Applied linear statistical models: Regression,
analysis o f variance, and experimental design (2nd ed.). Homewood, IL: Richard D. Irwin.Parenmark, G., Malmkvist, A.-K., & Ortengren, R. (1993). Ergonomic moves in an engineering
industry: Effects on sick leave frequency, labor turnover and productivity. International Journal o f Industrial Ergonomics, 11, 291-300.
Priest, J.W. (1985). Ergonomic changes in workplace can improve the productivity of production operations. Industrial Engineering, 7, 40—43.
Roebuck, J.A., Jr. (1995). Anthropometric methods: Designing to f i t the human body. Santa Monica, CA: Human Factors Society.
UAW-Ford National Joint Committee on Health and Safety. (1988). Fitting jobs to people: The UAW-Ford ergonomics process implementation guide. Ann Arbor, MI: University of Michigan.
Wick, J.L. (1987). Productivity and ergonomic improvement of a packaging line: A case study. In S.S. Asfour (Ed.), Trends in Ergonomics/Human Factors IV (pp. 97-102). B.Y. North-Holland: Elsevier Science.

ERGONOMICS AS A QUALITY IMPROVEMENT TOOL IN MANUAL ASSEMBLY
Appendix A
Schematic of Workstation
f Camera (NEC T1-23A
CCD)
rV _
Monitor(Sony)
VCR(Panasonic)
DataReduction
r. Data Translation
A-D Converter (DT 2801 -A) J
Interface
VP 110 (Motion Analysis
Inc)
Data Collection Computer
Central Processor
Trigger Mechanicsm
(Tone 500 Hz)
Amp RMS Converter
(MSI)
Pre-Amp(MSI)
-------OSurface Electrodes
-------O
Surface Electrodes-Reference
42 H.S. WICK AND D.S. BLOSWICK
Appendix B
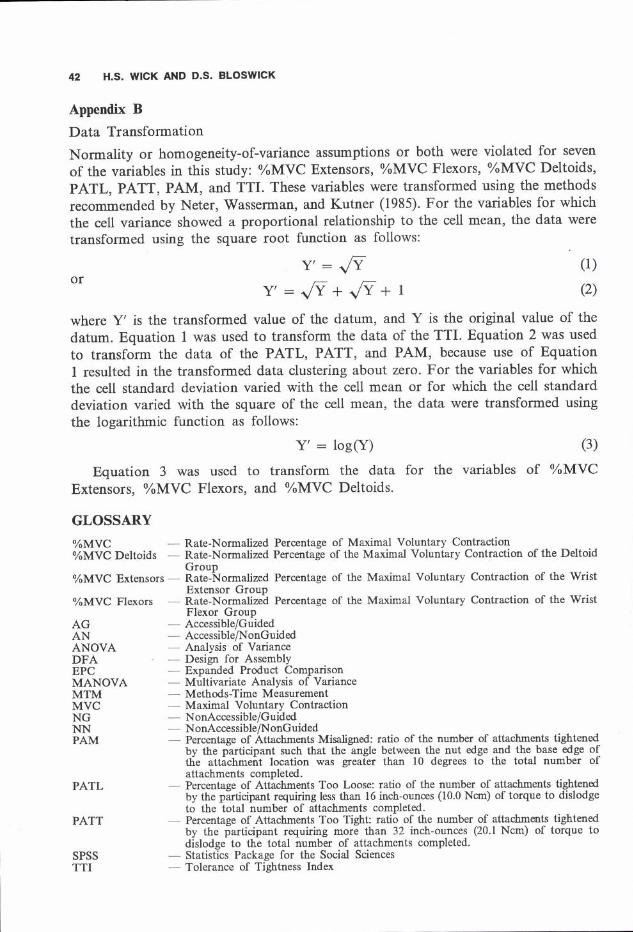
D ata TransformationNormality or homogeneity-of-variance assumptions or both were violated for seven of the variables in this study: %MVC Extensors, %MVC Flexors, %MVC Deltoids, PATL, PATT, PAM, and TTI. These variables were transformed using the methods recommended by Neter, Wasserman, and Kutner (1985). For the variables for which the cell variance showed a proportional relationship to the cell mean, the data were transformed using the square root function as follows:
Y' = y /Y (1)
Y' = > /y + -s/Y + 1 (2)or
where Y' is the transformed value of the datum, and Y is the original value of the datum. Equation 1 was used to transform the data of the TTI. Equation 2 was used to transform the data of the PATL, PATT, and PAM, because use of Equation 1 resulted in the transformed data clustering about zero. For the variables for which the cell standard deviation varied with the cell mean or for which the cell standard deviation varied with the square of the cell mean, the data were transformed using the logarithmic function as follows:
Y' = log(Y) (3)
Equation 3 was used to transform the data for the variables of %MVC Extensors, %MVC Flexors, and %MVC Deltoids.
G L O SSA R Y
%MVC — Rate-Normalized Percentage of Maximal Voluntary Contraction%MVC Deltoids — Rate-Normalized Percentage of the Maximal Voluntary Contraction of the Deltoid
Group%MVC Extensors — Rate-Normalized Percentage of the Maximal Voluntary Contraction of the Wrist
Extensor Group%MVC Flexors — Rate-Normalized Percentage of the Maximal Voluntary Contraction of the Wrist
Flexor Group AG — Accessible/GuidedAN — Accessible/NonGuidedANOVA — Analysis of VarianceDFA — Design for AssemblyEPC — Expanded Product ComparisonMANOVA — Multivariate Analysis of VarianceMTM — Methods-Time MeasurementMVC — Maximal Voluntary ContractionNG — NonAccessible/GuidedNN — NonAccessible/NonGuidedPAM — Percentage of Attachments Misaligned: ratio of the number of attachments tightened
by the participant such that the angle between the nut edge and the base edge of the attachment location was greater than 10 degrees to the total number of attachments completed.
PATL — Percentage of Attachments Too Loose: ratio of the number of attachments tightenedby the participant requiring less than 16 inch-ounces (10.0 Ncm) of torque to dislodge to the total number of attachments completed.
PATT — Percentage of Attachments Too Tight: ratio of the number of attachments tightenedby the participant requiring more than 32 inch-ounces (20.1 Ncm) of torque to dislodge to the total number of attachments completed.
SPSS — Statistics Package for the Social SciencesTTI — Tolerance of Tightness Index