use of concrete demolition waste as … this report we examine the tech ... advanced evnironmenta1...
TRANSCRIPT

USE OF CONCRETE DEMOLITION WASTE
AS AGGREGATES IN AREAS
THAT HAVE SUFFERED DESTRUCTION
A Feasibility Study
S.A. Frondistou-Yannas, Assistant Professor of Civil Engineering, Principal Investigator
Herbert Tung S. Ng, Graduate Student, Research Assistant
Prepared under Grant number AEN 75-23221National Science Foundation
November 1977


-2-
DISCLAIMER
Any opinions, findings and conclusions or recommendations expressedin this publication are those of the authors and do not necessarily reflectthe views of the National Science Foundation.


-3-
ABSTRACT
Millions of tons of concrete debris are annually generated by naturaldisasters. For instance, the San Fernando Earthquake of 1971 generated5 million tons of concrete debris. Disposal of such massive quantitiesof concrete waste poses a difficult problem. Moreover, during the reconstruction period significant demand usually develops for construction materials, with resulting material shortages and price inflation.
In the wake of a natural disaster, therefore, a sudden upsurge insupply of concrete debris coincides with a compelling demand for construction materials. Recycling of concrete debris as aggregate for new concrete suggests itself as an environmentally responsible mechanism for solution of the problem which is posed. In this report we examine the technical and economic aspects of such a solution.
Our findings suggest that such recycling of concrete debris is technologically feasible. Moreover, it is economically attractive providedthat at least one million tons of concrete debris has been produced by thecatastrophic event.

-4-
ACKNOWLEDGMENTS
This project was supported by grant number AEN 75-23221 from the National Science Foundation. The program managers were Dr. J.B. Scalzi,Advanced Evnironmenta1 Research and Technology, and Mr. R. Coryell, Advanced Energy Research and Technology.
We are indebted to Professor D.G. Wilson, Department of MechanicalEngineering, Massachusetts Institute of Technology, for his advice onrecycling technology and to Dr. F. Krimgo1d, Research Associate, Departmentof Civil Engineering, Massachusetts Institute of Technology for his usefuldiscussions on Damage Probability Matrices.
We appreciate the data and comments on concrete debris quantitieswhich were provided to us by the following: Mr. M.S. Agbabian, AgbabianAssociates, E1 Segundo, California; H.J. Degenko1b, H.J. Degenko1b Associates, San Francisco, California; D.F. Moran, Consulting Structural Engineer, Ventura, California; C.W. Pinkham, S.B. Barnes and Associates, LosAngeles, California; E. Greenfield, Erkel Greenfield and Associates, LosAngeles, California; B. Bresler, Professor of Civil Engineering, University of California, Berkeley; and Mr. K.V. Steinbrugge, Manager of theEarthquake Department, Insurance Services Offices, Pacific Region, SanFrancisco, California.
We also appreciate information on design of plants provided to us byMr. D. Park, Cindaco Inc., Dayton, Ohio; Mr. G.R. Spaulding, SpauldingEquipment Company, San Juan Capistrano, California; and Mr. F.C. Archer,Chief engineer, Te1smith Division, Barber-Greene Company, Milwaukee, Wisconsin.
To all of these we express our sincere appreciation and thanks.

-5-
TABLE OF CONTENTS
Title PageDisclaimer
AbstractAcknowledgments
Table of Contents
List of TablesLi s t of Fi gures
Page
1
2
3
4
5
7
9
Chapter 1:
Chapter 2:2.12.2
2.32.42.5
Chapter 3:
3.1
3.2
3.3
3.4
3.5
3.6
INTRODUCTI ON
TECHNOLOGICAL FEASIBILITY OF CONCRETE RECYCLINGINTRODUCTIONEXPERIMENTAL PROCEDURE2.2.1 Materials
2.2.2 Mixed Proportions2.2.3 Geometry, Curing and Testing of Specimens
RESULTSDISCUSSIONCONCLUSIONS
ASSESSMENT OF THE QUANTITIES OF CONCRETE DEBRISPRODUCED IN AN EARTHQUAKEMETHOD FOR ESTIMATING THE QUANTITIES OF CONCRETEDEBRIS: AN OVERVIEWAMOUNT OF CONCRETE PER SQUARE FOOT OF BUILDINGSPACE THAT NEEDS REPLACEMENT IN A HEAVILY ORTOTALLY DAMAGED BUILDINGAMOUNT OF SQUARE FOOTAGE WHICH IS HEAVILY ORTOTALLY DAMAGEDTOTAL TONNAGE OF CONCRETE DEBRIS GENERATEDHIGHWAY DAMAGE ESTIMATIONCASE STUDY. THE SAN FERNANDO EARTHQUAKE OF 1971
10
15
15
18
19
20
20
212324
26
26
28
29
31
3232

-6-Table of Contents - Continued Page
3.6.1 Concrete Debris Generated from Building 32Damage
3.6.2 Concrete Debris Generated from Highway 34Damage
3.6.3 Total Amount of Concrete Debris Generated 35in the San Fernando Earthquake of 1971
3.7 SUMMARY AND CONCLUSIONS 35
Chapter 4: RECYCLING TECHNOLOGY 374.1 INTRODUCTION 374.2 DESIGN OF CONCRETE RECYCLING PLANTS 394.3 POTENTIAL OF NEW TECHNOLOGIES FOR THE RECYCLING 42
PLANTS4.4 THE SANITARY LANDFILL ADJACENT TO THE PLANT 43
Chapter 5: ECONOMIC FEASIBILITY OF CONCRETE RECYCLING 445. 1 INITIAL INVESTMENT IN THE RECYCLING PLANTS AND SLF's 445.2 PRODUCTION COST ESTIMATE FOR THE RECYCLING PLANTS AT 46
THE SLF SITES5.3 ANNUAL INCOME STATEMENTS OF RECYCLING SYSTEMS 505.4 ATTRACTIVENESS OF INVESTING IN THE RECYCLING SYSTEMS 515.5 COMPARISON OF RECYCLED AGGREGATE CONCRETE AND 53
NATURAL AGGREGATE CONCRETE5.6 CONCLUSIONS ON THE ECONOMIC FEASIBILITY OF CONCRETE 54
RECYCLING
Chapter 6: CONCLUSIONS 56
References 59Tables 64Figures 143APPENDIX I NOTATION 163APPENDIX II ESTIMATE OF THE PERCENTAGE OF STRUCTURAL CONCRETE 164
THAT NEEDS REPLACEMENT IN A HEAVILY DAMAGED BUILD-ING. SURVEY OF PROFESSIONALS IN THE AREA OF EARTH-QUAKE ENGINEERING.
APPENDIX III SOLICITATION OF ADVICE FROM EQUIPMENT PRODUCERS 165ON THE DESIGN OF CONCRETE RECYCLING PLANTS (LETTER)
APPENDIX IV REQUEST FOR CRITICAL REVIEW OF FINISHED DESIGN 169(LETTER TO EQUIPMENT PRODUCERS)
'''lI' ~
-7-
LIST OF TABLES
Table # Title Page
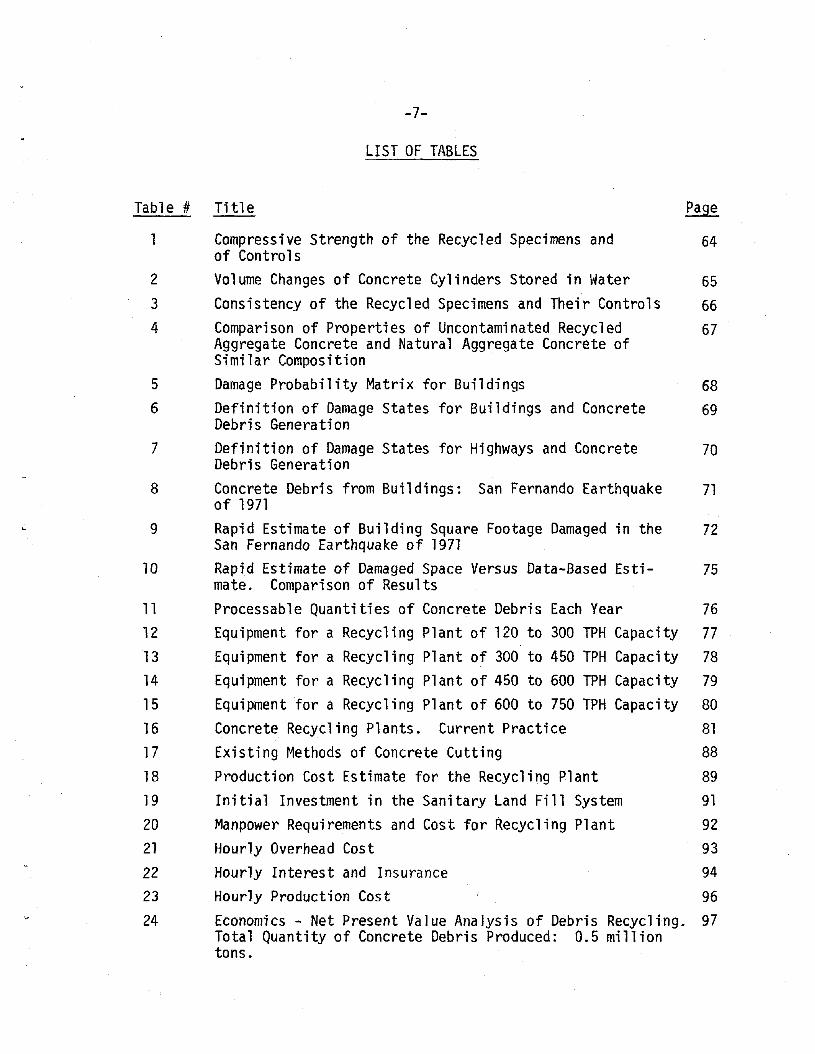
1 Compressive Strength of the Recycled Specimens and 64of Controls
2 Volume Changes of Concrete Cylinders Stored in Water 653 Consistency of the Recycled Specimens and Their Controls 664 Comparison of Properties of Uncontaminated Recycled 67
Aggregate Concrete and Natural Aggregate Concrete ofSimilar Composition
5 Damage Probability Matrix for Buildings 686 Definition of Damage States for Buildings and Concrete 69
Debris Generation7 Definition of Damage States for Highways and Concrete 70
Debris Generation8 Concrete Debris from Buildings: San Fernando Earthquake 71
of 19719 Rapid Estimate of Building Square Footage Damaged in the 72
San Fernando Earthquake of 197110 Rapid Estimate of Damaged Space Versus Data-Based Esti- 75
mate. Comparison of Results11 Processable Quantities of Concrete Debris Each Year 7612 Equipment for a Recycling Plant of 120 to 300 TPH Capacity 7713 Equipment for a Recycling Plant of 300 to 450 TPH Capacity 7814 Equipment for a Recycling Plant of 450 to 600 TPH Capacity 7915 Equipment for a Recycling Plant of 600 to 750 TPH Capacity 8016 Concrete Recycling Plants. Current Practice 8117 Existing Methods of Concrete Cutting 8818 Production Cost Estimate for the Recycling Plant 8919 Initial Investment in the Sanitary Land Fill System 9120 Manpower Requirements and Cost for Recycling Plant 9221 Hourly Overhead Cost 9322 Hourly Interest and Insurance 9423 Hourly Production Cost 9624 Economics - Net Present Va I ue Ana lysis of Debris Recycl in9. 97
Total Quantity of Concrete Debris Produced: 0.5 milliontons.

-8-
List of Tables, Continued
Table # Title
25 Economics - Net Present Value Analysis of Debris Recycling. 101Total Quantity of Concrete Debris Produced: 1.0 milliontons.
26 Economics - Net Present Value Analysis of Debris Recycling. 105Total Quantity of Concrete Debris Produced: 2.0 milliontons.
27 Economics - Net Present Value Analysis of Debris Recycling. 109Tota1 Quantity of Concrete Debris Produced: 3.0 mi 11 iontons.
28 Economics - Net Present Value Analysis of Debris Recycling. 113Total Quantity of Concrete Debris Produced: 4.0 milliontons.
29 Economics - Net Present Value Analysis of Debris Recycling. 117Total Quantity of Concrete Debris Produced: 5.0 milliontons.
30 Economics - Net Present Value Analysis of Debris Recycling. 121Total Quantity of Concrete Debris Produced: 6.0 milliontons.
31 Economics - Net Present Value Analysis of Debris Recycling. 125Total Quantity of Concrete Debris Produced: 7.0 milliontons.
32 Economics - Net Present Value Analysis of Debris Recycling. 129Total Quantity of Concrete Debris Produced: 8.0 milliontons.
33 Economics - Net Present Value Analysis of Debris Recycling. 133Total Quantity of Concrete Debris Produced: 9.0 milliontons.
34 Economics - Net Present Value Analysis of Debris Recycling. 137Total Quantity of Concrete Debris Produced: 10.0 milliontons. '
35 Net Present Value and Internal Rate of Return for Re- 141cyc1i ng Sys terns
36 Composition and Costs of Natural Aggregate Concrete and 142Recycled Aggregate Concrete of Equivalent Performance

-9-
LIST OF FIGURES
4
2
5
6
3
7
8
1
Title Page
Relationship between Age and Compressive Strength 143Water to Cement Ratio is 0.55Relationship between Water to Cement Ratio and 28-Day 144Compressive StrengthModulus of Elasticity in Compression as a Function of 145Age. Water to Cement Ratio is 0.55Methodology for Estimating Concrete Debris Generated 146from Bui 1di ngsDensity of Building Space as a Function of Distance 147from Center of Urban AreaThe San Fernando, California, Earthquake of February 9, 1481971; Zones of Modified Mercall; Intensity (Note:Shaded area represents urban area.)Concrete Debris Generation 149Clearance of Concrete Debris Following a Natural 150Disaster
9 Material Balance of Plant for Recycled Concrete Aggre- 151gate
10 Schematic Design of a Recycling Plant with a 120-300 152TPH Capacity
11 Schematic Design of a Recycling Plant with a 300-450 153TPH Capaci ty
12 Schematic Design of a Recycling Plant with a 450-600 154TPH Capacity
13 Schematic Design of a Recycling Plant with a 600-750 155TPH Capacity
14 Perforated Plate Screen for Separating Re-bars or 156Other Long Objects from Granular Debris Material
15 Operation of Coarse Material Washer 15716 Preliminary Cleaning Operations 15817 Relationship between Required Initial Investment in 159
a Concrete Recycling Plant and Plant Capacity
18 Guide for Estimating Hourly Cost of Interest and Insurance160
19 Relationship between Production Cost and Plant Capacity 161in a Recycling Concrete Plant
20 Production Cost of the SLF System 162
Figure #

-10-
CHAPTER 1
INTRODUCTI ON
Concrete debri sis generated steadi 1y as a result of the II norma111 deathof structures. Successful recycling of such debris and especially its useas aggregates for new concrete, is highly desirable because it can contribute to the solution of serious problems. Major natural disasters alsolead to production of large amounts of concrete debris. Successful recycling of debris from a major natural disaster is even more desirable becauseit promises to solve particularly severe problems.
Several metropolitan areas are presently experiencing serious wastedisposal (43) and aggregate availability (28,29,40) problems. Concrete isthe most popular construction material and the most abundant one in demolition debris: it accounts for 67% by weight of all demolition debris (56).Disposal of such massive quantities of concrete waste poses a difficult problem due to the decreasing availability of dumping areas. At the same timeurban expansion has led to closing of some aggregate plants and stricterenvironmental laws have led to closing of still others. For these reasons,aggregates are locally unavailable in several metropolitan areas. Consequently, the bulky and heavy aggregates have to be transported from increasingly longer distances at a greatly increased cost. These problems could belargely solved if concrete debris which is produced daily following the II normal II death of structures were to be recycled and used as aggregates for newconcrete.
Serious as they may be, the debris disposal and aggregate availabilityproblems described above cannot compete in severity with similar problems inthe wake of a major disaster. In the latter case, immense quantities ofconcrete debris are produced: a large metropolitan area produces every yeara few hundred thousand tons of concrete debris (15). By contrast, anearthquake of the intensity of the San Fernando earthquake of 1971 produces a few million tons! This ocean of concrete debris would have to

-11-
be dumped. Later, during reconstruction following the disaster, there isa large demand for materials, with resulting shortages and price inflation (19). Concrete recycling as concrete aggregate following a naturaldisaster would go a long way towards solving these waste disposal andavailability problems at the savings of millions of dollars and in an environmentally responsible way.
Recycling of concrete debris following a major disaster presents uswith special problems: the quantities of debris produced exceed by far thequantities of debris normally produced. On the other hand, while an urbanarea produces a constant flow of concrete debris for the years to come,the debris quantity produced by the natural disaster is a one-time event.It follows that the optimal recycl ing technology and the resulting economies in the case of a natural disaster will be very different from whatis normally encountered.
Previous work (for instance Ref. 4,15,56) in the area of concretedebris recycling is limited to debris produced during the normal death ofstructures and does not address the special problems - and outstandingbenefits ~ of concrete recycling following a natural disaster.
This report is the end product of a study designed to assess thefeasibility of recycling concrete debris as aggregate in areas that havesuffered destruction. The specific objectives of the study were to determine:l} The technological feasibility of concrete recycling as aggregate for
new concrete.2} The quantities of concrete debris produced following a natural dis
aster as a function of the intensity of the latter.3) The optimal recycling technology as a function of the quantities of
concrete debris to be processed.4) The economic feasibility of concrete recycling following a natural
disaster.
An assessment of the technological feasibility of concrete recyclingis presented in Chapter 2 of this report. Previous work on the topic(4,16,18,27,39) has established that pieces of old concrete free from contaminants, such as gypsum, wood, plastics, etc., are a satisfactory

-12-
substitute for natural aggregate in the production of new concrete. Additional studies and experience have shown (7~3l~33~45) that of the contaminants in concrete debris s gypsum (calcium sUlfate) is the least desirable because of the vulnerability of concrete to sulfate attack. Findings from previous studies of the effect of gypsum on the properties ofconcrete are not directly applicable to this work. Such studies have beenmotivated by additions of gypsum to cement, a step used by cement producers to control cement setting. Such additions involve very small quantities (1-3 percent by weight of cement) of finely pulverized gypsum. Accordingly, the above studies investigate the effect of relatively smallquantities of pulverized gypsum on concrete properties.
On a building demolition site, gypsum is found mixed with concretedebris. As the latter is destined to become aggregate in the production ofnew concrete, the gupsum mixed with it will also become part of the newconcrete. The amount of gypsum debris in the latter is a statisticalquantity that can exceed by far the quantities of gypsum in previous studies. Moreover~ the size of gypsum particles in recycled aggregate concrete is far coarser than the fine particles added by cement producers andstudied previously.
It is useful to know the extent of the influence of gypsum debris onthe new concrete under realistic conditions. If such influence is significant then a sorting system should be used to eliminate deleteriouscontaminants of concrete debris and the cost of the final product - recycled aggregate - is going to increase. In this work we have establishedrealistic bounds of the effect of gypsum contaminant on the technologicalproperties of new concrete so that an informed decision can be reached onwhether such sorting is necessary. In order to enhance the present knowledge in the area we have also studied certain fundamental mechanical andphysical properties of concrete produced with uncontaminated concrete debris as aggregate.
Characteristic quantities of concrete debris generated by an earthquake are assessed in Chapter 3. Such an assessment is necessary in lightof the fact that the optimal recycling technology and the resulting

-13-
economies are both a function of the scale of operation. We are not awareof any previously published work in either the general area of constructionmaterials losses or the more specific area of concrete materials lossesfollowing an earthquake. Such paucity of published studies is somewhatsurprising in view of the fact that the great bulk of material waste inan earthquake is in the form of demolition debris and most of the latter,67% by weight, is concrete. The scope of this part of our study is limitedto earthquake produced debris.
The design of four concrete recycling plants appears in Chapter 4.As many as fourteen concrete recycling plants are currently in operation(52). These are mostly portable plants, easily assembled at the site ofconcrete debris accumulation. They are typically associated with highwayprojects where the demolished pavement concrete is recycled into a baseaggregate (9,42,52) and in one case (14) into aggregate for new concretepavement. Concrete debris produced in the demolition of highways is freeof contaminants and, for this reason, existing plants have no facilitiesfor cleaning the processed debris. Typically, these plants are recyclinga few thousand tons of debris in each highway project.
In previous work (15) one of the authors has designed a 180 TPH capacity plant that includes a sorting system for concrete decontamination.
In this work (Chapter 4) we have designed concrete recycling plantsthat can sort, crush and screen concrete debris at capacities of up to750 TPH. These plants are based on standard, widely used equipment. InChapter 4 we also assess the potential of more sophisticated technologythat can be used in recycling operations of even larger scale.
The economics of concrete debris recycling following a natural disaster differ from what they would be following the "normal" death of structures. While in the latter case there is a constant flow of processabledebris each year for the years to come, a natural disaster releases a hugeflow of processable debris immediately.
Recycling of concrete debris following a natural disaster can best behandled through a combination of plants which operate for various short

-14-
periods of time and are then relocated as the flow of debris decreases.
There are infinite such combinations of plants and operating periods.In this work (Chapter 5) we have studied in detail the economics of elevensuch promising combinations in order to determine under which conditionsinvestment in these recycl ing schemes is economi cally justi fi ed.

-15-
CHAPTER 2
TECHNOLOGICAL FEASIBILITY OF CONCRETE RECYCLING
2.1 INTRODUCTION
Concrete debris produced in the demolition of buildings is contaminated with a variety of materials, such as metals, bricks, gypsum, wood,plastics and glass. By contrast, the debris produced in the demolition ofhighways is free of contaminants. Sixty percent of concrete debris comesfrom the demolition of buildings; 15 to 20 precent of concrete debris comesfrom the demolition of highways (14).
Previous work in the area of technological feasibility of concreterecycling deals primarily with uncontaminated concrete debris. When thelatter is used as aggregate in the production of new concrete, it has beenestablished that:1) best results can be obtained when concrete debris replaces coarse
aggregate only (4);2) The compressive strength of concrete produced with the recycled ag
gregate is somewhat lower than that of natural aggregate concrete(4,16,18,27,39). However, mix proportions of the recycled productcan be manipulated to obtain equal strength with the conventionalproduct (27).
3) The stiffness (16) and flexural strength (27) of concrete producedwith recycled aggregate is somewhat lower than that of conventionalconcrete.
4) The freeze-thaw resistance (4,27), volume stability (4) and workability (4,16,27) characteristics of concrete based on recycled aggregate are similar to those of the conventional concrete.
Of the major contaminants in concrete debris, metals and bricks donot cause any problems if mixed into a new concrete. Both of these contaminants have high intrinsic strength, form a good bond with cement and,except in the case of bricks with a high sulfate content (31,45), do notreact with cement.
-16-
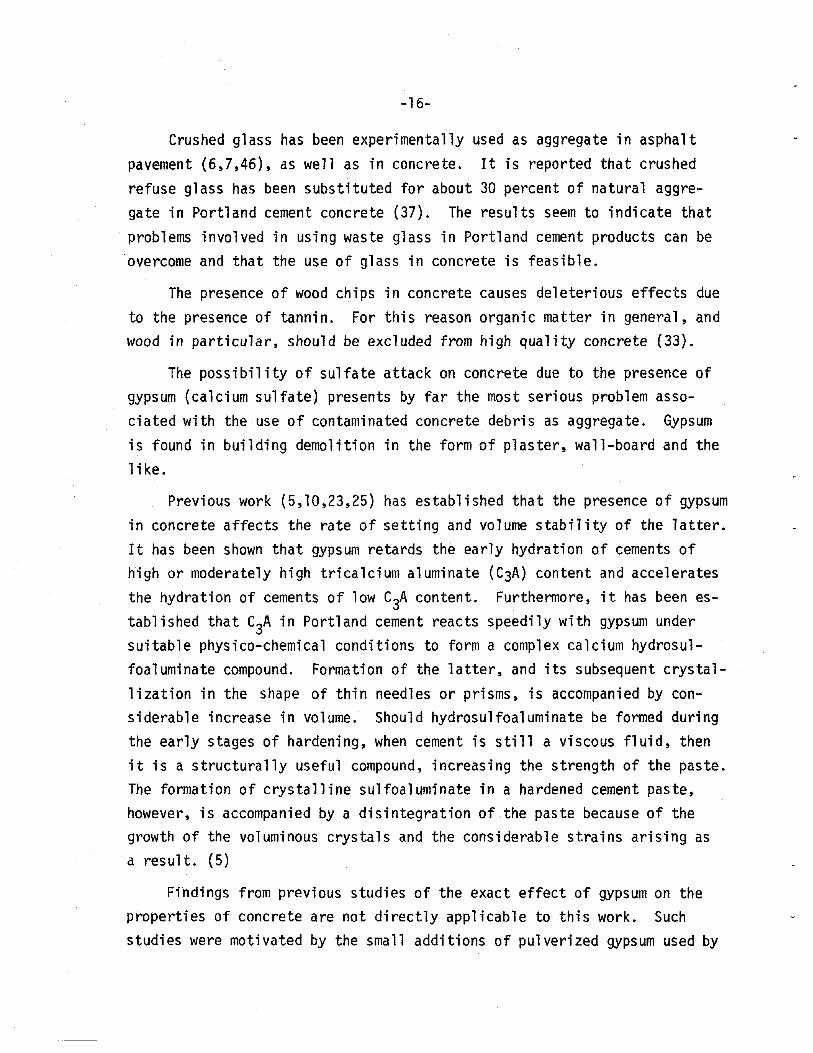
Crushed glass has been experimentally used as aggregate in asphaltpavement (6,7,46), as well as in concrete. It is reported that crushedrefuse glass has been substituted for about 30 percent of natural aggregate in Portland cement concrete (37). The results seem to indicate thatproblems involved in using waste glass in Portland cement products can beovercome and that the use of glass in concrete is feasible.
The presence of wood chips in concrete causes deleterious effects dueto the presence of tannin. For this reason organic matter in general, andwood in particular, should be excluded from high quality concrete (33).
The possibility of sulfate attack on concrete due to the presence ofgypsum (calcium sulfate) presents by far the most serious problem associated with the use of contaminated concrete debris as aggregate. Gypsumis found in building demolition in the form of plaster, wall-board and the1i ke.
Previous work (5,10,23,25) has established that the presence of gypsumin concrete affects the rate of setting and volume stability of the latter.It has been shown that gypsum retards the early hydration of cements ofhigh or moderately high tricalcium aluminate (C3A) content and acceleratesthe hydration of cements of low C3A content. Furthermore, it has been established that C3A in Portland cement reacts speedily with gypsum undersuitable physico-chemical conditions to form a complex calcium hydrosu1foa1uminate compound. Formation of the latter, and its subsequent crystallization in the shape of thin needles or prisms, is accompanied by considerable increase in volume. Should hydrosulfoa1uminate be formed duringthe early stages of hardening, when cement is still a viscous fluid, thenit is a structurally useful compound, increasing the strength of the paste.The formation of crystalline sulfoa1uminate in a hardened cement paste,however, is accompanied by a disintegration of the paste because of thegrowth of the voluminous crystals and the considerable strains arising asa resul t. (5)
Findings from previous studies of the exact effect of gypsum on theproperties of concrete are not directly applicable to this work. Suchstudies were motivated by the small additions of pulverized gypsum used by

-17-
the cement producers to control setting of cement. Accordingly, previousstudies involve relatively small quantities of gypsum, the latter in theform of very fine particles.
On a building demolition site gypsum is found mixed with concretedebris. As the latter is destined to become part of the new concrete, thegypsum mixed with it will also become part of the new concrete. The amountof gypsum debris in the latter is a statistical quantity that can exceed"by far the quantities of gypsum used in studies previously reported (5,10,23,25). Moreover, the size of gypsum particles in recycled aggregate con
crete is far coarser than the very fine particles added by the cement producers and studied previously.
Useful information on the effect of gypsum debris in concrete underrealistic conditions can be gained from the German post World War II experience. At the time demolition debris was used as a construction materialin Germany. The recycled debris consisted largely of brickwork, buildingblocks, isolated pieces of concrete and adherent lime or cement mortarand was used as concrete aggregates for the production of concrete roofs,floors and wall slabs (33). In spite of the fact that the resultant concrete has been found satisfactory, a warning appeared in a German publication of the time to the effect that where gypsum mortar or plaster boardare present in the debris, care should be taken to ensure that the con-tent of the soluble sulfate should not exceed 1% by weight of the cementand a qualitative test for sulfate was described (33). However, Germanyat the time was in the early stages of its economic recovery and only limited attention had been paid to an indepth study of the influence of gypsumcontamination of concrete as aggregate. The meager data on the topic wasnot augmented by British publications of the time because, even thoughrecycled demolition debris was used in this country as aggregate, gypsumcontaminated concrete was used only for filling, land reclamation and as aroad-base material (33).
Most of the debris is contaminated and it is therefore useful to decide whether decontamination is necessary. To this end, it would be desirable to know the extent to which gypsum contamination of the debrisaffects the properties of the resultant concrete.

-18-
In this work we have established the bounds of influence of the gypsumcontaminant of concrete debris on the strength of concrete produced withsuch contaminated debris as aggregate. In order to faithfully representactual conditions we have used in our studies gypsum in the quantity andparticle sizes that appear in the field. Furthermore, to provide a reference and to enhance our knowledge in the area we have studied the strengthproperties of concrete produced with uncontaminated concrete debris asaggregate.
Both types of recycled concrete debris (gypsum-contaminated and uncontaminated) have been additionally used as aggregates to study the workability, stiffness and volume stability characteristics of the resultantconcrete.
The experimental variables stUdied in our work include the water tocement ratio, age of the specimens, type of portland cement used and degreeof gypsum-contamination.
2.2 EXPERIMENTAL PROCEDURE
Previous work (4) on uncontaminated concrete debris as aggregate fornew concrete suggested that best results are obtained when the recycledmaterial is used as coarse aggregate only. Accordingly, in this work,waste materials were used solely as substitutes for coarse aggregates.
Concrete produced with natural coarse aggregate from the quarry wasused as control. Additionally, several specimens of recycled aggregateconcrete (RAC) were produced with uncontaminated recycled concrete aggregates and referred to in this work as lIuncontaminated RAC. II The latter,containing no gypsum contamination, provided an upper bound for the anticipated properties of gypsum-contaminated concrete.
The performance of concrete produced with gypsum contaminated concrete aggregate was compared to the performance of the control and of uncontaminated RAC. We have studied two degrees of gypsum contamination,recycled concrete (coarse) aggregate containing 5% by weight gypsum (ll contaminated RAC II
) and coarse aggregate containing 100% gypsum (llgypsum-mortarmix ll
). We view the 5% gypsum contamination (by weight of coarse aggregate)

water:sand:gravel:
-19-
as a conservative figure, whereas a 100% contamination level was used toget a lower bound for the anticipated properties.
In order to simulate the characteristics of actual concrete debris,gypsum was present in our mixes in pieces ranging from 1/16 to 3/4 in.
The effect of gypsum contamination depends on the amount of C3A content present in the cement. Accordingly, we included in our study twotypes of portland cement: Type I with a high (11%) C3A content, and TypeII with a low (5%) C3A content.
To study a possible latent expansion, we studied gypsum contaminatedspecimens aged up to 49 days.
To assess the effect of amount of water in the mix on the relativemerits of contaminated and uncontaminated specimens, we studied four levelsof the water to cement ratio.
2.2.1 Materials
The materials used in this study are listed below, together with ashort description.
cement: In our experiments we produced specimens with portland cementType I and additional specimens with portland cement Type II(ASTM C-150)Potable tap water.Natural river sand, mostly fine-grained granite.For control purposes, the coarse aggregate used was granite gravel,50% crushed, from the quarry.
old concrete aggregate: Pieces of old concrete used as coarse aggregatein this work came from a 2-year old concrete slab produced in ourlaboratory and subsequently crushed with an electric demolitionhammer. The slab was made of portland cement Type III (ASTM e150), granite sand with a fineness modulus of 2.80 and granitegravel, 50% crushed, with a fineness modulus of 7.00. The ratioof cement to fine aggregate to coarse aggregate was 1:2:3 byweight and the water to cement ratio 0.50 by weight. Specimensproduced from the same batches as the old concrete slab showed a14-day strength of 3780 psi.
gypsum: Rehydrated, commercially available plaster of paris was our gypsumcontaminant. It was crushed to a maximum size of 3/4 in.

-20-
2.2.2 Mixed Proportions
All control and RAC mixes were proportioned on a ratio of 1:2:3by weight for cement, sand and coarse aggregate, respectively. The amountof water was varied to achieve water to cement ratios of 0.45, 0.55, 0.65and 0.75 by weight, which were employed in connection to the compressionand slump tests, while the water to cement ratio used in connection to thevolume stability and stiffness tests was 0.55 by weight.
The same grading was used for coarse aggregate in all control and RACmixes: maximum size 3/4 in, 60% retained on a 3/8 in sieve and 100% retained on a No.4 sieve. In the contaminated RAC mixes, 5% by weight ofeach weight fraction of coarse aggregate was replaced by gypsum. Theabove amounts of gypsum in the specimens is equivalent at a S03 content of7% by weight of cement.
The gypsum mortar mixes could not be proportioned in the same ratioas the control and RAC mixes; to do so resulted in an unworkable mix without sufficient paste to coat all the gypsum-aggregate. These mixes wereproportioned, instead, in a ratio of 1:2:2.25 by weight, for cement, sandand gypsum respectively. This is equivalent to a S03 content of 105% byweight of cement.
Fine aggregate used in all control, RAC and gypsum-mortar mixes wasthe same: natural sand with a fineness modulus of 2.80.
2.2.3 Geometry, Curing and Testing of Specimens
Compressive Strength Tests Concrete cylinders for the compression testhad a diameter of 3 in and a height of 6 in. After casting, specimenswere stored at 72°F and 100% R.H.until tested. At least 3 and usuallymore cylinders from each concrete mix were tested during the testing dayaccording to ASTM C-39.
Modulus of Elasticity Tests The static modulus of elasticity in com-pression was determined for all concrete cylinders produced with a waterto cement ratio of 0.55. This was accomplished by measuring the deformation of the specimen with a 3 in dial gage during the compression test.

-21-
Volume Stability Tests The same concrete cylinders with a water tocement ratio of 0.55 that were used for the 49 day compression test werealso tested for expansion. The volumes of these cylinders were measuredat 1, 14, 28 and 49 days of age by the following method: they were removed from the curing tank, dried until they achieved the saturated surface dry condition, and weighed, first in air, then in water. The volume,V was computed from the following formula (11):
(Wa-Ww)V = -=----...:..:.-
y
where Wa is the weight of the specimen in air, Ww is its weight in water,and y is the specific weight of the water.
Slump Tests The workability (consistency) of all concrete mixes wasmeasured with a 6-in-high cone. Th~ latter was selected over the standard l2-in-high cone because of its moderate demands on materials quantities consistent with the relatively small cylinders produced. The smallercone adequately served our purpose of comparing the relative workabilityof the RAC or gypsum-mortar mixes and of the controls.
2.3 RESULTS
Compressive Strength The compressive strength of all tested mixes isshown in Table 1. Values from this Table for a constant water to cementratio of 0.55 and for both types of cement used have been plotted inFig. 1 as a function of time. Additionally, strength data from Table 1,for a constant age of 28 days and for both types of cement used have beenplotted in Fig. 2 as a function of the water to cement ratio.
In both Figures 1 and 2, curves B (zero gypsum contamination) ando (100% gypsum contamination) represent the upper and lower bounds, respectively for the compressive strength of gypsum contaminated specimens.Furthermore, in both of the figures above, the effect on strength of thereplacement of natural aggregate with pieces of (uncontaminated) old concrete is reflected in the difference between curves B and A (control).

-22-
When natural aggregate was replaced with pieces of old concrete therewas a decline in the strength of concrete from between 0 and 29%. Therewas a further decrease in strength as gypsum particles replaced the oldconcrete aggregates; this decrease was positively related to the amount ofgypsum present: when gypsum replaced 5% of coarse aggregate the resultant
I,
decline in concrete strength was between 0 and 51%. When gypsum replaced100% of coarse aggregate, the resultant decrease in strength was from 42to 85% (Table 1, Figs. 1 and 2).
Use of portland cement Type II seemed to yield better results thanthose obtained with portland cement Type I with the contaminated RAC specimens. The difference was significant only at high water to cement ratiosand with more advanced ages. On the other hand, gypsum-mortar specimensprepared with Type I and Type II cements had comparable strengths (Table1, Fi gs. 1 and 2).
The relative merits of contaminated RAC, uncontaminated RAC and control do not seem to vary with time. In the gypsum-mortar specimens therate of growth in strength is lower than that in the rest of the speciments. This is especially true for ages after 28 days where some of thegypsum-mortar specimens even experienced a decline in strength (Table 1,Fig. 1).
The water to cement ratio does not appear to affect significantlythe relative merits of the contaminated RAC and its controls (Table 1 andFig. 2). The gypsum-mortar specimens seemed to be less sensitive to thewater to cement ratio than the rest of the specimens (Fig. 2).
Modulus of Elasticity Similarly to strength, the modulus of elasticitydecreased when pieces of old concrete replaced natural coarse aggregate;this decline was between 2 and 10% (Fgi. 3). When gypsum replaced partof the old concrete aggregate there was a further decline in stiffness:the modulus of contaminated RAC was from 20 to 30% lower than that ofthe control (Fig. 3).
Volume Expansion Gypsum-mortar specimens stored continuously in watershowed significantly larger volume expansions than did the rest of thespecimens stored under similar conditions (Table 2). Gypsum-mortar

-23-
specimens produced with portland cement Type II showed a smaller expansion
than similar specimens produced with portland cement Type I (Table 2).
Workability The uncontaminated RAC and control were equally workable.
Contaminated RAC was somewhat less workable, but the difference in workability (consistency) was not significant. Gypsum-mortar specimens were
significantly less workable (Table 3).
2.4 DISCUSSION
When natural aggregate was replaced with uncontaminated pieces of
old concrete, the resultant material had a strength of at least 71% that
of the natural aggregate concrete. This finding is in agreement withfindings in References 4, 16, 18, 27 and 39.
In natural aggregate concrete it is usually the aggregate-paste bondthat is the weakest (strength determining) link, so that the fracture surface proceeds preferentially around the aggregate and through the aggregate paste interface so that the high strength of the aggregate is not
utilized. It follows that the strength of concrete will not be significantly decreased if natural aggregate is replaced by a weaker material,
provided that the aggregate-paste bond will continue to be the weakestlink and that the strength of the bond will not be affected. This is thecase when waste concrete aggregate is primarily gravel (16). When recycled
aggregate particles are primarily mortar, however, they are weak enough tobecome the weakest link in the new concrete and it is due to the presence
of this type of aggregate that the strength of concrete is reduced (16)relative to the natural aggregate concrete.
When gypsum replaced part or all of old concrete aggregate a further
deterioration in strength was observed (Table 1). One reason for this isthat gypsum aggregates are much weaker than the pieces of concrete theyreplace; weak enough to become the weakest link in concrete. An additional
reason is that gypsum probably reacted with the C3A in cement to produce anexpansion that caused deterioration of the paste. This expansion was clearly seen in the case of gypsum-mortar specimens (Table 2). Furhtermore, an

-24-
indication that there was a chemical reaction between the gypsum contaminant and C3A in cement comes from the fact that the volume expansion ofgypsum-mortar specimens based on Type II cement was smaller than the volumeexpansion of similar specimens produced with cement Type I (Table 2).Additionally, the strength of contaminated RAC based on Type II cementwas greater than the strength of similar specimens produced with Type Icement (Table 1).
Our strength measurements in the contaminated RAC specimens did notshow that gypsum affected the rate of strength growth (Table 1). Shouldgypsum in these mixes have acted either as a retarder or an accelerator,its effect should have ended before the age of 14 days, when our measurements started.
The recycled aggregate concrete or gypsum-mortar mixes had a lowermodulus of elasticity than the control. This finding is expected sincerecycled concrete aggregate, as well as gypsum, have a lower modulus thannatural aggregate and, in addition, it is well known that the modulus ofconcrete depends significantly on the modulus of its aggregates.
Replacement of natural aggregates by old concrete aggregate did notaffect workability (Table 3). This was due to the good particle shape ofrecycled aggregates together with the fact that the latter were used inthe saturated surface dry condition.
2.5 CONCLUS IONS
From the technological point of view, uncontaminated concrete debrisis a satisfactory aggregate for the production of new concrete. RACproduced with uncontaminated concrete debris has a somewhat lower strengththan natural aggregate concrete of similar composition. On the other hand,the mix design can always be manipulated to yield a product of similarstrength. For instance, it can be seen from Fig. 2 that when portlandcement Type I is used, natural aggregate concrete produced with a waterto cement ratio of 0.75 has the same strength as does uncontaminated RACproduced with a water to cement ratio of 0.65

-25-
Findings from this anq previous investigations summarized in Table4 also confirm the technological adequacy of uncontaminated recycled concrete as aggregate for new concrete.
When gypsum contaminated concrete debris is recycled as aggregatefor new concrete the strength and stiffness of the latter suffers a reduction the magnitude of which is positively related to the amount ofgypsum in the mix. For instance, if gypsum in the new concrete mix comprises 5% by weight of the coarse aggregate, the strength of the productcan be as high as 51% of the strength of natural aggregate concrete. Inthe extreme case where gypsum comprises 100% of coarse aggregate, thestrength drops to 15% of the value of the control. In this case thestrength of the mix is only about 700 psi. We conclude that concreteaggregate which has been contaminated with gyspum can be used in the production of low strength concrete only. In the usual case where a concretestrength of 3,000 to 4,000 psi is required, only uncontaminated concreteaggregate can be used. Accordingly in the design of recycling plants,which is presented below in Chapter 4, we have included sorting equipmentthat eliminates concrete debris contaminants.
- -26-
CHAPTER 3
ASSESSMENT OF THE QUANTITIES OF CONCRETE
DEBRIS PRODUCED IN AN EARTHQUAKE
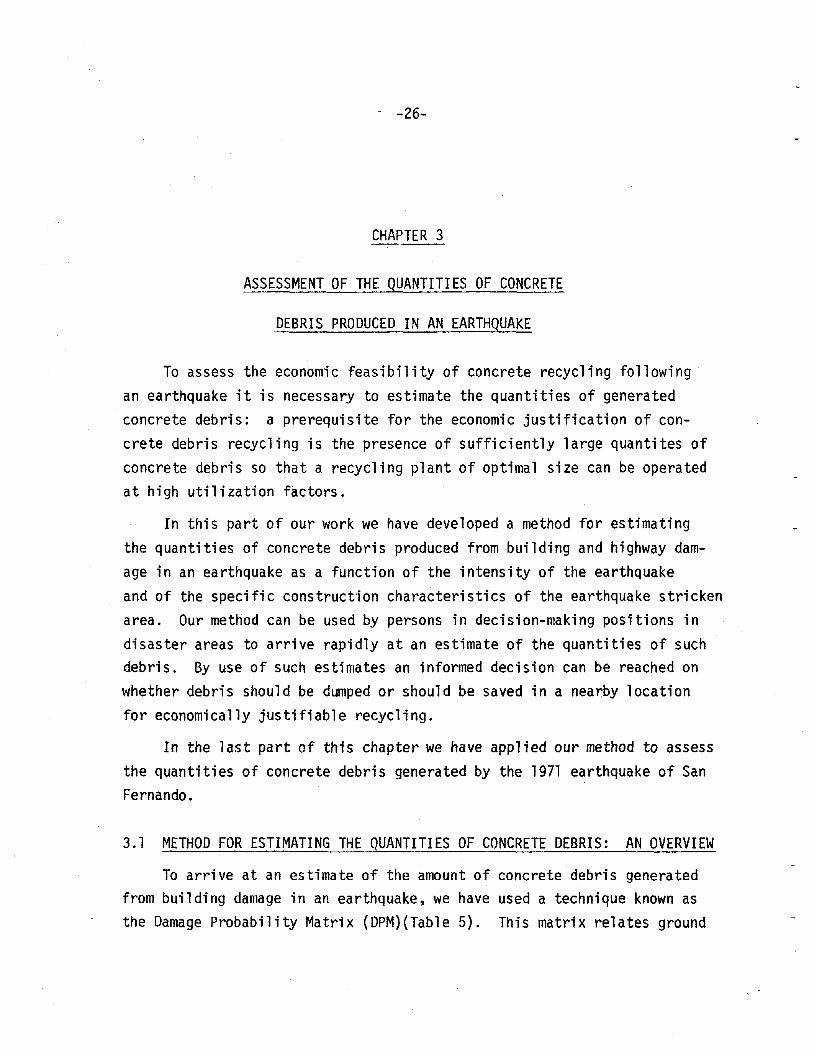
To assess the economic feasibility of concrete recycling following·an earthquake it is necessary to estimate the quantities of generatedconcrete debris: a prerequisite for the economic justification of concrete debris recycling is the presence of sufficiently large quantites ofconcrete debris so that a recycling plant of optimal size can be operatedat high utilization factors.
In this part of our work we have developed a method for estimatingthe quantities of concrete debris produced from building and highway damage in an earthquake as a function of the intensity of the earthquakeand of the specific construction characteristics of the earthquake strickenarea. Our method can be used by persons in decision-making positions indisaster areas to arrive rapidly at an estimate of the quantities of suchdebris. By use of such estimates an informed decision can be reached onwhether debris should be dumped or should be saved in a nearby locationfor economically justifiable recycling.
In the last part of this chapter we have applied our method to assessthe quantities of concrete debris generated by the 1971 earthquake of SanFernando.
3.1 METHOD FOR ESTIMATING THE QUANTITIES OF CONCRETE DEBRIS: AN OVERVIEW
To arrive at an estimate of the amount of concrete debris generatedfrom building damage in an earthquake, we have used a technique known asthe Damage Probability Matrix (DPM)(Table 5). This matrix relates ground

-27-
motion, defined in terms of earthquake intensities, to building damage,which is defined in terms of damage states defined verbally and in termsof costs in Table 6, Col. 2 and 3. The matrix can be used to estimatethe percent of total square footage in the earthquake area in each damagestate. Although the DPM is applicable to non-wooden construction only,its usefulness in our study is not decreased, since in wooden constructionconcrete is used in the foundations only and the latter are considered notrecyclable.
We are only interested in structural damage, since concrete is astructural material .. Such damage will only be generated at damage stateswhich are considered "heavy" and "total" ("none," IIlight ll and "moderate"damage states produce no structural damage [Table 6J). Furthermore, earthquakes of Modified Mercalli Intensities (MMI) less than VII normally produce negligible structural damage. Accordingly we have limited ourselvesto a condensed version of the DPM shown in heavy brackets in Table 5: itincludes only "heavy" and IItotal" damage states and earthquake intensitiesof MMI VII or higher.
For the purpose of this study it was convenient to redefine (Section3.2) the "heavyll and "total II damage states in terms of the amount of concrete per square foot of building space that needs replacement in each ofthe above states.
To obtain an estimate of the total square footage in each damagestate, and thereby estimate the total amount of debris in the earthquakearea, we based ourselves on the building inventory in the area. (Throughuse of the DPM the latter is allocated to the various damage states.) Dataon the building inventory for most areas in the U.S. is not readily avail-
. able. For this reason, and because such data is needed soon after the disaster for optimal decision-making with regard to concrete debris, we describe, in Section 3.3 below, a method for obtaining a quick estimate ofbuilding inventory in the affected area.
The total amount of concrete debris generated in each of the damagestates constitutes the total tonnage of concrete debris (Section 3.4).

-28-
An outline of our method for building damage estimation appears in
Fig. 4.
We have devised a similar method for estimating the quantities ofconcrete debris generated from highway damage in the earthquake area(Section 3.5).
3.2 AMOUNT OF CONCRETE PER SQUARE FOOT OF BUILDING SPACE THAT NEEDSREPLACEMENT IN A HEAVILY OR TOTALLY DAMAGED BUILDING
All concrete debris is produced in the structural damage producingstates designated IItota1" and "heavy" (Table 6). When the damage is"total," 100% of concrete in the structure joins the debris category(Table 6, Col. 4). The question then is: IIUnder heavy damage, what percentage of structura1 cone rete needs replacement?".
To answer this question we contacted seven experienced professionalsand scholars in the area of earthquake engineering and asked them to provide us with an estimate of the percentage of concrete that would haveto be replaced in a heavily damaged building (see Appendix II). Theirestimates ranged from 5 to 25%, with an average of 11.2%. Accordingly, inthis study we have assumed that 11% of structural concrete has to be replaced in a heavily damaged building (Table 6, Col. 4).
To translate the above percentages into tons of concrete per squarefoot, we had to know the concrete content per square foot of buildingconstruction. This was estimated in the following manner:
1) For each one of the last 10 years, the amount of concrete consumed in the United States for the construction of building space was divided by the amount of building square footage produced in that year.From the numerators we subtracted in each case the amount of concrete usedfor basements and foundations, as this amount is not recycled, and fromthe denominators we subtracted the square footage of wood-based construction. The latter is far more resistant to earthquakes (34) and containsno recyclable concrete. The figures we derived for the last 10 years

-29-
ranged from 0.04 to 0.10 tons of concrete per square foot of buildingspace with an average valu~ of 0.084 tons per square foot.
2) The amount of concrete in four typical non-wood frame buildingswas calculated and found to range from 0.036 to 0.08 tons per squarefoot, with an average value of 0.057 tons per square foot.
Based on the results of the above two estimating methods we assumebelow that, on the average, 0.06 tons of concrete are used per square footof building construction.
We combine our findings to derive that 11% of structural concrete of0.06 tons per square foot, that is, 0.0066 tons of concrete per squarefoot, needs replacement in a heavily damaged building. Furthermore,100% of structural concrete, or 0.06 tons per square foot needs replacement in a totally damaged building. The above is reported in Table 6,Col. 5 and constitutes a definition of damage states in terms of concretedebris generation.
3.3 AMOUNT OF SQUARE FOOTAGE WHICH IS HEAVILY OR TOTALLY DAMAGED
To arrive at an estimate of total square footage in each of the damaged states "heavy" and "total" requires knowledge of the inventory of 'building space in each of the areas which has suffered MMI VII or higher(Table 5). Once the above inventory is known, one can use the DPM inTable 5 to allocate it into the "heavy" and "total" damage states; and toderive the total amount of damaged square footage, one has to sum up thedamaged square footage in each region that has suffered an MMI VII orhigher (see Fig. 4).
A difficulty in the application of this method is presented by thefact that an inventory of building space is not readily available for mostareas in the country. Given the appropriate resources, such informationcan be obtained rather awkwardly from several sources. For instance, onecan use very detailed maps (scale 1/600 to 1/200)(47) that exist for allbut rural areas in the country. These maps contain a plan view of buildings

-30-
(from which one can derive the square footage per story), information onthe number of stories (which yields the total square footage per building), the end-use of the building (whether an apartment or office building,etc.), and the basic structural material (which allows exclusion of woodbased square footage). To cover an area as small as a county one mighthave to accumulate information contained in about 40 volumes of maps: aprocess that may require a few months at a cost of a few tens of thousandsof dollars.
Alternatively, one can use one of the existing data sources on ongoing construction projects (for example, Ref. 13) to derive the inventoryof building space. The above data exists for the last decade in detailedand comprehensive form and includes square footage of buildings and basicstructural material. One can therefore sum up the non-wood based squarefootage built during the last 10 years in the area and then make the assumption that the above sum represents a given fraction of the total inventoryin order to arrive at an estimate of the total inventory. To apply thismethod, the required information from the data files has to be collectedand summed up at an expense of time and money.
Following an earthquake, quick decisions have to be made on the fateof concrete debris: should it be disposed of in a dump or should it berecycled as concrete aggregate? The answer to the above depends on thequantity of generated concrete debris, which has to be rapidly assessed.The latter depends, in turn, on a rapid assessment of the building inventory.
To arrive at the desired rapid estimate of the inventory of buildingspace in an area that has suffered an earthquake of given intensity, wesuggest the following:
a) By personal inspection (flying over or driving through) of theearthquake stricken area (or even better, from an isoseisma1 map, if oneis available) assess the square mileage of urban land that has suffered agiven earthquake intensity (in this case, an intensity of MMI VII or higher).·

-31-
b) Similarly, assess the location of a "spot" (say, about 0.10square miles), in the above areas which is representative in terms ofbuilding density.
In the case study that follows, we have made the assumption that building density decreases linearly with distance from the center of the urbanarea (this assumption is supported by published data; see, for instance,Ref. 2). For areas where the above assumption holds, if BC (Fig. 5) is adiameter of the area which has suffered a given earthquake intensity ando is the center of this area, then the density at D is representative ofthe average density in the area. Of course, if A, the center of the urbanarea, is close to center Dof the earthquake stricken area, then another"spot" in between D and C or D and B has to be chosen as representative.
c) Once a representative "spo t" D has been decided upon, buildingdensity in an area limited geographically to the very small region thatDoccupies is assessed through use of very few maps (17) or other availabledata on building density. Because of the very limited area of coverage,information on building density can be obtained speedily in this mannerat a cost of few tens of dollars.
d) Multiply building density, in square feet per square mile of landat the representative "spot" D (derived in step "c" above) by the totalsquare mileage derived in "a" above, to arrive at the total inventory ofspace in the area suffering a given earthquake intensity.
3.4 TOTAL TONNAGE OF CONCRETE DEBRIS GENERATED
Through use of the DPM (Table 5), the total inventory of buildingspace in the area is allocated to the various damage states. The squarefootage in each of damage states "heavy " and "total" is then multiplied bythe amount of concrete debris generated per square foot in the abovestates (after Table 6). The total tonnage of concrete debris produced isthe sum of debris produced in each of the damage states "heavy" and "total"(see Fig. 4).

-32-
8.5 HIGHWAY DAMAGE ESTIMATION
A DPM for highways, similar to the one in Table 5 which was developedfor buildings, apparently is not available at this time. Therefore, onehas to rely on an actual survey of damaged mileage. Fortunately, such asurvey can easily be done: most highway damage is conspicuous, and anaerial inspection may readily give a good idea of the extent of damagesuffered. For instance, by flying over the destroyed region one can determine that approximately "X" highway miles suffered "heavy" and "y" milessuffered "moderate" or "minor" damage. What is needed, then is a definition of damage states for highways, both verbally and in terms of percentage of concrete that needs replacement.
We have critically reviewed the literature on highway damage by earthquakes and, on this basis, have derived the definition of highway damagestates ,given in Table 7, Columns 1 to 3. In the same Table we derive theamount of concrete debris generated from highway damage (Col. 4) by multiplying the percentage of concrete that needs replacement in the variousdamage states (Col. 3) with a concrete content of 6600 tons per highwaymile (22).
3.6 CASE STUDY: THE SAN FERNANDO EARTHQUAKE OF 1971
We have applied the method described above to estimate the quantitiesof concrete debris generated in the San Fernando earthquake of 1971. Weselected the above case because of the excellent damage statistics thatexist (see, for example, Refs. 3,49,50, and 53).
3.6.1 Concrete Debris Generated from Building Damage
During the San Fernando earthquake of 1971, 65 apartment buildingsand 574 commercial-industrial buildings were totally damaged, while 265apartment buildings and 1125 commercial-industrial buildings were heavilydamaged (3)(Table 8, Col. 1 and 2).
Ninety-nine percent of the surviving buildings had 1 to 3 stories (34)and most of them used wood as the major structural material (wood-based

-33-
construction has superior earthquake resistance (34,48). We have made the
assumption th~t the majority (80%) of non-wood based buildings that suffered major damages during the above earthquake had 3 stories or more;furhtermore, of the above buildings (80% of the total), apartment buildings had an average floor space of 110,000 square feet, and commercialindustrial buildings had an average floor space of 130,000 square feet(53). The additional 20% of damaged buildings had an average floor spaceof 11,000 and 13,000 square feet for apartments and commercial-industrialbuildings, respectively. Using the above, the average square footage ofdamaged apartment buildings in the area was calculated to be 0.8 x 110,000+ 0.2 x 11,000 = 90,200 square feet, while that for commercial-industrialbuildings was 0.8 x 130,000 + 0.2 x 13,000 = 106,600 square feet (Table 8,Co1. 3).
The total amount of concrete debris generated from buildings is estimated in Table 8 as follows: the number of damaged buildings multipliedby the average square footage per building gives the number of damagedsquare feet. The latter is multiplied by the tons of concrete debrisgenerated per square foot of damaged space to give the total amount ofconcrete debris generated from buildings.
As can be seen from Table 8, a total of about 5 million tons of concrete debris was generated from buildings in the San Fernando earthquake.The above estimate is based on actual data on the number of severelydamaged buildings and their square footage (3,53). This is the type ofdata that typically become available between several months and a fewyears after an earthquake.
For a rapid estimate of severely damaged space in the San Fernandoearthquake of 1971 we have used the method described in Section 3.3 ofthis paper and have then compared our results with the field data appearingin Table 8, Col. 4.
The rapid estimate involved the following steps:a) From the isoseismal map for the San Fernando earthquake of 1971
appearing in Fig. 6, we estimated that 437 square miles of urban areasuffered an earthquake intensity of VII, 69 square miles suffered an

-34-
earthquake intensity of VIII and finally, 13 square miles suffered an earthquake intensity of IX (Table 9, Col. 2).
b) The area centers in the above areas were taken as representative"spots" in terms of building density. The latter are at distances of 5,17 and 22 miles from the center of Los Angeles for areas experiencing intensities of VII, VIII and IX, respectively (Table 9, Col. 3).
Residential and non-residential space has been studied separately inorder to test our method in greater detail.
c) The representative densities derived above have been multipliedby the total square mileage suffering a given intensity to derive anestimate of the total affected square footage (Table 9, Col. 5 and 11).
d) Of the total affected square footage, one-third had been designedaccording to Uniform Building Code (USC) zoning 0 requirements and the remaining two-thirds according to UBC zoning 3 requirements (53)(Tab1e 9,Col. 6,7,12 and 13). In each case, the percentages reported in the DPMin Table 5 have been used to allocate the square footage to the "heavy"and "tota1" damage categories (Table 9, Col. 8,9,14 and 15). It wasfound that 6.45 million square feet of residential space was totally damaged and an additional 14.61 million square feet of residential spacewas heavily damaged. Furthermore, 73.4 million square feet of nonresidential space was totally damaged and an additional 165.18 millionsquare feet of non-residential space was heavily damaged (Table 9).
The above results of our estimation procedure are compared in Table10 with results based on field data. From the above Table, it can be seenthat our rapid estimates of damages space are on the average within 18%of the more accurate estima,tes based on field data and in no case deviatemore than 39% of the more accurate results.
3.6.2 Concrete Debris Generated from Highway Damage
A total of 66 bridges with a total length of 6 miles suffered somedamage in the San Fernando Earthquake of 1971 (3). Of these, about 25%,or 1.5 miles, sustained heavy damage; 50%, or 3 miles, sustained moderate

-35-
damage and the rest was only damaged in a minor way. (Derived from datain Ref. 3.) Based on the above and using the numbers in Table 7~ Col. 4~
the total tonnage of concrete debris generated from bridge damage wasderived: 1.5 miles x 6600 tons/mile + 3 miles x 660 tons/mile~ or 11~880
tons of concrete debris.
In addition~ a total of 35 highway miles was damaged. Of these~
15% or 5.25 miles~ was heavily damaged and 40%, or 14 miles~ was moderatelydamaged. (Derived from data in Ref. 3.) Therefore~ the total amount ofconcrete debris from highway damage was (see Table 7~ Col. 4): 5.25 milesx 6600 tons/mile + 14 miles x 660 tons/mile~ or 43~890 tons of concretedebri s.
For both bridges and highways~ the total amount of concrete debris. 6
generated was 11~880 + 43~890~ or 0.0557 x 10 tons.
3.6.3 Total Amount of Concrete Debris Generated in the San FernandoEarthquake of 1971
The sum of concrete debris generated from building damage (estimatebased on field data) and highway damage in the San Fernando earthquake of1971 is 5.0122 x 10⁶ + 0.0557 x 10⁶ or 5.07 x 10⁶ tons.
3.7 SUMMARY AND CONCLUSIONS
Following an earthquake~ decisions have to be reached on whether thequantities of concrete debris generated are large enough to justify recycling. To assess the tonnage of generated debris~ one has to know the quantity of debris generated per square foot of damaged space and the totalamount of damaged square footage.
In this study~ we have estimated the quantity of concrete debrisgenerated per square foot of damaged space for each damage category.
Once the inventory of building square footage is known for an areawhich has suffered an earthquake of given intensity~ one can use the estimation technique known as Damage Probability Matrix to allocate the existing

-36-
square footage into the various damage states and thus arrive at an estimate of the tonnage of concrete debris produced during the catastrophicevent.
For cases where the building inventory in the earthquake stricken areais not known, we have suggested a rapid method for estimating this inventory and have subsequently used our method in a case study for which adequate field data exists. Results from the suggested rapid estimate wereof the same order of magnitude as those estimated on the basis of actualdata (Table 10).
We have applied our method for assessing the quantities of concretedebris produced by an earthquake in the specific case of the San Fernandoearthquake of 1971. Our results show that 5 x 10⁶ tons of concrete debriswere generated in the above earthquake. It is remarkable that this amountis 16 times the amount of concrete debris generated annually in an areasuch as the Boston metropolitan area (15) and about 17% of the amount ofconcrete debris generated annually in the entire U.S. (56).
A summary of the quantites of concrete debris generated from "normal"and "violent" death of structures appears in Fig. 7. A few thousand tonsof concrete debris are produced in a highway project involving demolitionof the old pavement (41). A few hundred thousand tons are produced everyyear in a large metropolitan area (15). A few million tons of concretedebris are produced in a major natural disaster.
In order to cover most of the range of quantities of concrete debrisproduced in a natural disaster we have studied the recycling economics ofconcrete debris quantities ranging from 0.5 to 10 million tons.

".\'
-37-
CHAPTER 4
RECYCLING TECHNOLOGY
4.1 INTRODUCTION
Based on published data on the post-disaster era (19) we have assumeda 6-year reconstruction period matched with a 6-year debris clearanceperiod. Furthermore, we have assumed that debris clearance following anatural disaster decreases linearly with time and that construction of arecycling plant in the disaster area is completed by the sixth month following the disaster. During the latter period any debris which is removedwill not be recycled but rather will be dumped. The above assumptions aredepicted graphically in Fig. 8.
To avoid significant debris accumulation at the recycling plant wehave additionally assumed that the quantities of debris removed each yearfrom the site will be recycled and sold as aggregate during the same year.This implies that aggregate demand for reconstruction follows the samepattern as debris removal.
Based on the above assumptions and for a total amount of debris generation ranging from 0.5 to 10 million tons we have derived the annualprocessable quantities of concrete debris in Table 11.
By use of the information in this Table we have designed 4 recyclingplants with capacities ranging from 120 to 750 TPH. This implies that,if operated at full capacity, the largest of the designed plants will process about 1.5 x 10⁶ tons of debris per year. Larger plant capacities arenot justified in light of the fact that the disaster generated (debris)input to these plants decreases linearly with time to zero at the seventhyear after the disaster.

-38-
Most of concrete debris originates during the demolition of buildings(14) and is thus contaminated with gypsum, wood, plastics, glass andmetals. For this reason the recycling plants designed in this work include sorting processes.
On the average, 67% by weight of demolition debris is concrete (56).Steel members and copper pipes have an attractive resale value and aretherefore reclaimed at the demolition site. This increases the concentration of concrete in the demolition debris arriving at the plant.Furthermore, as will be discussed below, we have adopted a charging systemfor the debris dumped in the plant which will encourage further the increased concentration of incoming concrete. For these reasons we haveassumed that, of the demolition debris arriving at the recycling plant,as much as 75% by weight is concrete (Fig. 9).
Our estimates have shown that it is economically advantageous to havea sanitary land fill (SLF) adjacent to the concrete recycling plant in orderto avoid the high transportation cost associated with disposal of nonconcrete debris in a distant dump. Consequently, in the plant designs thatfollow we have assumed a SLF of this type. The capacity of the latter toabsorb non-concrete debris will determine the life of the recycling plantat the site.
There is a choice between a portable and a stationary recycling plantThe disadvantage of a portable plant is that standard portable equipmentis of small to medium capacity. For this reason, when standard equipmentis used, a portable system cannot take advantage of the more efficientlarge capacity equipment used in large scale operations. On the otherhand, a portable system offers flexibility: the recycling plant can berelocated when processable debris in the area has been decreased to thepoint where plant operations are not economically justified or the plantcan be relocated in the same general area next to a new SLF when the oldSLF is filled. Because of the overriding need for flexibility, all plantsdesigned in this work are portable ones.

-39-
4.2 DESIGN OF CONCRETE RECYCLING PLANTS
To design the recycling plants described below, we have criticallyreviewed the literature on presently existing recycling plants (9,15,38,
41,42,43,52) (The latter are of relatively small capacity and without anysorting facilities.) Secondly, we contacted several manufacturers ofequipment used in recycling plants and invited their help in the design ofthe four plants describe in this report (see Appendix III, Letter to theManufacturers). Three of the manufacturers whom we contacted respondedwith useful suggestions. After completing a preliminary design we againinvited the comments of the above manufacturers and incorporated some oftheir suggestions in the design (see Appendix IV, Second Letter to theManufacturers) .
Our final designs appear schematically in Figures 10 to 13, while alist of equipment and associated costs appears in Tables 12 to 15. Thedesigned plants have capacities of 120 to 300 TPH (Fig. 10, Table 12);300 to 450 TPH (Fig. 11, Table 13), 450 to 600 TPH (Fig. 12, Table 14) and600 to 750 TPH (Fig. 13, Table 15). All equipment selection is based onexisting models.
The various steps in the recycling of concrete debris together witha materials balance for each of the four plants appear in Fig. 9. Thefirst process involves preliminary cleaning and size reduction. This isfollowed by primary crushing, magnetic and manual separation of ferrousdebris, sorting of lightweight impurities and, finally, secondary crushing.
Preliminary Cleaning and Size Reduction Debris brought to the recyclingsystem mostly consists of concrete pieces with embedded steel re-bars orwire meshes. Additionally, there are considerable quantities of wood andbrick, together with small quantities of gypsum, plastics and glass (Fig. 9).At the preliminary cleaning stage, one or more bulldozers are used to pickup large pieces of non-concrete debris.
Concrete pieces too large to be fed into the recycling system have tobe reduced in size. For this purpose, the designed plants use one or more

-40-
hydraulic hammers mounted on backhoes (with buckets removed). Steel rodslonger than two feet are unacceptable with most of existing systems (52)and are therefore cut into shorter lengths by re-bar cutters.
Primary Crushing After preliminary cleaning and size reduction opera-tions, the debris is fed into a hopper-feeder and through the latter intoa screen which separates it into two categories: larger than 411 debriswhich has to go through primary crushing, and smaller than 4" debris whichbypasses primary crushing.
Feeding equipment used in all 4 plant designs includes front-endloaders. Additionally, in the two larger plants, we have included a dragline crane with bucket to assist in the feeding operation. Following theabove equipment comes a vibrating feeder and hopper which regulates theflow of debris into a screen. The latter in the three larger plants designed in this work is a perforated plate, as shown in Fig. 14, which sortsout steel rods unattached to concrete before they get fed into the primarycrusher.
We have followed common practice in concrete recycling (Table 16) inselecting a jaw type primary crusher. Concrete debris entering the jawcrusher still carries attached steel bars. For this reason we have selectedheavy duty jaw crushers that also contain some type of tramp-iron-releasedevice (8).
In the jaw crusher steel rods are physically separated from concreteand are discharged lengthwise through the discharge opening of the crusherto the under-crusher belt conveyor. If the headroom between the dis-charge opening and the under-crusher belt conveyor is not large enough, longsteel rods may just stay half-way through the discharge opening and blockthe opening. A previous operation at Taylor, Michigan (22) elevated thejaw crusher 6-8 ft above the under-crusher belt conveyor and also installeda turning type chute below the discharge opening so that discharged steelrods hit the conveyor belt at a less damaging angle. With standard portablesystems one cannot obtain a 6-8 ft headroom below the discharge opening.For this reason we have used in the plants designed in this work an under-

-41-
crusher belt conveyor that has a spring adjustment and can therefore be
moved downward when a long steel rod forces through and blocks the discharge opening.
Magnetic and Manual Separation of Ferrous Debris After the steel rodshave been effectively separated from the concrete pieces in the jaw crusher,they are sorted out manually, when long, or else by an overhead magneticseparator and magnetic head-pulley installed at the end of a long (50 ft)and wide (42 in) belt conveyor which serves as a "picking table." This isthe same belt conveyor with the spring adjustments immediately followingthe jaw crusher.
In order to avoid complete shut-down of the system in case of malfunctions caused by the steel rods, a surge pile, in the design of thethree larger plants, has been used to serve as a relay so that downstreamoperations (e.g., secondary crushing, washing and screening) can operateindependently of the upstream operations (e.g., feeding, primary crushingand magnetic sorting). The surge pile system consists of a trench in theground with belt conveyor and feeder installed.
Sorting of Lightweight Impurities The latter mostly include gypsum,in the forms found in construction, wood chips and plastics.
To sort out the above materials, one can adopt one of the many processes used by the aggregate processing industry. In this work we havefollowed the advice of people in the industry (35) in selecting a screwtype washer dewaterer (Fig. 15) which simultaneously separates and sortslightweight impurities and dewaters the washed aggregate so that the lattercan be sent directly to a secondary crusher.
Secondary Crushing Following the screw washers-dewaterers is a screenwhich directs the larger than 1.5 in aggregate to further size reductionin a cone crusher. The latter is of the short-head type operating in closedcircuit (Figs. 10 to 13). Selection of a cone type secondary crusher follows the concensus of experience (Table 16) and is based on the fact thatthis type of crusher produces a relatively coarse aggregate consistent withthe requirement that recycled concrete be used as coarse aggregate only.

-42-
(The alternative would have been a crusher based on grinding or impactaction, e.g. an impactor, which produces a much finer product.)
Additional Operations in the Recycling Plantoperations handled through the use of radialand power generation operations.
These include stock-pilingstackers and water supply
4.3 POTENTIAL OF NEW TECHNOLOGIES FOR THE RECYCLING PLANTS
The design of the concrete recycling plants presented in section 4.2above is based on standardized, widely used equipment. For very largeplant capacities one may consider use of more sophisticated technology.For instance Table 17 lists certain rather sophisticated methods forpreliminary size reduction of the concrete debris and considers their
limitations. Most of these methods are good for special situations only.For instance, thermic lancing, an insatiable user of energy, is advisableas a means of concrete cutting only in cases where noise restrictions prevent the use of more rapid but noisier methods.
It has been suggested (55) that a water jet cutting system is potentially attractive for preliminary size reduction of concrete debris.Presently, there is intensive research but as yet no commercial applicationsin this area. Water jets have been used commercially, however in otherapplications, such as mining operations (24), dismantling of railway boxcars (51), cleaning ships' hulls (21) and quality cutting such as cuttingshoe parts from synthetic materials (26).
In a water jet cutting system, a thin stream of water passes througha braided hose to a hand-held lance that is fitted with water flow controls and nozze1s selected for their cutting efficiency.
To cut concrete, water pressures of about 10,000 psi are used, theexact pressure depending on the desired rate of cutting. At higher pressures one can cut higher strength materials, for instance, at a waterpressure of 150,000 psi one can cut steel. A British manufacturer of pumpequipment has carried out tests with water jets plus an added abrasive. Inthese tests a 3-inch thick reinforced concrete pipe was cut using a 150HP pump and a water pressure of about 10,00 psi (24)

-43-
Among the advantages of water jets is their maneuverability, whichis higher than that of equipment in Table 17. Concrete pieces may simplybe shot by a high pressure water stream from a lance handled by a worker.This avoids a lot of positioning of equipment which is usually necessaryfor other types of size-reduction equipment (e.g., crane or drop-ball).Alternatively, the water jet can be installed with mechanical controland acts as a traversed cutter.
Among the disadvantages of water jets are that the pumping equipmentpresently available is noisy; the water-cleanliness requirements are high;and the nozzles and controls are not sufficiently robust for use by unskilled personnel.
The economic attractiveness of water jet systems for concrete cuttingcannot be assessed at this point because no such system has yet been developed to a commercial level.
A rather sophisticated sorting system for preliminary cleaning ofdemolition debris has been developed in Ref. 55 and is schematically shownin Fig. 16. In this scheme the incoming debris is cut to short lengthsby a traversing cavitating water jet assisted by an overhead squeeze roller.Following this, pieces of ferrous metals are sorted out by a' drum magnet,fine materials are separated through a vibrating screen and finally, lightweight material is sorted out by a suction fan. The remaining debris hasto go through additional steps of sorting and crushing.
4.4 THE SANITARY LAND FILL ADJACENT TO THE PLANT
The size of the SLF (acreage and depth) is determined by the totalestimated volume of non-concrete debris that will be disposed of thereduring the period of plant operations in the location.
A lining of 2 inches of asphalt and 6 additional inches of sand willcover the surface of SLF to prevent leaching problems.
The equipment needed at the SLF includes compactors (bulldozers) andscrapers. The latter will do the job of scraping soil out of the groundand spreading it later on the compacted debris.

-44-
CHAPTER 5
ECONOMIC FEASIBILITY OF CONCRETE RECYCLING
We have estimated the required investment in each of the recyclingplants and SLF that we have designed. Additionally, for each of the aboveplants we have estimated the production cost per ton of recycled debris.
There are infinite combinations of plants and operating periods forrecycling concrete debris produced in a natural disaster. For instance,a possible recycling scheme can involve 2 recycling plants that will bereduced to one and finally to none as the disaster produced inflow of debrisdiminishes (Fig. 8).
In this work we have studied in detail the economics of eleven suchpromising combinations. In order to determine the conditions under whichinvestment in the studied recycling schemes is attractive we have made anet present value analysis and an internal rate of return analysis ofinvestment in these schemes.
In the first part of the economic analysis we made the assumption that100% of the recycled product will be sold at a set price. In the lastpart of the analysis we determine the conditions under which the aboveassumption holds by comparing the economics of recycled aggregate concrete to the economics of natural aggregate concrete.
5.1 INITIAL INVESTMENT IN THE RECYCLING PLANTS AND SLF's
Recycling Plant The total required initial investment in a recyclingplant is the sum of the purchasing and set-up costs of equipment (Table18, Col. 4). The former is derived from Tables 12 to 15 and is reportedin Table 18, Col. 2. The latter - for equipment requiring set-up - is

-45-
assumed to be 15% of the purchasing cost of equipment and includes engineering and erection expenses (Table 18 t Col. 3).
The relationship between the required initial investment in the recycling plant and plant capacity is shown graphically in Fig. 17. Itcan be seen that in the case of initial investment there are no economiesof scale.
SLF The required total initial investment in a SLF is the sum of landacquisition t excavation t lining t engineerng and facilities costs (Table 19 tCo1. 8).
We have assumed that the SLF is located at a distance of 12 to 15miles from the center of the city where land sells for $lOtOOO an acre (22).The required acreage depends on the volume of non-concrete debris thatwill be disposed of in the SLF. The weight of the above non-concrete debriswill be 33% of the weight of processed concrete debris (75% by weight ofthe incoming debris is concrete and 25% is non-concrete [Fig. 9]). Anestimate of the total tonnage of non-concrete debris disposed of in theSLF throughout the life of the recycling system appears in Table 19 t Col.2. To convert this tonnage into volume t we assumed a fill density of 0.02tonlcu ft (2). Once the volume of dumped debris was determined we estimated the required acreage by assuming that the SLF is a rectangle with asquare floor equaling the required acreage and a constant depth of 100 ft,(Table 19, Col. 3). The total land acquisition cost equals the requiredacreage times the cost of land per acre (Table 19, Col. 4).
We have assumed that the acquired land is a valley (for example, anold quarry) and that only 20 out of the 100 feet of required depth will beproduced by excavation. The total excavation cost for the various recyclingschemes can be found in Table 19, Col. 5. To derive this number we haveassumed an excavation cost of $0.57/cu yd (22). The excavated volume equalsthe volume of a 20-ft deep rectangle having a basis equal to the acreagein Col. 3 of Table 19.

-46-
To prevent leaching problems the total inside surface area of thelandfill rectangle will be covered with 2 inches of asphalt and 6 inchesof sand. At a cost of $6.46/sq yd (22) the total lining cost appears inTable 19, Col. 6.
Additionally there are engineering costs (e.g., initial study andsurveying) and costs for the various facilities (roads, fences, etc.).We have assumed that each of the above costs is $5,000 for all SLF studiedin this work.
The equipment needed at the SLF includes compactors (bulldozers)and scrapers. The former have already been included in the cost of therecycling plant (see Tables 12 to 15). We have assumed that the latterwill be rented and, therefore, their cost appears as part of the productioncost in the next section.
5.2 PRODUCTION COST ESTIMATE FOR THE RECYCLING PLANTS AT THE SLF SITES
The production cost of recycled aggregate is the sum of the productioncosts of the recycling plant and the SLF.
Recycling Plantof the followingance and repair,ance.
The production cost of the recycling plant is the sumitems: depreciation, write-off of set-up costs, maintenlabor, fuel and lubrication, overhead, interest and insur-
Depreciation cost is based on the economic life of the purchasedequipment, economic life being defined as the number of operating hoursthe equipment can service before becoming functionally obsolete. Wehave assumed a straight line depreciation method and an economic life of15,000 hours. Accordingly, the depreciation cost of equipment equalsthe purchasing cost of equipment over 15,000 hours. An estimate of thedepreciation cost of the various designed plants appears in Table 18,Col. 5.
The write-off of set-up costs will be based either on the economiclife of equipment or on the number of years the plant will be in operation

-47-
in the specific location, whichever is less. In this work. the latter,being no more than 5 years (Tables 24 to 33) is always less than the assumedlife of equipment which is 7.5 years (or 15,000 hours). We have assumed astraight line depreciation method; accordingly, the write-off of set-upcosts, in $/yr, will equal the amount of set-up costs over the number ofyears the plant will be in operation in the specific location. To convertthe above cost of dollars per year to dollars per hour one has to make anassumption about the number of hours the plant operates each year. For ayearly operation of 1000 hours and a plant that will be in operation for4 years in the disaster area, the write-off of set-up costs can be found inTable 18, Col. 6.
The maintenance and repair cost of the recycling system is estimatedto be 90% of the depreciation cost (Table 18, Col. 7).
Labor costs are presented in Col. 8 of Table 18 and have been derivedfrom Table 20; the latter shows labor requirements in each plant and laborwages. We have assumed that the administrative work is done by the crusheroperator.
The fuel cost for equipment powered by the central power unit (seeTables 12 to 15) has been calculated as follows: we have summed up thehorsepower requirements of the individual machines (Tables 12 to 15);multiplied the sum with a load factor of 0.8 to convert it to kw and havemultiplied the latter by the fuel cost per unit power generated in $/kw/hr.
The fuel cost per unit power generated varies with the size of the unit.For a 375 kw power unit, the fuel cost to generate one unit of power is$0.04/kw/hr. For a 500 kw power unit, the fuel cost to generate one unitof power is $0.036/kw/hr. These cost figures are based on a fuel consumption of 24 gallons/hr and 40 gallons/hr for the 375 kw and 500 kw powerunits, respectively, and on the current diesel fuel cost of $0.45/gallon (36).
Lubrication cost for equipment powered by the central power unit hasbeen estimated to be 25% of the fuel cost (12).
The sum of fuel and lubrication costs of individually powered equipmentappears in Tables 12 to 15.

-48-
The total fuel and lubrication cost of all equipment (individuallyand centrally powered) for all designed plants appears in Table 18, Col. 9.
We have assumed that overhead cost, in $/year, is equal to 1/2% ofinitial investment (Table 18, Col. 10). To convert the above cost in $/hrone has to make an assumption on the number of hours the plant was in operation during the year. Overhead costs in $/hr for the various designedplants at different operating hours per year appear in Table 21. It canbe seen from this Table that the overhead cost, in $/hr, significantly decreases as the hours of plant operation each year increases. For a plantoperating 1000 hours a year, the overhead cost, in $/hr, can be found inTab1e 18 , Col. 11.
We have assumed that the interest charge is 9% and the insurance chargeis an additional 1% of initial investment. The total hourly cost for thesecharges has been determined from Fig. 18. The latter provides us with amultiplier factor as a function of the sum of the two rates above and hoursof plant operation each year. The hourly cost is then obtained as follows(22):
Hourly cost for interest and insurance = Multiplier Factor xDelivered Price of Equipment/1000.
The hourly interest and insurance cost for the 4 designed plants and fordifferent hours of operation each year appear in Table 22. It can be seenfrom this Table that the insurance and interest cost drops significantlyas the number of hours of operation increases. For a pl ant operati ng 1000hours a year the interest and insurance charges can be found in Table 18,Col. 12.
The production cost of the designed recycling plants, exclusive ofdepreciation and write-off costs, appears in Table 23 for various levels ofhours of annual operation. Once again the significant impact of the numberof hours of operation on production cost can be seen.
The total production cost, in $/hr, of a recycling plant operating1000 hours a year for 4 years appears in Table 18, Col. 13. For plants

-49-
operating at average capacity each hour, this cost has been converted in
$/ton in Col. 14 of the same Table and has been plotted in Fig. 19 as afunction of plant capacity. It can be clearly seen that there are economiesof scale in the production cost of recycled aggregate.
SLF We have called production cost of the SLF system the sum of thefollowing costs: labor; maintenance, repairs, fuel and lubrication of equipment; purchase and hauling of cover material; administrative services; utilities; insurance; facilities maintenance.
A plot of the production cost in dollars per ton of debris that isstored at the SLF has been adopted from Ref. 22 and appears in Fig. 20. Asthe fill rate increases, production cost sharply decreases for small fillrates, but levels off at high fill rates. The actual production costs atthe designed SLF has been obtained from Fig. 20 and appears in line 3.2 ofTables 24 to 34.
The production cost described above has not taken into account therental cost of scrapers, the depreciation cost of the facilities and set-upand the annual property tax.
The rental cost of scrapers appears in line 3.3 of Tables 24 to 34.The number of scrapers requi red depends on the da i 1y fi 11 rate of the SLF(line 1.6, Tables 24 to 34). It is assumed in this work that one scraperis required for every 400 tons of fill per day of operation. The rentalcost of an 11 cu yd capacity self loading scraper is $2910 per month.
All items of initial investment with the exception of land are depreciable. We have assumed a straight line depreciation over the investment period at the SLF. The estimated charges appear in line 3.4 of Tables24 to 34.
Finally, we have assumed a 7.5% annual property tax on the value ofland and facilities. The value of landandfacilities has been obtainedfrom Table 19; the resulting tax appears in line 3.5 of Tables 24 to 34.

-50-
5.3 ANNUAL INCOME STATEMENTS OF RECYCLING SYSTEMS
In this work we have studied promising systems (combinations) ofrecycling plants at SLF's that will process the concrete debris generatedby a natural disaster. These combinations are described in Tables 24 to34 from which it can be seen that depending on the quantities of debrisproduced one or two recycling plants of different capacities, adjacent toSLF's are established. Each of these plants is in operation in the disaster area for different lengths of time. The latter varies from a minimumof 2 to a maximum of 5 years.
The annual statement of income of all combinations studied appear inPart IV of Tables 24 to 34. Revenue is generated from three sources:a) Sale of recycled aggregate. We have assumed that 100% of processedaggregate will be sold. The sale price is $1.67 ton. This is the actualprice at which recycled concrete sells at los Angeles (52). Furthermore,it is the coarse aggregate price that will yield a recycled aggregate concrete of the same cost as natural aggregate concrete when both types ofconcrete have the same properties and the quarry price of natural aggregateis $3.30/ton.
Based on the above assumptions, the total annual revenue from the saleof aggregate equals $1.67/ton times the tonnage of concrete aggregate produced (line 4.1, Tables 24 to 34).b) Sale of re-bars. We have assumed that the revenue from the sale of rebars amounts to $0.25 per ton of concrete debris processed (22). Therefore,the total revenue generated from this source each year is: $0.25/ton timesthe tonnage of concrete aggregate produced (line 4.2, Tables 24 to 34).c) Dumping charges. Dumping charges at the recycling plant-SLF combinations are so set as to attract dumping of concrete debris while at the sametime discouraging dumping of non-concrete debris. The prevailing dumpingcharges are $?.OO/ton for inorganic waste and $4.50/ton for organic waste(22). In order to achieve the stated objectives, we have adopted the following charging system: dumping of concrete debris is free; $5.00/ton ischarged for the dumping of non-concrete debris.

-51-
It follows that the annual revenue from dumping charges is:times the tonnage of non-concrete debris dumped in the SLF during(line 4.3 of Tables 24 to 34).
$5.00jton
the year
Annual expenses at the recycling plant-SLF system are the following:a) production cost of the recycling plant (line 4.4, Tables 24 to 34);b) total production cost, including depreciation and write-off costs,rental cost of scrapers and property taxes, of the SLF (line 4.6, Tables
24 to 34).
The difference between the sum totals of the above revenues and expensesis operating income. A 50% income charge is imposed on the latter so thatnet income is the remaining 50% of the operating income (line 4.11, Tables
24-34).
All'plant combinations analyzed in this study have a positive net income (profit). This fact alone, however, insufficiently justifies investment in this type of operation.
5.4 ATTRACTIVENESS OF INVESTING IN THE RECYCLING SYSTEMS
To investigate whether the profit derived in the previous section issatisfactory when investment requirements and other investment opportunitiesare taken into account, a net present value analysis was performed. Tothis end the cash flow of the recycling systems was estimated in Part V ofTables 24 to 34 as follows:
Cash outflow in any year includes capital investment (if any), theproduction cost of the recycling plant(s), excluding depreciation and writeoff of set-up costs (line 2.11, Tables 24 to 34) and the total productioncost of the SLF(s) including property tax and rental cost of equipmentand excluding depreciation.
All cash outflow for capital investment occurred in the beginning ofoperations and equalled the sum total of investment in the recycling plant(s)and SLF(s).

-52-
Depreciation and write-off charges have been consistently excludedfrom cash outflows, since they do not represent actual cash payments.
Cash inflow in any year includes sale of capital (if any) operatingrevenues and a tax shield which is 50% of total depreciation.
All sale of capital took place at the end of the investment periodand involved sale of equipment and the SLF land. The salvage value ofp1ant(s) was assumed to be equal to the difference between the pruchasingcost and lIaccumu1atedll depreciation cost of equipment (line 2.12, Tables24 to 34). At the same time the SLF area, after having been completelyfilled with refuse material and properly treated, is assumed to have beensold at $15,000/acre. This is $5,000/acre more than the original price andis subject to a 30% capital gain tax. Therefore, the net receipt from thesale of land was 70% of the profit plus the original purchasing price ofland. All other facilities and assets at the SLF are assumed to have zerosalvage value at the end of the investment period (line 3.6, Tables 24 to34).
All cash flows were discounted by 15% to get their present values (line5.7, Tables 24 to 34) and the algebraic sum of all present values gives thenet present value of investment. The latter was negative in one instanceonly: when the total quantity of debris produced by the natural disasterwas only 0.5 million tons (line 5.8, Table 24 and Table 35). In this caserecycling operations generated a return of less than 15%. In all othercases - where the natural disaster produced at least 1 million tons of concrete debris - the recycling systems generated a return higher than 15% (thenet present value was positive - line 5.8, Tables 25 to 34 and Table 35).
We have asked the question on the attractiveness of investment in arecycling system in still another way: what is the rate of earning atwhich the present value of the earnings equals the amount of investment?This earnings rate is called internal rate of return and has been estimatedfor all 11 recycling systems in Table 35. It can be seen that in caseswhere the natural disaster has generated at least 1 million tons of concrete debris recycling systems have generated an internal rate of return

-53-
of at least 19% and as high as 47%. That is, investment in these recyclingsystems is very attractive.
5.5 COMPARISON OF RECYCLED AGGREGATE CONCRETE AND NATURAL AGGREGATECONCRETE
In previous sections the implicit assumption has been made that therecycled aggregate producer will be able to sell 100% of his product. Forthis assumption to be correct, recycled aggregate must compare favorablywith its competitor, natural aggregate.
A fair comparison between the two types of aggregate would involvecomparison of two concrete members of equal performance, one made withrecycled and the other made with natural aggregate. To compensate forthe reduced strength (see Cahpter 2 of this report) the member using recycled aggregate would have to have a 10% higher cement content.
To assist in derivation of specific numbers, Table 34 contains thematerial composition of 1 cu yd of natural aggregate concrete and thatof an equal performance recycled aggregate concrete. The only differencein material quantities between the above two types of concrete is the highercement content of RAC. We have made the assumption that natural coarseaggregate is available at the market site and that the same is true forrecycled aggregate. Under these assumptions and for a price of $3.30/tonfor the natural aggregate, recycled aggregate should sell for $1.67/tonin order to yield concrete of equal cost and performance (Table 36). Inother words, when there is no transportation advantage of either aggregate,an unprejudiced person would be indifferent between natural aggregatethat sells for $3.30/ton and recycled aggregate that sells for $1.67/ton.
However, there are good reasons why a person can be prejudiced againstrecycled concrete. For one, experience with it is limited; secondly, thereare no design aids for recycled aggregate similar to the design aids (forinstance in the form of Tables of properties) that exist for natural aggregate.
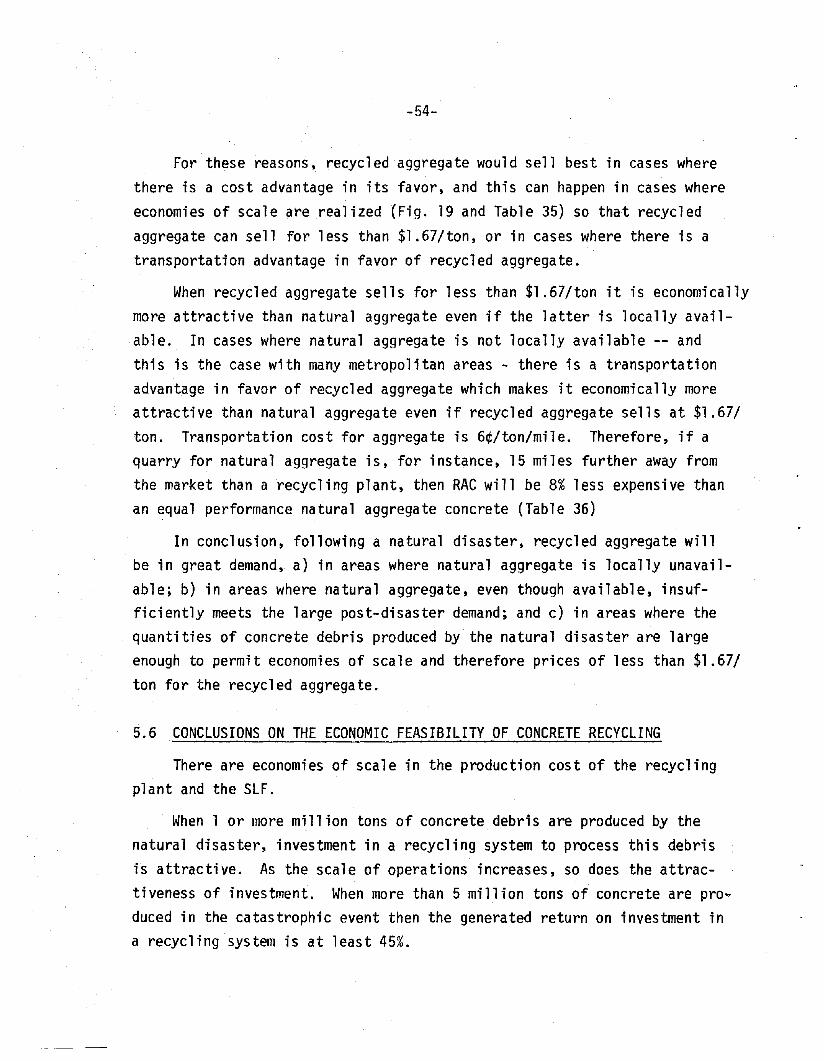
-54-
For these reasons, recycled aggregate would sell best in cases wherethere is a cost advantage in its favor, and this can happen in cases whereeconomies of scale are realized (Fig. 19 and Table 35) so that recycledaggregate can sell for less than $1.67/ton, or in cases where there is atransportation advantage in favor of recycled aggregate.
When recycled aggregate sells for less than $1.67/ton itis economicallymore attractive than natural aggregate even if the latter is locally available. In cases where natural aggregate is not locally available -- andthis is the case with many metropolitan areas - there is a transportationadvantage in favor of recycled aggregate which makes it economically moreattractive than natural aggregate even if recycled aggregate sells at $1.67/ton. Transportation cost for aggregate is 6¢/ton/mile. Therefore, if aquarry for natural aggregate is, for instance, 15 miles further away fromthe market than a recycling plant, then RAC will be 8% less expensive thanan equal performance natural aggregate concrete (Table 36)
In conclusion, following a natural disaster, recycled aggregate willbe in great demand, a) in areas where natural aggregate is locally unavailable; b) in areas where natural aggregate, even though available, insufficiently meets the large post-disaster demand; and c) in areas where thequantities of concrete debris produced by the natural disaster are largeenough to permit economies of scale and therefore prices of less than $1.67/ton for the recycled aggregate.
5.6 CONCLUSIONS ON THE ECONOMIC FEASIBILITY OF CONCRETE RECYCLING
There are economies of scale in the production cost of the recyclingplant and the SLF.
When 1 or more million tons of concrete debris are produced by thenatural disaster, investment in a recycling system to process this debrisis attractive. As the scale of operations increases, so does the attractiveness of investment. When more than 5 million tons of concrete are produced in the catastrophic event then the generated return on investment ina recycling system is at least 45%.

-55-
The above conclusions are based on the assumption that recycled aggregate sells at the price of $1.67/ton which yields a recycled aggregate concrete of equal cost with a natural aggregate concrete of the same performance. The attractiveness of recycled aggregate vis a vis natural aggregate will be enhanced when either recycled aggregate sells for less than$1.67/ton or natural aggregate is locally unavailable. The former canhappen at large scale operations where economies of scale are realizedand the producer can reduce the price of his product while still realizingsubstantial profits. The latter is often presently the case in metropolitanareas and can certainly be the case in the disaster area, especially inthe reconstruction period when demand for materials is strong.

-56-
CHAPTER 6
CONCLUSIONS
Concrete is the most popular construction material and the most abundantone in demolition debris: it accounts for 67% by weight of demolition wastes.Immense quantities of concrete debris are produced in a natural disaster.For instance, in the San Fernando earthquake of 1971,5 million tons ofconcrete debris were produced. There are about 200 major disasters in thiscountry per decade (19) which means that the tonnage of concrete debris produced from disasters is of the order of a billion tons per decade and a hundred million tons per year. These mountains of debris can be dumped or theycan be recycled.
Technologically speaking, concrete debris, free from contaminants, isa satisfactory substitute for coarse aggregate in the production of new concrete. Recycled aggregate concrete has lower strength than natural aggregate concrete of the same composition, however~ the mix composition can bemanipulated (for instance, through an increase of the cement content) toproduce recycled aggregate concrete of the same strength as natural aggregate concrete. The above conclusions are supported both by experimentalwork and field experience: in a recent highway project the demolishedconcrete pavement has been recycled as aggregate for the new concretepavement (41).
Most concrete debris is contaminated with gypsum, wood, plastics,glass, etc. Fortunately, the existing technology of the natural aggregateindustry (aggregate beneficiation processes) can adequately eliminate detrimental concrete contaminants.
Recycling plants of large capacity (up to 750 TPH) can be totallybased on standard, widely used equipment. Along these lines 14 concreterecycling plants of small to medium capacity are presently in operation.These are mostly portable plants quickly assembled at the site of debrisaccumulation.

-57-
In terms of economics, recycling of concrete debris following a majordisaster is indeed attractive. We have made an estimate of the return oninvestment based on the assumption that recycled aggregate sells at a pricethat would yield a recycled concrete of the same cost with an equal performance natural aggregate concrete. We found that in cases where a naturaldisaster will produce one or more million tons of concrete debris, the recycling operations will yield a return of at least 19%. As the quantitiesof debris increases, so does the return on investment of the recycling operations. When the debris produced by the catastrophic event amounts to7 million tons, recycling operations yield the lucrative return of 47%.
Are consumers willing to buy recycled concrete? At the price of$1.67/ton for recycled aggregate - vis a vis a price of $3.30/ton fornatural aggregate - an unbiased consumer will be indifferent between recycled and natural aggregate, since in either case the final product, concrete,will cost the same and will perform identically as construction material.Even in the presence of consumers who may be biased against it, however,prospects for recycled aggregate sales are good because the economics inseveral cases are in favor of the recycled product. For instance, naturalaggregate is locally unavailable in several areas to the point where recentresearch is focusing on exotic solutions, such as digging aggregate fromthe ocean floor (44). In all these cases, there is a significant transportation advantage in favor of recycled aggregate. Even where natural aggregate is locally available there might not be large enough quantities tomeet the sudden increase in demand following reconstruction. Furthermore,the potential returns realized at high levels of recycling operations areso large that recycled aggregate producers can afford to lower their pricesto undersell their competitors (natural aggregate producers) while stillrealizing significant savings.
We can trace the above in our study of the San Fernando earthquake of1971. In the San Fernando area natural aggregate is locally unavailable.Most of the aggregate used requires one-way truck hauls of up to 50 miles(52). For this reason, several of the recycling plants that presentlyexist are located in this area. Following the 1971 earthquake the impressive mass of 5 x 10⁶ million tons of concrete debris has been dumped. The

-58-
alternative would have been to recycle the above debris as concrete aggregate that would yield concrete of no inferior quality than natural aggregate concrete, that woul d save mill ions of dollars to consumers and granta 45% return on investment to producers.

-59
REFERENCES
1. Archer, F.C., design suggested by,Engineering Dept., Te1smith Division,Barber-Greene Company, Wisconsin, March 4, 1977.
2. Armstrong, R.B., The Office Industry: Patterns of Growth and Location,The M.I.T. Press, Cambridge, Mass., 1972.
3. Benfer, N.A., ancl Coffman, J. L., ed., San Fernando California Earthquake of February 9, 1971, Vols. I, II and III, published by the U.S.Department of Commerce, National Oceanic and Atmospheric Administration and Environmental Research Laboratories, U.S. Government PrintingOffice, Washington, D.C., 1973.
4. Buck, A.D., IIRecyc1ed Concrete,1I Highway Research Record, No. 430,1973, pp. 1-8.
5. Budnikov, P.P., "Role of Gypsum in the Hardening of Hydraulic Cements,"Proceedings of the Fourth International Symposium on the Chemistry ofCement, United States Department of Commerce, National Bureau of Standards, Monograph 43, Vol. I, August, 1962, pp. 469-477.
6. Bynum, D. Jr., IIAsphalt Pavement from Glass and Rubber t~astes," Ruraland Urban Roads, Dec. 1971, pp. 24-25.
7. Chatterfee, S., and Mikucki, W., "Resource Recovery in the Constructionand Demolition Industry,1I final report, Battelle Columbus Laboratories,Columbus, OH., Nov. 1976.
8. Crusher, Kue-ken Jaw for Hard, Tough and Abrasive Material," Bulletin5016, 74-R-IM, Pennsylvania Crusher Corp., 1977.
9. IICrushing Concrete Rubble into Subbase Aggregate,1I Roads and Streets,Vol. 114, No.5, May, 1971, pp. 44-45.
10. Czernin, W., Cement Chemistry and Physics for Civil Engineers., Chemical Publishing Company, New York, N.Y., 1962.
11. Daily, J.W., and Harleman, D.R., Fluid Dynamics, Addison-Wesley Publishing Co., Inc., Reading, Mass., 1973, p. 25.
12. Diez, R.L., Maloney, L.D., editors, Builder's Estimating Factbook,Cahners Books, Boston, MA., 1974, p. 29.
13. Dodge, F.W., Division McGraw-Hill Information Systems Compo , II DodgeData,1I Identification No. DPP-2, New York, N.Y., 1973.
14. Frondistou-Yannas, S.A., liThe Hydraulic Cement Industry in the UnitedStates. A State of the Art Review," Report No. R76-41, Departmentof Civil Engineering, Massachusetts Institute of Technology, Cambridge,MA., Fall 1976 (NTIS No. PB2658747 AS).

-60-
15. Frondistou-Yannas, S., and Itoh, T., "Economic Feasibility of Concrete Recycling," Journal of the Structural Division, ASCE, Vol.103, No. ST4, April, 1977, pp. 885-899.
16. Frondistou-Yannas, S., "Waste Concrete as Aggregate for New Concrete,"Journal of the American Concrete Institute, Vol. 74, No.8, August,1977, pp. 373-376.
17. General Catalog, Section "C", Eagle Iron \~orks, Des t4oines, Iowa,1967.
18. Gluzge, P.J., "The Work of Scientific Research Institutes," Cidrotekhnicheskoye Stroitelstvo, U.S.S.R., No.4, April, 1946, pp. 2728, Brief English Summary in Engineer's Digest, Vol. 7, No. 10, 1946,p. 330.
19. Haas, J.E., editor, Reconstruction Following Disaster, The MIT Press,Cambridge, Mass., 1977.
20. Hagerty, D.J., Pavoni, J.L., Heer, J.E., Jr., Solid Waste Management,Van Nostrand Reinhold Company, New York, 1973, p. 183.
21. Howard, S.C., Rudy, S.L., Conn, A.F., "Development of a Ship HullCleaning System Using the Cavijer TM Cavitating Water Jet Method,1ITechnical Memorandum 7510-1, Hydronautics, Inc., Washington, D.C.,January, 1975.
22. Itoh,T., IIAn Assessment of the Economic Attractiveness of Waste Concrete as Agg.regate Material," thesis presented to Mass. Institute ofTechnology in Cambridge, Mass., in 1976, in partial fulfillment ofthe requirements for the degree of Master of Science.
23. Lea, F.N., The Chemistry of Cement and Concrete, Edward Arnold Publishing Co., Ltd., London, England, 1956.
24. Lee, R.D., IIJet Cutting Progress,1I Chartered Mechanical Engineer,England, June 1974, pp. 69-72.
25. Lerch, W., liThe Influence of Gypsum on the Hydration and Propertiesof Portland Cement Pastes," Proceedings, American Society for Testing and Materials, Vol. 46, 1946, pp. 1252-1297.
26. Leslie, E.N., "Automated Water Jet Cutting," Mechanical Engineering,Vol. 38, No. 12, December, 1976, pp. 40-44.
27. Malhotra, V.M., IIUse of Recycled Concrete as a New Aggregate," Report 76-18, Canada Centre for Mineral and Energy Technology, Ottawa,Canada, 1976.
-,

-61-
28. Marek, C.R., Gallaway, B.M., Long, R.E., IILook at Processed Rubble It1s a Valuable Source of Aggregates," Roads and Streets, Vol. 114,No.9, Sept. 1971, pp. 82-85.
29. Marek, C.R., IISupplemental Aggregates for Construction," Journal ofMaterials, Vol. 7, No.1, 1972, pp. 50-54.
30. McCurrich, L.H., and Browne, R.D., IIApplication of Water Jet CuttingTechnology to Cement Grouts and Concrete," paper 67, Proceedings,First International Symposium on Jet Cutting Technology, at the University of Warwick, Coventry, England. The British HydromechanicsResearch Association, Cranfield, Bedford, England, April 1972, p. 83.
31. Newman, H.J., liThe Utilization of Brick Rubble from Demolished Shelters as Aggregate for Concrete," Inst. Mun. Co., Eng. J., Vol. 73,No.2, 1946, pp. 113-121.
32. Newman, K., "Concrete Systems,1I Composite Materials, L. Holliday,editor, American Elsevier Publishing Co., New York, 1966, pp. 336452.
33. Nixon, P.J., liThe Use of Materials from Demolition in Construction,1IReport of the Building Research Establishment, Garston, Watford,Engl and, 1976.
34. Page, R.A., Blume, J.A., and Joyner, W.B., IIEarthquake Shaking andDamage to Buildings,1I Science, Vol. 189, No. 4203, August 22, 1975,pp. 601-608.
35. Personal communication, with Mr. Coppess, Chief Engineer atthe American Aggregates Corp., Greenfield, Ohio, 1976.
36. Personal communication with Mr. Donald Park of Cindaco, Inc., Dayton,Ohio, 1977.
37. Phillips, J.C., et al., IIRefuse Glass Aggregate in Portland CementConcrete,1I Proceedings of the Third Mineral Waste Utilization Symposium, U.S. Bureau of Mines, Washington, D.C., March 1972, pp. 385391.
38. "Planer Chews Old Pavements Into Reusable Base Chips," EngineeringNews-Record, Vol. 194, No. 13, March 27, 1975, p. 24.
39. Ploger, R.R., IIAn Investigation of the Compressive Strength of Concrete in which Concrete Rubble was Used as Aggregate,1I Thesis presented to Cornell University at Ithaca, New York, in 1947 in partialfulfillment of the requirements for the degree of Master of Science.

-62-
40. "Policy Statement of Aggregate Availability," Internal Memorandum,National Crushed Stone Association, Silver Spring, Md., January,1975. .
41. "P.C. Pavement Recycled," Mid-Hest Contractor, Oct. 6, 1976, pp. 1622.
42. "Recycled Rubble Saves Contractors Money," Roads and Streets, Vol.116, No.4, April, 1973, pp. 80-83.
43. "Recycling Rubble for Highway Purposes," Public Works, Vol. 103, No.10, Oct. 1972, pp. 87-88.
44. "Report Cites Potential in Ocean Floor Sand and Gravel," Tech Talk,Vol. 21, No. 24, Mass. Inst. of Technology, Cambridge, Mass., Feb. 2,1977.
45. "Re-use of Brick Rubble from Shelters, Blast l~al1s, Defense Posts,etc." Report TC 1413, Building Research Establishment, England, 1945.
46. Roth, L., "Can Waste Replace Conventional Aggregates?" Michigan Contractor and Builder, Feb. 17, 1973, pp. 18-20.
47. The Sanborn Map Company, Pelham, New York, N.Y.~
48. United States Coast and Geodetic Survey, "Earthquake Investigationsin the Western United States, 1931-1964," Publication 41-2, U.S.Department of Commerce, Coast and Geodetic Survey, D. S. Carder, ed.,U.S. Government Printing Office, Washington, D.C., 1964.
49. U.S. Department of Commerce, National Oceanic and Atmospheric Administration, Environmental Research Laboratories, A Study of EarthguakeLosses in the Los Angeles, California Area, A Report prepared for theFederal Disaster Assistance Administration and the Department of Housing and Urban Development, U.S. Government Printing Office, Washington, D.C., 1973.
50. U.S. Department of the Interior, U.S. Department of Commerce, The SanFernando, Ca1ifornia,Earthguake of February 9, 1971: A PreliminaryReport, published by the U.S.· Geological Survey and the NationalOceanic and Atmospheric Administration, U.S. Government PrintingOffice, Washington, D.C., 1971.
51. "Water-Powered Gun is Used to Dismantle Boxcars," Solid Wastes Management, January 1971, pp. 28.
52. White, T.W., "Recycling of Concrete and Asphalt Rubble,u MarketingResearch Report, Nordberg Machinery Group, Rexnord, Inc., Milwaukee,Wisconsin, March, 1976.

-63-
53. Whitman, R.V., Hong, S.T., and Reed, J.~1., "Damage Statistics forHigh-Rise Buildings in the Vicinity of the San Fernando Earthquake,1IResearch Report R73-24, Department of Civil Engineering, Mass. Institute of Technology, Cambridge, Mass., 1973.
54. Whitman, R.V., "Damage Probability t4atrices for Prototype Buildings,"Research Report R73-57, Department of Civil Engineering, Mass. Institute of Technology, Cambridge, Mass., Oct., 1973.
55. Hiesman, R.M., and Wilson, D.G., "An Investigation of the Potentialfor Resource Recovery from Demolition Wastes," Report, Systems, andDesign Division, Dept. of Mechanical Engineering, Mass. Inst. ofTechnology, Oct., 1976.
56. Wilson, D.G., Foley, P., l~iesman, R., and Frondistou-Yannas, S.,"Demolition Debris: Quantities, Composition and Possibilities forRecycling," Proceedings of the 5th r·1ineral Waste Utilization Symposium, Bureau of Mines, Chicago, Ill., 1976.

TABL
E1.
-C
ompr
essi
veSt
l"en
gth
of
the
Rec
ycle
dSp
ecim
ens
and
of
Con
trol
s
I en +=:
I
Typ
eo
fA
geC
om
pre
ss
;veS
tr
en
gt
h(p
si)
,S~ecimen
Day
s.
Por
tlan
dC
emen
tTy
peI
Por
tlan
dC
emen
tTy
peII
~w
ater
toce
men
tra
tio
wat
erto
cem
ent
rati
o
0.45
0.55
0.65
0.75
0.45
0.55
0.65
0.75
II
I14
4750
:.320
3680
:.310
2580
+255
1855
:.305
4746
+160
3620
+329
2500
+210
1850
+357
ICo~trol
2849
80+5
8041
50+4
8031
25+3
4525
20+2
7049
00+6
7840
80+1
4631
20+4
1023
00+2
15
,49
5355~450
4820
+508
3790~407
2390
+110
5260~555
4560~398
3680~400
213C
:235
---
Unc
on-
1445
10+4
2534
85+4
0523
80+2
2515
90+1
2537
80+1
3526
40+4
7520
85+1
1014
25+1
10-
-tt
amin
ated
2843
85+
360
3910
+108
2570
+58
1790
:.221
4070
+150
3860
+352
2505
+230
1795~283
~
!KA
C49
5260~'219
4220
+135
2537
+65
2200
+180
4840
+509
4010
+580
2960
+305
2190
+140
L-
--
-----I
Con
tam
-14
2630
+458
1790
+334
1660
+182
990+
106
3330
+296
2340
+280
1880
+175
1470
+110
--
inat
ed28
3480
+542
2700
+698
2050
+206
1290
+51
3510
+52
0'34
80+2
2024
70+8
015
80+
124
RAe
4936
20+5
3727
10+1
6021
00+8
416
10+1
636
80+4
7437
90+1
3426
80+8
823
10+2
64f---
..-----,---+
----t------+
-----+
------+
--------jI--------+-----+-----+----~-l
II14
780+
180
706+
8270
6+45
680+
75G
ypsu
m-
2811
60+6
185
0+65
1100
+130
1060
+71
j!'ic
rtar
I49
940+
160
'990
+77
950+
160
940+
159

" / \'-.,
;1
of r.~.,,~ ...
lume
sly in :.:.. :r-.
05+0.0814+0.14
16:!;.0.12
ens P(':"~",
ortland Ceype II
55+0.1969+0.1372+0.18
04+0.22
14+0.1327+0.14
-65-
TABLE 2. - Volume Changes of Concrete* Cylinders Stored in Water
Type of Amount of Gypsum in the Mix Age Volume Changes (Expansion)Specimen .' Days
Gypsum - % Calculated Cylinders Stored Continuouby \.,reight as S03 - %of cement by welght Percent of one-day vo
of cementSpecimens produced Specimwith Portland Ce- with Pment Type I ment T
Uncontam- 14 0.03+0.12 O.inated 0 0 28 0.15+0.13 O.Gypsum 49 0.14,::0.16 O.
Contam- 14 0.04+0.15 O.inated 15 7 28 0.90+0.08 O.Gypsum
;';" 49. 0.31+0.25 O.
14 0.82+0.24 O.Gypsum- 225 1,95 28 1.00+0.21 O.~tortar
49 1.18+0.21 O.-
*The water to cement ratio was kept constant at 0.55.


"
TABL
E3.
-C
onsi
sten
cyo
fth
eR
ecyc
led
Spec
imen
san
dT
heir
Con
trol
s.
I 'O'l
O'l I
Type
S1
u·m
p*(i
nc
he
s)o
fP
ortl
and
Cem
ent
Type
IISp
ecim
enP
ortl
and
Cem
ent
Type
I
wat
erto
cem
ent
rati
ow
ater
toce
men
tra
tio
0.45
0.55
0.65
0.75
0.45
0.55
0.65
0.75
Con
trol
0.42
+0.1
21.
62+0
.16
3.29
+0.2
13.
75+0
.10
0.38
+0.1
71.
58+0
.21
3.32
+0.6
73.
45+0
.36
l-U
ncon
tam
in-
0.26
+0.1
01.
45+
0.38
3.38
+0.4
53.
75+0
.20
0.25
+0.1
01.
42+0
.20
2.88
+0.4
33.
25+0
.25
ated
RAe
4 I
Con
tam
in-
0.20
+0.1
51.
20+0
.30
3.17
+0.4
23.
67+0
.18
0.18
+0.1
01.
21+0
.25
3.25
+0.1
03.
62+0
.17
ated
RAe
Gyp
sum
0.15
+0.1
00.
75+0
.20
0.25
+0.1
20.
88+
0.30
!~ortar
*~easured
ona
6in
cone
.

-65-
TABLE 2. - Volume Changes of Concrete* Cylinders Stored in Water
Type of Amount of Gypsum in the Mix Age Volume Changes (Expansion) of ConcreteSpecimen .- Days
Gypsum - % Calculated Cylinders Stored Continuously in W~ter
by weight as SO~ - %of cement by welght Percent of one-day volume
of cement I
Specimens produced Spec; mens proeuced Iwith Portland Ce- with Portland Ce-ment Type I ment Type II
Uncontam- 14 0.03+0.12 0.05+0.08inated 0 0 28 0.15+0.13 0.14+0.14Gypsum 49 0.14+0.16 0.16+0.12- -
Contam- 14 0.04+0.15 0.04+0.22inated 15 7 28 0.90+0.08 O. 14+0.13Gypsum ;;: 49. 0.31+0.25 0.27+0.14- -
14 0.82+0.24 0.55+0.19Gypsum- 225 105 28 1.00+0.21 0.69+0.13~1ortar ..
49 1.18+0.21 0.72+0.18- -
*The water to cement ratio was kept constant at 0.55.
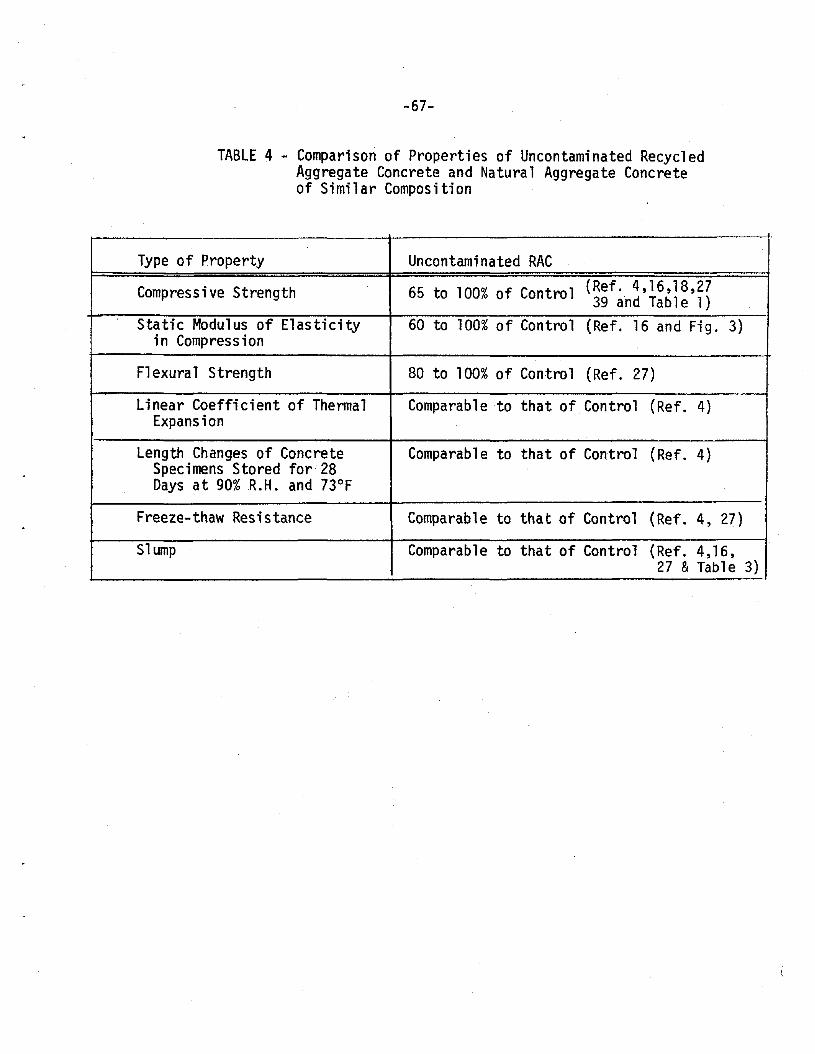
.,67-
TABLE 4 - Comparison of Properties of Uncontaminated RecycledAggregate Concrete and Natural Aggregate Concreteof Similar Composition
~-- .
Type of Property Uncontaminated RAC
Compressive Strength 65 to 100% of Control (Ref. 4,16,18,2739 and Tabl e l)
Static Modulus of Elasticity 60 to 100% of Control (Ref. 16 and Fig. 3)in Compression
Flexural Strength 80 to 100% of Control (Ref. 27),,---
Linear Coefficient of Thermal Comparable to that of Control (Ref. 4)Expansion
Length Changes of Concrete Comparable to that of Control (Ref. 4)Specimens Stored for 28Days at 90% R.H. and 73°F
Freeze-thaw Resistance Comparable to that of Control (Ref. 4, 27)
Slump Comparab1e to that of Control (Ref. 4,16,27 &Table 3)

-68-TABLE 5 - Damage Probability Matrix for Buildings* (54)
•._--_._----------,Percent of Total Square Footage !
iin Each Dam3Q.e_._S_t_a_t_e__--Earthquake Intensity on the I
Modified Mercalli Scale I
,
Des.i gn Strategy Damage State
v VI VII VII I IX x
2773aaa
100ooao
100oaao
NoneLi ghtModerateHeavyTotal
NoneLightModerateHeavyTotal
UBC** Ot 1
UBC** 2
UBC** 3 '.
47 20 a 0 a53 50 10 a aa 29 53 a o.
~ ~ 3~ [1 o~ .11:0None 100 57 25 0 a 0light 0 43 50 25 0 aModerate a 0 25 53 20 a!
'-. ~_:'--'-__~_~_~~_~ .l.__~_.L._~J}[2cnrr;;f]
I----------.f----------- -.._--
* The matrix is applicable to non-wooden construction only.** Uniform Q.uilding Coele (UBC) seismic zoning Ot 1t 2 or 3•
..

.TA
BLE
6-
Def
initi
onof
Dam
age
Sta
tes
for
Bui
ldin
gsan
dC
oncr
ete
Deb
risG
ener
atio
n
Dam
age
Rat
io=
Str
uctu
ral
Conc:""~te
Cos
tof
Rep
air-
Con
cret
eD
ebri
sin
gO
ver
Cos
tT
hat
Nee
dsG
ener
ated
ofR
epla
cem
ent
Rep
lace
men
tto
ns/
sq.f
t.Da
mag
eS
tate
*V
erba
lO
escr
iptio
n*%
%(1
)(2
)(3
)(4
)(5
)={4
)xO
.06
O·
--
None
Noda
maq
e.--
Lig
ht
Min
oror
loca
lize
dno
n-st
ruct
ural
dam
age.
Afe
ww
alls
and
0.3
--
part
itio
nscr
acke
d.In
cide
ntal
mec
hani
cal
and
elec
tric
alda
mag
e.
Nod
erat
eW
ides
prea
dno
n-st
ruct
ural
dam
age.
Poss
ibly
som
est
ruc-
5-
-I 0\
tura
lda
mag
ew
ithob
viou
scr
acki
ngor
yiel
ding
inso
me
ID I
stru
ctur
alm
embe
rs.
--
Hea
vyM
ajor
stru
ctur
alda
mag
ere
quir
ing
repa
iror
repl
acem
ent
of30
',1'
0.00
65m
any
stru
ctur
alm
embe
rs.
Ass
ocia
ted
non-
stru
ctup
alda
mag
ere
quir
ing
repa
irs
ofm
ajor
port
ion
ofin
teri
or.
Bui
ldin
gva
cate
ddu
ring
repa
irs.
...
Tot
alB
uild
ing
cond
emne
dor
coll
apse
d...
100
100
0.06
,
*A
fter
Ref
eren
ce(5
4).
.,):~'....
I'
;.
! I I I i I;j
IiI
II'
t(~
t If II I1
"'"
~
('
\


,. ""','
~
\ I 1 ! r , I ! I t I i I t!
! [I .... o t
o
660
6600
Con
cret
eD
ebri
s•
Gen
erat
edto
ns/m
ile
*(4
)=(3
)x66
00t~ns
mll
e
o 10 100'
Ver
bal
Des
crip
tion
(2)
TABL
E7
-D
efin
itio
nof
Dam
age
Sta
tes
for
Hig
hway
san
dC
oncr
ete
Deb
risG
ener
atio
n.
Con
cret
eT
hat.
Nee
dsR
epla
cem
ent
% (3)
Non
eor
insi
gn
ific
ant
mov
emen
to
fth
ehi
ghw
ayse
gmen
t**
asa
who
le;
min
orcr
acki
ngan
ddi
spla
cem
ent
of
pave
men
tsl
abs
inroad~ay
segm
ent;
som
ecr
acki
ngan
dsp
alli
ngo
fco
ncre
tep
ier
inbr
idge
segm
ent.
Sig
nif
ican
td
iffe
ren
tial
sett
lem
ent
or
late
ral
'dis
plac
emen
tre
lati
ve
to.a
djac
ent
high
way
segm
ents
,ex
tens
ive
crac
king
and
disp
lace
me:
ntof
pave
men
tsl
abin
road
l-/ay
segm
ents
;co
lla
pse
orse
vere
stru
ctu
ral
dam
age
inbr
idge
segm
ent.*
**
Min
ord
iffe
ren
tial
sett
lem
ent
or
late
ral
disp
lace
men
tre
la
tiv
eto
adja
cent
high
way
segm
ents
asa
who
le;
sig
nif
ican
tcr
acki
ngan
ddi
spla
cem
ent
of
pave
men
tsl
abs
inro
adw
ayse
gm
ent;
som
est
ruct
ura
lda
mag
ein
brid
gese
gmen
t.
Min
or'
Dam
age
Sta
te(1
)
Hea
vy
f.4.o
dera
te
*66
00to
ns04
'co
ncre
tear
eus
edpe
rhi
ghw
aym
ile(2
2).
,**
Thl;.
term
"hig
h'l/a
yse
gmen
t"as
used
here
refe
rsto
high
..../ay
segm
ents
of
quit
eun
ifor
mch
arac
teri
stic
s.e.
g••
aro
adw
ayse
gmen
tth
atha
sun
ifor
ms1
0pe
orcu
rvat
ure,
ora
sing
1ebr
idge
over
pass
.**
*H
eavy
dam
age
pref
eren
tia1
1yoc
curs
atth
ebr
idge
-em
bank
men
tju
ncti
ons.
inlo
cati
ons
whe
rehe
avy
land
sl
ides
occu
ran
din
rout
ein
terc
hang
es.
~
I,
I
~~"~~"
C~.~.,c.c,ci~~,


.~... /
, .I .
-71-
,.fh
" TABLE 8 - Concrete Debris from Buildings:San Fernando Earthquake of 1971.
516 x 106
al Ar.lountConcr('~"e
Debrisnerated,tons
=(4)x(5)
.!
Type of Building Number of Average Squat-e Total Concrete TotConstruct'ion and Damaged Footage of Damaged Debris of
Damage State Buildings* Damaged Square Generated,Buildings Footage tons/sq. ft. ** Ge
(1) (2) (3) (4)=(2)x{3) (5) (6)-
Residential Space 65 90200 5.86 x 10⁶ 0.06 0.3rotally Damaged
Residential Space 265 90200 23.9 x 10⁶ 0.0066 0.1Heavi ly Damaged
" ..." .:.-
Non-Residential 574 106600 61.19 x 10⁶ 0.06 3.7Space
lota l1y Damaged
Non- Resi denti a1 1125.
106600 119.92 x 10⁶ 0.0066 0.7Space
Heavi ly Damaged - -
" TOTAL 5.0"
,
* After Ref. 3.** From Table 6, Col. 5.

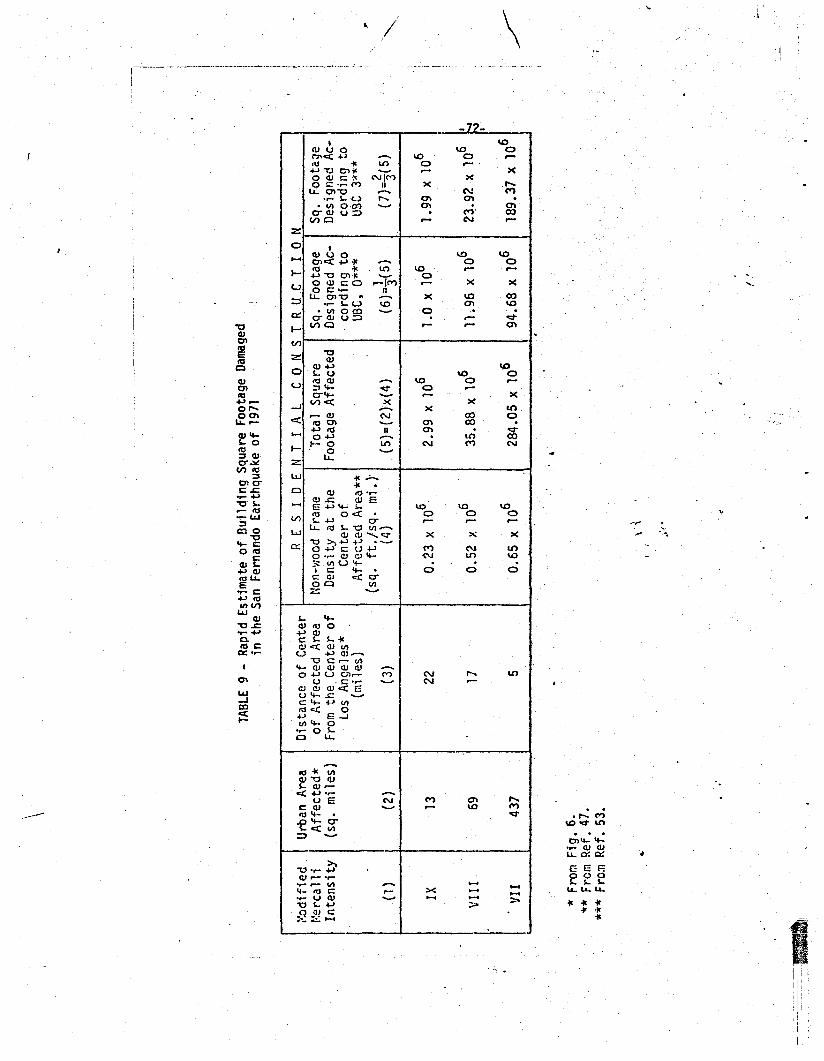
\
TABL
E9
-R
apid
Est
imat
eof
Bui
ldin
gSq
uare
Foot
age
Dam
aged
inth
eSa
nFe
rnan
doE
arth
quak
eof
1971
i'.od
ifie
dU
rban
Are
aD
ista
nce
ofC
ente
rR
[S
IDE
NT
rA
LC
ON
ST
RU
eT
ION
r·:er
ca11
iA
ffec
ted*
ofA
ffec
ted
Are
aN
on-It
:ood
Fram
eT
otal
Squa
reSq
.Fo
otag
eSq
.Foota~e
Inte
nsit
y(s
q.m
iles
)Fr
omth
e.C
ente
ro
fDe
nsit
yat
the
Foot
age
Aff
ecte
dD
esig
ned
Ac-
Des
igne
dA
c-t
Los
Ang
eles
*.
Cen
ter
ofco
rdin
gto
cord
ing
to(m
iles)
Aff
ecte
dA
rea*
*UB
C.0*
**US
C3*
**.
(sq.
ft./
sq.m
i.)'
12
(1)
(2)
(3)
(4)
(5}=
(2}x
(4)
(6)=
3(5)
(7)=
3(5
)
IX13
220.
23x
106
2.99
x10
61.
0x
106
1.99
x10
6
635
.88
x10
611
.96
x10
62~
.92
x10
6I
VII
I69
170.
52x
10I
VII
437
50.
65x
106
284.
05x
106
94.6
8x
106
189.
37x
106
.,
*Fr
ol:1
Fig.
6.-lr
*Fr
omR
ef.
47.
***
From
Ref
.53
.
.,. ".
~-
,\
~
.;(.
('
·=C:
==~I
IIJ.
I!
.-.
.''
.


\ "
TABL
E9
'-C
ontin
ued
~('<\·'·""'!;"~;~.·'·~
..V':··"'~l'._",··.-"
~."'~>'~'.'''''>'.<i';:
...~,~.,~,'''tJ:.,.}:
.•,(,~"~~...--,,,._~
_
.t \ I I ! I I
i
RE
SID
EN
TI
AL
CO
NS
TR
ue
TIO
NN
ON
-R
ES
IDE
NT
IA
LC
ON
ST
Ru
eT
ION
Sq..
Foot
age
Sq.
Foot
age
Non-
\'lOod
Fram
eT
otal
Sq.
Sq.
Foot
age
rota
lly
Dam
aged
****
Hea
vily
Dam
aged
****
Den
sity
atth
eFo
otag
eD
esig
ned
Cen
ter
ofA
ffec
ted
Acc
ordi
ngA
ffec
ted
Are
a**
ToUB
C0"
'"**
(sq.
ft./
sq.
mile
)(8
)(9
)(1
0)(1
1)=
(2)x
(lO
)1
(12)
=3(1
1).
1100
%(6
)+
28%
(7)
=1
.55
x10
6.
ox
(6)
+52
%(7
)=
1.03
x10
63.
93x
106
51.0
9x
106
17.0
3x
106
I39~(6)
+1%
(7)
•4.
90x
106
41%
(6)
+21
%(7
)•
9.79
x10
66.
20x
106
367.
72x
106
122.
57x
106
".
,
04%
(6)
+D
I(')
•3.
79x
106
.1.8
5x
106
.34
30.4
5x
106
•"~
48
'10
6I
,.•oJ
.'fX
..
6.45
x10
614
.61
x10
6I
TOTA
L,
..... W I.
,
~ "".
~.
..**
**Pe
rcen
tage
sta
ken
from
Tab
le5.
\\\
,I
.'
(
.I


\j
TABL
E9
-C
ontin
ued
NO
N-
RE
SID
EN
TI
AL
CO
NS
TR
ue
TIO
N
Sq.
Foot
age
Des
igne
dSq
.Fo
otag
eT
otal
lySq
.Fo
otag
eH
eavi
lyA
ccor
ding
toUB
C,3*
**D
amag
ed**
**D
amag
ed**
**(1
3)=~(11)
(l4)
(15
)
34.0
6x
106
100%
(12)
+28
%(1
3)'=
23.1
6x
106
o+
52%
(13)
=17
.71
x10
6
245.
12x
106
39%
(12)
+1%
(13)
=50
.25
x10
6'
41%
(12)
+21
%(1
3),=
101.
73x
106
2286
.97
x10
60
4%(1
2)+
0%(1
3)=
45.7
4x
106
,..
.TO
TAL
73.4
1x
106
,16
5.18
x10
6
****
Perc
enta
ges
take
nfro
mT
able
5.
I -....J~ I
..
'.
'/
\\\
..~(.
~i
/
.I

TABL
E9
'-C
ontin
ued
Ii
(9)
(8)
RE
SID
EN
TI
AL
CO
NS
TR
UC
TIO
NN
ON
-R
ES
IDE
NT
IA
LC
ON
ST
Ru
eT
rON
I
Sq..
Foot
age
/Sq
.Fo
otag
eN
on-w
ood
Fram
eT
otal
Sq.
Sq.
Foot
age
Tot
ally
Dam
aged
****
Hea
vily
Dam
aged
****
Den
sity
atth
eFo
otag
eD
esig
ned
Cen
ter
of
Aff
ecte
dA
ccor
ding
Aff
ecte
dA
rea*
*To
UBC
\0**
*(s
q.
ft.j
sq.
mile
)
(10)
I(1
1)=
(2)x
(10)
I(12
)=t( 1
)
1005
;;(6)
+28
%(7
}::
1.5
5x
106
.lo
x(6
)+
52%
(7}
=1.
03x
106
3.93
x10
651
.09
x10
6.
61
7.0
3\x
10
39%
(6)
+1%
(7)
=4.
90x
106
I .......
W I
\
122.
51x
106
I ITO
TAL
o
6.45
x10
6
41%
(6)
+21
%(7
)=
9.79
x10
6
4%(6
)+
0%(7
)=
3.79
x10
6
14.6
1x
106
6.20
x10
6
J.8
5x
106
367.
72x
106
3430
.45
x10
6I
•..~
~810
6I
I;:
.j."
XI
...\
\\
/
****
Perc
enta
ges
take
nfro
mT
able
5.t·
.'
!
.I

-75-
TABLE 10 - Rapid Estimate of Damaged Space VersusData-Based Estimate. Comparison of Results.
Type of Building Estimate Based Rapid' DifferenceConstruction and on Published Estimate**
Damage State Data* percentSq. feet sq. feet
Residential Space 6 6 105.86 x 10 6.45 x 10Totally Damaged
Residential Space 23.90 x 10⁶ 63914.61 x 10 .
Heavi ly Damaged
Non-Residential Space 61.19 x 10⁶ 73.4 x 10⁶ 20Totally Damaged
Non-Residential Space 119.92 x 10⁶ 165.18 x 10⁶ 38Heavily Damaged
TOTAL.. 6
259.65 x 10⁶ 18\
210.87 x 10
* After Table 8.** After Table 9.

-76-
TABLE 11 - Processable Quantities of Concrete Debris Each Year.
\ Total Quantity of Processable Quantities of Concrete Debris (million tons/year)Concrete DebrisProduced by Yea r o f P 1 ant Ope rat ionNatural Disaster
I (million tons) 1 ,2 3 4 5 6
I 0.5 0.1389 0.1111 0.0833 0.0556 0.0278 0.0034
I 1 0.2778 0.2222 0.1667 0.1111 0.0556 0.0069I
2 0.5556 0.4444 0.3333 0.2222 0.1111 0.0138I
I3 0.8333 0.6667 0.5000 0.3333 0.1667 0.0208
4 1.1111 0.8889 0.6667 0.4444 0.2222 0.02778
I 5 1.3889 1.1111 0.8333 0.5556 0.2778 0.0347
6 1.6667 1.3333 1.0000 0.6667 0.3333 0.0416
7 1.9444 1.5556 1.1662 0.7778 0.3889 0.0486
8 2.2222 1.7778 1.3222 0.8889 0.4444 0.0556
9 2.5000 2.0000 1.5000 1.0000 0.5000 0.0625
10 2.7778 2.2222 1.6667 1.1111 0.5555 0.0694

-77-
TABLE 12 - Equi pment for a Recyc1 i ng P1 ant of 120 to 300 TPHCapacity.
3
Subtotal:
1 57,000Subtotal 280,950
TOTAL 805,350
E qui p men t
1. 42 11X 16 1 hopper-feeder
2. 51 x 14 1 single-deck screen(4 11 openings)
3. 30 1l x42 11 jaw crusher (discharge 4"; maxfeed ~ 21 x2 1
; capacity: 200 TPH)
4. 42 11X 50 1 belt conveyor (spring type)
5. magnetic separator
6. 44 11 x 20 1 double-screw washer(max. feed = 411
; capacity: 400 TPH)
7. 51 x 16 1 triple-deck screen(openings: 1~ II, 3/4 11
, 3/8")
8. 5100 short-head cone crusher(discharge 111
; max. feed ~ 5~"capacity: 200 TPH)
9. 24 11 X 60 1 recirculating belt conveyor
10. 24 11 X 50 1 radial stacker
11. 500 kw power unit _
12. 611 diameter pump and piping
13. 5~" cu. yard front-end loader
14. 105 HP bulldozer
15. backhoe with hydraulic hammer
Quantity
1
1
1
1
1
1
1
1
1
1
1
1
1
EstimatedPurchase
Price1977
(indo11 ars )
100,000
35,000
91,600
20,000
11 ,500
37,300
57,000
130,000
12,000
10,000 @
524,400
13,000
3,000
93,250
54,700
AverageHorsepower
Requi rements
20
30
150
25
14
20
30
175
10
10 @
504
Fuel &Lubricati on Cos ts
($/hour)
1.60
16.70
3.08
6.3327.71
Note: Equipment 1 - 10 is centrally powered.Equipment 11 - 15 is individually powered.Equipment 1 - 12 requires setting up.

-78-TABLE 13 - Equipment for a Recycling Plant of 300 to 450 TPH
Capacity.
E qui p men tQuantity
EstimatedPurchase
Price1977
(indo11 ars )
AverageHorsepower
Requi rements
2035
1535
25 @
14 @
152020
40
225
1515 @
898
1025
150 @
20,000 @
11,500 @
9,60020,00037,300
8,00010,40091,600 @
21,000
9,60060,000
200,000
13,20016,000 @
848,300
100,00065,000
1
1
1
1
1
1
2
1
1
2
2
1
1
1
1
3Subtotal
1. 42 11 X 16' hopper-feeder2. 6' x 16' single-deck screen (4" openings
with perforated', plates)3. 24 11 x 40' belt conveyor4. 42" x 40 1 belt conveyor5. 30 11 x 42" jaw crusher (discharge 4";
max. feed ~ 2 I x2'; capacity: 200 TPH)42 11 x 501 belt conveyor (spring-type)magnetic separator36 11 x 40 1 belt conveyorsurge pile feeder44" x 20 1 double-screw washer (max. feed =4"; capacity: 400 TPH)44" x 70' single-screw washer (max. feed =411
; capaci ty: 200 TPH)36" x 40' belt conveyor6' x 16' triple-deck screen(openings: 1~1I, 3/4",3/811
)
66 S cone crusher (discharge: '1 1,;"max. feed ~ 811 -11 11 ; capacity: 320 TPH)30 11 x 60 1 recirculating belt conveyor24" x 80' radial stacker
15.16.
14.
6.7.8.
9.10.
11.
12.13.
Fuel & Lubricati on Cos ts
($/hour)17. 375 kw power unit18. 611 dia. pump & piping19. 4 ~ cu. yard front-end loader20. 105 HP bulldozer21. backhoe with hydraulic hammer
2 43,000 @
1 3,0002 93,250 @
1 54,7001 57,000
Subtotal 387,200TOTAL 1,235,500
1.6016.70 @
3.086.33
44.41
Note: Equipment 1 - 16 is centrally powered.Equipment 17 to 21 is individually powered.Equipment 1 to 18 requires setting up.

-79-TABLE 14 - Equipment fora Recycling Plant of 450 to 600
TPH Capaci ty.
Note: Equipment 1-16 is centrally powered.Equipment 17 - 23 is individually powered.Equipment 1'- 18 requires setting up.
1. 48" x 20 I hopper-feeder 12. 61 X 16 1 single-deck screen (4 11 openings 1
with perforated plates)3. 24" x 40 I bel t conveyor 14. 42" x 40' bel t conveyor 15. 30" X 42 11 jaw crusher (discharge: 411
; 2max. feed ~ 21 x2 1
; capacity: 200 TPH)6. 42 11 x 50' belt conveyor (spring-type) 27. magnetic separator 28. 42 11 X 40' belt conveyor 19. surge pile feeder 1
10. 44" X 20' double-screw washer (max. feed = 2411
, capacity: 400 TPH)11. 42 11 x 40 1 belt conveyor 112. 71 x 20 1 triple-deck screen (openings: 1
l!,~II, 3/4 11 , 3/8 11)
13. 5100 short-head cone crusher (discharge: 1111
; max. feed ~ 5~1I; capac ity: 200 TPH)14. 66S cone crusher (discharge: 1~1I; max. 1
feed ~ 811 _11 11; capacity: 320 TPH)
15. 30 11 x 100' recirculating belt conveyor 116. 24 11 x 80 1 radial stacker 3
Subtotal
54,70057,000 @
604,2001,661,200
E qui p men t
17. 375 kw power unit18. 500 kw power unit19. 611 dia. pump &piping20. 4~ cubic yard front-end loader21. 26 ton crane-dragline w/5~ cu. yard
bucket22. 105 HP bulldozer23. backhoe w/hydrau1ic hammer
Quantity
1
1
1
2
1
1
2
SubtotalTOTAL
EstimatedPurchase
Price/1977(indo11 ars )
122,00065,000
8,00010,40091,600 @
20,000 @
11,500 @
10,40020,00037,300 @
10,40090,000
130,000
200,000
22,00016,000 @
1,057,000
43,00073,0003,000
93,250 @
130,000
AverageHorsepower
Requi remen ts
3035
1025
150 @
25@14 @
252020 @
2540
175
225
2515 @
1,098Fue1 & Lub ri cation Costs
($/hour)
1.6016.70 @
4.50
3.086.33 @
55.24

-80-TABLE 15 - Equipment for a Recycling Plant of 600 to 750 TPH
CapacityQuantity
Note: Equipment 1 - 17 is centrally powered.Equipment 18 - 23 is individually powered.Equipment 1 - 19 requires setting up.
E qui p ment
1.60
16.70 @4.50
3.08 @6.33 @
58.32
2515 @
1,153Fuel & Lubrica ti on Cos ts
($/hour)73,000 @1------3,000
93,250 @130,000
54,700 @57,000 @
688,9001,978,900
Estimated AveragePurchase Horsepower
Pri ce/1977 Requirements(indo11 ars )
122,000 3070,000 35
8,000 1010,400 25
120,000 125
250,000 200
20,000 @ 25 @11 ,500 @ 14@14,000 3020,000 @ 20 @37,300 @ 20 @
14,000 3090,000 40
130,000 175
200,000 225
24,00020,000 @
1,290,000
2
2
1
2
2
1
1
1
1
1
2
1
2
1
1
1
1
1
1
1
3
Subtotal
2
2
Sul)totalTOTAL
48 11 X 20' hopper-feeder6' x 16' double-deck screen (openings: 811
and 411, with perforated plates)
24 11 x 40' belt conveyor42 11 x 40' belt conveyor22 11 x 50 11 jaw crusher (discharge: 411
;
max. feed ~ 1'xl l; cap~city: 230 TPH)
42 11 x 48 11 jaw crusher (discharge: 411;
max. feed ~ 3'x3 1; capacity: 270 TPH)
42 11 x 50' belt conveyor (spring-type)magnetic separator48 11 x 50' belt conveyorsurge pile feeder44 11 x 20 1 double-screw washer (max. feed411
; capacity: 400 TPH)48 11 x 50 I bel t conveyor]' x 20' triple-deck screen (openings:1~" , 3/4 11
, 3/8 11)
5100 short-head cone crusher (discharge:111
; max. feed ~ 5~" ; capaci ty : 200 TPH \66S cone crusher (discharge: l!t;" ; max.feed ~ 811 -11"; capacity: 320 TPH)36 11 x 100' recirculating belt conveyor24 11 x 100' radial stacker
6.
3.
4.5.
1.
2.
14.
15.
16.17.
7.8.
9.
10.11.
12.13.
18. 500 kw power unit19. 611 dia. pump & piping20. 4~ cu. yd. front-end loader
21. 26 ton crane-dragline with 5~ cu. yd.bucket
22. 105 HP bulldozer23. hackhoe w/hydraulic hammer

TABL
E16
-C
oncr
ete
Rec
yclin
gP
lant
s.C
urre
ntP
ract
ice
(52)
P1
an
tO
wn
er
an
dL
0cat
ion
Sham
rock
Proc
esse
dB
ase
Co.
Guy
F.A
tkin
son
Co.
:B
lue
Diam
ond
Div
.of
Sul
lyM
ille
rLo
sA
nqel
es.
CAPa
coim
a.CA
Lona
Bea
ch.
CAY
ears
Ope
rate
d19
71Si
nce
1963
Mat
eria
1sC
oncr
ete
and
asph
alt
from
Con
cret
ean
das
phal
tfro
mC
oncr
ete
&as
phal
tfro
mst
reet
s,cu
rbs,
Rec
ycle
dpa
vem
ents
,fo
unda
tion
s,.
stre
ets
&si
dew
alks
&g
utt
ers,
side
wal
kscu
rbs
&gu
tter
s,si
dew
alks
etc.
App
lica
tion
sfo
rB
ase
for
road
way
s(9
9%)
Bas
efo
rro
adw
ays
Bas
efo
rro
adw
ays
the
Rec
ycle
dCe
men
tsl
urry
back
fall
(1%
)M
ater
ials
Des
crip
tion
Fron
ten
dlo
ader
~C
edar
Ra-
Fron
ten
dlo
ader
~K
ohlm
anFr
ont
end
load
er~
Ced
arR
apid
s25
40ja
wof
the
pids
401
apro
nfe
eder
~Ce
-b
elt
conv
eyor
~T
elsm
ithpo
rtab
lepl
ant,
incl
.fe
eder
~C
edar
Ra-
Plan
t(s)
dar
Rap
ids
2540
jaw
~Sy
mon
s30
42ja
w~
Tel
smith
cone
pids
port
.sc
reen
ing
unit
~4'
Tel
smith
4x16
scre
en~
Sym
ons4~'
cone
Prod
uced
min
us3/
4"ag
gr.
cone
-P
orta
ble,
prod
uces
min
us111
Por
tabl
eto
minu
sl~"
Fron
ten
dlo
ader
~C
edar
Ra-
Fron
ten
dlo
ader
~C
edar
Rap
ids
3242
jaw
pids
141
apro
nfe
eder
~Ce
-po
rt.
plan
t+
4~'
Sym
ons
cone
dar
Rap
ids
2236
jaw
+Sy
mon
sPo
rtab
1e,
prod
uces
minu
sl~"
4x16
scre
en+
Sym
ons
4'co
nePort~h1e
Prod
uctio
nR
ate
225
to25
0TP
H30
0TP
HP
lant
Adv
anta
geR
educ
edtr
ucki
ngco
sts
Red
uced
truc
king
cost
sPr
oble
ms
-- Rea
sons
for
Whe
n-th
eir
equi
pmen
tbe
cam
eD
isco
ntin
uati
onti
edup
with
othe
rpr
ojec
tsof
Ope
ratio
nsno
tin
volv
ing
rubb
le,
they
deci
ded
itw
asch
eape
rto
sub-
cont
ract
rubb
lecr
ushi
ngth
anto
uti l
ize
thei
row
neq
uipm
ent.
-_.
I co --'
I

TABL
E16
-C
ontin
ued
I IP
1an
tO
wn
er
an
dL
0cat
ion
- Mot
orG
rade
rR
enta
lsKe
nH.
Jone
s&
Co.
R&
0P
orta
ble
Cru
shin
gB
ell
Gar
dens
,CA
Tor
ranc
e,CA
Arc
adia
,CA
.---
-
Yea
rsO
pera
ted
Sinc
e19
70Si
nce
1970
Sinc
e19
73M
ater
ials
Con
cret
ean
das
phal
tfro
mC
oncr
ete
and
asph
alt
from
Con
cret
ean
das
phal
tfro
mro
ads,
Rec
ycle
dpa
vem
ents
,cu
rbs
and
gut-
pave
men
ts,
curb
san
dgu
t-cu
rbs
and
gutt
ers,
side
wal
ks,
con-
ters
,bu
ildi
ngfo
unda
tion
s,Ite
rs,
buil
ding
foun
dati
ons,
cret
ebu
ildi
ngs,
brid
ges.
etc.
etc.
App
licat
ions
for
Bas
efo
rro
adw
ays,
pipe
!Sub
base
for
road
way
sB
ase
for
road
way
s,sa
nita
ryla
nd
fill
the
Recy
c1ed
bedd
ing
Im
ater
ial
Mat
eria
ls-_."~
-.
Des
crip
tion
ofFr
ont
end
load
er+
Agg
rega
teFr
ont
end
load
er+
Lipp
man
Fron
ten
dlo
ader
+N
ordb
erg
3042
jaw
+of
the
Syst
ems
Inc.
feed
er+
3042
3036
jaw
+Sy
mon
sro
dde
ckN
ordb
erg
5x16
f1at
scre
en+
Sym
ons
4~'
Pla
nt(s
)U
nive
rsal
port
able
jaw
+He
w-sc
reen
+Pi
onee
r5x
14vi
bra-
cone
-P
orta
ble,
prod
uces
min
us111
toit
tR
obin
s2
deck
5x16
port
-ti
ngsc
reen
+Sy
mon
s4'
std
.m
inus
l~"
able
scre
en+
4'S
td.
Sym
ons
cone
+Sy
mon
s4~'
SHco
neco
ne-
Por
tabl
e,2
chas
ses,
Skid
mou
nted
,pr
oduc
espr
oduc
es3/
411
to1/
211
sand
,3/
811
&3/
411
Prod
uctio
nR
ate
275
TPH
150
TPH
275-
375
TPH
Pla
ntA
dvan
tage
Red
uced
truc
king
cost
s,re
-R
educ
edtr
ucki
ngco
sts
Red
uced
truc
king
cost
s,re
duce
d-du
mpi
ngdu
ced
man
gane
seco
sts
inth
eco
sts
cone
crus
her
..-
Prob
lem
s-
._---_
.-._..
.••.
...
Rea
sons
for
Dis
cont
inua
tion
ofO
pera
tions
I i, I
-.
I co N I

TABL
E16
-C
ontin
ued
I ex> w I
IH
igh
mai
nten
ance
cost
son
crus
hing
plan
t,no
ise
poll
uti
onfro
mcr
ushi
ngpl
ant,
find
ing
sour
ces
ofru
bble
,re
mov
alof
rein
forc
ing
stee
l
Prob
lem
s
P1
an
tO
wn
er
an
dL
0cat
ion
Str
ecke
rC
onst
ruct
ion
Co.
City
ofM
inne
apol
is:
Texa
sH
ighw
ayD
epar
tmen
tSa
nta
FeS
prin
gs,
CA(r
ente
rs)
ID
istr
ict
17M
inne
apol
is,
MNi
---Y
ears
Ope
rate
dap
prox
.19
72-1
975
Sum
mer
of19
72on
lyI1
969
Mat
eria
lsC
oncr
ete
and
asph
alt
Con
cret
e(s
idew
alks
,et
c.)
!C
oncr
ete
and
asph
alt
from
pave
men
tR
ecyc
led
asph
alt,
clay
,d
irt
I i--
App
licat
ions
for
Subb
ase
for
road
way
sSu
bbas
efo
rro
adw
ays,
exca
-A
spha
ltst
abil
ized
base
cour
se,
the
Rec
ycle
dva
tion
bac
kfi
ll,
gril
lage
Type
Bas
phal
tsu
rfac
eco
urse
Mat
eria
lsun
der
sew
ers,
etc.
,st
abil
-I
izin
gm
ater
ial
Des
crip
tion
Whe
ello
ader
+T
elsm
ithLo
ader
+U
nive
rsal
3042
pri
-IPr
imar
ycr
ushe
r+
conv
eyor
+of
the
Type
Hvi
brat
ing
feed
er+
mar
yja
w+
hopp
er+
Tel
smith
seco
ndar
ycr
ushe
rP
lant
(s)
30x4
2A
ustin
-Wes
tern
pri-
cone
+Te
1sm
ithvi
brat
ing
im
ary
jaw
+4x
lOSy
mon
s2
deck
scre
en~
stac
ker
Isc
reen
+48
9-S
Tel
smith
4'co
ne-_.,---~
I
Prod
uctio
nR
ate
350
TPH
200
TPH
I
_.. Pla
ntA
dvan
tage
Savi
ngo
fsc
arce
lan
dfi
llIH
igh
com
pact
ion
char
acte
ris-
Econ
omic
sar
eas,
low
erco
stof
resu
1-ti
csof
the
prod
uct,
low
erti
ngro
adw
ays,
prol
onge
di
truc
kco
sts,
low
erov
eral
l1
grav
elp
it1i
fe,
redu
ced
de-
Icos
ts1
man
dfo
rtr
ucks
I'
"
Rea
sons
for
Dis
cont
inua
tion
ofO
pera
tions
Pla
ntw
asso
ldw
hen
the
free
w
ayfu
nds
wer
eha
lted
.

TABL
E16
-C
ontin
ued
I co .;:. I
P1
an
tO
wn
er
an
dL
0cat
ion
Car
lB
olan
der
and
Sons
Doe
tsch
Bro
ther
sCo
.29
33P
leas
ant
Ave
.So
uth
35E.
Pal
atin
eRo
adA
nge1
0's
Cru
shed
Con
cret
eM
inne
apol
is,
Min
neso
taW
hee1
tng,
Illi
no
isD
etro
it,
Mic
higa
n....
Yea
rsO
pera
ted
At
leas
tdu
ring
1975
Off
&on
for
seve
ral
year
s,Si
nce
1965
toha
vest
arte
dup
agai
nsp
ring
1976
.,..
....
...<
-......-
....'~.~._-
Mat
eria
lsC
oncr
ete
and
bric
ksC
oncr
ete
Con
cret
ean
das
phal
tfro
mro
adw
ays
Rec
ycle
dan
dsi
dew
alks
_....__.
....-~
..._~.
App
licat
ions
for
Subb
ase
for
raod
way
sSu
bbas
efo
rro
adw
ays,
park
-B
ase
for
road
way
sth
eR
ecyc
led
ing
lots
,ha
ulro
ads,
and
Mat
eria
lsfo
r1a
ndfi
11D
escr
ipti
onFr
ont
end
load
er~
feed
erP
orta
ble
Ced
arR
apid
s22
xTh
eyha
vese
ven
plan
ts.
ofth
e~
3240
Hew
ittR
obin
sJa
w36
jaw
plan
tFr
ont
end
load
er~
jaw
~sc
reen
sP1
ant(
s)Sy
mon
s51
00S
td.
cone
~(p
orta
ble)
6x16
3de
ckN
ordb
erg
scre
enI
~R
exno
rdpo
rtab
leco
nvey
ors
-Pr
oduc
tion
Rat
eP
lant
Adv
anta
geR
educ
eddu
mpi
ngfe
esby
2/3
Det
roit
has
near
lyex
haus
ted
its
byof
feri
ngcr
ushe
dvs
un-
dum
ping
site
sfo
rru
bble
;re
duce
dcr
ushe
dco
ncre
te;
very
com
-tr
ucki
ngco
sts
pet
itiv
ew
ithcr
ushe
dst
one
Ifro
mqu
arri
es.
--_.'-
~"
-.'--~-'~"-
Prob
1em
s
+I
Rea
sons
for
Dis
cont
inua
tion
I Iof
Ope
ratio
nsI i

TABL
E16
-C
ontin
ued
P1
an
tO
wn
er
an
dL
ocati
on
Troy
Agg
rega
teH
aule
rsIn
c.M
ichi
gan
Cru
shed
Con
cret
eC
lanc
yC
rush
edC
oncr
ete
Tro
y,M
ichi
gan
Rut
ford
,M
ichi
gan
Ros
evil
le,
Mic
higa
n
Yea
rsO
pera
ted
Sinc
e19
73Si
nce
1964
Sinc
e19
67M
ater
ials
Con
cret
ean
das
phal
tfro
mC
oncr
ete
and
asph
alt
pave
-C
oncr
ete
and
asph
alt
from
side
-R
ecyc
led
road
way
s,si
dew
alks
,et
c.m
ents
,si
dew
alks
,cu
rbs
wal
ksan
dpa
vem
ents
and
gutt
ers
App
licat
ions
for
Bas
em
ater
ial
for
asph
alt
Bas
em
ater
ial
Bas
em
ater
ial
for
road
way
sth
eR
ecyc
led
park
ing
lots
Mat
eria
lsD
escr
iptio
nFr
ont
end
load
er+
Iow
aFr
ont
end
load
er+
feed
er25
38A
ustin
Wes
tern
jaw
(sta
tion
-of
the
jaw
(por
tabl
e)+
2248
Hew
ittR
obin
sja
war
y)P
lant
(s)
Fron
ten
dlo
ader
+U
ni-
+co
nvey
or+
mag
net
+sc
re-
vers
alja
w(s
tati
onar
y)en
s+
roll
crus
her
Prod
uctio
nR
ate
190
TPH
38TP
HP
lant
Adv
anta
geD
etro
itha
sne
arly
exha
ust-
Red
uced
truc
king
cost
sC
rush
edst
one
issc
arce
inM
ichi
gan
edit
sdu
mpi
ngsi
tes
for
redu
ced
truc
king
cost
sru
bble
u_
Prob
lem
s--
--..
'...-.
...._
-_._..
.~.
__.__
..-.
-----...
.---..
~"._-
.._..
.._..
-.._.
....
....
.._--
_...__
...._...
..-....-_.
.'-..-
1--
----
---_
.R
easo
nsfo
rD
isco
ntin
uatio
nof
Ope
rati
ons
j
I 00
<.TI I

TABL
E16
-C
ontin
ued
1 1 I
P1
an
tO
wn
er
an
dL
0cat
ion
i I IFlo
yds
Cru
shed
Con
cret
eS
ilve
rH
ill
Sand
and
Gra
vel
Exc
avat
ion
Con
stru
ctio
nD
etro
it,
Mic
higa
nS
ilve
rH
ill,
Mar
ylan
dW
ashi
ngto
n,D
.C.
=.:-
Yea
rsO
pera
ted
Sinc
e19
62Si
nce
1968
Sinc
e19
72_.
----
-M
ater
ials
Con
cret
ean
das
phal
tfro
mL
efto
ver
conc
rete
from
mix
-C
oncr
ete
from
side
wal
ks,
curb
s&
Rec
ycle
dst
reet
s,si
dew
alks
,et
c.er
s;cu
rbs
and
gutt
ers
gu
tter
s,st
reet
s;th
eyw
ill
not
acce
ptre
info
rcin
gro
dsA
pplic
atio
nsfo
rB
ase
for
asph
alt
road
sSu
bbas
e;se
wer
cont
ract
ors
Subb
ase
the
Rec
ycle
dfo
rha
ulro
ads
Mat
eria
ls'-
-'-
Des
crip
tion
Fron
ten
dlo
ader
+30
42Fr
ont
end
load
er+
2438
Fron
ten
dlo
ader
+ja
w+
conv
eyor
+of
the
Pion
eer
prim
ary
jaw
+do
u-Io
wa
jaw
scre
ens
(por
tabl
e)P1
ant(
s)b1
ede
cksc
reen
+12
48H
ewitt
Rob
bins
jaw
(sta
-ti
onar
y)Pr
oduc
tion
Rat
e75
-10
0TP
H10
0TP
H-~---
Pla
ntA
dvan
tage
IRed
uced
truc
king
cost
s;M
akes
exce
llen
tsu
bbas
em
ater
ial
&is
lman
yar
eadu
mps
refu
seor
appr
oved
byD
istr
ict
ofC
olum
bia;
icha
rge
high
dum
ping
fees
low
erpr
iced
mat
eria
lth
anst
one;
\for
uncr
ushe
dru
bble
con-
redu
ced
truc
king
cost
scr
ete;
shor
tage
ofag
gre-
gate
inD
etro
itar
ea.
Prob
1em
sR
easo
nsfo
r._
----
1--
----
----
----
----
Dis
cont
inua
tion
ofO
pera
tion
s..
I (X)
m I

TABL
E16
-C
ontin
ued
P1
an
tO
wn
er
an
dL
ocati
on
IIo
wa
Sta
teH
ighw
ayD
epar
tmen
tR
.B.
But
ler,
Inc.
/Jar
bet
Co.
1A
mes
,Io
wa
Texa
sHw
y.O
pt.,
Bur
leso
nC
ty.,
TX
Year
sOp
erat
edS
tart
-up
expe
cted
inS
prin
g,19
67-1
969
1976
-M
ater
ials
Con
cret
ean
das
phal
tfro
mro
adw
ays
Con
cret
epa
vem
ent
Rec
ycle
dA
pplic
atio
nsfo
rC
oncr
ete
and
asph
alt
com
bina
tion
Subb
ase
for
road
way
sth
eRe
cyc1
edfo
r1
stla
yer
ofco
ncre
tepa
vem
ent;
Mat
eria
lspu
reco
ncre
tefo
rto
pla
yer
ofco
ncre
tepa
vem
ent
--D
escr
iptio
nP
orta
ble
Iow
aCo
mm
ande
rpl
ant,
in-
Prim
ary
crus
her
+b
elt
conv
eyor
ofth
ec1
udin
ga
jaw
prim
ary
and
aro
llI+
seco
ndar
ycr
ushe
rP1
ant{
s)se
cond
ary.
Prod
uctio
nR
ate
Pla
ntA
dvan
tage
Elim
inat
edi
spos
alpr
oble
mfo
rru
bble
conc
rete
pave
men
tO
vera
llco
sts
nom
ore
than
thro
ugh
use
ofco
nven
tiona
lco
ncep
ts~--'-"
Prob
1em
sRe
mov
alof
rein
forc
ing
stee
lfro
mco
ncre
te;
.-
Ivar
iabl
eam
ount
ofas
phal
tin
the
fini
shed
rubb
le;
.-1e
quip
men
tw
ear
was
abov
eno
rmal
-_.
"~--'-'-"----'-
..--..-
-_._-
•._--
-'-'--~--''"-----''-----'-'--~-"-~'-----
_._-
----_
.----
",-..
.R
easo
nsfo
r1
Dis
cont
inua
tion
Iof
Ope
ratio
ns!
I co "'-J I

-88-
TABLE 17 - Existing Methods of Concrete Cutting (30)
Method of Relevant Limi tationsConcrete Cutting Property of
Concrete
Hammer Poor tensile and Slow~ noisy ~ dustimpact strength
--.
Rotary percussive drill Poor tensile and Only for holes~
impact strength noisy~ dust
Explosive Poor tensile and Lack of precision~
impact strength dust.0__________._____
Hydraulic bursters in Poor tensile Slow. Problems wi thpredrilled holes strength rei nforcement
Thermic lance and flame melting point Expensive~ fumes andjet l200-2000°C fire hazard
Plasma arc Melting point Expensive~ fumes and1200-2000°C fire hazard
Diamond saw Brittleness Expensive~ difficult onthick sections and whereflat survaces are notavailable
- ..• _._._ ....•__.---

TABL
E18
-Pr
oduc
tion
Cos
tE
stim
ate
for
the
Rec
yclin
gP
lant
I
I;
Pla
ntPu
rcha
seco
stSe
t-up
Cos
tTo
ta1
Init
ia1
Dep
reci
atio
nC
ost
Wri
te-o
ffof
Set-
upM
aint
enan
ceC
apac
ityI
ofEq
uipm
ent
(15%
ofPu
rcha
sing
Inve
stm
ent
ofPu
rcha
sed
Cos
tfo
ra
Pla
nt&
Rep
air
TPH
(aft
erT
able
sC
ost
ofEq
uipm
ent
(2}+
(3)
Equi
pmen
tT
hat
Will
Ope
rate
Cos
t(9
0%of
12to
15)
Tha
tR
equi
res
$(c
ol2/
15,0
00hr
s)fo
r4
Yea
rsat
1000
col
5}$
Set
ting
U pl}
$/hr
hrs/
year
(col
3ov
er$/
hr4
year
sov
er10
00hr
s)I
$I
(l)
(2)
(3)
(4)
(5)
(6)
!(7
)
120-
300
805,
350
90,0
6089
5,41
053
.69
22.5
1548
.32
300-
450
1,23
5,50
014
0,59
51,
376,
095
82.3
735
.149
74.1
3
450-
600
1,66
1,20
017
6,95
01
,837
,150
110.
7544
.237
99.6
7
600-
750
1,97
8,90
021
5,85
0I
2,19
4,75
0.1
31.9
353
.962
118.
74i
I
lWith
the
exce
ptio
no
fcr
anes
,bu
lldo
zers
,lo
ader
san
dba
ckho
es,
all
plan
teq
uipm
ent
requ
ires
sett
ing
up.
I 00
1.0 I

TABL
E18
-C
onti
nued
,\O
verh
ead
for
i
Lab
orC
ost
Tot
alFu
elO
verh
ead
Inte
rest
(9%
)P
rodu
ctio
nC
ost
Pro
duct
ion
Cos
tfo
rI
(der
ived
&L
ubri
ca-
(1/2
%o
fI
aP
lan
t&
Insu
ranc
e(1
%)
for
aP1
ant
Tha
ta
Pla
nt
that
Wil
lfr
omItin
nC
ost
col
4)I
Ope
rati
ngfo
ra
pla
nt
Wil
lO
pera
teo
ver
Ope
rate
ov
er4
yea
rsT
able
20)
$/h
r$
/yr
i10
00h
rsO
pera
ting
1000
4y
ears
at
at
1000
hrs
/yr
at
$/h
rI
per
yea
rhr
sp
ery
ear
1000
hrs
/yr
Ave
rage
Cap
acit
yI
I$
/yr
$/h
r(5
)+(6
)+(7
)+(8
)+(c
ol13
ov
erav
o.
(9)+
(11
)+(1
2)ho
urly
capa
city
)I
I
I!
$/t
on
(8)
I(9
)(1
0)i
(11)
I(1
2)(1
3)(1
4)
~ i74
.41
45.8
544
77.0
5!
4.4
854
.61
303.
881
.45
I I t10
8.75
80.3
368
80.4
86.
8884
.31
471.
921
.26
I12
3.53
I96
.96
9185
.75
9.1
811
2.35
596.
681.
14
151
.28
104.
4410
973.
75!
10.9
713
4.22
I70
5.54
1.0
5I
I--
I \.0 o I
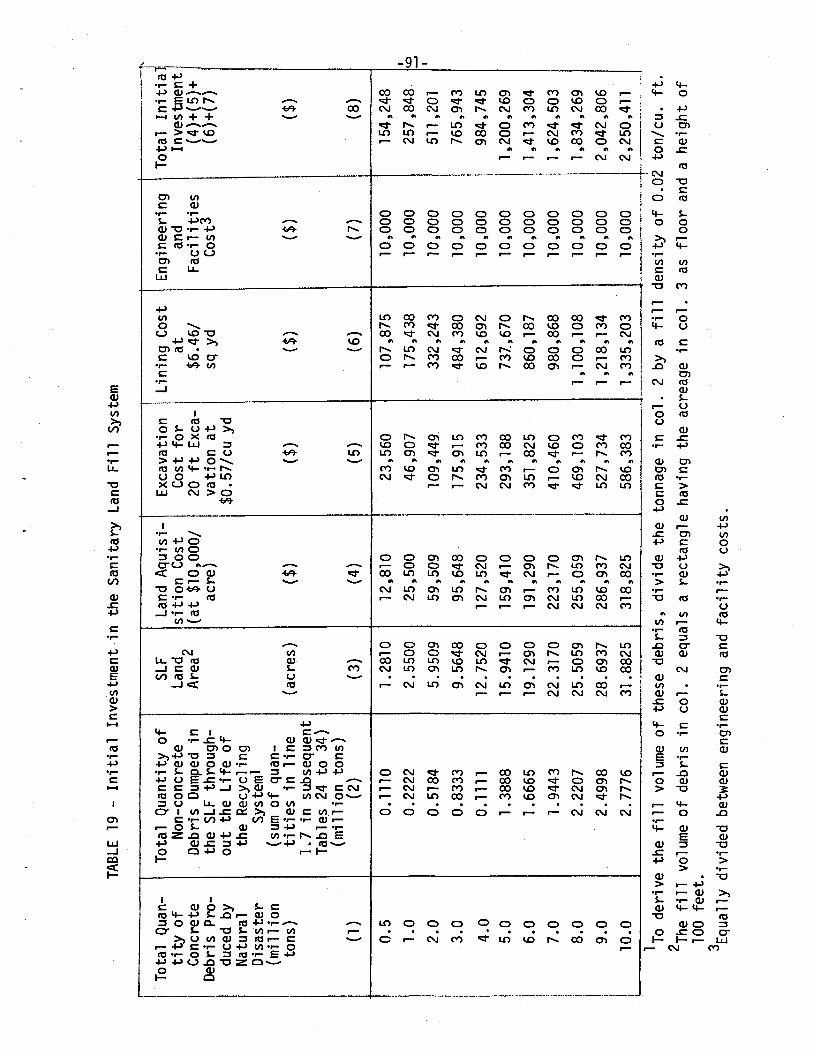
TABL
E19
-In
itia
lIn
vest
men
tin
the
San
itar
yLa
ndF
ill
Syst
em
I l.O --'
I
~de
nsit
yo
f0.
02to
n/cu
.ft
.3
asfl
oo
ran
da
heig
htof
1 To
deri
veth
efi
llvo
lum
eof
thes
ede
bris
,di
vide
the
tonn
age
inco
l.2
bya
fill
2The
fill
volu
me
of
debr
isin
col.
2eq
uals
are
ctan
gle
havi
ngth
eac
reag
ein
col.
100
feet
.3E
qua1
1ydi
vide
dbe
twee
nen
gine
erin
gan
dfa
cili
tyco
sts.
II
'----1
iT
otal
Qua
n-T
otal
Qua
ntit
yo
fSL
FLa
ndA
quis
i-E
xcav
atio
n\
Lin
ing
Cos
tE
ngin
eeri
ngT
otal
Init
iai
tity
of
Non
-con
cret
eLa
nd2
siti
on
Cos
tC
ost
for
Iat
and
Inve
stm
ent·
Con
cret
eD
ebri
sDu
mpe
din
Are
a(a
t$1
0,00
0/20
ftEx
ca-
$6.4
6/F
acil
itie
s(4
)+(5
)+D
ebri
sPr
o-th
eSL
Fth
roug
h-ac
re)
vati
onat
sqyd
Cos
t3(6
)+{7
)du
ced
byou
tth
eL
ife
of
$0.5
7/cu
ydN
atur
alth
eR
ecyc
ling
Dis
aste
rSy
stem
1(m
i11
ion
(sum
of
quan
-to
ns)
titi
esin
1ine
(acr
es)
($)
($)
($)
($)
($)
1.7
insu
bseq
uent
Tab1
es24
to34
)(m
illi
onto
ns)
(1)
(2)
(3)
(4)
(5)
(6)
(7)
(8)
0.5
0.11
101.
281
012
,810
23,5
6010
7,87
510
,000
154,
248
1.0
0.22
222.
5500
25,5
0046
,907
175,
438
10,0
0025
7,84
8,
I2.
00.
5184
5.95
0959
,509
109,
449
332,
243
10,0
0051
1,2
01I I
3.0
0.83
339.
5648
95,6
4817
5,91
548
4,38
010
,000
765,
943
I I4.
00.
1111
12.7
520
127,
520
123
4,53
361
2,69
210
,000
i5.
01.
3888
15.9
410
159,
410
I29
3,18
873
7,67
010
,000
II
I6.
01.
6665
19.1
290
191,
290
I35
1,82
586
0,18
710
,000
I
II
7.0
1.94
4322
.317
022
3,17
041
0,46
098
0,86
810
,000
I I i8.
02.
2207
25.5
059
255,
059
469,
103
1,1
00,1
0810
,000
I9.
02.
4998
28.6
937
286,
937
527,
734
1,2
18,1
3410
,000
I10
.02.
7776
31.8
825
318,
825
586,
383
1,33
5,20
310
,000

-92-
TABLE 20 - Manpower Requirements and Cost for Recycling Plant
Description Hourly Manpower Requirement, in Numbers of Menof Worker Wage in P 1 ant CapacityDoll ars
per 120-300 TPH 300-450 TPH 450-600 TPH 600-750 TPHMan-Hour
orer 11.01 2 4 4 4I
der Operator 12.32 1 1 1 1 1I
ne Operator 14.78 1I
1- -1dozer Operator 14.25 1 1 1 2
khoe Operator 12.32 1 2 2 2
sher Operator 13.50 1 1 1 2
Lab
Loa
Cra
Bul
Bac
Cru

.~ / \
----.
TABLE 21 - Hourly Overhead Cost
Plant Production Production Quantity of P~ocessedOebris (million tons/yearCapacity Rate Character-
I(TPH) (TPH) istics 0.2 0.4 0.6 0.8 1.0 1.2
Hours of Opr. 267 m 801 1,067 . 1,3351,
6021750 (hr/yr)
Overhead Cost 41.10 20.~ 13.70 10.28 8.22 6.85($/hr)
600-750Hours of Opr. 296 593 889 1,185 1,481 1,778
675 (hr/yr)Overhead Cost 37.07 l8.5/! 12.34 9.26 7.41 6.17
($/hr)_.Hours of Opr. 333 661 1,000 1,333 1,667 2,000
600 (hr/yr)Overhead Cost 27.58 13.771 9.19 6.89 5.51 4:59·
($/hr)450-600 Hours of Opr. 381 7~ 1,143 1,524 1,905
525 (hr/yr)Overhead Cost 24.11 12.05 8.04 6.03 4.82
($/hr) I
Hours of Opr. I 444 8~ 1,333 1,778450 (hr/yr) I
Overhead Cost 15.50 7.7~ 5.16 3.87($/hr) i
300-450 Hours of Opr. 533 1,061 I 1,600375 (hr/yr) I
Overhead Cost 12.91 6.4$ 4.30($/hr)
Hours of Opr. 667 1,33] 2,000300 (hr/yr)
Overhead Cost 6.71 3•.Ji 2.24($/hr)
Hours of Opr. 888 1,7f1l,120-300 225 (hr/yr)
Overhead Cos t 5.04 2.2($/hr)
Hours of Opr. 1,666120 (hr/yr)
Overhead Cost 2.69($/hr)
-
,


TABL
E22
-H
ourly
Inte
rest
and
Insu
ranc
eC
ost
j 1P
lant
Prod
ucti
onPr
oduc
tion
Qua
ntit
yof
Proc
esse
dD
ebri
s(m
illi
onto
ns/y
ear)
ca~acity
Rat
f)C
hara
cter
-TP
H)(T
PHis
tics
0.2
0.4
0.6
0.8
1.0
1.2
1.4
Hou
rsof
Opr
.26
753
380
11,
067
1,33
51
,602
1,86
9(h
rs/y
r)75
0Mu
1t.
Fac
tor
0.22
470.
1124
0.07
500.
0562
0.04
500.
0375
0.03
21In
t.&
Insu
r.49
3.16
246.
6916
4.61
123.
3498
.76
82.3
70.4
560
0-75
0($
/hr)
Hou
rso
fO
pr.
296
593
889
1,18
51,
481
1,77
8(h
rs/y
r)I
675
Mul
t.F
acto
r0.
2027
0.10
140.
0675
0.05
060.
0405
0.03
37I
Int.
&In
sur.
444.
8822
2.55
148.
1511
1.05
88.8
973
.96
($/h
r)
Hou
rsof
Opr
.33
366
71
,000
1,33
31,
667
2,00
0(h
rs/y
r)60
0M
ult.
Fac
tor
0.18
020.
0901
0.06
000.
0450
0.03
600.
0300
Int.
&In
sur.
331.
0516
5.53
110.
2382
.67
66.1
455
.11
($/h
r)45
0-60
0H
ours
of
Opr
.38
176
21,
143
1,52
41,
905
(hrs
/yr)
i52
5M
ult.
Fac
tor
O.15
750.
0787
0.05
250.
0394
0.03
15In
t.&
Insu
r.28
9.35
144.
8696
.45
72.3
857
.87
Hou
rso
fO
pr.
444
889
1,33
31,
778
;(h
rs/y
r)I J
450
Mul
t.F
acto
r0.
1351
0.06
760.
0450
0.03
37I I
Int.
&In
sur.
189.
8494
.99
63.2
347
.35
, I($
/hr)
f30
0-45
0H
ours
of
Opr
.53
31,
067
1,60
0I
(hrs
/yr)
I I37
5M
ult.
Fac
tor
0.11
260.
0563
0.03
75i
Int.
&In
sur.
158.
2279
.11
52.6
9!
($/h
r)!
I 1.0~ I

TABLE 21 - Hourly Overhead Cost
-93-
Plant Production Production Quantity of Processed Debri s (million tons/year)Capacity ,/Rcite C~aracter-
I I(TPH) /' (TPH) \istics 0.2 0.4 0.6 0.8 1.0 1.2 1.4
Hours of Opr. 267 533 801 1,067 1,335 1,602 1 ,,:;~.'
750 (hr/yr)Overhead Cost 41.10 20.59 13.70 10.28 8.22 6.85 5.~,
($/hr) -- ---- -600-750Hours of Opr. 296 593 889 1,185 1,481 1,778
675 (hr/yr)Overhead Cos t 37.07 18.51 12.34 9.26 7.41 6.17
($/hr)_..~.-
Hours of Opr. 333 667 1,000 1,333 1,667 2,000600 (hr/yr)
Overhead Cos t 27.58 13.77 9.19 6.89 5.51 4.59($/hr)
450-600 Hours of Opr. 381 762 .' 1,143 1,524 1,905525 (hr/yr)
Overhead Cost I 24.11 12.05 8.04 6.03 4.82($/hr)
I444 889 1,333 1,778Hours of Opr. I
450 (hr/yr)Overhead Cost 15.50 7.74 5.16 3.87
($/hr) , i1-.
300-450 Hours of Opr. 533 1,067 I 1,600375 (hr/yr) I
Overhead Cost 12.91 6.45 4.30($/hr)
Hours of Opr. 667 1,333 2,000300 (hr/yr)
Overhead Cost 6;.71 3.36 2.24($/hr)
\----Hours of Opr. 8a8 1,778
120-300 225 (hr/yr), Overhead Cost 5.04 2.52
($/hr)
Hours of Opr. 1,666120 (hr/yr)
Ove rhead Cos t 2.69($/hr)
---.

TABL
E22
-C
onti
nued
IH
ours
of
Opr
.66
71,
333
2,00
0(h
rs/y
r)30
0M
ult.
Fac
tor
0.09
000.
0450
0.03
00In
t.&
Insu
r.80
.59
40.2
926
.86
($/h
r)
Hou
rso
fO
pr.
888
1,77
8(h
rs/y
r)12
0-30
022
5M
ult.
,Fac
tor
0.06
300.
0320
Int.
&In
sur.
56.4
128
.65
($/h
r)
Hou
rso
fO
pr.
1,66
6(h
rs/y
r)12
0M
ult.
Fac
tor
0.03
60In
t.&
Insu
r.32
.23
($/h
r)I 1.
0(1
lI

\
TABL
E23
-H
ourly
Prod
uctio
nC
ost
-(W
rite
-off
Cos
t+
Dep
reci
atio
nC
ost)
I
Qua
ntit
yof
Proc
esse
dD
ebri:
s'(m
ill1
~nto
~s/y
ear)
Pla
ntIP
rodu
ctio
nPr
oduc
tion
Cap
.aci
tyR
ate
Cha
ract
er-
(TPH
)(T
PH)
isti
cs0.
20.
40.
60.
81.
01.
21.
4
Hou
rso
fO
pr.
267
533
801
1~067
1~335
1~602
1,86
975
0(h
r/yr
)C
ost
($/h
r)90
7.41
640.
4355
1.46
506.
7748
0.13
462.
3044
9.47
600.
.750
Hou
rso
fO
pr.
296
593
889
1,1
851~481
1,77
865
7(h
r/yr
)I I
Cos
t($
/hr)
855.
1061
4.21
I53
3.64
493.
4646
9.45
453.
28
Hou
rsof
Opr
.33
366
71,
000
1~333
1~667
2,00
0
I60
0(h
r/yr
)C
ost
($/h
r)67
8.79
499.
4643
9.58
409.
7239
1.81
379.
8645
0-60
0I
Hou
rso
fO
pr.
381
762
1,14
31,
524
1,90
5I I
525
(hr/
yr)
IC
ost
($/h
r)63
3.62
477
.07
424.
6539
8.57
382.
85
Hou
rsof
Opr
.44
488
91,
333
1,77
845
0(h
r/yr
)C
ost
($/h
r)47
0.59
367.
9833
3.64
316.
4730
0-45
0H
ours
of
Opr
.53
31,
067
1,60
0--
375
(hr/
yr)
Cos
t($
/hr)
436.
3835
0.81
322.
24~--"""'-
_.•..,_
..-._._-
---.---
_.-H
ours
ofO
pr.
667
1,33
32,
000
300
(hr/
yr)
Cos
t($
/hr)
256.
0821
2.43
197.
88..
Hou
rso
fO
pr.
888
1,77
812
0-30
022
5(h
r/yr
)C
ost
($/h
r)23
0.23
199.
95H
ours
of
Opr
.1
,666
120
(hr/
yr)
Cos
t($
/hr)
203.
70
.,..>t"...,.~r_:,';;_:~;.:..;,;.·~"<J:;...'e~~·'~~.i.'";...:t',~~.
I.
I;,
I \D 0'> I

TABL
E24
-Ec
onom
ics
-N
etP
rese
ntV
alue
Ana
lysi
sof
Deb
risR
ecyc
ling.
Tot
alQ
uant
ityof
Con
cret
eD
ebris
Prod
uced
:0.
5m
illi
onto
ns.
Tim
e,in
year
s,af
ter
the
star
to
fpl
ant
oper
atio
ns.
12
34
56
PART
I.D
ebris
Inflo
w-O
utflo
w
1.1
Proc
essa
ble
quan
titi
eso
fco
n-0.
1389
0.11
110.
0833
0.05
550.
0277
0.00
34cr
ete
debr
isea
chye
ar(a
fter
Tab
le11
)(m
illi
onto
ns)
I1.
2T
otal
amou
nto
fde
mol
ition
de-
0.16
340.
1307
0.09
980.
0654
--.0.
0326
80.
0041
bris
inth
ere
cycl
ing
syst
em(8
5%co
ncre
tepl
us15
%no
n-co
ncre
tede
bris
.Se
eFi
g.9)
(mil
lion
tons
)1.
3R
ecyc
ltng
Plan
t#1
.I
a.us
edca
paci
ty(T
PH)
300
300
300
\.0
-....J
b.op
erat
ing
peri
od(h
rs/y
ear)
545
436
332
I
1.4
Rec
yclin
gP
lant
#2a.
used
capa
city
(TPH
)b.
oper
atin
gpe
riod
(hrs
/yea
r)1.
5Pr
oduc
edqu
anti
tyof
recy
cled
0.13
890.
1111
0.08
33co
ncre
teag
greg
ate
(mil
lion
tons
/yea
r)1.
6F
ill
rate
ofno
n-co
ncre
tede
bris
800
800
800
(ton
s/da
y)
1.7
~~ll
rate
ofno
n-co
ncre
tede
bris
0.04
630.
0370
0.02
77m
illi
onto
ns/y
ear)
PART
II.
Ass
ocia
ted
Cos
tsof
-Rec
vclin
cP
lant
Rec
yclin
gP
lant
#12.
1In
itia
lin
vest
men
tin
recy
clin
g89
5,41
0pl
ant
(Tab
le18
,co
l.4)
($)
2.2
Dep
reci
atio
nco
stof
purc
hase
d29
,261
23,4
0817
,825
equi
pmen
t(T
able
18,
col
5x
line
1.3b
)($
/yea
r)I
I ,

TABL
E24
-C
ontin
ued
2.3
Wri
te-o
ffof
set-
upco
st(T
able
I30
,020
I30
,020
I30
,020
18,
col
3ov
erye
ars
ofop
era-
tion
)($
/yea
r)2.
4Su
mof
depr
ecia
tion
and
wri
te-
I59
,281
I53
,429
I47
,845
off
cost
s(2
.2+
2.3)
($/y
ear)
2.5
Prod
uctio
nco
stex
clud
ing
de-
I13
9,56
4I
111,
651
I85
,019
prec
iati
onan
dw
rite
-off
cost
($/y
ear)
2.6
Sale
ofeq
uipm
ent
($)
II
I62
9,08
6R
ecyc
ling
Pla
nt12
2.7
Init
ial
inve
stm
ent
inre
cycl
ing
plan
t(T
able
18,
col
4){$
)2.
8D
epre
ciat
ion
cost
ofpu
rcha
sed
equi
pmen
t(T
able
18,
col
5x
line
1.4b
){$/
year
)
II
II
II
I~2.
9W
rite
-off
ofse
t-up
cost
(Tab
le18
,co
l3
over
year
sof
oper
a-ti
on)(
$/ye
ar)
2.10
Tot
alde
prec
iati
onco
st(2
.8+
2.9)
{$/y
ear)
2.11
Prod
uctio
nco
stex
clud
ing
de-
prec
iati
onco
st{$
/yea
r}2.
12Sa
leof
equi
pmen
t($
)
PART
III.
Ass
ocia
ted
Cos
tsof
SLF
3.1
Init
ial
inve
stm
ent
jnSL
F11
54,2
48(T
able
19,
col
8)3.
2Pr
oduc
tion
cost
(aft
erFi
g.20
)I
115,
750
I10
3,60
0I
99,7
20($
/yea
r)3.
3R
enta
lco
stof
scra
pers
(lsc
ra-
I18
,966
I15
,173
I11
,554
per
for
each
400
tons
/day
ofop
-er
atio
nat
$291
0/m
onth
}{$/
Yea
r),
.".,"-..
-~'.",
",-
",.-
.,..,'\';
-.

TABL
E24
-C
ontin
ued
3.4
Dep
reci
atio
nco
st(s
trai
gh
tli
ne47
,158
47,1
5847
,158
depr
ecia
tion
over
the
inve
stm
ent
peri
odat
the
SLF)
{$/y
ear)
3.5
Prop
erty
tax
(7.5
%on
valu
eof
1,33
81
,338
1,33
8la
ndan
dfa
ci1i
ties
){$/
year
)3.
6Sa
leo
fla
nd($
)17
.294
PART
IVA
nnua
lIn
com
eSt
atem
ent
4.1
Rev
enue
from
sale
ofre
cycl
ed23
1,96
318
5,53
713
9,11
1ag
greg
ate
(ton
nage
from
line
1.5,
sold
at$1
.67/
ton)
{$/y
ear)
4.2
Rev
enue
from
sale
ofre
-bar
s34
,725
27,7
7520
,825
($0.
25pe
rto
nof
conc
rete
de-
bris
proc
esse
d){$
/yea
r)4.
3R
even
uefro
mdu
mpi
ngch
arge
s23
1,50
018
5,00
013
8,50
0($
5.00
/ton
of
non-
conc
rete
,I
debr
is)(
$/ye
ar)
~4.
4Pr
oduc
tion
cost
of
recy
clin
g19
8,84
516
5,08
013
2,86
4pl
ant
#1(l
ines
2.4
+2.
5($
/yea
r)4.
5Pr
oduc
tion
cost
ofreCYClin~
plan
t#2
{lin
es2.
10+
2.11
($/y
ear)
4.6
SlF
oper~ting
cost
(sum
of18
3,21
216
7,26
915
9,77
0li
nes
3.2
to3.
5)($
/yea
r)4.
7O
pera
ting
reve
nues
(sum
of49
8,18
839
8,31
229
8,43
6li
nes
4.1
to4.
3)($
/yea
r)4.
8O
pera
ting
expe
nses
(sum
ofli
nes
382,
052
332,
349
292,
634
4.4
to4.
6)($
/yea
r)4.
9O
pera
ting
inco
me
(lin
es4.
7-
116,
136
65,9
635,
802
4.8)
{$/
year
)

TABL
E24
-C
ontin
ued
4.10
Inco
me
Tax
(50%
ofth
eop
erat
ing
58,0
6832
,982
2,90
1in
com
e)4.
11N
etIn
com
e58
,068
32,9
822,
901
PART
V.Ca
shFl
owan
dN
etP
rese
ntV
alue
Ana
lysi
s5.
1Ca
shIn
flow
from
oper
atio
ns16
4,50
713
3,56
997
,904
with
out
cash
shie
ld(l
ines
4.11
+2.
4+
3.4)
($/y
ear)
5.2
Tax
shie
ld(l
ines
2.4
+3.
453
,219
50,2
9347
,501
over
2)($
/yea
r)5.
3Ca
shin
flow
from
oper
atio
ns21
7,72
618
3,86
214
5,40
5w
ithta
xsh
ield
(lin
es5.
1+
5.2)
($/y
ear)
5.4
Cash
infl
owfro
msa
leof
land
646,
380
or
equi
pmen
t(l
ines
2.6
+3.
6),
($/y
ear)
5.5
Tot
alca
shin
flow
atth
een
d+2
17,7
26+1
83,8
62+7
91.7
85of
the
year
(lin
es5.
3+
5.4)
($/y
ear)
5.6
Tot
alca
shou
tflo
wfo
rca
pita
l1,
049,
658
inve
stm
ent
atbe
yinn
ing
of
year
(lin~s
2.1
+3.
15.
7D
isco
unte
dca
shin
flow
(15%
+189
,326
+139
,026
-+52
0,61
1di
scou
nted
rate
)($/
year
)5.
8N
etpr
esen
tva
lue
($)
-200
,695
.""
..~'\
......
....
...u
~...
..;,
,--~
.
I .......
o o I

TABL
E25
-Ec
onom
ics
-N
etP
rese
ntV
alue
Ana
lysi
sof
Deb
risR
ecyc
ling.
Tot
alQ
uant
ityof
Con
cret
eD
ebris
Prod
uced
:1.
0m
illi
onto
ns.
Tim
e,in
year
s,af
ter
the
start
of
plan
top
erat
ions
.
12
34
5I
6
PART
I.D
ebris
Inflo
w-O
utflo
w
1.1
Proc
essa
ble
quan
titi
eso
fco
n-0.
2778
0.22
220.
1666
0.11
110.
0555
0.00
69cr
ete
debr
isea
chye
ar(a
fter
Tab
le11
)(m
illi
onto
ns)
I1.
2T
otal
amou
nto
fde
mol
ition
de-
0.32
680.
2614
0.19
600.
1307
0.06
540.
0082
bris
inth
ere
cycl
ing
syst
em(8
5%co
ncre
tepl
us15
%no
n-co
ncre
tede
bris
.Se
eFi
g.9)
(mil
lion
tons
)1.
3R
ecyc
ling
Pla
nt#1
.a.
used
capa
city
(TPH
)30
030
030
0b.
oper
atin
gpe
riod
(hrs
/yea
r)1,
089
871
653
1.4
Rec
yclin
gP
lant
#2a.
used
capa
city
(TPH
)b.
oper
atin
gpe
riod
(hrs
/yea
r)1.
5Pr
oduc
edqu
anti
tyo
fre
cycl
ed0.
2778
0.22
220.
1666
conc
rete
aggr
egat
e(m
illi
onto
ns/y
ear)
1.6
Fil
lra
teof
non-
conc
rete
debr
is68
068
068
0(t
ons/
day)
1.7
Fil
lra
teo
fno
n-co
ncre
tede
bris
0.09
230.
0741
0.05
55(m
illi
onto
ns/y
ear)
PART
II.
Ass
ocia
ted
Cos
tsof
Recvc1in~
Pla
ntR
ecyc
ling
Pla
nt#1
895,
410
2.1
Init
ial
inve
stm
ent
inre
cycl
ing
plan
t(T
able
18,
col.
4)($
)
2.2
Dep
reci
atio
nco
stof
purc
hase
d58
,468
46,7
6435
,059
.eq
uipm
ent
(Tab
le18
,co
l5
xli
ne1.
3b)
($/y
ear)
iI
I
I ..... o ..... I

TABL
E25
-C
ontin
ued
2.3
Wri
te-o
ffof
set-
upco
st(T
able
30,0
2030
,020
30,0
20,'.
18,
col
3ov
erye
ars
of
oper
a-ti
on)
($/y
ear)
2.4
Sum
ofde
prec
iati
onan
dw
rite
-88
,488
76,7
8465
,079
off
cost
s(2
.2+
2.3)
($/y
ear)
2.5
Prod
uctio
nco
stex
clud
ing
de-
255,
104
223,
046
167,
220
prec
iati
onan
dw
rite
-off
cost
($/y
ear)
2.6
Sale
ofeq
uipm
ent
($)
665,
059
Rec
yclin
gP
lant
#22.
7In
itia
lin
vest
men
tin
recy
clin
gpl
ant
(Tab
le18
,co
l4)
($)
2.8
Dep
reci
atio
nco
stof
purc
hase
deq
uipm
ent
(Tab
le18
,co
l5
xli
ne
1.4b
)($/
year
)2.
9W
rite
-off
ofse
t-up
cost
(Tab
le18
,co
l3
over
year
sof
oper
a-ti
on)(
$/ye
ar)
2.10
Tot
alde
prec
iati
onco
st(2
.8+
2.9)
($/y
ear)
2.11
Prod
uctio
nco
stex
clud
ing
de-
prec
iati
onco
st($
/yea
r)2.
12S
ale
of
eaui
pmen
t($
)
PART
III.
Ass
ocia
ted
Cos
tsof
SLF
3.1
Init
ial.
inve
stm
ent
jnSL
F25
7,84
8(Ta~le
19,
col
8)3.
2Pr
oduc
tion
cost
(aft
erFi
g.20
)17
3,52
414
8,20
013
0,42
5($
/yea
r)3.
3R
enta
lco
sto
fsc
rape
rs(1
scra
-40
,740
29,1
0023
,280
per
for
each
400
tons
/day
ofop
-er
atio
n.a
t$2
910/
mon
th)(
$/,
year
),
I --'
a N I

TABL
E25
-C
ontin
ued
3.4
Dep
reci
atio
nco
st(s
trai
gh
tli
ne77
,449
77,4
4977
,449
depr
ecia
tion
over
the
inve
stm
ent
peri
odat
the
SLF)
($/y
ear)
3.5
Prop
erty
tax
(7.5
%on
valu
eof
2,28
82,
288
2,28
8la
ndan
dfa
ci1i
ties
)($/
year
)3.
6S
ale
of
Land
($)
PART
IVA
nnua
lIn
com
eSt
atem
ent
4.1
Rev
enue
from
sale
ofre
cycl
ed46
3,92
637
1,0
7427
8,22
2ag
greg
ate
(ton
nage
from
lin
e1.
5,so
ldat
$1.6
7/to
n)($
/yea
r)4.
2R
even
uefro
msa
leo
fre
-bar
s69
,450
55,5
5041
,650
($0.
25pe
rto
no
fco
ncre
tede
-br
ispr
oces
sed)
($/y
ear)
4.3
Rev
enue
from
dum
ping
char
ges
461,
500
370,
500
277
,500
($5.
00/t
ono
fno
n-co
ncre
tede
bris
)($/
year
)4.
4Pr
oduc
tion
cost
of
recy
clin
g34
3,59
229
9,83
023
2,29
9pl
ant
#1(l
ines
2.4
+2.
5($
/yea
r)4.
5Pr
oduc
tion
cost
ofreCYClin~
plan
t12
(lin
es2.
10+
2.11
($/y
ear)
4.6
SLF
oper
atin
gco
st(s
umof
294,
001
257,
037
233,
442
line
s3.
2to
3.5)
($/y
ear)
4.7
Ope
ratin
gre
venu
es(s
umo
f99
4,87
679
7,12
459
7,37
2li
nes
4.1
to4.
3)($
/yea
r)4.
8O
pera
ting
expe
nses
(sum
of
line
s63
7,59
355
6,86
746
5,74
14.
4to
4.6)
($/y
ear)
4.9
Ope
ratin
gin
com
e(l
ines
4.7
-35
7,28
3I
240,
257
131
,631
4.8)
($/y
ear)

TABL
E25
-C
ontin
ued
4.10
Inco
me
Tax
(50%
ofth
eop
erat
ing
178,
642
120,
129
65,8
16in
com
e)4.
11N
etIn
com
e17
8,64
212
0,12
965
,816
PART
V.ca
shFl
owan
dN
etP
rese
ntV
alue
Ana
lysi
s5.
1ca
shIn
flow
from
oper
atio
ns34
4,57
927
4,36
220
8,34
4w
itho
utca
shsh
ield
(lin
es4.
11+
2.4
+3.
4){$
/yea
r).
5.2
Tax
shie
ld(l
ines
2.4
+3.
482
,969
77,1
1671
,264
over
2){$
/yea
r)5.
3ca
shin
flow
from
oper
atio
ns42
7,54
835
1,4
7927
9,60
8w
ithta
xsh
ield
(lin
es5.
1+
5.2)
{$/y
ear)
5.4
Cash
infl
owfro
msa
leo
fla
nd69
9,48
4o
req
uipm
ent
(lin
es2.
6+
3.6)
($/y
ear)
5.5
Tot
alca
shin
flow
atth
een
d+
427,
548
+35
1,4
79+
979,
092
of-t
heye
ar(l
ines
5.3
+5.
4)($
/yea
r)5.
6T
otal
cash
outf
low
for
capi
tal
-1,1
53,2
58in
vest
men
tat
begi
nnin
go
fye
ar(l
ines
2.1
+3.
1)5.
7D
isco
unte
dca
shin
flow
(15%
+37
1,7
80+2
65,7
68+
643,
769
disc
ount
edra
te){
$/ye
ar)
5.8
Net
pres
ent
valu
e($
)+
128,
060
I .... o ~ I

TABL
E26
-Ec
onom
ics
-N
etP
rese
ntV
alue
Ana
lysi
so
fD
ebris
Rec
yclin
g.T
otal
Qua
ntity
ofC
oncr
ete
Deb
risPr
oduc
ed:
2.0
mil
lion
tons
.
Tim
e,in
year
s,af
ter
the
start
ofpl
ant
oper
atio
ns.
12
34
56
PART
I.D
ebris
Inflo
w-O
utflo
w
1.1
Proc
essa
ble
quan
titi
eso
fco
n-0.
5556
0.44
440.
3333
0.22
220.
1111
0.01
38cr
ete
debr
isea
chye
ar(a
fter
Tab
le11
)(m
illi
onto
ns)
I1.
2T
otal
amou
nto
fde
mol
ition
de-
0.65
360.
5228
0.39
200.
2614
0.13
070.
0163
bris
inth
ere
cycl
ing
syst
em(8
5%co
ncre
tepl
us15
%no
n-co
ncre
tede
bris
.Se
eFi
g.9)
(mil
lion
tons
)1.
3R
ecyc
ling
Pla
nt#1
.I
a.us
edca
paci
ty(T
PH)
300
300
300
300
b.op
erat
ing
peri
od(h
rs/y
ear)
2,00
01,
742
1 ,30
787
11.
4R
ecyc
ling
Pla
nt#2
a.us
edca
paci
ty(T
PH)
b.op
erat
ing
peri
od(h
rs/y
ear)
1.5
Prod
uced
quan
tity
ofre
cycl
ed0.
5100
0.44
440.
3333
0.22
22co
ncre
teag
greg
ate
(mil
lion
tons
/yea
r)1.
6F
ill
rate
of
non-
conc
rete
debr
is68
068
068
068
0(t
ons/
day)
1.7
~,i1
1ra
teof
non-
conc
rete
debr
is0.
1700
0.12
500.
1111
0.07
41m
illi
onto
ns/y
ear)
PART
II.
Ass
ocia
ted
Cos
tso
fR
eevc
linc
Pla
ntR
ecyc
ling
Pla
nt#1
2.1
Init
ial
inve
stm
ent
inre
cycl
ing
895,
410
plan
t(T
able
18,
col.
4)($
)
2.2
Dep
reci
atio
nco
stof
purc
hase
d10
7,38
093
,527
73,5
5546
,764
equi
pmen
t(T
able
18,
col
5x
line
1.3b
)($
/yea
r)I
I
I..J
o t11
I

TABL
E26
-C
ontin
ued
I "'-' o 0'1 I
2.3
Wri
te-o
ffo
fse
t-up
cost
(Tab
le22
,515
22,5
1522
,515
22,5
1518
sco
l3
over
year
sof
oper
a-ti
on)
($/y
ear)
2.4
Sum
ofde
prec
iati
onan
dw
rite
-12
9,89
511
6,04
296
,070
69,2
79o
ffco
sts
(2.2
+2.
3)($
/yea
r)2.
5Pr
oduc
tion
cost
excl
udin
gde
-39
5,76
035
7,38
027
7,6
4622
3,04
6pr
ecia
tion
and
wri
te-o
ffco
st($
/yea
r)2.
6Sa
leof
equi
pmen
t($
)48
4,12
2R
ecyc
ling
Pla
nt#2
2.7
Init
ial
inve
stm
ent
inre
cycl
ing
plan
t(T
able
18s
col
4)($
)2.
8D
epre
ciat
ion
cost
ofpu
rcha
sed
equi
pmen
t(T
able
18s
col
5x
line
1.4b
)($/
year
)2.
9W
rite
-off
ofse
t-up
cost
(Tab
leI
18s
col
3ov
erye
ars
ofop
era-
tion
)($/
year
)2.
10T
otal
depr
ecia
tion
cost
(2.8
+2.
9)($
/yea
r)2.
11Pr
oduc
tion
cost
excl
udin
gde
-pr
ecia
tion
cost
($/y
ear)
2.12
Sal
eof
eaui
pmen
t($
)
PART
III.
Ass
ocia
ted
Cos
tso
fSL
F3.
1In
itia
lin
vest
men
tjn
SLF
511
,201
(Tab
le19
,co
l8)
3.2
Prod
uctio
nco
st(a
fter
Fig.
20)
269,
900
215,
000
197,
777
148,
200
($/y
ear)
3.3
Ren
tal
cost
ofsc
rape
rs(1
scra
-69
,840
58,2
0046
,560
29,1
00pe
rfo
rea
ch40
0to
ns/d
ayof
op-
erat
ion
at$2
910/
mon
th){
$/ye
ar)
~

TABL
E26
-C
ontin
ued
3.4
Dep
reci
atio
nco
st(s
trai
gh
tli
ne11
2,92
311
2,92
311
2,92
311
2,92
3de
prec
iati
onov
erth
ein
vest
men
tpe
riod
at
the
SlF
)($/
year
)3.
5Pr
oper
tyta
x(7
.5%
onva
lue
of
4,83
84,
838
4,83
84,
838
land
and
faci
1iti
es)(
$/ye
ar)
3.6
Sal
eo
fla
nd($
)80
,337
PART
IVA
nnua
lIn
com
eSt
atem
ent
4.1
Rev
enue
from
sale
of
recy
cled
851,
700
742,
148
556,
611
371
,974
aggr
egat
e(t
onna
gefro
m1i
ne1.
5,so
ldat
$1.6
7/to
n)($
/yea
r)4.
2R
even
uefro
msa
leo
fre
-bar
s12
7,50
011
1,1
0083
,325
55,5
50($
0.25
per
ton
of
conc
rete
de-
bris
proc
esse
d)($
/yea
r)4.
3R
even
uefro
mdu
mpi
ngch
arge
s85
0,00
062
5,00
055
5,50
037
0,50
0($
5.00
/ton
of
non-
conc
rete
debr
is)(
$/ye
ar)
4.4
Prod
uctio
nco
sto
fre
cycl
ing
525,
655
473,
422
373,
716
292,
325
plan
t#1
(lin
es2.
4+
2.5
($/y
ear)
4.5
Prod
uctio
nco
sto
freCYC1in~
plan
t12
(lin
es2.
10+
2.11
($/y
ear)
4.6
SlF
oper
atin
gco
st(s
umo
f45
7,50
139
0,96
136
2,09
829
5,06
1li
nes
3.2
to3.
5)($
/yea
r)4.
7O
pera
ting
reve
nues
(sum
of
1,82
9,20
01,
478,
248
1,19
5,43
679
7,12
4li
nes
4.1
to4.
3)($
/yea
r)4.
8O
pera
ting
expe
nses
(sum
of
line
s98
3,15
686
4,38
373
5,81
458
7,38
64.
4to
4.6)
($/y
ear)
4.9
Ope
ratin
gin
com
e(l
ines
4.7
-84
6,04
461
3,86
545
9,62
220
9,73
84.
8)($
/yea
r)
I ......
o ..... I

TABL
E26
-C
ontin
ued
4.10
Inco
me
Tax
(50%
ofth
eop
erat
ing
423,
022
306,
933
·229
,811
104,
869
inco
me)
4.11
Net
Inco
me
423,
022
306,
933
229,
811
104,
869
PART
V.ca
shFl
owan
dN
etP
rese
ntV
alue
Ana
lysi
s5.
1ca
shIn
flow
from
oper
atio
ns66
5,84
053
5,89
843
8,80
428
7,07
1w
itho
utca
shsh
ield
(lin
es4.
11+
2.4
+3.
4)($
/yea
r)5.
2Ta
xsh
ield
(lin
es2.
4+
3.4
121,
409
114,
483
104,
497
91,1
01ov
er2)
($/y
ear)
5.3
cash
infl
owfro
mop
erat
ions
787,
249
650,
381
543,
301
391,
568
with
tax
shie
ld(l
ines
5.1
+5.
2)($
/yea
r)5.
4Ca
shin
flow
from
sale
of
land
564,
459
or
equi
pmen
t(l
ines
2.6
+3.
6)($
/yea
r)5.
5T
otal
cash
infl
owat
the
end
+78
7,24
9+6
50,3
81+
543,
301
+95
6,02
7o
fth
eye
ar(l
ines
5.3
+5.
4)($
/yea
r)5.
6T
otal
cash
outf
low
for
capi
tal
-1,4
06,6
11in
vest
men
tat
begi
nnin
go
fye
ar(l
ines
2.1
+3.
1)5.
7D
isco
unte
dca
shin
flow
(15%
+68
4,56
4+
491,
781
+35
7,22
9+4
75,3
14di
scou
nted
rate
){$/
year
)5.
8N
etpr
esen
tva
lue
($)
+60
2,27
7
I -'
a ex> I

TABL
E27
-Ec
onom
ics
-N
etP
rese
ntV
alue
Ana
lysi
sof
Deb
risR
ecyc
ling.
Tot
alQ
uant
ityof
Con
cret
eD
ebris
Prod
uced
:3.
0m
illi
onto
ns.
Tim
e,in
year
s,af
ter
the
start
of
plan
top
erat
ions
.
I --'
o \0 I
12
34
56
PART
I.D
ebris
Inflo
w-O
utflo
w
1.1
Proc
essa
ble
quan
titi
eso
fco
n-0.
8334
0.66
660.
4999
0.33
330.
1666
0.02
08cr
ete
debr
isea
chye
ar(a
fter
Tab
le11
)(m
illi
onto
ns)
I1.
2T
otal
amou
nto
fde
mol
ition
de-
0.98
050.
7842
0.58
800.
3922
0.19
610.
0245
bris
inth
ere
cycl
ing
syst
em(8
5%co
ncre
tepl
us15
%no
n-co
ncre
tede
bris
.Se
eFi
g.9)
(mi1
1ion
tons
)1.
3R
ecyc
ling
Pla
nt#1
.a.
used
capa
city
(TPH
)30
030
030
030
030
0,
b.op
erat
ing
peri
od(h
rs/y
ear)
2,00
02,
000
1,96
01,
307
654
1.4
Rec
yclin
gP
lant
#2a.
used
capa
city
(TPH
)b.
oper
atin
gpe
riod
(hrs
/yea
r)1.
5Pr
oduc
edqu
anti
tyo
fre
cycl
ed0.
5100
0.51
000.
4999
0.33
330.
1666
conc
rete
aggr
egat
e(m
illi
onto
ns/y
ear)
1.6
Fil
lra
teof
non-
conc
rete
debr
is68
068
068
068
068
0(t
ons/
day)
1.7
Fil
lra
teof
non-
conc
rete
debr
is0.
1700
0.17
000.
1667
0.11
110.
0555
(mil
lion
tons
/yea
r)
PART
II.
Ass
ocia
ted
Cos
tsof
Recyclin~
Pla
ntR
ecyc
ling
Pla
nt#1
2.1
Init
ial
inve
stm
ent
inre
cycl
ing
895,
410
plan
t(T
able
18,
col.
4)($
)
2.2
Dep
reci
atio
nco
sto
fpu
rcha
sed
107,
380
107,
380
102,
333
70,1
7335
,113
equi
pmen
t(T
able
18,
col
5x
line
1.3b
)($
/yea
r)1
j

TABL
E27
~C
ontin
ued
2.3
Wri
te-o
ffo
fse
t-up
cost
(Tab
le18
.012
18,0
1218
,012
18,0
1218
,012
18,
col
3ov
erye
ars
ofop
era-
tion
)($
/yea
r)2.
4Su
mof
depr
ecia
tion
and
write~
125,
392
125,
392
120,
345
88,1
8553
,125
off
cost
s(2
.2+
2.3)
($/y
ear)
2.5
Prod
uctio
nco
stex
clud
ing
de-
395,
760
395,
760
387,
845
277
,646
167,
476
prec
iati
onan
dw
rite
-off
cost
($/y
ear)
2.6
Sale
ofeq
uipm
ent
($)
382,
971
Rec
yclin
gP
lant
#22.
7In
itia
lin
vest
men
tin
recy
clin
gpl
ant
(Tab
le18
,co
l4)
{$)
2.8
Dep
reci
atio
nco
stof
purc
hase
deq
uipm
ent
(Tab
le18
,co
l5
xli
ne1.
4b)(
$/ye
ar)
I
2.9
Wri
te-o
ffo
fse
t-up
cost
(Tab
lef-
18,
col
3ov
erye
ars
ofop
era-
f
tion
){$/
year
)2.
10T
otal
depr
ecia
tion
cost
(2.8
+2.
9){
$/ye
ar)
2.11
Prod
uctio
nco
stex
clud
ing
de-
prec
iati
onco
st($
/yea
r)2.
12Sa
leo
feq
uipm
ent
($)
PART
III.
Ass
ocia
ted
Cos
tsof
SLF
3.1
Init
ial
inve
stm
ent
jnSL
F76
5,94
3(T
able
19,
col
8)3.
2Pr
oduc
tion
cost
(aft
erFi
g.20
)26
3,50
026
3,50
026
3,00
019
7,77
713
0,42
5($
/yea
r).
3.3
Ren
tal
cost
ofsc
rape
rs(1
scra
-69
,840
69,8
4069
,840
46,5
6023
,280
per
for
each
400
tons
/day
ofop
-er
atio
nat
$291
0/m
onth
){$/
year
),

TABL
E27
-C
ontin
ued
3.4
Dep
reci
atio
nco
st(s
trai
gh
tli
ne
134,
059
134,
059
134,
059
134,
059
134,
059
depr
ecia
tion
over
the
inve
stm
ent
peri
odat
the
SLF)
($/y
ear)
3.5
Prop
erty
tax
(7.5
%on
valu
eo
f7,
549
7,54
97,
549
7,54
97,
549
land
and
faci
1iti
es)(
$/ye
ar)
3.6
Sal
eo
fLa
nd($
)12
9,12
4
PART
IVA
nnua
lIn
com
eSt
atem
ent
4.1
Rev
enue
from
sale
ofre
cycl
ed85
1,70
085
1,70
083
5,00
055
6,66
127
8,22
2ag
greg
ate
(ton
nage
from
1ine
1.5,
sold
at$1
.67/
ton)
($/y
ear)
4.2
Rev
enue
from
sale
of
re-b
ars
127,
500
127,
500
125,
000
83,3
3341
,650
($0.
25pe
rto
no
fco
ncre
tede
-br
ispr
oces
sed)
($/y
ear)
4.3
Rev
enue
from
dum
ping
char
ges
850,
000
850,
000
833,
500
555,
500
277
,500
($5.
00/t
ono
fno
n-co
ncre
tede
bris
)($/
year
)4.
4Pr
oduc
tion
cost
of
recy
clin
g52
1,15
252
1,15
250
8,19
036
5,83
122
0,60
1pl
ant
#1(l
ines
2.4
+2.
5($
/yea
r)4.
5Pr
oduc
tion
cost
ofreCYC1in~
plan
t12
(lin
es2.
10+
2.11
($/y
ear)
4.6
SLF
oper
atin
gco
st(su
mof
474,
948
474,
948
474,
948
385,
945
295,
313
line
s3.
2to
3.5)
($/y
ear)
4.7
Ope
ratin
gre
venu
es(su
mo
f1,
829,
200
1,82
9,20
01,
793,
500
1,19
5,49
459
7,37
2li
nes
4.1
to4.
3)($
/yea
r)4.
8O
pera
ting
expe
nses
(sum
ofli
nes
996,
100
996,
100
983,
138
751
,776
515,
914
4.4
to4.
6)($
/yea
r)4.
9O
pera
ting
inco
me
(lin
es4.
7-
833,
100
833,
100
810,
362
443,
718
81,4
584.
8)($
/yea
r)
I ......
......
......
I

TABL
E27
-C
ontin
ued
4.10
Inco
me
Tax
(50%
of
the
oper
atin
g41
6,55
041
6,55
040
5,18
122
1,85
940
,729
inco
me)
4.11
Net
Inco
me
416,
550
416,
550
405,
181
221,
859
40,7
29
PART
V.ca
shFl
owan
dN
etP
rese
ntV
alue
Ana
lysi
s5.
1ca
shIn
flow
from
oper
atio
ns67
6,00
167
6,00
165
9,58
544
4,10
322
7,91
3w
itho
utca
shsh
ield
(lin
es4.
11+
2.4
+3.
4){$
/yea
r)5.
2Ta
xsh
ield
(lin
es2.
4+
3.4
129,
726
129,
726
127,
202
111
,122
93,5
92ov
er2)
{$/y
ear}
5.3
cash
infl
owfro
mop
erat
ions
805,
727
805,
727
786,
787
555,
225
321,
505
with
tax
shie
ld(l
ines
5.1
+5.
2)($
/yea
r)5.
4C
ash
infl
owfro
msa
leo
fla
ndo
req
uipm
ent
(lin
es2.
6+
3.6)
,I($
/yea
r)5.
5T
otal
cash
infl
owat
the
end
+80
5,72
7+8
05,7
27+7
86,7
87+5
55,2
25+8
33,6
00l- I
of
the
year
{lin
es5.
3+
5.4}
($/y
ear)
5.6
Tot
alca
shou
tflo
wfo
rca
pita
l-1
,661
,353
inve
stm
ent
atbe
ginn
ing
of
year
(lin
es2.
1+
3.1)
5.7
Dis
coun
ted
cash
infl
ow(1
5%+7
00,6
32+6
09,2
45+5
17,3
25+3
17,4
52+4
14,4
46di
scou
nted
rate
){$/
year
}5.
8N
etpr
esen
tva
lue
($)
+897
,747

TABL
E28
-Ec
onom
ics
-N
etP
rese
ntV
alue
Ana
lysi
sof
Deb
risR
ecyc
ling.
Tot
alQ
uant
ityof
Con
cret
eD
ebris
Prod
uced
:4.
0m
illi
onto
ns.
Tim
e,in
year
s,af
ter
the
star
to
fpl
ant
oper
atio
ns.
12
34
56
PART
I.D
ebri
sIn
flow
-Out
flow
1.1
Proc
essa
ble
quan
titi
eso
fco
n-1.
1111
0.88
880.
6666
0.44
440.
2222
0.02
778
cret
ede
bris
each
year
(aft
erT
able
11)
(mil
lion
tons
)I
1.2
Tot
alam
ount
of
dem
oliti
onde
-1.
3073
1.04
560.
784
0.52
290.
2614
0.03
27b
ris
inth
ere
cycl
ing
syst
em(8
5%co
ncre
tepl
us15
%no
n-.-
conc
rete
debr
is.
See
Fig.
9)(m
illi
onto
ns)
1.3
Rec
yclin
gP
lant
#1.
I
a.us
edca
paci
ty(T
PH)
300
300
300
300
300
b.op
erat
ing
peri
od(h
rs/y
ear)
2,00
02,
000
2,00
01,
743
871
1.4
Rec
yclin
gP
lant
#2a.
used
capa
city
(TPH
)30
030
030
0b.
oper
atin
gpe
riod
(hrs
/yea
r)2,
000
1,48
561
31.
5Pr
oduc
edqu
anti
tyo
fre
cycl
ed1.
020.
8888
0.66
660.
4444
0.22
22co
ncre
teag
greg
ate
(mil
lion
tons
/yea
r)1.
6F
ill
rate
of
non-
conc
rete
debr
is1,
360
1360
/680
*13
60/6
80*
680
680
(ton
s/da
y)1.
7F
ill
rate
of
non-
conc
rete
debr
is0.
340.
2963
0.22
220.
1481
0.07
41(m
illi
onto
ns/y
ear)
PART
II.
Ass
ocia
ted
Cos
tso
fR
ecyc
linc
Pla
ntR
ecyc
ling
Pla
nt#1
2.1
Init
ial
inve
stm
ent
inre
cycl
ing
895,
410
plan
t(T
able
18,
col.
4)($
)
2.2
Dep
reci
atio
nco
stof
purc
hase
d10
7,38
010
7,38
010
7,38
093
,582
46,7
64eq
uipm
ent
(Tab
le18
,co
l5
xli
ne1.
3b)
($/y
ear)
1j
I*b
oth
plan
tsar
ein
oper
atio
n/on
lyon
epl
ant
isin
oper
atio
n
I ..... ..... W I

TABL
E28
-C
ontin
ued
2.3
Wri
te-o
ffo
fse
t-up
cost
(Tab
le18
,012
18,0
1218
,012
18,0
1218
,012
18,
col
3ov
erye
ars
ofop
era-
tion
)($
/yea
r)2.
4Su
mo
fde
prec
iati
onan
dw
rite
-12
5,39
212
5,39
212
5,39
211
1,5
9464
,776
off
cost
s(2
.2+
2.3)
($/y
ear)
2.5
Prod
uctio
nco
stex
clud
ing
de-
395,
760
395,
760
395,
760
357,
585
223,
045
prec
iati
onan
dw
rite
-off
cost
($/y
ear)
2.6
Sal
eof
equi
pmen
t($
)34
2,86
4R
ecyc
ling
Pla
nt#2
2.7
Init
ial
inve
stm
ent
inre
cycl
ing
895,
410
plan
t(T
able
18,
col
4)($
)2.
8D
epre
ciat
ion
cost
ofpu
rcha
sed
107,
380
79,7
3032
,912
equi
pmen
t(T
able
18,
col
5x
lin
e1.
4b){
$/ye
ar)
2.9
Wri
te-o
ffo
fse
t-up
cost
(Tab
le30
,020
30,0
2020
,020
18,
col
3ov
erye
ars
ofop
era-
tion
){$/
year
)2.
10T
otal
depr
ecia
tion
cost
(2.8
+13
7,40
010
9,75
062
,932
2.9)
($/y
ear)
2.11
Prod
uctio
nco
stex
clud
ing
de-
395,
760
315,
459
156,
977
prec
iati
onco
st($
/yea
r)2.
12S
ale
ofeg
uipm
ent
($)
585,
328
PART
III.
Ass
ocia
ted
Cos
tso
fSL
F3.
1In
itia
lin
vest
men
tjn
SLF
984,
745
(Tab
le19
,co
l8)
3.2
Prod
uctio
nco
st(a
fter
Fig.
20)
442,
000
385,
190
266,
600
236,
960
148,
200
($/y
ear)
3.3
Ren
tal
cost
of
scra
pers
{1sc
ra-
139,
680
122,
220
93,1
2058
,200
29,1
00pe
rfo
rea
ch40
0to
ns/d
ayo
fop
-er
atio
nat
$29l
0/m
onth
){$/
.ye
ar}
.,
I .......
.......~ I

TABL
E28
-C
ontin
ued
3.4
Dep
reci
atio
nco
st(s
trai
gh
tli
ne
171,
445
171
,445
141,
445
171
,445
171,
445
depr
ecia
tion
over
the
inve
stm
ent
peri
odat
the
SLF)
($/y
ear)
3.5
Prop
erty
tax
(7.5
%on
valu
eo
f9,
939
9,93
99,
939
9,93
99,
939
land
and
faci
1iti
es)(
$/ye
ar)
3.6
Sal
eo
fLa
nd($
)17
2.1
52
PART
IVA
nnua
lIn
com
eSt
atem
ent
4.1
Rev
enue
from
sale
ofre
cycl
ed1,
703,
400
1,48
4,29
61,
113,
222
742,
148
371,
107
aggr
egat
e(t
onna
gefro
mli
ne
1.5
,so
ldat
$1.6
7/to
n)($
/yea
r)4.
2R
even
uefro
msa
leo
fre
-bar
s25
5,00
022
2,20
016
6,65
011
1,1
0055
,555
($0.
25pe
rto
no
fco
ncre
tede
-br
ispr
oces
sed)
($/y
ear)
4.3
Rev
enue
from
dum
ping
char
ges
1,70
0,00
01,
481,
500
1,1
11,0
0074
0,50
037
0,50
0($
5.00
/ton
of
non-
conc
rete
debr
is)(
$/ye
ar)
4.4
Prod
uctio
nco
sto
fre
cycl
ing
521,
152
521
,152
521,
152
469,
179
287,
821
plan
t#1
(lin
es2.
4+
2.5
($/y
ear)
4.5
Prod
uctio
nco
sto
freCYClin~
533,
160
425,
209
219,
909
Ipl
ant
12(l
ines
2.10
+2.
11($
/yea
r)4.
6SL
Fop
erat
ing
cost
(sum
of
763,
064
688,
794
541,
104
476,
544
358,
684
line
s3.
2to
3.5)
($/y
ear)
4.7
Ope
ratin
gre
venu
es(s
umo
f3,
658,
400
3,18
7,99
62,
390,
872
1,59
3,74
879
7,16
2li
nes
4.1
to4.
3)($
/yea
r)4.
8O
pera
ting
expe
nses
(sum
of
line
s1,
817,
376
1,63
5,15
51,
282,
165
945,
723
646,
505
4.4
to4.
6)($
/yea
r)4.
9O
pera
ting
inco
me
(lin
es4.
7-
1,84
1,02
41,
552,
841
1,10
8,70
764
8,02
515
0,65
74.
8)($
/yea
r)II -
'-'
0'1 I

TABL
E28
-C
ontin
ued
4.10
Inco
me
Tax
(50%
ofth
eop
erat
ing
920,
512
776,
420
554,
354
324,
013
75,3
29in
com
e)4.
11N
etIn
com
e92
0,51
277
6,42
055
4,35
432
4,01
375
,329
PART
V.C
ash
Flow
and
Net
Pre
sent
Val
ueA
naly
sis
5.1
Cas
hIn
flow
from
oper
atio
ns1,
354,
749
1,18
3,00
891
4,12
360
7,05
219
3,43
9w
itho
utca
shsh
ield
(lin
es4.
11+
2.4
+3.
4){$
/yea
r)5.
2Ta
xsh
ield
(lin
es2.
4+
3.4
217,
119
203,
293
179,
884
141,
520
118,
111
over
2){$
/yea
r)5.
3C
ash
infl
owfro
mop
erat
ions
1,57
1,86
71 ,
386,
301
1,09
4,00
774
8,57
131
1,5
50w
ithta
xsh
ield
(lin
es5.
1+
5.2)
($/y
ear)
5.4
Cas
hin
flow
from
sale
of
land
585,
328
515,
016
or
equi
pmen
t(l
ines
2.6
+3.
6)($
/yea
r)5.
5T
otal
cash
infl
owat
the
end
1,57
1,8
67+1
,386
,301
+1,6
79,3
35+
748,
571
+82
6,50
6o
fth
eye
ar(l
ines
5.3
+5.
4)($
/yea
r)5.
6T
otal
cash
outf
low
for
capi
tal
-2,7
75,5
65in
vest
men
tat
begi
nnin
go
fye
ar(l
ines
2.1
+3.
1)5.
7D
isco
unte
dca
shin
flow
(15%
,+1,
366,
841
+1,0
48,2
43+1
,104
,190
+427
,998
+410
,949
disc
ount
edra
te)(
$/ye
ar)
5.8
Net
pres
ent
valu
e($
)+1
,582
,656
I ......
......
0'\ I

TABL
E29
-Ec
onom
ics
-N
etP
rese
ntV
alue
Ana
lysi
sof
Deb
risR
ecyc
ling.
Tot
alQ
uant
ityo
fC
oncr
ete
Deb
risPr
oduc
ed:
5.0
mil
lion
tons
.
Tim
e,in
year
s,af
ter
the
start
of
plan
top
erat
ions
.
12
34
56
PART
I.D
ebris
Infl
ow-O
utfl
ow
1.1
Proc
essa
ble
quan
titi
eso
fco
n-1.
3888
1.11
110.
8333
0.55
550.
2777
0.83
5cr
ete
debr
isea
chye
ar(a
fter
Tab
le11
)(m
illi
onto
ns)
I1.
2T
otal
amou
nto
fde
mol
ition
de-
1.63
411.
3071
0.98
000.
6536
0.32
680.
0408
bri
sin
the
recy
clin
gsy
stem
(85%
conc
rete
plus
15%
non-
conc
rete
debr
is.
See
Fig.
9)(m
i111
onto
ns)
1.3
Rec
yclin
gP
lant
#1.
a.us
edca
paci
ty(T
PH)
450
450
450
450
375
b.op
erat
ing
peri
od(h
rs/y
ear)
2,00
02,
000
2,00
01,
452
871
1.4
Rec
yclin
gP
lant
#2a.
used
capa
city
(TPH
)30
030
0b.
oper
atin
gpe
riod
(hrs
/yea
r)2,
000
1,35
71.
5Pr
oduc
edqu
anti
tyo
fre
cycl
ed1.
275
1.11
110.
765
0.55
550.
2777
conc
rete
aggr
egat
e(m
illi
onto
ns/y
ear)
1.6
Fil
lra
teof
non-
conc
rete
debr
is1,
700
1700
/102
0*1,
020
1,02
01
,020
(ton
s/da
y)1.
7F
ill
rate
of
non-
conc
rete
debr
is0.
425
0.37
040.
255
0.18
520.
0926
(mil
l ion
tons
/vea
r)
PART
II.
Ass
ocia
ted
Cos
tso
fRecyclin~
Pla
ntR
ecyc
ling
Pla
nt#1
2.1
Init
ial
inve
stm
ent
inre
cycl
ing
1,37
6,09
5..
plan
t(T
able
18,
col.
4)($
)
2.2
Dep
reci
atio
nco
sto
fpu
rcha
sed
164,
740
164,
740
164,
740
119,
601
71,7
44eq
uipm
ent
(Tab
le18
,co
l5
x1i
ne1.
3b)
($/y
ear)
Ij
I*b
oth
plan
tsar
ein
oper
atio
n/on
lyon
epl
ant
isin
oper
atio
n.
I ..... ..... 'J I

TABL
E29
-C
ontin
ued
2.3
Wri
te-o
ffof
set-
upco
st(T
able
28,1
1928
,119
28,1
1928
,119
28,1
1918
,co
13
over
year
sof
oper
a-ti
on)
($/y
ear)
2.4
Sum
ofde
prec
iati
onan
dw
rite
-19
2,85
919
2,85
919
2,85
914
7,72
099
,863
off
cost
s(2
.2+
2.3)
($/y
ear)
2.5
Prod
uctio
nco
stex
clud
ing
de-
632,
940
632,
940
632,
940
484,
495
342,
821
prec
iati
onan
dw
rite
-off
cost
($/y
ear)
2.6
Sal
eof
equi
pmen
t($
)54
9,93
4R
ecyc
ling
Pla
nt#2
2.7
Init
ial
inve
stm
ent
1nre
cycl
ing
895,
410
plan
t(T
able
18,
col
4)($
)2.
8D
epre
ciat
ion
cost
ofpu
rcha
sed
107,
380
72,8
57eq
uipm
ent
(Tab
le18
,co
l5
xli
ne
1.4b
)($/
year
)2.
9W
rite
-off
of
set-
upco
st(T
able
45,0
3045
,030
18,
col
3ov
erye
ars
ofop
era-
tion
)($/
year
)2.
10T
otal
depr
ecia
tion
cost
(2.8
+15
2,41
011
7,88
72.
9){$
/yea
r)2.
11Pr
oduc
tion
cost
excl
udin
gde
-39
5,76
028
8,26
7pr
ecia
tion
cost
($/y
ear)
2.12
Sale
ofea
uiom
ent
($)
625.
113
PART
III.
Ass
ocia
ted
Cos
tsof
SLF
3.1
Init
ial
inve
stm
ent
jnSL
F1,
200,
269
(Tab
le19
,co
l8)
3.2
Prod
uctio
nco
st(a
fter
Fig.
20)
510,
000
451,
900
344,
250
277
,800
175,
940
($/y
ear)
3.3
Ren
tal
cost
ofsc
rape
rs(1
scra
-17
4,60
015
1,3
2010
4,76
078
,570
43,6
50pe
rfo
rea
ch40
0to
ns/d
ayof
op-
erat
ion
at$2
910/
mon
th)(
$/ye
ar)
,
I -'
-'
00 I

TABL
E29
-C
ontin
ued
3.4
Dep
reci
atio
nco
st(s
trai
gh
tli
ne
208,
172
208,
172
208,
172
208,
172
208,
172
depr
ecia
tion
over
the
inve
stm
ent
peri
odat
the
SlF
)($/
year
)3.
5P
rope
rty
tax
(7.5
%on
valu
eo
f12
,330
12,3
3012
,330
12,3
3012
,330
land
and
faci
1iti
es)(
$/ye
ar)
3.6
Sal
eo
fla
nd($
)21
5,20
3
PART
IVA
nnua
lIn
com
eSt
atem
ent
4.1
Rev
enue
from
sale
ofre
cycl
ed2,
129,
250
1,85
5,53
71,
277,
550
927,
685
463,
759
aggr
egat
e(t
onna
gefro
mli
ne
1.5
,so
ldat
$1.6
7/to
n)($
/yea
r)4.
2R
even
uefro
msa
leo
fre
-bar
s31
8,75
027
7,77
519
1,25
013
8,87
569
,425
($0.
25pe
rto
no
fco
ncre
tede
-br
ispr
oces
sed)
($/y
ear)
4.3
Rev
enue
from
dum
ping
char
ges
2,12
5,00
01,
852,
000
1,2
75,0
0092
6,00
046
3,00
0($
5.00
/ton
of
non-
conc
rete
debr
is)(
$/ye
ar)
4.4
Prod
uctio
nco
sto
fre
cycl
ing
825,
799
825,
799
825,
799
632,
165
442,
684
plan
t#1
(lin
es2.
4+
2.5
($/y
ear)
4.5
Prod
uctio
nco
sto
fre
cycl
ing
548,
170
406,
154
plan
t#2
{lin
es2.
10+
2.11
}($
/yea
r)4.
6SL
Fop
erat
ing
cost
(sum
of90
5,10
282
3,72
269
9,51
257
6,87
244
0,09
2li
nes
3.2
to3.
5)($
/yea
r}4.
7O
pera
ting
reve
nues
(sum
of
4,57
3,00
03,
985,
312
2,74
3,80
01,
992,
560
996,
184
line
s4.
1to
4.3)
($/y
ear)
4.8
Ope
ratin
gex
pens
es(s
umof
line
s2,
279,
071
2,05
5,67
51,
495,
311
1,20
9,03
788
2,77
64.
4to
4.6)
($/y
ear)
4.9
Ope
ratin
gin
com
e(l
ines
4.7
-2,
293,
929
1,92
9,63
71,
248,
489
783,
523
113,
408
4.8)
($/y
ear)
I .......
.......~I

TABL
E29
-C
ontin
ued
4.10
Inco
me
Tax
(50%
'of
the
oper
atin
g1,
146,
965
964,
819
624,
245
391.
,762
56,7
04in
com
e)4.
11N
etIn
com
e1,
146,
965
964,
819
624,
245
391,
762
56,7
04
PART
V.ca
shFl
owan
dN
etP
rese
ntV
alue
Ana
lysi
s5.
1C
ash
Infl
owfro
mop
erat
ions
1,70
0,40
61,
483,
737
1,02
5,27
674
7,65
436
4,73
9w
itho
utca
shsh
ield
(lin
es4.
11-
+2.
4+
3.4)
($/y
ear)
5.2
Tax
shie
ld(l
ines
2.4
+3.
427
6,72
125
9,45
920
0,51
617
7,9
4615
4,01
8ov
er2)
($/y
ear)
5.3
Cas
hin
flow
from
oper
atio
ns1,
977,
126
1,7
43,1
961,
225,
791
747,
654
518,
757
with
tax
shie
ld(l
ines
5.1
+,
5.2)
($/y
ear)
5.4
Cas
hin
flow
from
sale
of
land
625,
113
765,
137
or
equi
pmen
t(l
ines
2.6
+3.
6)($
/yea
r)5.
5T
otal
cash
infl
owat
the
end
+1,9
77,1
26+2
,368
,309
+1,2
25,7
91+7
47,6
54+1
,283
,894
of
the
year
(lin
es5.
3+
5.4)
($/y
ear)
5.6
Tot
alca
shou
tflo
wfo
rca
pita
l-3
,471
,774
inve
stm
ent
atbe
ginn
ing
of
year
(lin
es2.
1+
3.1)
5.7
Dis
coun
ted
cash
infl
ow(1
5%+1
,719
,240
+1,7
90,7
81+8
05,9
77+4
27,4
73+6
38,3
22di
scou
nted
rate
l($
/yea
r)5.
8N
etpr
esen
tva
lue
($)
+1,9
10,0
20
I ......
N o I

TABL
E30
-Ec
onom
ics
-N
etP
rese
ntV
alue
Ana
lysi
sof
Deb
risR
ecyc
ling.
Tot
alQ
uant
ityof
Con
cret
eD
ebris
Prod
uced
:6.
0m
illi
onto
ns.
Tim
e,in
year
s,af
ter
the
start
ofpl
ant
oper
atio
ns.
..... N .....
12
34
56
PART
I.D
ebris
Infl
ow-O
utfl
ow
1.1
Pro
cess
able
quan
titi
eso
fco
n-1.
6667
1.33
331.
0000
0.66
670.
3333
0.04
16cr
ete
debr
isea
chye
ar(a
fter
Tab
le11
)(m
illi
onto
ns)
I1.
2T
otal
amou
nto
fde
mol
ition
de-
1.96
091.
5685
1 .17
600.
7843
0.39
220.
0490
bri
sin
the
recy
clin
gsy
stem
(85%
conc
rete
plus
15%
non-
conc
rete
debr
is.
See
Fig.
9)(m
i11i
onto
ns)
1.3
Rec
yclin
gP
lant
#1.
II
a.us
edca
paci
ty(T
PH)
450
450
450
450
450
I
b.op
erat
ing
peri
od(h
rs/y
ear)
2,00
02,
000
2,00
01
,742
872
1.4
Rec
yclin
gP
lant
#2a.
used
capa
city
(TPH
)45
045
045
0b.
oper
atin
gpe
riod
(hrs
/yea
r)2,
000
1,48
561
31.
5Pr
oduc
edqu
anti
tyo
fre
cycl
ed1.
531.
3333
1.00
000.
6667
0.33
33co
ncre
teag
greg
ate
(mil
lion
tons
/yea
r)1.
6F
ill
rate
of
non-
conc
rete
debr
is2,
040
2040
/102
0*20
40/1
020*
1,02
01 ,
020
(ton
s/da
y)1.
7F
ill
rate
of
non-
conc
rete
debr
is0.
510.
4444
0.33
330.
2222
0.11
11(m
illi
onto
ns/y
ear)
PART
II.
Ass
ocia
ted
Cos
tsof
Rec
vc1i
ncP
lant
Rec
yclin
gP
lant
#12.
1In
itia
lin
vest
men
tin
recy
clin
g1,
376,
095
plan
t(T
able
18,
col.
4)($
)
2.2
Dep
reci
atio
nco
sto
fpu
rcha
sed
164,
740
164,
740
164,
740
143,
488
71,8
26eq
uipm
ent
(Tab
le18
,co
l5
xli
ne
1.3b
)($
/yea
r)1
J
*bot
hpla~ts
are
inop
erat
ion/
only
one
plan
tis
inop
erat
ion.

TABL
E30
-C
ontin
ued
2.3
Wri
te-o
ffo
fse
t-up
cost
(Tab
le28
,119
28,1
1928
,119
28,1
1928
,119
18,
col
3ov
erye
ars
of
oper
a-ti
on)
($/y
ear)
2.4
Sum
ofde
prec
iati
onan
dw
rite
-19
2,85
919
2,85
919
2,85
917
1,6
0799
,945
off
cost
s(2
.2+
2.3)
($/y
ear)
2.5
Prod
uctio
nco
stex
clud
ing
de-
632,
940
632,
940
632,
940
551
,291
320,
878
prec
iati
onan
dw
rite
-off
cost
($/y
ear)
2.6
Sal
eof
equi
pmen
t($
)52
5,96
5R
ecyc
ling
Pla
nt#2
2.7
Init
ial
inve
stm
ent
inre
cycl
ing
1,37
6,09
5pl
ant
(Tab
le18
,co
l4)
($)
2.8
Dep
reci
atio
nco
stof
purc
hase
d16
4,74
012
2,31
950
,493
equi
pmen
t(T
able
18,
col
5x
lin
e1.
4b)(
$/ye
ar)
2.9
Wri
te-o
ffo
fse
t-up
cost
(Tab
le46
,865
46,8
6546
,865
18,
col
3ov
erye
ars
of
oper
a-ti
on)(
$/ye
ar)
2.10
Tot
alde
prec
iati
onco
st(2
.8+
111
,605
169,
184
97,3
582.
9)($
/yea
r)2.
11Pr
oduc
tion
cost
excl
udin
gde
-63
2,94
047
8,52
626
7,50
0pr
ecia
tion
cost
($/y
ear)
2.12
Sal
eo
feQ
uipm
ent
($)
897,
948
PART
III.
Ass
ocia
ted
Cos
tso
fSL
F3.
1In
itia
lin
vest
men
tjn
SLF
1,41
3,30
4(T
able
19,
col
8),
3.2
Prod
uctio
nco
st(a
fter
Fig.
20)
601,
800
533,
330
426,
667
311
,111
192,
222
($/y
ear)
3.3
Ren
tal
cost
of
scra
pers
(1sc
ra-
209,
520
183,
330
139,
680
87,3
0043
,650
per
for
each
400
tons
/day
of
op-
erat
ion
at$2
910/
mon
th)(
$/ye
ar)
,
I ......
N N I

TABL
E30
-C
ontin
ued
3.4
Dep
reci
atio
nco
st(s
trai
gh
tli
ne
244,
403
244,
403
244,
403
244,
403
244,
403
depr
ecia
tion
over
the
inve
stm
ent
peri
odat
the
SlF
)($/
year
)3.
5P
rope
rty
tax
(7.5
%on
valu
eo
f14
,722
14,7
2214
,722
14,7
2214
,722
land
and
faci
1iti
es)(
$/ye
ar)
3.6
Sal
eo
fla
nd($
)25
8,24
2
PART
IVA
nnua
lIn
com
eSt
atem
ent
4.1
Rev
enue
from
sale
ofre
cycl
ed2,
555,
100
2,22
6,61
11,
670,
000
1,1
13,3
8955
6,61
1ag
greg
ate
(ton
nage
from
lin
e1
.5,
sold
at$1
.67/
ton)
($/y
ear)
4.2
Rev
enue
from
sale
of
re-b
ars
382,
500
333,
325
250,
000
166,
675
83,3
25($
0.25
per
ton
of
conc
rete
de-
bris
proc
esse
d)($
/yea
r)4.
3R
even
uefro
mdu
mpi
ngch
arge
s2,
550,
000
2,22
2,00
01,
666,
500
1,11
1,00
055
5,50
0($
5.00
/ton
of
non-
conc
rete
debr
is)(
$/ye
ar)
4.4
Prod
uctio
nco
sto
fre
cycl
ing
825,
799
825,
799
825,
799
722,
898
420,
823
plan
t#1
(lin
es2.
4+
2.5
($/y
ear)
4.5
Prod
uctio
nco
sto
freCYC1in~
744,
545
647,
710
364,
858
plan
t#2
(lin
es2.
10+
2.11
($/y
ear)
4.6
SlF
oper
atin
gco
st(s
umo
f1,
070,
445
975,
785
825,
472
657,
536
494,
997
line
s3.
2to
3.5)
($/y
ear)
4.7
Ope
ratin
gre
venu
es(s
umof
5,48
7,60
04,
781,
936
3,58
6,50
02,
391,
064
1,19
5,43
6li
nes
4.1
to4.
3)($
/yea
r)4.
8O
pera
ting
expe
nses
(sum
ofli
nes
2,64
0,78
92,
449,
294
2,01
6,12
91,
380,
434
915,
820
4.4
to4.
6)($
/yea
r)4.
9O
pera
ting
inco
me
(lin
es4.
7-
2,84
6,81
12,
332,
642
1,57
0,37
11,
010,
630
279,
616
4.8)
($/y
ear)
I --'
N W I

TABL
E30
-C
ontin
ued
4.10
Inco
me
Tax
(50%
ofth
eop
erat
ing
h,42
3,40
61,
166,
321
.785
,186
.50
5,31
5,13
9,80
8in
com
e)4.
11N
etIn
com
e1.
423.
406
1,11
6,32
178
5,18
650
5,31
513
9,80
8
PART
V.C
ash
Flow
and
Net
Pre
sent
Val
ueA
naly
sis
5.1
Cas
hIn
flow
from
oper
atio
ns1,
972,
273
1,77
2,76
71,
319,
806
921,
325
484,
156
wit
hout
cash
shie
ld(l
ines
4.11
+2.
4+
3.4)
($/y
ear)
5.2
Tax
shie
ld(l
ines
2.4
+3.
427
4,43
430
3,22
326
7,31
020
8,00
517
2,17
4ov
er2)
($/y
ear)
5.3
Cas
hin
flow
from
oper
atio
ns2,
246,
706
2,07
5,99
01,
587,
116
1,12
9,33
065
6,33
0w
ithta
xsh
ield
(lin
es5.
1+
5.2)
($/y
ear)
5.4
Cas
hin
flow
from
sale
ofla
nd89
7,94
878
4,20
7o
req
uipm
ent
(lin
es2.
6+
3.6)
($/Y
ear)
5.5
Tot
alca
shin
flow
atth
een
d+2
,246
,706
+2,0
75,9
90+2
,485
,064
+1,1
29,3
30+1
,440
,537
ofth
eye
ar(l
ines
5.3
+5.
4)($
/yea
r)5.
6T
otal
cash
outf
low
for
capi
tal
-4,1
65,4
94in
vest
men
tat
begi
nnin
go
fye
ar(l
ines
2.1
+3.
1)5.
7D
isco
unte
dca
shin
flow
(15%
+1,9
53,6
57+1
,569
,747
+1,6
33,9
70+6
45,6
98+7
16,2
01di
scou
nted
rate
)($/
year
)5.
8N
etpr
esen
tva
lue
($)
+2,3
53,7
99
I ......
N .j:::> I

TABL
E31
-Ec
onom
ics
-N
etP
rese
ntV
alue
Ana
lysi
sof
Deb
ris
Rec
yclin
g.T
otal
Qua
ntity
ofC
oncr
ete
Deb
risPr
oduc
ed:
7.0
mil
lion
tons
.
Tim
e,in
year
s,af
ter
the
start
of
plan
top
erat
ions
.
12
3I
45
6
PART
I.D
ebris
Infl
ow-O
utfl
ow
1.1
Pro
cess
able
quan
titi
eso
fco
n-1.
9444
1.55
561.
1662
0.77
780.
3889
·0.0
486
cret
ede
bris
each
year
(aft
erT
able
11)
(mil
lion
tons
)I
1.2
Tot
alam
ount
of
dem
oliti
onde
-2.
2878
1.82
991.
3720
0.91
500.
4575
0.05
72br
isin
the
recy
clin
gsy
stem
(85%
conc
rete
plus
15%
non-
conc
rete
debr
is.
See
Fig.
9)(m
illi
onto
ns)
1.3
Rec
yclin
gP
lant
#1.
a.us
edca
paci
ty(T
PH)
600
600
600
600
600
b.op
erat
ing
peri
od(h
rs/y
ear)
2,00
02,
000
2,00
01,
525
763
1.4
Rec
yclin
gP
lant
#2a.
used
capa
city
(TPH
)45
045
0b.
oper
atin
gpe
riod
(hrs
/yea
r)2,
000
1,40
0
1.5
Prod
uced
quan
tity
of
recy
cled
1.78
51.
556
1.02
0.77
780.
3889
conc
rete
aggr
egat
e(m
illi
onto
ns/y
ear)
1.6
Fil
lra
teo
fno
n-co
ncre
tede
bris
2,38
023
80/1
360*
1,36
01,
360
1,3
60(t
ons/
day)
1.7
Fil
lra
teo
fno
n-co
ncre
tede
bris
0.59
50.
5185
0.34
0.25
923
0.12
96(m
illi
onto
ns/v
ear)
PART
II.
Ass
ocia
ted
Cos
tsof
Recy
c1in~
P1an
tR
ecyc
ling
Pla
nt#1
2.1
Init
ial
inve
stm
ent
inre
cycl
ing
1,83
7,15
0pl
ant
(Tab
le18
,co
l.4)
($)
2.2
Dep
reci
atio
nco
sto
fpu
rcha
sed
221,
500
221
,500
221,
500
168,
894
84,5
02eq
uipm
ent
(Tab
le18
,co
l5
xli
ne1.
3b)
($/y
ear)
1J
*bot
hpl
ants
are
inop
erat
ion/
only
one
plan
tis
inop
erat
ion.
, ..... N 01 I

TABL
E31
-C
ontin
ued
2.3
Wri
te-o
ffof
set-
upco
st(T
able
35,1
9035
,190
35,1
9035
,190
35,1
9018
,co
l3
over
year
sof
oper
a-ti
on)
($/y
ear)
2.4
Sum
ofde
prec
iati
onan
dw
rite
-25
6,69
025
6,69
025
6,69
020
4,08
411
9,69
2o
ffco
sts
(2.2
+2.
3)($
/yea
r)2.
5Pr
oduc
tion
cost
excl
udin
gde
-75
9,72
075
9,72
075
9,72
059
7,51
038
1,08
8pr
ecia
tion
and
wri
te-o
ffco
st($
/yea
r)2.
6Sa
leof
equi
pmen
t($
)74
3,30
4R
ecyc
ling
Pla
nt#2
2.7
Init
ial
inve
stm
ent
inre
cyc1
ing
1,37
6,09
5pl
ant
(Tab
le18
,co
l4)
($)
2.8
Dep
reci
atio
nco
stof
purc
hase
d16
4,74
011
5,31
8eq
uipm
ent
(Tab
le18
,co
l5
xli
ne1.
4b)(
$/ye
ar)
2.9
Wri
te-o
ffo
fse
t-up
cost
(Tab
le70
,298
70,2
9818
,co
l3
over
year
sof
oper
a-ti
on)(
$/ye
ar)
2.10
Tot
alde
prec
iati
onco
st(2
.8+
235,
038
185,
616
2.9)
($/y
ear)
2.11
Prod
uctio
nco
stex
clud
ing
de-
632,
940
467,
096
prec
iati
onco
st($
/yea
r)2.
12S
ale
ofeQ
uipm
ent
($)
955.
442
PART
III.
Ass
ocia
ted
Cos
tsof
SLF
3.1
Init
ial
inve
stm
ent
jnSL
F1,
624,
503
(Tab
le19
,co
l8)
3.2
Prod
uctio
nco
st(a
fter
Fig.
20)
654,
000
611
,830
408,
000
347,
060
220,
350
($/y
ear)
3.3
Ren
tal
cost
ofsc
rape
rs(1
scra
-24
4,44
020
9,52
013
9,68
010
4,76
058
,200
per
for
each
400
tons
/day
ofop
-er
atio
nat
$291
0/m
onth
)($/
year
),
I -'
N Ol
I

TABL
E31
-C
ontin
ued
3.4
Dep
reci
atio
nco
st(s
trai
gh
tli
ne
280,
267
280,
267
280,
267
280,
267
280,
267
depr
ecia
tion
over
the
inve
stm
ent
peri
odat
the
SLF)
($/y
ear)
3.5
Prop
erty
tax
(7.5
%on
valu
eo
f17
,113
17,1
1317
,113
17,1
1317
,113
land
and
faci
liti
es)(
$/y
ear)
3.6
Sal
eo
fLa
nd($
)30
1,28
0
PART
IVA
nnua
lIn
com
eSt
atem
ent
4.1
Rev
enue
from
sale
ofre
cycl
ed2,
980,
950
2,59
7,78
51,
703,
400
1,29
8,92
664
9,46
3ag
greg
ate
(ton
nage
from
lin
e1
.5,
sold
at$1
.67/
ton)
($/y
ear)
4.2
Rev
enue
from
sale
of
re-b
ars
446,
250
388,
890
255,
000
194,
450
97,2
25($
0.25
per
ton
of
conc
rete
de-
bris
proc
esse
d)($
/yea
r)4.
3R
even
uefro
mdu
mpi
ngch
arge
s-
2,97
5,00
02,
592,
500
1,70
0,00
01,
296,
150
648,
000
($5.
00/t
ono
fno
n-co
ncre
tede
bris
)($/
year
)4.
4Pr
oduc
tion
cost
of
recy
clin
g1,
016,
410
1,01
6,41
01,
016,
410
801,
594
500,
780
plan
t#1
(lin
es2.
4+
2.5
($/y
ear)
4.5
Prod
uctio
nco
sto
fre
cycl
ing
867,
978
652,
712
plan
t#2
(lin
es2.
10+
2.11
)($
/yea
r)4.
6SL
Fop
erat
ing
cost
(sum
of1,
195,
820
1,11
8,73
084
5,06
074
9,20
057
5,93
0li
nes
3.2
to3.
5)($
/yea
r)4.
7O
pera
ting
reve
nues
(sum
of6,
402,
200
5,57
9,17
53,
658,
400
2,78
9,52
61,
394,
688
line
s4.
1to
4.3)
($/y
ear)
4.8
Ope
ratin
gex
pens
es(s
umof
line
s3,
080,
208
2,78
7,85
21,
861,
470
1,55
0,79
41,
076,
710
I4.
4to
4.6)
($/y
ear)
4.9
Ope
ratin
gin
com
e(l
ines
4.7
-3,
321,
992
2,79
1,32
31,
796,
930
1,2
38,7
3231
7,97
8I
4.8)
($/y
ear)

TABL
E31
-C
ontin
ued
4.10
Inco
me
Tax
(50%
ofth
eop
erat
ing
1,66
0,99
61
,395
,662
898,
465
619,
366
158,
989
inco
me)
4.11
Net
Inco
me
1,66
0,99
61,
395,
662
898,
465
619,
366
158,
989
PART
V.C
ash
Flow
and
Net
Pre
sent
Val
ueA
naly
sis
5.1
Cas
hIn
flow
from
oper
atio
ns2,
432,
991
2,11
8,23
41,
435,
423
1,1
03,7
1755
8,94
8w
itho
utca
shsh
ield
(lin
es4.
11+
2.4
+3.
4)($
/yea
r)5.
2Ta
xsh
ield
(lin
es2.
4+
3.4
385,
998
361,
286
268,
479
242,
176
199,
980
over
2)("
$/ye
ar)
5.3
Cas
hin
flow
from
oper
atio
ns2,
818,
989
2,47
9,52
01,
703,
902
1,34
5,89
275
8,92
8w
ithta
xsh
ield
(lin
es5.
1+
5.2)
($/y
ear)
5.4
Cas
hin
flow
from
sale
of
land
955,
442
1,0
44,5
84o
req
uipm
ent
(lin
es2.
6+
3.6)
($/y
ear)
5.5
Tot
alca
shin
flow
atth
een
d+2
,818
,989
+3,4
34,9
62+1
,703
,902
+1,3
45,8
92+1
,803
,512
of
the
year
(lin
es5.
3+
5.4)
($/y
ear)
5.6
Tot
alca
shou
tflo
wfo
rca
pita
l-4
,837
,748
inve
stm
ent
atbe
ginn
ing
of
year
(lin
es2.
1+
3.1)
5.7
Dis
coun
ted
cash
infl
ow(1
5%+2
,451
,294
+2,5
97,3
25+1
,120
,343
+769
,518
+896
,664
disc
ount
edra
te)(
$/ye
ar)
5.8
Net
pres
ent
valu
e($
)+2
,997
,397
, ..... N 00 I

TABL
E32
-Ec
onom
ics
-N
etP
rese
ntV
alue
Ana
lysi
sof
Deb
ris
Rec
yclin
g.T
otal
Qua
ntity
ofC
oncr
ete
Deb
risPr
oduc
ed:
8.0
mil
lion
tons
.
Tim
e,in
year
s,af
ter
the
star
tof
plan
top
erat
ions
.
12
34
56
PART
I.D
ebris
Infl
ow-O
utfl
ow
1.1
Proc
essa
ble
quan
titi
eso
fco
n-2.
2222
1.77
781.
3222
0.88
890.
4444
0.05
56cr
ete
debr
isea
chye
ar(a
fter
Tab
le11
)(m
illi
onto
ns)
I1.
2T
otal
amou
nto
fde
mol
ition
de-
2.61
462.
0913
1.56
801.
0458
0.52
290.
0654
bris
inth
ere
cycl
ing
syst
em(8
5%co
ncre
tepl
us15
%no
n-co
ncre
tede
bris
.Se
eFi
g.9)
(mil
lion
tons
)1.
3R
ecyc
ling
Pla
nt#1
.I
a.us
edca
paci
ty(T
PH)
750
750
750
750
750
b.op
erat
ing
peri
od(h
rs/y
ear)
2,00
02,
000
2,00
01,
394
697
1.4
Rec
yclin
gP
lant
#2a.
used
capa
city
(TPH
)45
045
0b.
oper
atin
gpe
riod
(hrs
/yea
r)2,
000
1,3
141.
5Pr
oduc
edqu
anti
tyo
fre
cycl
ed2.
041.
7778
1.27
50.
8889
0.44
44co
ncre
teag
greg
ate
(mil
lion
tons
/yea
r)1.
6F
ill
rate
of
non-
conc
rete
debr
is2,
720
2720
/170
0*
1,7
001
,700
1,70
0(t
ons/
day)
1.7
Fil
lra
teo
fno
n-co
ncre
tede
bris
0.68
0.59
260.
425
0.29
630.
1481
(mil
lion
tons
/yea
r)
PART
II.
Ass
ocia
ted
Cos
tso
fR
ecyc
1in<
Pla
ntR
ecyc
ling
Pla
nt#1
2.1
Init
ial
inve
stm
ent
inre
cycl
ing
2,19
4,75
0pl
ant
(Tab
le18
,co
l.4)
($)
2.2
Dep
reci
atio
nco
sto
fpu
rcha
sed
263,
860
263,
860
263,
860
I18
3,91
091
,955
equi
pmen
t(T
able
18,
col
5x
line
1.3b
)($
/yea
r)I
*bot
h:>
lant
sar
ein
o:>e
ratio
n/on
1'r
one
:>la
ntis
inop
erat
ion.
I~ N 1
.0 I

TABL
E32
-C
ontin
ued
I --'
w o I
2.3
Wri
te-o
ffo
fse
t-up
cost
(Tab
le43
,170
43,1
7043
,170
43,1
7043
,170
18,
col
3ov
erye
ars
of
oper
a-ti
on)
($/y
ear)
2.4
Sum
ofde
prec
iati
onan
dw
rite
-30
7,03
030
7,03
030
7,03
022
7,08
013
5,12
5o
ffco
sts
(2.2
+2.
3)($
/yea
r)2.
5Pr
oduc
tion
cost
excl
udin
gde
-90
0,00
090
0,00
090
0,00
066
9,30
138
4,36
8pr
ecia
tion
and
wri
te-o
ffco
st($
/yea
r)2.
6S
ale
of
equi
pmen
t($
)91
1,45
5R
ecyc
ling
Pla
nt12
-
2.7
Init
ial
inve
stm
ent
inre
cycl
ing
1,37
6,09
5pl
ant
(Tab
le18
,co
l4)
($)
2.8
Dep
reci
atio
nco
sto
fpu
rcha
sed
164,
740
108,
234
Ieq
uipm
ent
(Tab
le18
,co
l5
x! I
lin
e1.
4b)(
$/ye
ar)
i I I2.
9W
rite
-off
of
set-
upco
st(T
able
70,2
98~
70,2
98I
18,
col
3ov
erye
ars
ofop
era-
Iti
on)(
$/ye
ar)
I2.
10T
otal
depr
ecia
tion
cost
(2.8
+23
5,03
817
8,53
22.
9)($
/yea
r)I I
2.11
Prod
uctio
nco
stex
clud
ing
de-
632,
940
438,
403
I,
prec
iati
onco
st($
/yea
r)2.
12S
ale
of
eaui
omen
t($
)96
2.52
6J
PART
III.
Ass
ocia
ted
Cos
tsof
SLF
3.1
Init
ial
inve
stm
ent
jnSL
F11
,834
,269
(Tab
le19
,co
l8)
3.2
Prod
uctio
nco
st(a
fter
Fig.
20)
I75
4,80
0($
/yea
r)3.
3R
enta
lco
stof
scra
pers
(1sc
ra-
I27
9,36
0pe
rfo
rea
ch40
0to
ns/d
ayo
fop
-er
atio
nat
$291
0/m
onth
)($/
year
)
685,
630
244,
440
510,
000
174,
600
379,
264
116,
400
236,
960
58,2
00

TABL
E32
-'Con
tinu
ed
3.4
Dep
reci
atio
nco
st(s
trai
gh
tli
ne
315,
842
315,
842
315,
842
315,
842
315,
842
depr
ecia
tion
over
the
inve
stm
ent
peri
odat
the
SLF)
($/y
ear}
3.5
Pro
pert
yta
x(7
.5%
onva
lue
of
19,5
0419
,504
19,5
0419
,504
19,5
04la
ndan
dfa
ci1i
ties
)($/
year
)3.
6S
ale
of
Land
($)
344.
330
PART
IVA
nnua
lIn
com
eSt
atem
ent
4.1
Rev
enue
from
sale
ofre
cycl
ed3,
406,
800
2~968,926
2,12
9,25
01,
670,
000
742,
148
aggr
egat
e(t
onna
gefro
mli
ne
1.5
,so
ldat
$1.6
7/to
n)($
/yea
r)4.
2R
even
uefro
msa
leo
fre
-bar
s51
0,00
044
4,45
031
8,75
022
2,22
211
1,11
0($
0.25
per
ton
of
conc
rete
de-
bris
proc
esse
d)($
/yea
r)4.
3R
even
uefro
mdu
mpi
ngch
arge
s3,
400,
000
2,96
3,00
02,
125,
000
1,48
1,50
074
0.50
0($
5.00
/ton
of
non-
conc
rete
debr
is)(
$/ye
ar)
4.4
Prod
uctio
nco
sto
fre
cycl
ing
1,20
7,03
01,
207,
030
1,20
7,03
089
6,38
151
9,49
3pl
ant
#1(l
ines
2.4
+2.
5($
/yea
r)4.
5Pr
oduc
tion
cost
ofreCYClin~
867,
978
616,
935
plan
t#2
(lin
es2.
10+
2.11
($/y
ear)
4.6
SLF
9per
atin
gco
st(s
umof
1,36
9,50
61,
265,
416
1,01
9,94
683
1,01
063
0,50
6li
nes
3.2
to3.
5)($
/yea
r)4.
7O
pera
ting
reve
nues
(sum
of
7,31
6,80
06,
376,
376
4,57
3,00
03,
373,
722
1,59
3,74
8li
nes
4.1
to4.
3}($
/yea
r)4.
8O
pera
ting
expe
nses
(sum
ofli
nes
3,44
4,51
43,
089,
381
2,22
6,97
61,
727,
391
1,14
9,99
94.
4to
4.6)
($/y
ear)
4.9
Ope
ratin
gin
com
e(l
ines
4.7
-3,
872,
286
3,28
6,99
52,
346,
024
1,64
6,33
144
3,74
94.
8)($
/yea
r)
I --'
w --'
I

TABL
E32
-C
ontin
ued
4.10
Inco
me
Tax
(50%
ofth
eop
erat
ing
1t9
36,1
431
t643
,498
1t1
73t0
1282
3t1
6622
1,87
5in
com
e)4.
11N
etIn
com
e1 t
936
t143
1t64
3t4
981t
173
t012
823
t166
221
t875
PART
V.C
ash
Flow
and
Net
Pre
sent
Val
ueA
naly
sis
5.1
Cas
hIn
flow
from
oper
atio
ns2 t
794
t053
2 t44
4t9
021,
795
t884
1t3
66t0
8867
2t8
42w
itho
utca
shsh
ield
(lin
es4.
11+
2.4
+3.
4)($
/yea
r)5.
2Ta
xsh
ield
(lin
es2.
4+
3.4
428
t955
400
t702
311
t436
271
A61
225
t484
over
2)($
/yea
r)5.
3C
ash
infl
owfr
omop
erat
ions
3 t22
3t0
082 t
845
t604
2 t10
7t3
20L
637,
549
898,
326
with
tax
shie
ld(l
ines
5.1
+5.
2)($
/yea
r)5.
4C
ash
infl
owfr
omsa
leof
land
962
t526
1t2
55t7
85o
req
uipm
ent
(lin
es2.
6+
3.6)
($/y
ear)
5.5
Tot
alca
shin
flow
atth
een
d+3
t223
t008
+3t8
08t1
30+2
,107
,320
+1,6
37,5
49+2
,154
,111
of
the
year
(lin
es5.
3+
5.4)
($/y
ear)
5.6
Tot
alca
shou
tflo
wfo
rca
pita
l-5
,405
,114
inve
stm
ent
at
begi
nnin
go
fye
ar(l
ines
2.1
+3.
1)5.
7D
isco
unte
dca
shin
flow
(15%
+2,8
02t6
16+2
,879
,493
+1,3
85,5
97+9
36,2
74+1
,070
,974
disc
ount
edra
te}(
$/ye
ar)
5.8
Net
pres
ent
valu
e($
)+3
,669
t839
I --'
W N I

TABL
E33
-Ec
onom
ics
-N
etP
rese
ntV
alue
Ana
lysi
sof
Deb
risR
ecyc
ling.
Tot
alQ
uant
ityof
Con
cret
eD
ebris
Prod
uced
:9.
0m
illi
onto
ns.
Tim
e,in
year
s,af
ter
the
start
ofpl
ant
oper
atio
ns.
12
34
56
PART
I.D
ebris
Inflo
w-O
utflo
w.
1.1
Proc
essa
ble
quan
titi
eso
fco
n-2.
5000
2.00
001.
5000
1.00
000.
5000
0.06
25cr
ete
debr
isea
chye
ar(a
fter
Tab
le11
)(m
illi
onto
ns)
1.2
Tot
alam
ount
of
dem
oliti
onde
-2.
9414
2.35
271.
764
1.17
650.
5882
0.07
35br
isin
the
recy
clin
gsy
stem
(85%
conc
rete
plus
15%
non-
conc
rete
debr
is.
See
Fig.
9)(m
i111
onto
ns)
1.3
Rec
yclin
gP
lant
#1.
Ia.
used
capa
city
(TPH
)75
075
075
075
075
0b.
oper
atin
gpe
riod
(hrs
/yea
r)2,
000
2,00
02,
000
1,56
978
41.
4R
ecyc
ling
Pla
nt#2
a.us
edca
paci
ty(T
PH)
600
600
b.op
erat
ing
peri
od(h
rs/y
ear)
2,00
01,
421
1.5
Prod
uced
quan
tity
of
recy
cled
2.29
52.
0000
1.27
51.
0000
0.50
00co
ncre
teag
greg
ate
(mill
ion
tons
/yea
r)1.
6F
ill
rate
ofno
n-co
ncre
tede
bris
3,06
030
60/1
700*
1,7
001,
700
1,7
00(t
ons/
day)
1•7
~Ii
11ra
teof
non-
conc
rete
debr
is0.
765
0.66
670.
425
0.33
330.
1667
mil
lion
tons
/Yea
r)
PART
II.
Ass
ocia
ted
Cos
tsof
Recy
c1in~
Pla
ntR
ecyc
ling
Pla
nt#1
2.1
Init
ial
inve
stm
ent
inre
cycl
ing
2,19
4,75
0pl
ant
(Tab
le18
,co
l.4)
($)
2.2
Dep
reci
atio
nco
stof
purc
hase
d26
3,86
026
3,86
026
3,86
021
0,56
010
3,43
3eq
uipm
ent
(Tab
le18
,co
l5
xli
ne1.
3b)
($/y
ear)
I*b
oth
plan
tsar
ein
oper
atio
n/on
lyon
epl
ant
isin
oper
atio
n.
I ......
w W I

TABL
E33
-C
ontin
ued
.
2.3
Wri
te-o
ffo
fse
t-up
cost
(Tab
le43
,170
43,1
7043
,170
43,1
7043
,170
18,
col
3ov
erye
ars
ofop
era-
tion
)($
/yea
r)2.
4Su
mof
depr
ecia
tion
and
wri
te-
307,
030
307,
030
307,
030
253,
730
146,
603
off
cost
s(2
.2+
2.3)
($/y
ear)
2.5
Prod
uctio
nco
stex
clud
ing
de-
900,
000
900,
000
900,
000
737,
831
432,
345
prec
iati
onan
dw
rite
-off
cost
($/y
ear)
2.6
Sale
of
equi
pmen
t($
)87
3,32
7R
ecyc
ling
Pla
nt#2
2.7
Init
ial
inve
stm
ent
inre
cycl
ing
1,8
37,1
50pl
ant
(Tab
le18
,co
l4)
($)
2.8
Dep
reci
atio
nco
sto
fpu
rcha
sed
221,
500
157,
376
equi
pmen
t(T
able
18,
col
5x
line
1.4b
)($/
year
)2.
9W
rite
-off
of
set-
upco
st(T
able
87,9
7587
,975
18,
col
3ov
erye
ars
ofop
era-
tion
)($/
year
)2.
10T
otal
depr
ecia
tion
cost
(2.8
+30
9,47
524
5,35
12.
9)($
/yea
r)2.
11Pr
oduc
tion
cost
excl
udin
gde
-75
9,72
058
2,21
2p
red
atio
nco
st($
/yea
r)2.
12S
ale
of
equi
pmen
t($
)1,
282,
324
PART
III.
Ass
ocia
ted
Cos
tso
fSL
F3.
1In
itia
lin
vest
men
tjn
SLF
2,04
2,80
6(T
able
19,
col
8)3.
2Pr
oduc
tion
cost
(aft
erF
ig.
20)
789,
300
733,
300
467,
500
413,
300
250,
000
($/y
ear)
3.3
Ren
tal
cost
of
scra
pers
(1sc
ra-
314,
280
279,
360
174,
600
130,
950
72.7
50pe
rfo
rea
ch40
0to
ns/d
ayof
op-
ler
atio
nat
$29l
0/m
onth
)($/
year
),
I
I ......
w ~ I

TABL
E33
-C
ontin
ued
3.4
Dep
reci
atio
nco
st(s
trai
gh
tli
ne
351,
174
351,
174
351,
174
351
,174
351
,174
depr
ecia
tion
over
the
inve
stm
ent
peri
odat
the
SLF)
($/y
ear)
3.5
Prop
erty
tax
(7.5
%on
valu
eo
f21
,895
21,8
9521
,895
21,8
9521
,895
land
and
faci
1iti
es)(
$/ye
ar)
3.6
Sal
eo
fLa
nd($
)38
7,36
5
PART
IVA
nnua
lIn
com
eSt
atem
ent
4.1
Rev
enue
from
sale
ofre
cycl
ed3,
832,
650
3,34
0,00
02,
129,
250
1,67
0,00
083
5,00
0ag
greg
ate
(ton
nage
from
lin
e1.
5,so
ldat
$1.6
7/to
n)($
/yea
r)4.
2R
even
uefro
msa
leof
re-b
ars
573,
750
500,
000
318,
750
250,
000
125,
000
($0.
25pe
rto
no
fco
ncre
tede
-br
ispr
oces
sed)
($/y
ear)
-~
I4.
3R
even
uefro
mdu
mpi
ngch
arge
s3,
825,
000
3,33
3,50
02,
125,
000
1,66
6,50
083
3,50
0($
5.00
/ton
ofno
n-co
ncre
teI
debr
is)(
$/ye
ar)
4.4
Prod
uctio
nco
sto
fre
cycl
ing
1,20
7,03
01,
207,
030
1,20
7,03
099
1,5
6157
8,95
7pl
ant
#1(l
ines
2.4
+2.
5($
/yea
r)4.
5Pr
oduc
tion
cost
of
recy
clin
g1,
069,
195
827,
563
plan
t#2
(lin
es2.
10+
2.11
)($
/yea
r)4.
6SL
Fop
erat
ing
cost
(sum
of1,
467,
649
1,38
5,72
91,
015,
169
917,
319
695,
819
line
s3.
2to
3.5)
($/y
ear)
4.7
Ope
ratin
gre
venu
es(s
umo
f8,
231,
400
7,17
3,50
04,
573,
000
3,58
6,50
01,
793,
500
Ili
nes
4.1
to4.
3)($
/yea
r)I
4.8
Ope
ratin
gex
pens
es(s
umo
fli
nes
3,74
3,87
43,
420,
322
2,22
2,19
91,
908,
880
1,27
4,77
6!
4.4
to4.
6)($
/yea
r)I
4.9
Ope
ratin
gin
com
e(l
ines
4.7
-4,
487,
526
3,75
3,17
82,
350,
801
1,67
7,62
051
8,72
4I I
4.8)
($/y
ear)
I
I -o
J
W t1l
I

TABL
E33
-C
ontin
ued
4.10
Inco
me
Tax
(50%
ofth
eop
erat
ing
2,24
3,76
31,
876,
589
~1,
175,
401
838,
810
259,
362
inco
me)
4.11
Net
Inco
me
2,24
3,76
31
,876
,589
1,17
5,40
183
8,81
025
9,36
2
PART
V.C
ash
Flow
and
Net
Pre
sent
Val
ueA
naly
sis
5.1
Cas
hIn
flow
from
oper
atio
ns3,
211,
442
2,78
0,14
41,
833,
605
1,44
3,71
475
7,13
9w
itho
utca
shsh
ield
(lin
es4.
11+
2.4
+3.
4)($
/yea
r)5.
2Ta
xsh
ield
(lin
es2.
4+
3.4
483,
839
451,
778
329,
102
302,
452
248,
889
over
2)($
/yea
r)5.
3C
ash
infl
owfr
omop
erat
ions
3,69
5,28
23,
231,
922
2,16
2,70
71,
746,
166
1,00
6,02
8w
ithta
xsh
ield
(lin
es5.
1+
5.2)
($/y
ear)
5.4
Cas
hin
flow
from
sale
of
land
1,28
2,32
41,
260,
692
or
equi
pmen
t(l
ines
2.6
+3.
6)($
/yea
r)5.
5T
otal
cash
infl
owat
the
end
+3,6
95,2
82+4
,514
,246
+2,1
62,7
07+1
,746
,166
+2,2
66,7
19o
fth
eye
ar(l
ines
5.3
+5.
4)($
/yea
r)5.
6T
otal
cash
outf
low
for
capi
tal
-6,0
74,7
06in
vest
men
tat
begi
nnin
go
fye
ar(l
ines
2.1
+3.
1)5.
7D
isco
unte
dca
shin
flow
(15%
+3,2
13,2
88+3
,413
,418
+1,4
22,0
15+9
98,3
76+1
,126
,960
disc
ount
edra
te)(
$/ye
ar)
5.8
Net
pres
ent
valu
e($
)+4
,099
,352
I --'
W 0\ I

TABL
E34
-Ec
onom
ics
-N
etP
rese
ntV
alue
Ana
lysi
sof
Deb
risR
ecyc
ling.
Tot
alQ
uant
ityof
Con
cret
eD
ebris
Prod
uced
:10
.0m
illi
onto
ns.
Tim
e,in
year
s,af
ter
the
start
ofpl
ant
oper
atio
ns.
I~ w .....
... I
12
34
56
PART
J.Dfahri~
Infl
aw
-Ou
tflo
w
1.1
Proc
essa
ble
quan
titi
eso
fco
n-2.
7778
2.22
221.
6666
1.11
110.
5555
0.06
94cr
ete
debr
isea
chye
ar(a
fter
Tab
le11
)(m
illi
onto
ns)
I1.
2T
otal
amou
nto
fde
mol
ition
de-
3.26
822.
6141
1.96
001.
3071
0.65
390.
0817
bris
inth
ere
cycl
ing
syst
em(8
5%co
ncre
tepl
us15
%no
n-co
ncre
tede
bris
.Se
eFi
g.9)
.(m
illi
onto
ns)
1.3
Rec
yclin
gP
lant
#1.
a.us
edca
paci
ty(T
PH)
750
750
750
750
750
,
b.op
erat
ing
peri
od(h
rs/y
ear)
2,00
02,
000
2,00
01,
743
872
1.4
Rec
yclin
gP
lant
#2a.
used
capa
city
(TPH
)75
075
075
0b.
oper
atin
gpe
riod
(hrs
/yea
r)2,
000
1,46
661
31.
5Pr
oduc
edqu
anti
tyof
recy
cled
2.55
2.22
221.
6667
1.11
110.
5556
conc
rete
aggr
egat
e(m
illi
onto
ns/y
ear)
1.6
Fil
lra
teof
non-
conc
rete
debr
is3,
400
3400
/170
0*34
00/1
700*
1,70
01,
700
(ton
s/da
y)1.
7F
ill
rate
of
non-
conc
rete
debr
is0.
850.
7407
0.55
550.
3704
0.18
52(m
illi
onto
ns/v
ear)
PART
II.
Ass
ocia
ted
Cos
tsof
RecYclin~
Pla
ntR
ecyc
ling
Pla
nt#1
2.1
Init
ial
inve
stm
ent
inre
cycl
ing
2,19
4,75
0pl
ant
(Tab
le18
,co
l.4)
($)
2.2
Dep
reci
atio
nco
stof
purc
hase
d26
3,86
026
3,86
026
3,86
022
9,95
411
5,04
3eq
uipm
ent
(Tab
le18
,co
l5
xli
ne1.
3b)
($/y
ear)
j*b
oth
plan
tsar
ein
oper
atio
n/on
lyon
epl
ant
isin
oper
atio
n.

TABL
E34
-C
ontin
ued
2.3
Wri
te-o
ffo
fse
t-up
cost
(Tab
le43
,170
43,1
7043
,170
43,1
7043
,170
18,
col
3ov
erye
ars
of
oper
a-ti
on)
($/y
ear)
2.4
Sum
ofde
prec
iati
onan
dw
rite
-30
7,03
030
7,03
030
7,03
027
3,12
415
8,21
3o
ffco
sts
(2.2
+2.
3)($
/yea
r)2.
5Pr
oduc
tion
cost
excl
udin
gde
-90
0,00
090
0,00
090
0,00
079
4,60
848
0,87
3pr
ecia
tion
and
wri
te-o
ffco
st($
/yea
r)2.
6S
ale
of
equi
pmen
t($
)84
2,32
3R
ecyc
ling
Pla
nt#2
2,19
4,75
02.
7In
itia
lin
vest
men
t1n
recy
clin
gpl
ant
(Tab
le18
,co
l4)
($)
2.8
Dep
reci
atio
nco
sto
fpu
rcha
sed
263,
860
190,
771
80,8
73eq
uipm
ent
(Tab
le18
,co
l5
xli
ne
1.4b
)($/
year
)2.
9W
rite
-off
of
set-
upco
st(T
able
71,9
5071
,950
71,9
5018
,co
l3
over
year
so
fop
era-
tion
)($/
year
).
2.10
Tot
alde
prec
iati
onco
st(2
.8+
235,
810
262,
721
158,
823
2.9)
($/y
ear)
2.11
Prod
uctio
nco
stex
clud
ing
de-
900,
000
681,
377
392,
584
prec
1ati
onco
st($
/yea
r)2.
12S
ale
of
equi
pmen
t($
)1,
443,
396
PART
III.
Ass
ocia
ted
Cos
tso
fSL
F3.
1In
itia
lin
vest
men
tjn
SLF
2,25
0,41
1(T
able
19,
col
8)3.
2Pr
oduc
tion
cost
(aft
erFi
g.20
)85
0,00
077
0,30
063
3,30
046
0,00
027
7,8
00($
/yea
r)I
3.3
Ren
tal
cost
of
scra
pers
(1sc
ra-
349,
200
305,
550
232,
800
160,
050
72,7
50pe
rfo
rea
ch40
0to
ns/d
ayof
op-
Ier
atio
nat
$291
0/rn
onth
)($/
year
),
I ..... eN ex> I

TABL
E34
-C
ontin
ued
3.4
Dep
reci
atio
nco
st(s
trai
gh
tli
ne
386,
317
386,
317
386,
317
386,
317
386,
317
depr
ecia
tion
over
the
inve
stm
ent
peri
odat
the
SlF
)($/
year
)3.
5Pr
oper
tyta
x(7
.5%
onva
lue
of
24,2
8724
,287
24,2
8724
,287
24,2
87la
ndan
dfa
ci1i
ties
)($/
year
)3.
6S
ale
of
land
($)
430,
414
PART
IVA
nnua
lIn
com
eSt
atem
ent
4.1
Rev
enue
from
sale
ofre
cycl
ed4,
258,
500
3,71
1,07
42,
783,
389
1,85
5,53
792
7,85
2ag
greg
ate
(ton
nage
from
lin
e1.
5,so
ldat
$1.6
7/to
n)($
/yea
r)4.
2R
even
uefro
msa
leo
fre
-bar
s63
7,50
055
5,55
041
6,67
527
7,77
513
8,90
0($
0.25
per
ton
of
conc
rete
de-
bris
proc
esse
d)($
/yea
r)4.
3R
even
uefro
mdu
mpi
ngch
arge
s4,
250,
000
3,70
3,50
02,
777,
500
1,85
2,00
092
6,00
0($
5.00
/ton
ofno
n-co
ncre
tede
bris
)($/
year
)4.
4Pr
oduc
tion
cost
of
recy
clin
g1,
207,
030
1,20
7,03
01,
207,
030
1,06
7,73
263
9,08
6pl
ant
#1(l
ines
2.4
+2.
5($
/yea
r)
4.5
Prod
uctio
nco
sto
freCYC1in~
1,13
5,81
094
4,09
855
1,40
7pl
ant
#2(l
ines
2.10
+2.
11($
/yea
r)4.
6SL
Fop
erat
ing
cost
(sum
of
1,60
9,80
41,
486,
454
1,27
6,70
41
,030
,654
761,
154
line
s3.
2to
3.5)
($/y
ear)
4.7
Ope
ratin
gre
venu
es(s
umo
f9,
146,
000
7,97
0,12
45,
977
,564
3,98
5,31
21,
992,
752
line
s4.
1to
4.3)
($/y
ear)
4.8
Ope
ratin
gex
pens
es(s
umo
fli
nes
3,95
2,64
43,
637,
582
3,03
5,14
12,
098,
386
1,40
0,24
04.
4to
4.6)
($/y
ear)
4.9
Ope
ratin
gin
com
e(l
ines
4.7
-5,
193,
356
4,33
2,54
22,
942,
423
1,88
6,92
659
2,51
24.
8)($
/yea
r)
I .......
W \.0 I

TABL
E34
-C
ontin
ued
4.10
Inco
me
Tax
(50%
ofth
eop
erat
ing
2,59
6,67
82,
166,
271
1,47
1,21
294
3,46
329
6,25
6in
com
e)4.
11N
etIn
com
e2,
596,
678
2,16
6,27
11,
471,
212
943,
463
296,
256
PART
v.C
ash
Flow
and
Net
Pre
sent
Val
ueA
naly
sis
5.1
Cas
hIn
flow
from
oper
atio
ns3,
525,
835
3,12
2,33
92,
323,
382
1,60
2,90
484
0,78
6w
itho
utca
shsh
ield
(lin
es4.
11+
2.4
+3.
4)($
/yea
r}5.
2Ta
xsh
ield
(lin
es2.
4+
3.4
464,
579
478,
034
426,
085
329,
720
272
,265
over
2)($
/yea
r}5.
3Ca
shin
flow
from
oper
atio
ns3,
990,
414
3,60
0,37
32,
749,
467
1,93
2,62
51,
113,
051
with
tax
shie
ld(l
ines
5.1
+5.
2)($
/yea
r}5.
4Ca
shin
flow
from
sale
of
land
1,44
3,39
61,
272,
737
or
equi
pmen
t(l
ines
2.6
+3.
6)($
/yea
r)5.
5T
otal
cash
infl
owat
the
end
+3,9
90,4
14+3
,600
,373
+4,1
92,8
63+1
,932
,625
+2,3
85,7
88o
fth
eye
ar(l
ines
5.3
+5.
4)($
/yea
r)5.
6T
otal
cash
outf
low
for
capi
tal
-6,6
39,9
11in
vest
men
tat
begi
nnin
go
fye
ar(l
ines
2.1
+3.
1)5.
7D
isco
unte
dca
shin
flow
(15%
+3,4
69,9
25+2
,722
,399
+2,7
56,8
75+1
,104
,484
+1,1
86,1
58di
scou
nted
rate
)($/
year
)5.
8N
etpr
esen
tva
lue
($)
+4,6
00,4
31
I --'~ a I
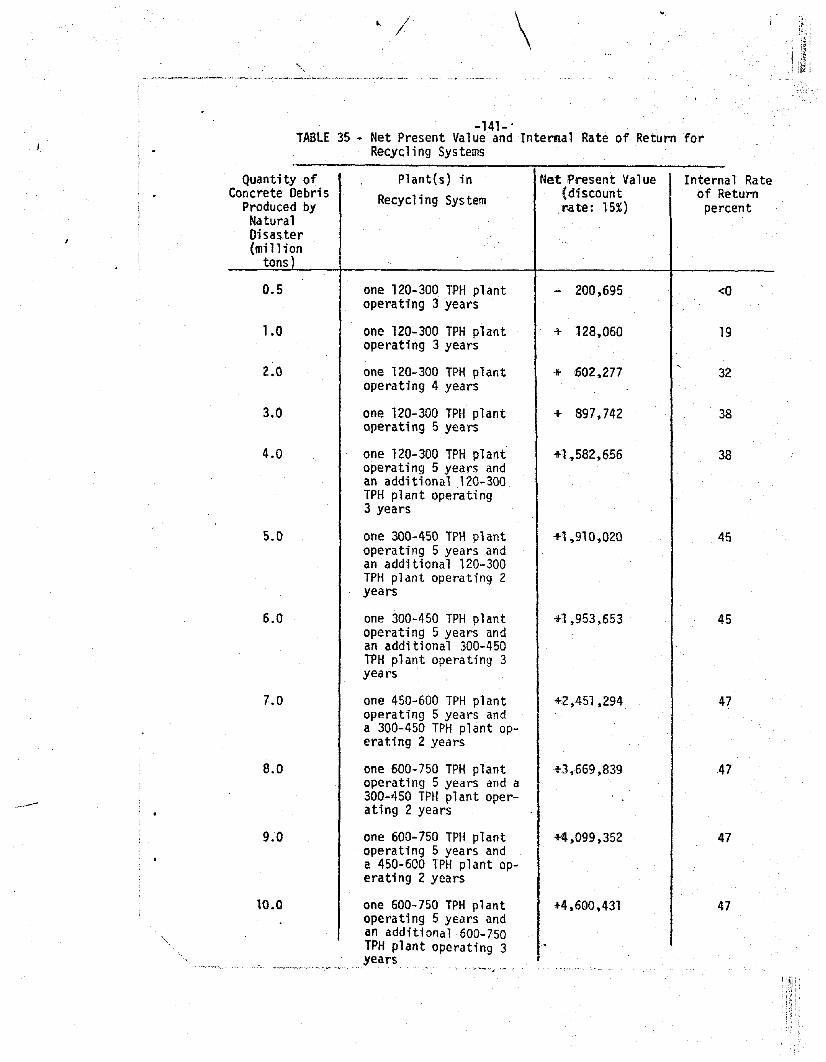
" / \
-141-"TABLE 35 - Net Present Val ue and Internal Rate of Return for
Recycling Systems
Quantity ofConcrete Debri s
Produced byNaturalDisaster(million
tons)
Plant(s) inRecycling System
Net Present Value(discountrate: 15%)
Internal Rateof Returnpercent
0.5
1.0
2.0
3.0
4.0
one 120-300 TPH plantoperating 3 years
one 120-300 TPH plantoperating 3 years
one 120-300 TPH plantoperating 4 years
one 120-300 TPH plantoperating 5 years
one 120-300 TPH plantoperating 5 years andan additional 120-300TPH plant operating3 years
- .200,695 <0
of- 128,060 19
of- '002,277 32
+ 897,742 38
+1,582,656 38
5.0
6.0
7.0
8.0
9.0
10.0
one 300-450 T?H plantoperating 5 years andan additional 120-300TPH plant operating 2years
one 300-450 TPH plantoperating 5 years andan additional 300-450TPH plant operating 3years
one 450-600 TPH plantoperating 5 years anda 300-450 TPH plant operating 2 years
one 600-750 TPH plantoperating 5 years and a300-450 TPH plant operating 2 years
one 600-750 TPH plantoperating 5 years anda 450-600 TPH plant operating 2 years
one 600-750 TPH plantoperating 5 years andan additional 600-750TPH plant operating 3years
,-_..~... .".._.-.-..,
+1,910,020
+1 ,953,653
+2,451,294
+3,669,839
+4,099,352
+4,600,431
45
45
47
47
47
47


-142-
TABLE 36 - Composition and Costs of Natural Aggregate Concreteand Recycled Aggregate Concrete of EquivalentPerformance.
Type of Natural Aggregate Concrete Recycled Aggregate Concrete
Material Material Quan- Material Material Quan- Materialtities for Costs tities for Costs1 cu yd ($/2000 1bs) 1 cu yd ($/2000 lbs)concrete concrete
(lbs) (lbs)
Cement 615 50 677 50
Fine 1230 4.0 1230 4.0Aggregate
Coarse 1845 3.3 1845 1.67Aggregate
Cost of 1 cu. yd. of natural aggregate concrete:
615 X~ + 1230 x 4.0 + 1845 x 3.3 = $·20 8/cu .yd2000 2000 2000 ., ..
Cost of 1 cu. yd. of recycled aggregate concrete:
677 x~ + 1230 x 4.0 + 1845 x 1.67 = $20 9/cu yd2000 2000 2000 •..

-141-TABLE 35 - Net Present Value and Internal Rate of Return for
Recycling Systems
Quantity ofConcrete Debri s
Produced byNaturalDisaster(million
tons)
0.5
1.0
2.0
3.0
4.0
5.0
6.0
7.0
8.0
9.0
10.0
I
Plant{s) inRecyc1i ng Sys tern
one 120-300 TPH plantoperating 3 years
one 120-300 TPH plantoperating 3 years
one 120-300 TPH plantoperating 4 years
one 120-300 TPH plantoperating 5 years
one 120-300 TPH plantoperating 5 years andan additional 120-300TPH plant operating3 years
one 300-450 TPH plantoperating 5 years andan additional 120-300TPH plant operating 2years
one 300-450 TPH plantoperating 5 years an~
an additional 300-450TPH plant operating 3years
one 450-600 TPH plantoperating 5 years anda 300-450 TPH plantoperating 2 years
one 600-750 TPH plantoperating 5 years and a
. 300-450 TPH pl antoper. ating2 years
one6QO-750 TPH plantoperating 5 years anda 450-600 TPH plant operating 2 years
one 600-750 TPH plantoperating 5 years andan additional 600-750TPH plant operating 3"1 I ',...
Net Present Value(discountrate: 15%)
- 200,695
+ 128,060
+ 602,277
+ 897,742
+1,582,656
+1,910,020
+1,953,653
+2,451,294
+3,669,839
+4,099,352
+4,600,431
Interna1 Rateof Returnpercent
<0
19
32
38
38
45
45
47
47
47
47

o
Al Control
B= Uncontaminated RAC
C= Contaminated RAe
0= Gypsum - Mortar
Specimens Produced With~
Portland Cement ITypeD: ~
t
-143-
C
iSpecimens Produced WithPortland CementType I
750
4250
4000
- 3750C/)0- 3500"-'
:z:3250I-
(!)
z 3000lJJa::t- 2750(J)
lJJ2500>-(J)
C/)2250lJJ
a::0-~ 20000u 1750
1500
1250
250 l..l_..J.1 ..Ll 1-1 - __1-1 I-I -.1._
14 28 49 14 28 49
AGE (DAYS)
Fig. 1. - Relationship between Age and Compressive Strength. Water toCemen~ Ratio is 0.55.

•
5500
-144
Specimens Produced WithPortland Cement Type I
Specimens Produced WithPortland Cement Type II
5250
.75.65
A: Control
B: Uncontaminated RAe
C: Contaminated RAe
0: Gypsum - MC?rtar
.55 .65 .75.45 .55
WATER TO CEMENT RATIO
2750
2500
2250
2000
1750
1500
1250
1000
750.45
4250
4500
4750
5000
_ 3750-en!!; 3500
:I:f- 3250(!)zwa=fenW>-en(fJwa=a..:EoO·
Fig. 2. - Relationship between Water to Cement Ratio and 28-Day CompressiveStrength.

•
5.5
5.0
C/)a..
<D 4.5f0-)(W.. 4.0>-....-(.)-....en 3.5«.Jl1J
IJ..0 3.0CJ):::>.J:::>a0 2,5~
2.0
-145-
Specimens Produced WithPortland Cement Type I
Specimens Produced WithPortland Cement Type :II.
Ar Control
Sr Uncontaminated RAe
C: Contaminated RAe
1.5·--.--1.---.&..-----""'-----4'-----1---_--1:--_14 28 49 14
AGE (DAYS)
28 49
Fig. 3. - t·1odulus of Elasticity in Compression as a Function of .4qe .. Haterto Cement Ratio is 0.55.

IT
otal
Bui
ldin
gIn
vent
ory
inEa
chof
the
Are
asW
hich
Suff
ered
Ear
thqu
ake
Inte
nsit
ies
VII
orHi
gher
(sq.
feet
)E
arth
quak
eIn
tens
ity
VII
VII
IIX
X
I VII
I V1I
IIIX
IX
X
-::.
I--
-_._
-_....
Dam
age
Prob
abil
ity
~1atr
ix(a
fter
Tab
le1)
Dam
age
Perc
ent
ofT
otal
Squa
reS
tate
Foot
age
Join
ing
Eath
Dam
age
Sta
te
Ear
thqu
ake
Inte
nsit
yV
IIV
III
IXX
Hea
vyPH
,VII
PH,V
III
PH,I
XPH
,X
Tot
alP T
,VII
P T,V
III
P T,I
XPT
,X
=
.'
iI
Squa
reFo
otag
ein
Each
Dam
age
Sta
te.....
'.~
inEa
chA
rea
Tot
alSq
uare
Am
ount
ofT
otal
Am
ount
Ch I
Dam
age
Ear
thqu
ake
Inte
nsit
yFo
otag
ein
Con
cret
eD
ebris
ofC
oncr
ete
Deb
risEa
chDa
mag
eG
ener
ated
Gen
erat
edS
tate
VII
IV
III
IXX
'Sta
te(t
on
s/sq
.ft.
)(t
ons)
-.~.
---.
-.
~...
-".
--....
_....
..
.---
._--
Hea
vySF
H,V
IISF
H,V
III
SFH
, IX
SFH,
XX ES
F H, i
=SF
H0.
0066
SFH
x0.
0066
;=V
II
XT
ota1
..SF
T,V
IISF
T,V
III
SFT,
IXSF
T,X
\LS
F T,i
=SF
T0.
06SF
rx
0.06
i=V
IITO
TAL:
SFH
x0.
0066
+SF
Tx
0.06
FIG
.4.
-M
etho
dolo
gyfo
rE
stim
atin
gC
oncr
ete
Deb
risG
ener
ated
from
Bul
ldin
gs.
!'

...'.
-147-
•
"0s::
QJIOU-l10o.QJVl_
.00>10s:: __.....
."0 10->..... c:(::J
CO 'f-'f-0OQJ..., .....QJ~
.QJu..QJ
SCVIOS-:JIOCT::J VlCTVlS-
QJ0.
...
··A: BCDDistance from Center of Urban Area (miles)
Fi gure 5 -.Dens By of Buil di ng Space as a functlon ofDistance from Center of Urban Area

"
-148-
,
ANGELESNATIONAL
FOREST·r
SANTA
EARTHQU.t\KE<J EPICENTER
ANGELESNATIONAL
FOREST
ANAHEIM
SANTA AN2
Figure 6: -The San Fernando, California, Earthquake of February 9,1971;Zones of Modified Mercal1i Intenslty (Note: Shaded area represents .urban area).

10
0,0
00
f/0
'00
0
~I
II
II
)&!:'
5,000~
13do,~00
;-
\-+1-
-----
NA
TUR
AL
DIS
AS
TER
S
HIG
HW
AY
'\
TON
SO
FC
ON
CR
ETE
DE
BR
IS
PR
OJE
CTS
LAR
GE
ME
TRO
PO
LITA
NA
RE
AS
Fig.
7-
Con
cret
eD
ebri
sG
ener
atio
n
I ..... .j:::o \0 I

~o0::I.L.
oW>o.~
W0::
en0::CDWoW~W0::UZoUI.L.0<t x(f)WZO::~<t
0::ZW0t>-l<t-len~o
-150-
DEBRIS REMOVED IMMEDIATLY AFTERDISASTER AND BEFORE ESTABLiSHMENTOF CONCRETE RECYCLING PLANTS INAREA
PROCESSABLE QUANTITIES OFCONCRETE DEBRIS EACH YEAR
A·
o 0.5 1.0 1.5 2.0 2.5 3.0 3.5 4.0 4.5 5.0 5.5 6.0
TIME IN YEARS AFTERNATURAL DISASTER
Fig. 8 - Clearance of Concrete Debris Following a Natural Disaster
Note: The area of the triangle in this Figure should equal the totaltonnage of concrete produced by the natural disaster. Accordingly,the abscissa x varies from 0.167 to 3.30 million tons for totalconcrete debris generation of 0.5 to 10 million tons respectively.

-151-
Fe DEBRIS\
NON- FERROUSDEMOLITION DEBRIS
85 % CONC RETEg% BRICK
4.0°/0 WOOD2.0% GYPSUM, PLASTICS,
ETC. 1
PRIMARYCRUSHING
SOME Fe DEBRISFe DEBRIS----+~ ,.----'----, --------+. r-----.....
PRELIMINARYCLEANING ANDSIZEREDUCTION
--'-+>0 '-------~--------oi;1l>o> '-----....I
NON - FERROUS IDEMOLITION DEBRIS
I75 % CONCRETEII % BRICK
II % WOOD3 % GYPSUM, PLASTICS,
GLASS, ETC.
SORTINGS OFLIGHTWEIGHTIMPURiTIES
1.90% CONCRETE10% BRICK
,---"-;'--,SECONDARYCRUSHING
!RECYCLED. AGGREGATE
90% CONCRETE10 % BRICK
MAGNETICAND MANUALSEPARATIONOF FE DEBRIS
NON-CONCRETENON - FERROUS DEBRIS
26% BRICK63% WOOD
11% GYPSUM, PLASTICS,ETC.
SANITARYLANDFILL
67% WOOD330;0 GYPSUM
ETC.
"
Fe DEBRIS
850;o CONCRETE9 % BRICK4 % WOOD2% GYPSUM, PLASTICS,
ETC.
Fig. 9 - Material Balance of Plant for Recycled Concrete Aggregate.

NON-CONCRETEDEBRIS
-152DEMOLITION DEBRIS
~,.--------- ----,,...----"'""L ~F!.E~l:~NiN~G _~R~C:E:SJ! MOSTLY 6,IIICRETE DEBRIS
6. 42Q1
x 160
HOPPER - FEEDER
RE-BAR
LRE-BAR
511
X161
(SCREEN OPENINGSI" 3" 3"1-.-.- )2 4 8
o
MAGNETICSEPARATOR
24 11X 50· STACKER :1 .:~~v'~6
7 -1 3" PRODUCT
24".50' STACKER 6 a
o ~"PRODUCT4
2411
X 50 I STACKER
t 0----;..,0II" PRODUCT
2'
51xl4
1 ~--SCREEN :c: \".../(4'OPENINGS) 1
on-----:.----l~42
11X50
1
CONVEYOR(SPRING-TYPE) ~~~~~~-SCREWt ~. (MAX FEED =4
11
400 TPH)MOSTLY WOODIL.-_________ I
UNCONTAMINATED CONCRETE
r----.I !~b~~ @' ~CRUSHER ~(D.~= III200 TPHI !
Fig. 10 - Schematic Design of a Recycling Plant with a 120-300 TPH CapacityNote: D.S. = discharge.

NON-CONCRETEDEBRIS
-153
DEMOLITION DEBRIS
r-------t ------..-------41 PRECLEANING PROCESS IL .J
! !MOSTLY CONCRETE DEBRIS
.L::S:: ~211X lSi HOPPER-FEEDER
RE-BAR
SURGE PILE
6'x161
~.~PiCI<EDRE-BAR
SCREEN . ~ r----II---OI----------~(41' OPENINGS 1 . 30 ~42 11JAW CRUSHER
WITH PERFORATED I 4211
X 401 rO-1'J D.S. =4 ,200 TPH)
PLATES) f CONVEYOR L....Uo 0 ~A--
'I' ~24 x40 RE-BARCONVEYOR
MAGNETIC~SEPARATOR
u 42"x 601
I JI..1 r· 4211
x 60'OONVEYER CONVEYOR(SPRING -TYPE) (SPRING-TYPE)
fO 3611x40' CONV~YOR
MOSTLY WOOD 6.Fig: 11 - Schematic Design ofa Recycling Plant with a300-450 TPH Capacity.
Note: D.S. = discharge.
44")( 20'DOUBLE-SCREWWASHER(MAX FEED =4
11
400 TPH)
44"x201
SINGLE - SCREW
~ ~WASHER ,
I I· (MAX FEED =4 '
200 TPH)UNCONTAMINED CONCRETE
r----...,' l~6"'4~' CONV~OR66S t ~CONE @ SiX 16'CRUSHER (SCREEN OPENINGS
(D.S.= 1* II 1 'f,r, i")
~o 3:~:::~N:E?OR 24'" BO~'STACKER ~o 0,", 6.
2411
x80' STACKER ~ 3"PRODUCT
6 f 0 0 24",BO' STACKER A"I f' PRODUCT :::"'\~~
2 0 7" ~' PRODUCT4

e'x Ie' ~.:ICKEIRE-8AR
~~~~:E~INGS V~--Tr-3-o-QOX-4-2'-\-J~-W-C-R-U-SH-E-R--'1WITH PERFORATEOt 42 x 40 rCJ,'J D.S!': 4
11
, 200 TPH) +.PLATES) CONVEYOR ~
o 0 ~/\.~
2411X 40" ~
CONVEYOR RE~BARMAGNETIC
~ I SEPARATOR
V 4211x 50' IJ,,",,~ r-r--l+4- 2-n
-x 5-0-'';'"CONVEYOR CONVEYOR(SPRING -TYPE) . (SPRING-TYPE)
~ 0 4211Jt 40' CON~EYOR
MOSTLY WOOD 6.SURGE PILE
-154DEMOLITION DEBRIS
r------1-------,~--___tl PRECLEANING PROCESS I'r- -"' --- -~~-T~y-10NCRETE OEBFlIS
.is 48°1)( 20° HOPPER- FEEDER
RE-BAR
t__-----,
NON-CONCRETEDEBRIS
Fig. 12 - Schematic Design of aNote: D.S. = discharge.
r----~-_:::::=='r""':::bo44OQ X 20'DOUBLE-SCREW
~WASHER
I (MAX FEED: 4"400 TPH)
UNCONTAMINATED CONCRETE
,...----------.., 10 t f 0
~_ 42 11 x 40' CONVEYOR
ees 5100 i@CONE ~ CONE l' x 20'
f~~~~~ D f~~~~ (SCREEN OPENINGS
320 TP~) ~ 200 TPH) ~ 124"X8~~4~'s.:.~.:.~:R ~ .a 30"x 100'0 CONVEYORO A.~ 0 0", ~
.6 24"X80~:ACKER 0 24"X80'STACKER~.. :" PRODUCT
Ir'PRODUCT ~ ~
2 0 7" ~' PROOUCT4
Recycling Plant with a 450-600 TPH Capacity.

NON - CONCRETEDEBRIS
-155DEMOLITION DEBRIS
,.. - - - - - -~- - - - - --,-----(I PRECLEANING PROCESS Ir-----~;;;LY ~J'NCRETE DEBRIS
D 4811
j( 20' HOPPER - FEEDER
RE-BAR
4211x 48"
D.S. =4"270 TPHzs:-
RE-BAR
MAGNETICn-------~~ SE~RATOR
24"x 40' 'l nCONVEYOR 42"x 50' 4-2-111 +-5-
0-,.z.-........
CONVEY~R CONtEYOR(SPRING TYPE) (SPRING-TYPE)
MOSTLY WOOD ~B" xSO' CONVEYOR
SURGE PILE
(811
,411
. OPENINGS . 4211 40' . 0WTH PERFORATED
C£1.:1. E
PLATES) O.~V YOR
""\ -y{), 2211 x50 11
u.:::J (Jt~:~y'SHER230 TPH
4411 x20' _DOUBLE-SCREWWASHER
I (MAX FEED =4", 400 TPH)
UNCONTAMINATED CONCRETE
,..----------------.., r-~B"X:0' CONZ~OR66S 5100 @CONE CONE 7 11 x 20' .
f~~I}~ f~.~~~ . . (SC~E;'~3S?PENINGS)
320 T~P) ~ 200 THP) ~ 1 12 , '4' e )o 36" X 100" CONVEYORu 24' x10~O'ST.ACKER ::"'1
r"-. 0 0", .~t 0. 24" X 100' STACKER 3" PRODUCT
/'>.. 0 2.4'x IOO'STACKER~ ..11" PRODUCT ~ ~~
2 0 ~ of PRODUCT
Fig. 13 - Schematic Design of a Recycling Plant with a 600-750 TPH Capacity.NOTE: D.S. = discharge.

~
1/-
/, // I.........
,~
SE
CTI
ON
a-a
Fig.
14-
Per
fora
ted
Pla
teSc
reen
forSeparatin~
Re-
bars
orO
ther
Long
Obj
ects
from
Gra
nula
rD
ebri
sM
ater
ial
(1)
~
//
1/
1/ I., .....
-...)
I -'
CJJ
0'1 I •

....
SK
IMM
ED
LIG
HT
WE
IGH
TD
EL
ET
ER
IOU
SM
AT
ER
IAL
Fig.
15-
Ope
ratio
nof
Coa
rse
Mat
eria
lW
ashe
r(1
7)
•
~-~ER
LE
VE
L I -'
<.T1
'-J I

CO
NC
RE
TEP
IEC
ES
TOC
RU
SH
ER
MES
HBE
LTAN
DF
AN
SQUE
EZE
WAT
ERo
CON
VEY
OR
pE
T
Co)
--+
-0~~
Fig
.16
-P
reli
min
ary
Cle
anin
gO
pera
tion
s(5
5)
(/\li
GH
TFR
AC
TIO
N~
(0)~
:IvI .....
...C
J1 <:Xl
I
••

-159-
-(J)'-0
00
2500'to-0(J)
'"0C0en
2000:::J0
.s::;f---cQ)
1500E-enQ)>c
0 1000;Ec
500 ~__..L..l-__.J-_-J.....J-__...L.-.L..-..._-L...._--I-~
200 300 400 500 600 700
Recycling Concrete Plant, Tons IHour
Fig.l? - Relationship Between Required Initial Investment in aConcrete Recycling Plant and Plant Capacity.(after Table 18).
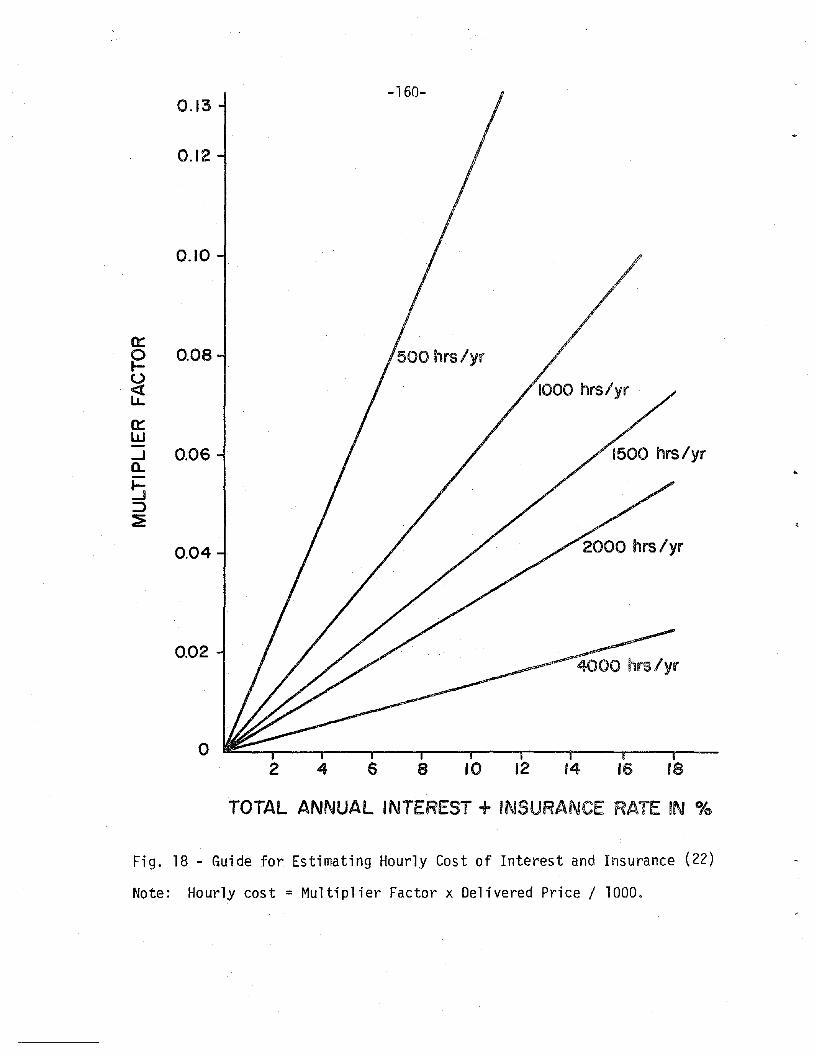
-160-0.13
0.12
0.10
n:~ 0.08u~n:w..J 0.06a..!:i::::>~
0.04
0.02
o2 4 6 8 10 12 '4 16 18
TOTAL ANNUAL INTEREST + INSURANCE RATE IN °/0
Fig. 18 - Guide for Estimating Hourly Cost of Interest and Insurance (22)
Note: Hourly cost = Multiplier Factor x Delivered Price / 1000.

-c~"""-~-C1>-00\C1>L-t:J)C)
«C1>-C1>L-0C
.. 0()
"'0C1>0~0C1>
(k:
'to-0-(/)
0()-0~
"'00L-
a.
-161-
1.5
1.4
1.3 .
1.2
1.1
1.0'----o0ן-I----------'----'------'--.1..--01..----->-...1--
200 300 400 500 600 700
Recycl ing Concrete Plant Capacity, Tons / Hour
Fig. 19 - Relationship Between Production Cost and Plant Capacity ina Recycling Concrete Plant.(Assumption: The plant oper~t~s. 100 hours/y~a~at averagecapacity and will be in operation for 4 years.)

4.0
0
3.0
0I- 00 0 u Z
cI .....
.
e~2
.00
O'l
N~
I
U<
*t
I::
:>-
0 0 0:::
0..
1.00 o
L..
ai
IIii
Q~-"'(i
it
0.1
0.2
0.3
0.4
0.5
0.6
0.7
0.8
0.9
AN
NU
AL
FIL
LR
ATE
(Mill
ion
tons
Iya
or)
Fig
.20
-P
rod
uct
ion
Cos
to
fth
eS
lFS
yste
m(2
2)
--'..
••
"

(
-163-
APPENDIX I - NOTATION
The following symbols are used in this report:
C3A = abbreviation for 3CaO $ A1 203. Tricalcium Aluminate.
DPM = Damage Probability Matrix
MMI = Modified Mercalli Intensity
RAC = Recycled Aggregate Concrete. Concrete in which crushed and gradedwaste concrete has been used as aggregate.
SLF =Sanitary Land Fill
UBC = Uniform Building Code
V = Volume of Specimen
Wa =Weight of the Specimen in Air
Ww = Weight of the Specimen in Water
y = Specific Weight of the Water

-164-
APPENDIX II
ESTH1ATE OF THE PERCENTAGE OF STRUCTURAL CONCRETE THAT NEEDS REPLACEMENT
IN A HEAVILY DAMAGED BUILDING. SURVEY OF PROFESSIONALS IN THE AREA OF
EARTHQUAKE ENGINEERING.
To estimate the percent of structural concrete that has to be re
placed in a heavily damaged building we contacted seven distinguished pro
fessionals and scholars in the area of earthquake engineering and presented
them with the following question, together with descriptive photographs.
QUESTION
The following question pertains to concrete-frame or concrete-shear
wall buildings of 5 to 20 stories.
From the following verbal description of a damage situation:
Major structural damage requi ri ng repai r or repl acement of manystructural members; associated non-structural damage requiring repairs to major portion of interior; building vacated during repairs;
and the enclosed photographs describing visually the damage situation; and
finally, a numerical description:
cost of repairs. _cost of replacement - 0.3
Please estimate the percentage of structural concrete that needs to be
replaced in this particular damage situation.
We received five replies \'/ith estimates ranging from 5 to 25~~ and an
average value of 11.2%.

•
-165-DEPARTMENT OF CIVIL ENGINEERiNG
MASSACHUSETTS INSTITUTE OF TECHNOL.OGY
CAMBRIDGE, MASSACHUSETTS 02139
APPENDIX III - SOLICITATION OF ADVICE FROt4 EQUIPr~ENT PRODUCERS ON THEDESIGN OF CONCRETE RECYCLING PLANTS (LETTER)
February 17, 1977
Dear Sir:
I am a graduate student in the Department of Civil Engineering atMassachusetts Institute of Technology. I am currently working with Prof.S. Frondistou-Yannas on a National Science Foundation sponsored projectwhich deals with an economic assessment of t"ecycling concrete debris. Ina previous studyls the economic attractiveness of recycled concrete debrisas a substitute for natural aggregate has been assessed for a processingplant with a 150 to 200 tph capacity. We now want to extend our investigation to higher capacities of the recycling operation. Also, we wouldlike to deal more effectively with the problem of separating steel re-barsand wire meshes; wood; gypsum; and other deleterious materials from theconcrete debris.
The purpose of this survey is to gather some realistic purchase/rentalprice and operational cost figures so that the production cost estimatescan be made for concrete recycling operations. The latters in this worksincludes only the following operations:
(a)
(b)
(c)
(d)
(e)
(f)
Preliminary separation of steel re-bars and wire-meshes from concrete debris.2Loadings crushing and screening through primary crusher.Further separation of steel re-bars and wire-meshes. 3
Loading, crushing and screening through secondary crusher. 4
Removing unwanted materials (e.g. s wood pieces and gypsum in wallboards, plaster or tiles) from crushed concrete. 5
Stockpil ing of finished product.
I would appreciate it very much if you could design in a rough mannera low-cost crushing-washing plant which would meet the following designcriteria:
(a) The least expensive plant with respect to setting up and operatingis preferred, whether fixed or portable.
(b) Primary crusher should be able to accomodate a maximum of a 31 x31 concrete piece.
(c) Primary crusher should produce a 4" minus to 611 minus aggregate.(d) Secondary crusher should procude a 1-1/2 11 minus aggregate.

February 17" 1977
-166-
Page 2•
(e) Average Production should be around tph on continuousbasis.
(f) Any model year equipment (new or used) can be used to assemblethe plant.
(g) There is no spatial restriction upon the setting up of the plant.
The equipment which is possibly needed to construct the plant is listedon the next page. Please supply the figures requested if they are available;otherwise, please place a (?) in the appropriate box.
For equipment not available from your compnay, I would appreciate itif you could supply references from which we can locate it.
Attached you will find the diagram of a schematic design. Please feelfree to change or modify the system.
In addition, I would like to ask you to enclose brochures describingthe equipment you have used in the design.
If you wish to have a copy of our report, I would be more than happyto send you one. I would appreciate it if you would return this questionnaire as soon as possible. Thank you very much for your assistance.
Respectfully yours,
Herbert Ng
HN:OEnclosures
1Itoh, 1., "An Assessment of the Economic Attractiveness of Waste Concreteas Aggregate Material,1I thesis presented to Massachusetts Institute ofTechnology, Cambridge, Mass., 1976, in partial fulfillment of the requirements for the degree of Master of Science.
2For example, size-reduction by steel ball hanging from a crane, then manualpick up of re-bar and wire-meshes.
3For example, a magnetic separator with some manual separation in addition.
4The 2-stage close-circuit process depicted in the attached figure can alsobe substituted by other processes.
5For example, a coarse material washer-dewaterer as shown in the attachedfigure, or an impactor type secondary crusher may serve some of the separation functions.

-167-
•
DEMOLITIONDEBRIS
. 1 _I II PRECLEANING PROCESS :
X····:::::~.?:'~;~i·fEEDER
RE-BAR
rOil: JAW~CRUSHER
MAGNETICSEPARATOR
MOSTLY wOOD
NONCONCRETE DEBRIS
~~~~~~1OVERSIZED AGGREGATESCREEN 1/ .
gOHVEYOR BEL~~ RE-eAR
CONE
FINISHEO PRODUCT: CRUSHERRf(YCL£O AGGREGATE or
REQUIRED GRADATION

Plea
sefi
llin
the
follo
win
gT
able
.H
owev
er,
plea
sedo
not
hesi
tate
tows
ean
yot
her
form
atw
hich
}s-·
c'?!
1Ven
·iel
'itto
'fOU
..!
..,
......
......
un
i.t
IIni
t.
esti
mat
edleS:i=~:d
'...
.et•
•ho
'llm
any
typ
ean
dcap
acit
y"P
urch
asin
g,~11.ta
}-S
_Qlll
.operatin~
~.&R
u·
econ
omic
c.E
qu
ipm
en
tlJ
~_Gd
.eJi
?o
rit
s'si
ze
pric
E).n~
J:ee
k1¥.
co
st/
hr.
Ifeo
st/m
on
thli
fe***
=--:
:;---.
-';';
:-=
::-=
-.-:
.:...
.;:..
...-
1)r.
rirn
ar.v
ct"t
.whe
r,.
wit
hcn
yin
c,
/,,:
...•
'1;~•
..•I
...-.
2)S
eco
;ld
ary
cru
sher
wit
hen
crin
eI
\'.
!3
)vih
rati
r,s.
feed
er
~I
4)d
oll
blc
dec
k,
scre
en
-_.-
---_
.--.
5)c
on
vey
ors
.,
6)co
nv\?
yor
stack
er
-I
..".... C
Tt ex> I
'7)u
en
era
tor
B)l
oad
er
".
(wh
eel)
J.1
9)o
ther
maj
or
'.e!
1u
ipm
ent
\
A,
FOR
SEP
AU
ATI
NG
".:
~·S
TEEL
0
\FO
RSEPl~TING·
':!IW
OO
D~m
GY
PS
UM
i
.--
-.-
..-
...'-,
-_..
..-
_.__
.-..
....
_....
_........_
.--
....
.~
..._
..--_
.-._
_..._-
_..'..
....._
....I
•
'to
n/h
(lu
t'-
1:;~jhl'\"'I:"
-t,o
fro
mm
''''r
'
A)
load
or
op
era
tor
men
B)cr~sh~~
Ofer~tnr
~.~lease
excl
ud
ela
bo
ran
dd~prec1at1on
co
st**
M&
H=
mai
nten
ance
&:re
pari
ng
In
"fo
:·..'t
:h<:
...~~
:;'?
.u.~
~~~_
~n.?t~~pr~ciat.i.on
._
.-.,...,
.,,--,
""'=1
·"f1
.eas
&in
d1.c
ateT
-..·..·
n·-i;b;-r-reo~.i·i.rement
..1
2)
el'l
tim
nta
dp
rod
ucti
on
ra't
eon
con
ti!'
luo
ns
b:l:
::is
-.
II I I
~
•(

•
)
I'
-169-DEPARTMENT OF CIVIL ENGINEERING
MASSACHUSETTS INSTITUTE OF TECHNOLOGY
CAMBRIDGE, MASSACHUSETTS 02139
APPENDIX IV - REQUEST FOR CRITICAL REVIEW OF FINISHED DESIGN(LETTER TO EQUIPMENT PRODUCERS)
April 26, 1977
Dear Sir:
Thank you for the useful information that you have sent to us.
After spending some effort in analyzing the materials that we gathered,we finally came up with some tentative schemes for processing recycled concrete at different capacity ranges. Based on our objective, these schemeshave to be technologically feasible, efficient, and produce products thatcan achieve some of our quality standards. Also, we have to be very awareof the economic feasibility of these schemes. Re-bar and metallic materialsare the major factors affecting efficiency. We have tried to use a combination of pre-sorting at dump field, special screen, conveyor with spring adjustmentunderneath the jaw crusher, picking table and magnetic separatorto minimize the problem. With regard to the quality standards, we are mostly concerned with the gypsum on the surface of the recycled concrete pieces,and wood materials. Coarse-material washer dewaterer has been selectedafter a review of some other types of washers, scrubbers and separationtechnologies.
Diagrams of these schemes, together with the price lists of the equipment used, are enclosed with this letter. We'll appreciate it very much ifyou can review these schemes and make some comments on their 1) feasibility,2) efficiency, 3) ability to produce quality products and 4) economy. Also,weill be grateful if you can check the prices and power consumption of theequipment used so that we will not present inaccurate information. Finally,we hope you can help us in evaluating the estimates of the operating costs(i .e., fuel and lubrication costs) and maintenance and repair costs of theseschemes as presented on the last page of the enclosed materials.
Although we understand that our request may burden further your busyschedule, your suggestions and advice are valuable and indispensable in making this a fruitful study. Time is really pushing on us. It would be niceif we could hear from you at your earliest convenience.· In case you mayhave questions, please contact me at 617-253-1000, Ext. 5-9562, or leave amessage at 617-253-5336. We appreciate your help and look forward to hearing your comments in the near future.
Respectfully yours,
Herbert NgDEnclosures

•