use of catastrophe models by general insurance companies · 2017-09-28 · session 191 pd - use of...
TRANSCRIPT

Session 191 PD - Use of Catastrophe Models by General Insurance Companies
Moderator:
Anthony E. Cappelletti, FSA, FCAS, FCIA
Presenter: Alan Frith, Are, CCM, CPCU
SOA Antitrust Compliance Guidelines SOA Presentation Disclaimer

1 CONFIDENTIAL ©2017 AIR WORLDWIDE
191 L - Use of Catastrophe Models by General
Insurance Companies Alan Frith, CPCU, ARe, CEEM

2 CONFIDENTIAL ©2017 AIR WORLDWIDE
- What are cat models? - How are they structured? - What information do they provide? - How are they used by primary insurers?
Agenda

3 CONFIDENTIAL ©2017 AIR WORLDWIDE

4 CONFIDENTIAL ©2017 AIR WORLDWIDE
What is a Catastrophe Model? Mathematically represent the
characteristics of the peril
Computer programs
Inform event frequency and
severity
Industry standard practice
Quantify and price risk throughout the
industry

5 CONFIDENTIAL ©2017 AIR WORLDWIDE
Traditional methods may not be good predictors of
possible loss
The constantly changing landscape of exposure data limits the usefulness of past
loss experience

6 CONFIDENTIAL ©2017 AIR WORLDWIDE
Recent Historical Experience Informed the Baseline for What Might Happen
$- $500
$1,000 $1,500 $2,000 $2,500 $3,000 $3,500 $4,000
Historical Losses (before Andrew) Millions
Hurricane
Hugo
PCS Losses – Trended at 7%

7 CONFIDENTIAL ©2017 AIR WORLDWIDE
Historical Losses Over a Short Term Do Not Capture the Potential for Future Losses
$- $2,000 $4,000 $6,000 $8,000
$10,000 $12,000 $14,000 $16,000 $18,000
Historical Losses (after Andrew) Millions
Hurricane
Hugo
PCS Losses – Trended at 7%

8 CONFIDENTIAL ©2017 AIR WORLDWIDE
Exposure Changes

9 CONFIDENTIAL ©2017 AIR WORLDWIDE
What Questions Are Catastrophe Models Designed to Answer?
Where are future events likely to
occur?
How intense are they likely to be?
For each potential event, what is the estimated range of
damage and insured loss?
What is the probability of a given level of loss for my book in a wide range of catastrophe
scenarios?
How frequently are they likely to occur?

10 CONFIDENTIAL ©2017 AIR WORLDWIDE
AIR Catastrophe Modeling Framework

11 CONFIDENTIAL ©2017 AIR WORLDWIDE
Hazard Module: Event Generation
Where are future events
likely to occur?
How frequently are they likely to occur?
How intense are they
likely to be?

12 CONFIDENTIAL ©2017 AIR WORLDWIDE
Contains tens of thousands of potential
scenarios
Addresses uncertainty in the occurrence, location, size, and
other characteristics of the peril
Highest level of catastrophe risk
transparency

13 CONFIDENTIAL ©2017 AIR WORLDWIDE
North Atlantic Tropical Cyclone Tracks Since 1900
More than 1,000 Historical Tracks (~9 Tracks per year)
14 CONFIDENTIAL ©2017 AIR WORLDWIDE
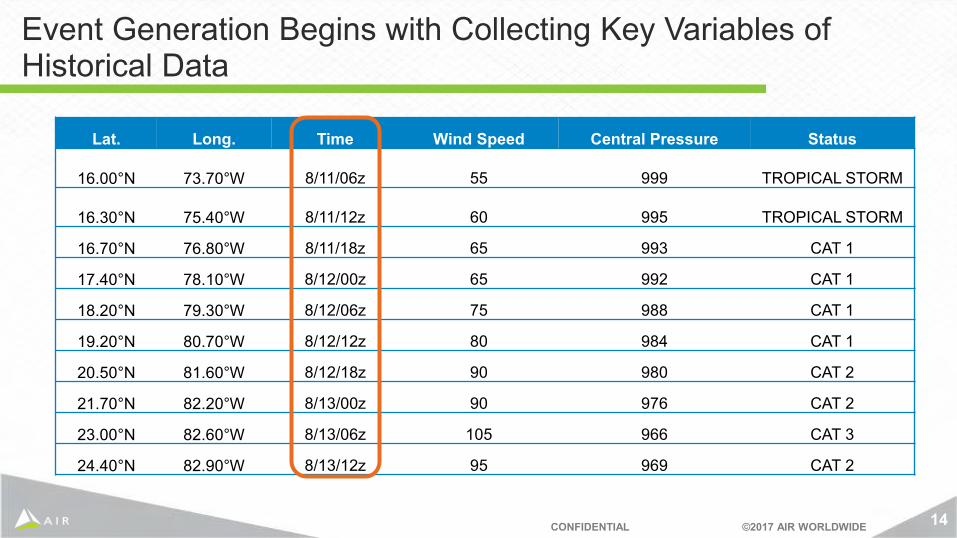
Event Generation Begins with Collecting Key Variables of Historical Data
Lat. Long. Time Wind Speed Central Pressure Status
16.00°N 73.70°W 8/11/06z 55 999 TROPICAL STORM
16.30°N 75.40°W 8/11/12z 60 995 TROPICAL STORM
16.70°N 76.80°W 8/11/18z 65 993 CAT 1
17.40°N 78.10°W 8/12/00z 65 992 CAT 1
18.20°N 79.30°W 8/12/06z 75 988 CAT 1
19.20°N 80.70°W 8/12/12z 80 984 CAT 1
20.50°N 81.60°W 8/12/18z 90 980 CAT 2
21.70°N 82.20°W 8/13/00z 90 976 CAT 2
23.00°N 82.60°W 8/13/06z 105 966 CAT 3
24.40°N 82.90°W 8/13/12z 95 969 CAT 2

15 CONFIDENTIAL ©2017 AIR WORLDWIDE
Historical Data Collection: Data Sources
Shanghai Typhoon Institute

16 CONFIDENTIAL ©2017 AIR WORLDWIDE
Stochastic Catalog: Sampling Distributions of Key Variables
Stochastic Catalog
Landfall Angle
Radius of Max. Winds
Forward Speed
Location Frequency
Min. Central Pressure
Annual Frequency

17 CONFIDENTIAL ©2017 AIR WORLDWIDE
Simple Hurricane Track Using Conditional Probability Method
Storm Track Generation: Conditional Probability Method Stochastic Catalog Includes Complex
Tracks Such as Jeanne’s (2004)

18 CONFIDENTIAL ©2017 AIR WORLDWIDE
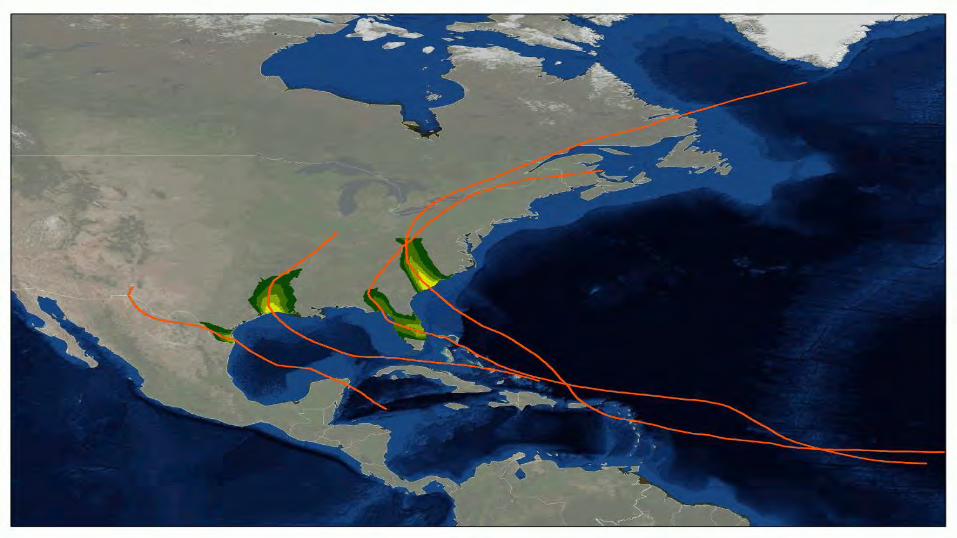
Simulate Thousands of Potential Hurricanes in the Stochastic Catalog for a Complete View of Risk

19 CONFIDENTIAL ©2017 AIR WORLDWIDE
20 CONFIDENTIAL ©2017 AIR WORLDWIDE

21 CONFIDENTIAL ©2017 AIR WORLDWIDE
Annual Frequency of U.S. Hurricane Landfalls
0.00
0.05
0.10
0.15
0.20
0.25
0.30
0 1 2 3 4 5 6 7 8+
Rel
ativ
e Fr
eque
ncy
Number of Landfalls
Modeled Historical
22 CONFIDENTIAL ©2017 AIR WORLDWIDE
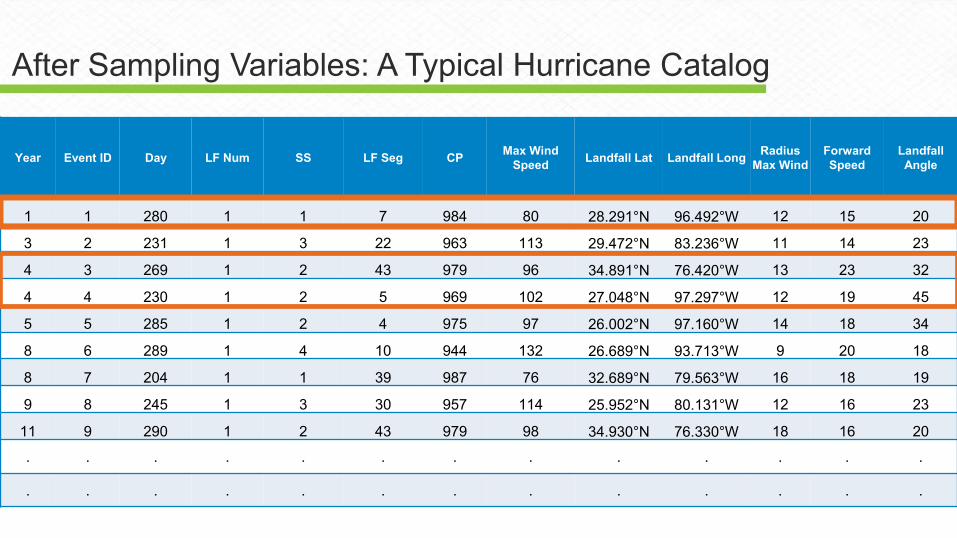
After Sampling Variables: A Typical Hurricane Catalog
Year Event ID Day LF Num SS LF Seg CP Max Wind
Speed Landfall Lat Landfall Long
Radius Max Wind
Forward Speed
Landfall Angle
1 1 280 1 1 7 984 80 28.291°N 96.492°W 12 15 20
3 2 231 1 3 22 963 113 29.472°N 83.236°W 11 14 23
4 3 269 1 2 43 979 96 34.891°N 76.420°W 13 23 32
4 4 230 1 2 5 969 102 27.048°N 97.297°W 12 19 45
5 5 285 1 2 4 975 97 26.002°N 97.160°W 14 18 34
8 6 289 1 4 10 944 132 26.689°N 93.713°W 9 20 18
8 7 204 1 1 39 987 76 32.689°N 79.563°W 16 18 19
9 8 245 1 3 30 957 114 25.952°N 80.131°W 12 16 23
11 9 290 1 2 43 979 98 34.930°N 76.330°W 18 16 20
. . . . . . . . . . . . .
. . . . . . . . . . . . .

23 CONFIDENTIAL ©2017 AIR WORLDWIDE
Typical Earthquake Catalog Year Day Hour Event ID Source ID Mw Lat Long Azimuth Depth Rupture
Length Rupture Width Dip Angle Fault Type
1 45 8 1 2780 6.380 34.015°N 118.630°W 77 5.2 7.7 11.0 75 N
3 116 7 2 2747 6.563 34.086°N 117.791°W 70 6.0 17.0 13.0 75 N
4 187 7 8 1715 6.313 34.056°N 118.759°W -87 5.3 13.7 10.9 75 N
7 198 18 11 2815 6.664 34.376°N 118.631°W -76 6.5 12.6 14.1 55 N
8 225 12 12 2863 6.920 34.544°N 119.157°W 82 6.4 25.7 13.0 80 N
8 263 21 14 2932 6.700 34.285°N 118.997°W 81 7.1 21.4 13.9 60 N
11 271 15 16 2838 6.367 34.363°N 118.629°W -76 4.9 9.5 11.7 55 N
12 289 13 18 2817 6.663 34.348°N 118.561°W -85 5.8 14.9 14.2 55 N
. . . . . . . . . . . . . .
Azimuth North
Foot Wall
Dip
Depth * Fault
slip
Azimuth
North
Foot Wall
Dip
Depth * Fault
slip
24 CONFIDENTIAL ©2017 AIR WORLDWIDE
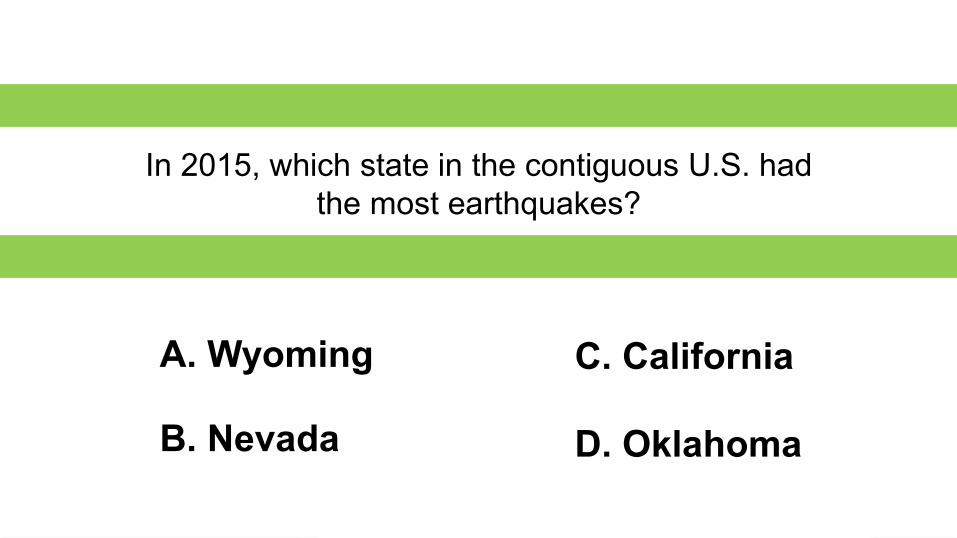
In 2015, which state in the contiguous U.S. had the most earthquakes?
A. Wyoming
B. Nevada
C. California
D. Oklahoma

25 CONFIDENTIAL ©2017 AIR WORLDWIDE
D. Oklahoma
Source: USGS

26 CONFIDENTIAL ©2017 AIR WORLDWIDE
Hazard Module: Intensity Calculation
What is the intensity of each event
at each location?
How do local
conditions affect the intensity?

27 CONFIDENTIAL ©2017 AIR WORLDWIDE
Calculating Local Intensity: Understanding the Storm Wind Field
Eye
Storm Path
Storm Center
Left Side Right Side
R max Weaker Winds
Stronger Winds
Rmax

28 CONFIDENTIAL ©2017 AIR WORLDWIDE
Creating a Simulated Wind Field: Calculating Local Wind Intensities
Function of:
Central Pressure
Peripheral pressure
Rmax
Latitude
Function of:
Rmax
Vmax
Latitude
Distance From Eye
Function of:
Roughness Length
Function of:
Forward Speed
Angle between storm direction
and wind direction
V1min,10m = 1-minute sustained wind speed at 10 m above ground level Vmax = upper level wind at Rmax GF = gust factor GWRF = gradient wind-reduction factor FwdAdj = forward speed adjustment FF = friction factor
Function of:
Distance from Eye
Peak Weighting
Factor
Wind speed formula for 1-minute sustained winds, at 10 meters above ground level:
V1-min,10 m = [Vmax * GF * GWRF * Radial Decay + FwdAdj] * FF Function of:
Roughness Length
Averaging Time

29 CONFIDENTIAL ©2017 AIR WORLDWIDE
Terrain Impacts Ground-Level Wind Speeds Vg Vg Vg
Hg (smooth)
Hg (medium)
Hg (rough)
Very Flat Terrain Suburban Terrain Urban Terrain
H = Height V = Velocity

30 CONFIDENTIAL ©2017 AIR WORLDWIDE
High-Resolution Land Use Data is Required
Commercial/Industrial
High-Intensity Residential
Low-Intensity Residential

31 CONFIDENTIAL ©2017 AIR WORLDWIDE
Local Intensity for Earthquakes: Ground Motion Prediction Equations (GMPEs)
Ground Motion Prediction Equations mathematically describe the rate of decay in ground motion with distance
log(Y) = c1 + c2 * Mw + c3 * (Mwref - Mw)2 + (c4 + c5 * Mw) * log(R) + c6 * R + site effects + faulting mechanisms + basin effects...
Source
Path Effects Site Effects
32 CONFIDENTIAL ©2017 AIR WORLDWIDE
What is the largest tropical cyclone, in diameter, on record?

33 CONFIDENTIAL ©2017 AIR WORLDWIDE
Source: NOAA
1979 Super Typhoon Tip 1,380 miles (2,220 km) in diameter

34 CONFIDENTIAL ©2017 AIR WORLDWIDE
Hazard Module: Exposure Data Input
What exposure
variables are being
modeled?

35 CONFIDENTIAL ©2017 AIR WORLDWIDE
Exposure Data Relevant for Modeling Earthquakes
Location • Where is it?
Replacement value • How much is it?
Extra Characteristics • Foundation type • Foundation connection
Characteristics • What is it made of? • What is it used for? • When was it built? • How tall is it?

36 CONFIDENTIAL ©2017 AIR WORLDWIDE
Engineering Module: Damage Estimation
What level of damage is
expected at each location given the
intensity of the peril?

37 CONFIDENTIAL ©2017 AIR WORLDWIDE
Developing Hurricane Damage Functions: Component-Based Engineering Approach
ROOF: Wood, concrete, metal GLASS PERCENTAGE: 5, 20, 50, etc. DOORS: Double, single, sliding, etc.
PRIMARY BUILDING CHARACTERISTICS OCCUPANCY: Residential, commercial, industrial CONSTRUCTION: Wood frame, masonry, steel frame, etc. HEIGHT: Low-rise, mid-rise, high-rise AGE: In relation to regional building codes
SECONDARY BUILDING CHARACTERISTICS
38 CONFIDENTIAL ©2017 AIR WORLDWIDE
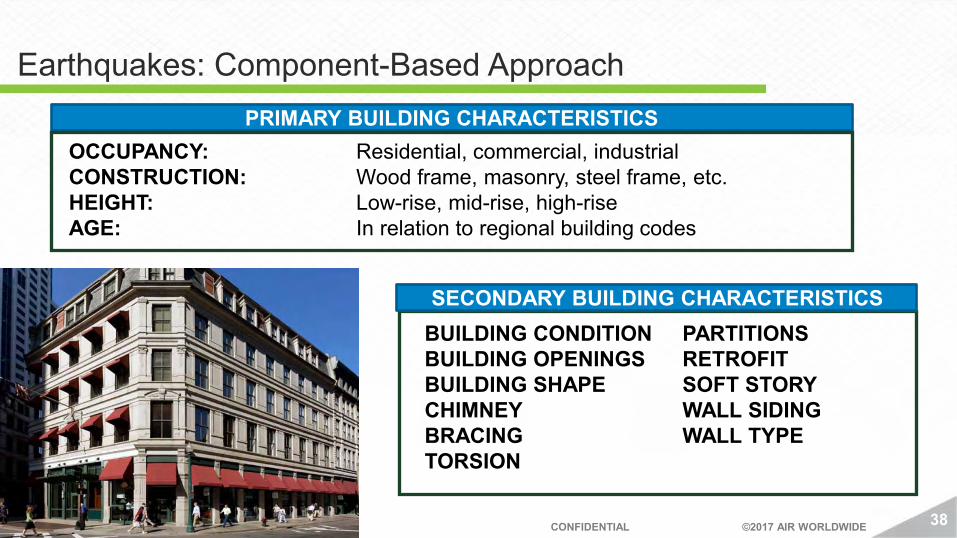
Earthquakes: Component-Based Approach PRIMARY BUILDING CHARACTERISTICS
OCCUPANCY: Residential, commercial, industrial CONSTRUCTION: Wood frame, masonry, steel frame, etc. HEIGHT: Low-rise, mid-rise, high-rise AGE: In relation to regional building codes
BUILDING CONDITION BUILDING OPENINGS BUILDING SHAPE CHIMNEY BRACING TORSION
PARTITIONS RETROFIT SOFT STORY WALL SIDING WALL TYPE
SECONDARY BUILDING CHARACTERISTICS

39 CONFIDENTIAL ©2017 AIR WORLDWIDE
Hurricane Wind Damage Function: Residential Wood Frame
Dam
age
Rat
io
Wind Speed
Roof Covering and Siding Damage
Damage to Envelope and
Cladding
Major Damage to Structural and Non-structural Elements

40 CONFIDENTIAL ©2017 AIR WORLDWIDE
Hurricane Wind Damage Function: Commercial Structure
Roof Covering Damage
Glass/Cladding Damage
Major Damage to Non-structural Elements
Dam
age
Rat
io
Wind Speed

41 CONFIDENTIAL ©2017 AIR WORLDWIDE
Earthquakes: Ground Motion Frequency and Intensity Are Important for Determining Damage
Tall structure responds to
long-period shaking
Short structure responds to short-period shaking
-1.5
-1
-0.5
0
0.5
1
1.5
0 0.3 0.6 0.9 1.2 1.5 1.8
Time
Ag
-1.5
-1
-0.5
0
0.5
1
1.5
0 1 2
Time
Ag
Two different structures subjected to the same ground shaking

42 CONFIDENTIAL ©2017 AIR WORLDWIDE
Engineering Module: Policy Conditions
What are the policy conditions in force for the
property?

43 CONFIDENTIAL ©2017 AIR WORLDWIDE
Picture of ISO policy – what are we looking for?
Agent
AIR Insurance Agency LLC 545 Washington Boulevard
Jersey City, NJ 07310
Insured Katie Ward 131 Dartmouth Street Boston, MA 02116
131 Dartmouth Street, Boston, MA 02116

44 CONFIDENTIAL ©2017 AIR WORLDWIDE
Financial Module: Insured Loss Calculation
What is the insured loss to
property, policy, or contract?

45 CONFIDENTIAL ©2017 AIR WORLDWIDE
For an Actual Event, the Insured Loss Is Easily Calculated
Replacement Value =
USD 250,000
2% Deductible = USD 5,000
Damage Ratio = 50%
Damage Amount = USD 125,000 (“Ground-up Loss”)
Insurer’s Loss After Deductible = USD 120,000 (“Gross Loss”)
For an actual event, the damage is known:

46 CONFIDENTIAL ©2017 AIR WORLDWIDE
For a simulated event, the damage is uncertain.
We need to consider all possible outcomes.
A Modeling Perspective: Uncertainty in the Loss, Given the Event
Damage Ratio Probability Ground-up Loss Gross Loss0% 0.4415 - - 2% 0.0643 5,000 - 5% 0.0607 12,500 7,500 7% 0.0561 17,500 12,500
10% 0.0510 25,000 20,000 12% 0.0457 30,000 25,000 15% 0.0405 37,500 32,500
… … … …90% 0.0002 225,000 220,000 93% 0.0002 232,500 227,500 95% 0.0001 237,500 232,500 98% 0.0001 245,000 240,000 100% 0.0006 249,975 244,975
Replacement Value = USD 250,000 2% Deductible = USD 5,000
Intensity (e.g., wind speed, ground motion)
Dam
age
Rat
io

47 CONFIDENTIAL ©2017 AIR WORLDWIDE
Developing the AIR EP Curve
Event ID Simulated Year Company Loss Event Info
111410752 9294 $25,628,808 Mw 6.9 EQ New Madrid 270012443 3699 $23,725,256 Class 5 Hurr FL NC VA SC PQ 270071140 1364 $21,812,737 Class 4 Hurr NY NJ CT PA MA 110952564 3264 $21,668,433 Mw 6.3 EQ New Madrid 270012636 3760 $21,456,324 Class 4 Hurr NY NJ CT PA MA 270029462 8794 $21,189,431 Class 5 Hurr FL LA GOM BF MS 270082612 4842 $20,943,015 Class 4 Hurr NY NJ CT MA PA 270042893 2912 $20,669,393 Class 5 Hurr FL SC NC GA BF 270072504 1794 $20,639,935 Class 4 Hurr NY NJ CT PA MA 270087106 6144 $20,569,005 Class 4 Hurr NY NJ CT MA PA 270093974 8178 $20,329,354 Class 4 Hurr NY NJ CT PA MA 270159424 7740 $20,244,536 Class 5 Hurr FL TX GOM BF LA 270112697 3828 $20,195,153 Class 4 Hurr NY NJ CT PA MA 270017212 5144 $19,906,853 Class 5 Hurr FL AL MS GOM LA 270042988 2935 $19,761,670 Class 5 Hurr FL GOM LA BF TX 270133994 121 $18,923,299 Class 4 Hurr NY NJ CT MA PA 270125384 7570 $18,568,895 Class 4 Hurr NY NJ CT PA MA 270106416 1925 $17,171,431 Class 5 Hurr FL GOM 270142249 2640 $17,148,883 Class 5 Hurr FL AL MS BF GOM 270058503 7554 $16,842,286 Class 5 Hurr FL NC SC GOM GA 270060242 8075 $16,555,698 Class 5 Hurr FL AL MS GOM LA 270006467 1895 $16,513,774 Class 4 Hurr NY NJ CT MA PA
. . . .
. . . .
Event Output Sorted Event Output Event ID Simulated Year Company
Loss Event Info
110000053 2 $153,819 Mw 6.3 EQ Los Angeles 110000061 3 $40,609 Mw 6.4 EQ San Francisco 110000078 3 $43,988 Mw 6.8 EQ San Francisco 110000153 5 $716,394 Mw 7.5 EQ Los Angeles 110000162 5 $28,271 Mw 5.1 EQ New Madrid 110000197 7 $22,876 Mw 5.9 EQ TX OK NM 110000263 9 $22,193 Mw 7.1 EQ New England 110000287 10 $49,814 Mw 5.6 EQ WA 110000497 17 $274,992 Mw 6.8 EQ San Francisco 110000507 17 $31,813 Mw 5.5 EQ SC 110000576 19 $131,771 Mw 5.7 EQ New Madrid 110000601 20 $57,694 Mw 6.1 EQ San Francisco 110000623 21 $24,305 Mw 5.6 EQ New England 110000702 23 $609,635 Mw 6.9 EQ New Madrid 110000705 23 $53,690 Mw 5.6 EQ San Francisco 110000751 25 $20,586 Mw 5.3 EQ San Francisco 110000760 25 $76,837 Mw 7.2 EQ San Francisco 110000842 28 $37,797 Mw 6.7 EQ Los Angeles 110000863 29 $535,234 Mw 6.6 EQ San Francisco 110000866 29 $36,560 Mw 7.2 EQ San Francisco 110000874 29 $25,638 Mw 5.5 EQ New England 110000922 31 $593,052 Mw 6.6 EQ Los Angeles
. . . .
. . . .
Losses (000’s) Rank EP (Rank/Catalog Size)
Return Period (Catalog Size/Rank)
$25,628,808 1 1/10,000 = .01% 10,000 $23,725,256 2 2/10,000 = .02% 5,000 $21,812,737 3 3/10,000 = .03% 3,333 $21,668,433 4 4/10,000 = .04% 2,500 $21,456,324 5 5/10,000 = .05% 2,000
. . . . $11,739,235 40 40/10,000 = .4% 250
. . . . $8,700,892 100 100/10,000 = 1.0% 100
. . . .

48 CONFIDENTIAL ©2017 AIR WORLDWIDE
Main Catastrophe Modeling Output Loss Perspectives and Definitions
– Ground Up Losses • Losses prior to the application of limits, deductibles, etc.
– Gross Losses • Losses after the application of limits and deductibles, or direct losses to the primary insurer
– Retained Loss • Losses that are paid by the insured, typically defined as [Ground Up Loss – Gross Loss]
– Net Loss • Losses to the primary insurer after the application of limits, deductibles, and reinsurance
– Expected Loss (a.k.a. Average Annual Loss) • E[L] = ΣXi / n = sum of losses from all simulated years/number of years not events.
– Standard Deviation • Summary measure of variability across entire loss distribution

49 CONFIDENTIAL ©2017 AIR WORLDWIDE
Catastrophe Models Provide a Wide Range of Loss Outputs
Exceedance Probability (EP) Curve - Occurrence
0%1%2%3%4%5%6%7%8%9%
10%
0 50 100 150 200 250 300 350 400Loss Amount ($ millions)
Exc
eed
ance
Pro
bab
ility
050
100150200250
300350
10 20 50 100 250 500 1,000Estimated Return Period
Lo
ss A
mo
un
t ($
mil
lio
ns)

50 CONFIDENTIAL ©2017 AIR WORLDWIDE
Average Annual Loss & Loss Cost

51 CONFIDENTIAL ©2017 AIR WORLDWIDE
Loss Exceedance Probability Curve
Exceedance Probability (EP) Curve - Occurrence
0%1%2%3%4%5%6%7%8%9%
10%
0 50 100 150 200 250 300 350 400Loss Amount ($ millions)
Exce
edan
ce P
roba
bilit
y
050
100150200250
300350
10 20 50 100 250 500 1,000Estimated Return Period
Loss
Am
ount
($m
illio
ns)
52 CONFIDENTIAL ©2017 AIR WORLDWIDE
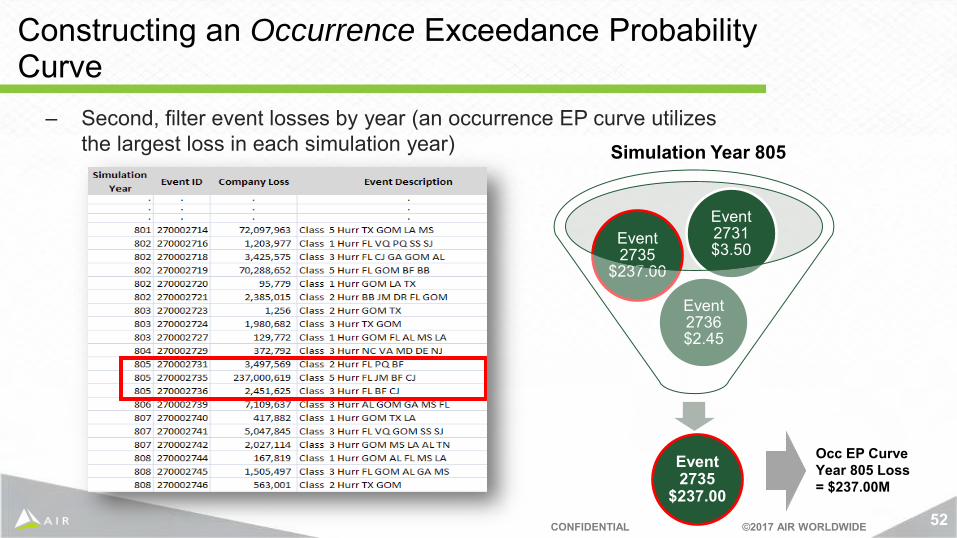
– Second, filter event losses by year (an occurrence EP curve utilizes the largest loss in each simulation year)
.
Event 2736 $2.45
Event 2735
$237.00
Event 2731 $3.50
Simulation Year 805
Occ EP Curve Year 805 Loss = $237.00M
Constructing an Occurrence Exceedance Probability Curve
Event 2735
$237.00

53 CONFIDENTIAL ©2017 AIR WORLDWIDE
- For an aggregate EP curve, the second step requires you sum event losses by year
Constructing an Aggregate Exceedance Probability Curve
.
Event 2736 $2.45
Event 2735
$237.00
Event 2731 $3.50
Simulation Year 805
Agg EP Curve Year 805 Loss = $242.95M
Sum $242.95M

54 CONFIDENTIAL ©2017 AIR WORLDWIDE
Assess Your Risk in the Exceedance Probability Curve
0.0%
0.2%
0.4%
0.6%
0.8%
1.0%
1.2%
- 50 100 150 200 250 300 350Loss
Exc
eeda
nce
Prob
abili
ty
Losses (USD billions)
Tail value at risk (TVaR): average of all simulated event losses at and beyond specified probability, such as 1.0% or 0.4%
TVaR is a standard output of Touchstone® and CATRADER®
55 CONFIDENTIAL ©2017 AIR WORLDWIDE
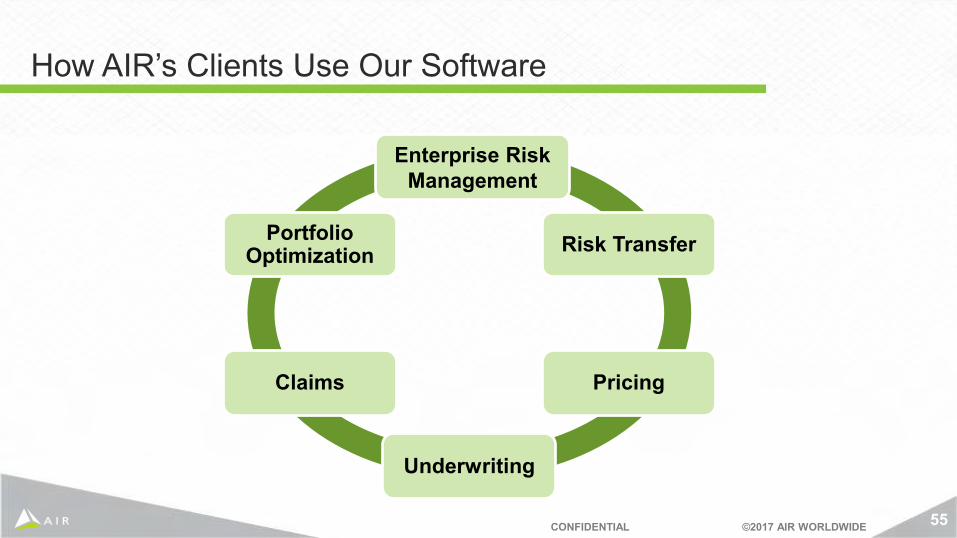
How AIR’s Clients Use Our Software
Enterprise Risk Management
Risk Transfer
Pricing
Underwriting
Claims
Portfolio Optimization

56 CONFIDENTIAL ©2017 AIR WORLDWIDE
Risk Transfer & Enterprise Risk Management
Evaluate Reinsurance
Purchase
Communicate With Ratings
Agencies
Manage Impact on Surplus
Streamline Communication
w/ Intermediaries
Accumulation Management

57 CONFIDENTIAL ©2017 AIR WORLDWIDE
- Eliminate volatility in loss costs
- Appropriately allocate cost of reinsurance or capital
- Account for exposure changes
Pricing Existing Portfolio

58 CONFIDENTIAL ©2017 AIR WORLDWIDE
- Exposure classes that aren’t in the existing portfolio
- Evaluate relativities with no bias • Construction • Occupancy • Deductibles/Limits • Mitigation
Pricing w/ Notional Portfolios

59 CONFIDENTIAL ©2017 AIR WORLDWIDE
- Distance to Coast • (Wind)
- Flood Zone
• (Flood)
- Elevation • (Wind & Flood)
- Soil Type
• (Earthquake)
Underwriting – Hazard Metrics
60 CONFIDENTIAL ©2017 AIR WORLDWIDE
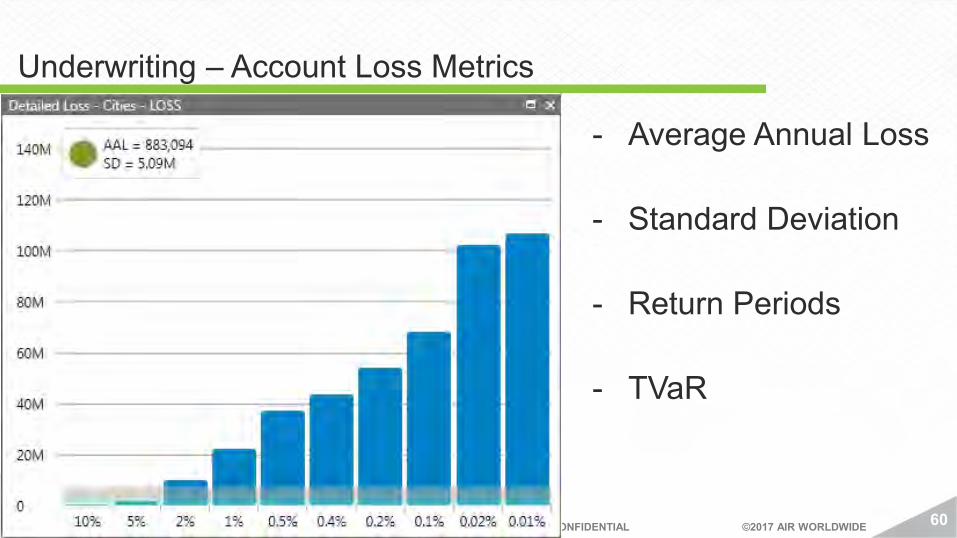
- Average Annual Loss
- Standard Deviation
- Return Periods
- TVaR
Underwriting – Account Loss Metrics

61 CONFIDENTIAL ©2017 AIR WORLDWIDE
- Return Periods - TVaR - Window VaR
Underwriting – Marginal Impact on Portfolio

62 CONFIDENTIAL ©2017 AIR WORLDWIDE
- Advance planning - Resource deployment - Post-event communications
Claims

63 CONFIDENTIAL ©2017 AIR WORLDWIDE
- Identify areas to grow or retract
- Understand and manage the drivers of catastrophe risk
Portfolio Optimization

64 CONFIDENTIAL ©2017 AIR WORLDWIDE
Questions?