use of artificial genomes in assessing methods for ... · indirect evidence, ... there are two...
TRANSCRIPT

Use of Artificial Genomes in AssessingMethods for Atypical Gene DetectionRajeev K. Azad, Jeffrey G. Lawrence
*
Department of Biological Sciences, University of Pittsburgh, Pittsburgh, Pennsylvania, United States of America
Parametric methods for identifying laterally transferred genes exploit the directional mutational biases unique to eachgenome. Yet the development of new, more robust methods—as well as the evaluation and proper implementation ofexisting methods—relies on an arbitrary assessment of performance using real genomes, where the evolutionaryhistories of genes are not known. We have used the framework of a generalized hidden Markov model to createartificial genomes modeled after genuine genomes. To model a genome, ‘‘core’’ genes—those displaying patterns ofmutational biases shared among large numbers of genes—are identified by a novel gene clustering approach based onthe Akaike information criterion. Gene models derived from multiple ‘‘core’’ gene clusters are used to generate anartificial genome that models the properties of a genuine genome. Chimeric artificial genomes—representing thosehaving experienced lateral gene transfer—were created by combining genes from multiple artificial genomes, and theperformance of the parametric methods for identifying ‘‘atypical’’ genes was assessed directly. We found that a hiddenMarkov model that included multiple gene models, each trained on sets of genes representing the range of genotypicvariability within a genome, could produce artificial genomes that mimicked the properties of genuine genomes.Moreover, different methods for detecting foreign genes performed differently—i.e., they had different sets ofstrengths and weaknesses—when identifying atypical genes within chimeric artificial genomes.
Citation: Azad RK, Lawrence JG (2005) Use of artificial genomes in assessing methods for atypical gene detection. PLoS Comput Biol 1(6): e56.
Introduction
With the number of genome sequences accumulating at arapid pace, evidence for rampant lateral gene transfer amongprokaryotes has increased dramatically [1�4]. Significantadvances have been made in understanding this evolutionaryphenomenon, and current research is aimed at understand-ing the impact of gene transfer rather than at demonstratingits occurrence [5�8]. Although inferences regarding the scopeand impact of lateral gene transfer rely on the accurate andconsistent identification of putative foreign genes, methodsfor objective, robust quantification of the lateral genetransfer have been difficult to devise. Unlike gene identi-fication, where experimental validation of predictions ispossible, it is difficult to ascertain the evolutionary history ofa gene. In addition, there has been no platform available totest the efficacy and performance of methods for theidentification of foreign genes. As a result, classification ofgenes as native or laterally transferred uses various sets ofindirect evidence, and the scope and objectivity of eachapproach are debatable [9�13].
There are two primary strategies used to detect genesintroduced by lateral gene transfer: parametric methods andphylogenetic approaches [3,14]. Phylogenetic methods detectputatively transferred genes by virtue of an unduly largedegree of similarity among genes found in otherwiseunrelated taxa and/or by the absence of orthologs in closelyrelated taxa. The efficiency and reliability of this approachthus have a dependence on the depth and breadth of thesequence database and often rely on interpretation ofdiscrepancies in relationships reflected by phylogenetic trees,themselves imperfect summaries of sets of relationships [15].In contrast, parametric methods use the genome sequence ofan organism to detect the genes that are atypical relative tothe majority of genes in the genome; commonly used
discriminant criteria include single nucleotide composition(SNC), dinucleotide composition (DNC), and codon usagebias (CUB).While these two approaches are often used in concert to
estimate the amount of genetic material transferred into agenome [3,14], parametric approaches are often invoked toassess whether particular genes may have been recentlyacquired because these analyses use only the informationcontained within the target genome and therefore do notrequire sister taxa for comparison. In addition, the resultsoften appear to be more readily interpreted. Yet the efficacyof parametric methods lies in their ability to discriminatebetween typical and atypical genes, and to date no objectivecriteria have been offered to measure the robustness ofparametric methods. This is due in part to the lack ofgenomes wherein the evolutionary histories of all genes areknown with certainty.As a result, critical issues remain relating to the discordant
sets of atypical genes found by different methods for anyspecies [9,10]. Both Ragan [9] and Lawrence and Ochman [14]speculated that different methods test different null hypoth-eses, thus leading to nonconvergent results. Moreover, each
Received June 29, 2005; Accepted September 29, 2005; Published November 11,2005DOI: 10.1371/journal.pcbi.0010056
Copyright: � 2005 Azad and Lawrence. This is an open-access article distributedunder the terms of the Creative Commons Attribution License, which permitsunrestricted use, distribution, and reproduction in any medium, provided theoriginal author and source are credited.
Abbreviations: AIC, Akaike information criterion; CUB, codon usage bias; DNC,dinucleotide composition; HMM, hidden Markov model; K-L, Kullback-Leibler; SNC,single nucleotide composition
Editor: Mark Borodovsky, Georgia Institute of Technology, United States of America
* To whom correspondence should be addressed. E-mail: [email protected]
PLoS Computational Biology | www.ploscompbiol.org November 2005 | Volume 1 | Issue 6 | e560461

parametric method will necessarily balance the two types ofclassification error (failure to identify some foreign genes dueto their similarity to native genes and misclassification ofnative genes as foreign due to some unusual character). Thiswill lead to incongruent sets of putatively foreign genes beingidentified due to dissimilar thresholds for detection.Although these drawbacks could be alleviated by employingmultiple identification methods and standardizing theirclassification error rates, the biases and error rates of mostmethods are not known.
Here we develop an approach to assess the abilities ofparametric methods to detect atypical genes, therebysuggesting routes for establishing a unified approach for theidentification of laterally transferred genes using multiple,complementary parametric approaches. To this end, we havedeveloped a method for the creation of artificial, chimericgenomes using a generalized hidden Markov model (HMM)[16�19].These artificial genomes reproduce the criticalstatistical properties of genuine genome sequences andtherefore serve as valid test beds for evaluating both newand existing methods for the detection of laterally trans-ferred genes. First, the genes composing the core of agenome—i.e., those genes likely not to have been introducedby lateral gene transfer and thus representing the spectrumof mutational signatures native to that genome—wereobtained by using a novel gene clustering algorithm basedon the Akaike information criterion (AIC) [20,21]; core geneswere classified as ‘‘typical’’ by virtue of their nucleotidecompositions, DNCs, and CUB patterns. Second, native geneswere grouped using a k-means clustering algorithm that usedrelative entropy as a distance measure to decide theconvergence of the algorithm [22]. Third, multiple genemodels were derived according to these groups, so thatartificial genomes could be generated by a generalized HMMusing these gene models to represent the variability foundamong genuine ‘‘core’’ genes.
A set of artificial genomes modeled after genuine bacterialgenomes was obtained. Chimeric genomes were generated asthe mosaic collection of genes sampled randomly fromdifferent artificial genomes. Therefore, in these genomes,
the evolutionary histories of genes as ‘‘native’’ or ‘‘trans-ferred’’ were known with certainty. Using these artificialchimeric genomes, we tested the performance of severalexisting parametric methods for the detection of putativeforeign genes, as well as novel methods for atypical geneidentification based on the AIC. We discuss a framework forintegrating multiple approaches, thereby allowing for morerobust identification of foreign genes.
Results
Generating Artificial Genome SequencesAn artificial genome generator was constructed that
produced protein-coding sequences and intergenic sequencesusing Markov models trained on genuine bacterial genomesequences. Protein-coding sequences were created by multi-ple, fifth-order, inhomogeneous Markov models; noncodingsequences were created by a homogeneous Markov model ofnoncoding sequence accounting for hexamer statistics.Separate models were derived for genes on leading andlagging strands. Structural RNAs, promoters, transcriptionterminators, and other features not commonly used in theidentification of foreign genes were not included in genomemodels. The distributions of lengths of both coding andnoncoding regions corresponded to those of the genomebeing modeled.All gene sequences in a bacterial genome cannot be
accurately described by a single model; the probabilisticnature of the HMM would necessarily result in artificialgenomes that failed to represent the variability among genesequences seen in genuine genomes. For example, thegenuine Escherichia coli genome contains far more variablegenes than are contained in an artificial genome created witha single model accounting only for variability between genesencoded on the two DNA strands (Figure 1A and 1B). The
Figure 1. Variability within Genuine and Artificial E. coli Genomes
Created with Variable Numbers of Gene Models
The variability of percent GC at third-codon positions of genes is shownwithin the genuine E. coli genome (A), as well as artificial genomescreated using one (B), three (C), and nine (D) gene models. Genes wereclustered according to frame-specific DNC; l and r represent the meanand standard deviation of the distribution. For comparison betweengraphs, colors demarcate corresponding ranges of GC content.DOI: 10.1371/journal.pcbi.0010056.g001
PLoS Computational Biology | www.ploscompbiol.org November 2005 | Volume 1 | Issue 6 | e560462
Synopsis
Bacterial genomes contain genes that come from two sources;although most genes are inherited directly from parent cells at celldivision, others may come into the genome from an unrelatedorganism. Often, these foreign genes can be detected because theirsequences have compositional properties that differ from those ofother genes in the genome. Methods for detecting atypical genesare difficult to assess because there are no genuine genomeswherein the histories of all genes are known. Here, the authorsdescribe a method for creating artificial genomes that mimic theproperties of genuine genomes, including containing ‘‘foreign’’genes. The researchers used these constructs (a) to evaluate existingmethods for finding foreign genes based on their atypical propertiesand (b) to test a new method for finding atypical genes. Theresearchers found that existing methods differ in their abilities todetect genes from different sources and that combining differentmethods can improve overall performance. The new method forfinding atypical genes—which also identified sets of genes thatshare their unusual properties—worked very well in identifyingpotentially foreign genes in artificial, chimeric genomes.
Construction and Use of Artificial Genomes
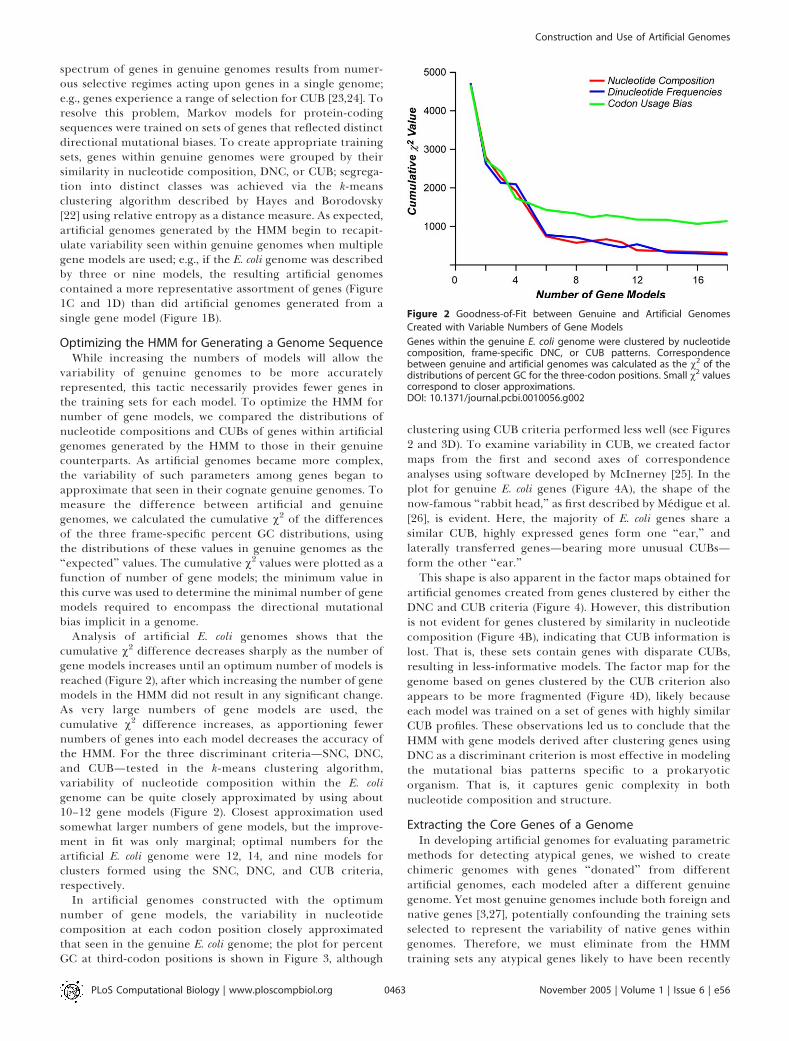
spectrum of genes in genuine genomes results from numer-ous selective regimes acting upon genes in a single genome;e.g., genes experience a range of selection for CUB [23,24]. Toresolve this problem, Markov models for protein-codingsequences were trained on sets of genes that reflected distinctdirectional mutational biases. To create appropriate trainingsets, genes within genuine genomes were grouped by theirsimilarity in nucleotide composition, DNC, or CUB; segrega-tion into distinct classes was achieved via the k-meansclustering algorithm described by Hayes and Borodovsky[22] using relative entropy as a distance measure. As expected,artificial genomes generated by the HMM begin to recapit-ulate variability seen within genuine genomes when multiplegene models are used; e.g., if the E. coli genome was describedby three or nine models, the resulting artificial genomescontained a more representative assortment of genes (Figure1C and 1D) than did artificial genomes generated from asingle gene model (Figure 1B).
Optimizing the HMM for Generating a Genome SequenceWhile increasing the numbers of models will allow the
variability of genuine genomes to be more accuratelyrepresented, this tactic necessarily provides fewer genes inthe training sets for each model. To optimize the HMM fornumber of gene models, we compared the distributions ofnucleotide compositions and CUBs of genes within artificialgenomes generated by the HMM to those in their genuinecounterparts. As artificial genomes became more complex,the variability of such parameters among genes began toapproximate that seen in their cognate genuine genomes. Tomeasure the difference between artificial and genuinegenomes, we calculated the cumulative v2 of the differencesof the three frame-specific percent GC distributions, usingthe distributions of these values in genuine genomes as the‘‘expected’’ values. The cumulative v2 values were plotted as afunction of number of gene models; the minimum value inthis curve was used to determine the minimal number of genemodels required to encompass the directional mutationalbias implicit in a genome.
Analysis of artificial E. coli genomes shows that thecumulative v2 difference decreases sharply as the number ofgene models increases until an optimum number of models isreached (Figure 2), after which increasing the number of genemodels in the HMM did not result in any significant change.As very large numbers of gene models are used, thecumulative v2 difference increases, as apportioning fewernumbers of genes into each model decreases the accuracy ofthe HMM. For the three discriminant criteria—SNC, DNC,and CUB—tested in the k-means clustering algorithm,variability of nucleotide composition within the E. coligenome can be quite closely approximated by using about10–12 gene models (Figure 2). Closest approximation usedsomewhat larger numbers of gene models, but the improve-ment in fit was only marginal; optimal numbers for theartificial E. coli genome were 12, 14, and nine models forclusters formed using the SNC, DNC, and CUB criteria,respectively.
In artificial genomes constructed with the optimumnumber of gene models, the variability in nucleotidecomposition at each codon position closely approximatedthat seen in the genuine E. coli genome; the plot for percentGC at third-codon positions is shown in Figure 3, although
clustering using CUB criteria performed less well (see Figures2 and 3D). To examine variability in CUB, we created factormaps from the first and second axes of correspondenceanalyses using software developed by McInerney [25]. In theplot for genuine E. coli genes (Figure 4A), the shape of thenow-famous ‘‘rabbit head,’’ as first described by Medigue et al.[26], is evident. Here, the majority of E. coli genes share asimilar CUB, highly expressed genes form one ‘‘ear,’’ andlaterally transferred genes—bearing more unusual CUBs—form the other ‘‘ear.’’This shape is also apparent in the factor maps obtained for
artificial genomes created from genes clustered by either theDNC and CUB criteria (Figure 4). However, this distributionis not evident for genes clustered by similarity in nucleotidecomposition (Figure 4B), indicating that CUB information islost. That is, these sets contain genes with disparate CUBs,resulting in less-informative models. The factor map for thegenome based on genes clustered by the CUB criterion alsoappears to be more fragmented (Figure 4D), likely becauseeach model was trained on a set of genes with highly similarCUB profiles. These observations led us to conclude that theHMM with gene models derived after clustering genes usingDNC as a discriminant criterion is most effective in modelingthe mutational bias patterns specific to a prokaryoticorganism. That is, it captures genic complexity in bothnucleotide composition and structure.
Extracting the Core Genes of a GenomeIn developing artificial genomes for evaluating parametric
methods for detecting atypical genes, we wished to createchimeric genomes with genes ‘‘donated’’ from differentartificial genomes, each modeled after a different genuinegenome. Yet most genuine genomes include both foreign andnative genes [3,27], potentially confounding the training setsselected to represent the variability of native genes withingenomes. Therefore, we must eliminate from the HMMtraining sets any atypical genes likely to have been recently
Figure 2 Goodness-of-Fit between Genuine and Artificial Genomes
Created with Variable Numbers of Gene Models
Genes within the genuine E. coli genome were clustered by nucleotidecomposition, frame-specific DNC, or CUB patterns. Correspondencebetween genuine and artificial genomes was calculated as the v2 of thedistributions of percent GC for the three-codon positions. Small v2 valuescorrespond to closer approximations.DOI: 10.1371/journal.pcbi.0010056.g002
PLoS Computational Biology | www.ploscompbiol.org November 2005 | Volume 1 | Issue 6 | e560463
Construction and Use of Artificial Genomes

introduced through lateral gene transfer. While the numberof vertically inherited genes decreases as one compares genesthat are more distantly related [27], the majority of genes inbacterial genomes have been resident there for sufficienttime to acquire similar sequence characteristics [28�30]. Thatis, robust models representing the spectrum of native genicvariation within a genome can be created if the most atypicalgenes are first excluded.
We identified genes likely corresponding to the native,vertically inherited ‘‘core’’ genome using a parametricclustering method based on the AIC (see Materials andMethods). As expected, the number of genes in the coregenome depended on the criteria used to cluster them. Forexample, by applying the AIC gene clustering algorithm to aset of 4,255 E. coli protein-coding genes, 3,026, 2,643, and3,031 genes were identified as native genes when using frame-specific single nucleotide bias, frame-specific dinucleotidebias, and CUB as discriminant criteria, respectively. Here wechose the set of 2,141 genes identified by all three criteria,representing the high-confidence set of core genes; this AIC-generated core was used for subsequent analyses.
Correspondence analysis of the core E. coli genome, similarto that shown in Figure 4, shows that the ‘‘ears’’ of the rabbithead—representing both atypical genes and highly expressednative genes—have disappeared (Figure S1). The removal ofvery highly expressed genes from the E. coli core genome isneither unexpected nor unwanted. Because highly conservedgenes are both transferred less frequently [8] and morereadily identifiable as ‘‘native’’ due to their readily identifiedfunctions, refining parametric methods to detect them isunnecessary. Therefore, the core genome represents aframework against which all atypical genes can be detected.
Aside from their sequence properties, the identities ofgenes included and excluded from the E. coli core followpredictable patterns. As expected, genes for ‘‘housekeeping’’metabolism—those directing amino acid biosynthesis andcentral metabolism—were included in the core genome.Three classes of genes were noted to be excluded. First,mobile genetic elements (transposons and genes withinprophages) were excluded, likely because of their unusualCUB. Second, other genes of known foreign origin, identifiedthrough either parametric analysis [31] or phylogeneticanalysis [13], were also excluded (e.g., genes of the phn, rhs,hsd, rfb, and lac operons). Third, highly expressed genes—e.g.,those encoding ribosomal proteins and elongation factors—were also excluded, as predicted from the correspondenceanalysis. Overall, the number of genes in the core genome iscomparable to the number of protein-coding genes sharedbetween E. coli and its sister taxon, Salmonella, that are greaterthan 300 nucleotides in length. These data indicate that thisapproach does provide a reasonable collection of genes thatwould reflect the major portion of the spectrum of nativemutational biases. More important, it is against this varia-bility that atypical genes must be detected; therefore, thesegenes represent ideal candidates for the construction ofartificial genomes.
Generating Artificial Core Genomes and ChimericGenomesThe core genes of a bacterial genome were obtained as
described above and were segregated into distinct classes bythe k-means gene clustering algorithm using frame-specificDNC as the discriminant criterion. Given the performance ofthe HMM in representing the variability within completegenomes, we expected even better performance when themost atypical genes were excluded from the training sets. Thenumber of gene models was selected using the optimizationtechnique described above. The gene models derived fromthese clusters were used in the HMM to generate artificialcore genomes reflecting the characteristics of the cognategenuine core genomes; the number of genes created by eachgene model was proportional to the number of genes in itstraining set. As was the case when entire genomes were beingmodeled, parametric properties such as the frame-specificnucleotide composition (Figure S2) and CUB (see Figure S1)of genes in the artificial core genome reflect those of thegenuine core genome being modeled. The variability of geneswithin the artificial core genome—reflecting the range of thatseen in genuine core genomes—again justifies the use ofHMM with multiple gene models.To create artificial genomes that have experienced simu-
lated lateral gene transfer events, the core genomes of severalprokaryotic organisms were modeled by the genome gen-erator; for each core genome, the optimum number of genemodels was used. Chimeric genomes were then generated asmosaics of genes taken randomly from several syntheticgenomes in predefined proportions. In this way, artificialgenomes can be created with varying proportions of foreigngenes from a large number of sources. More important, thehistory of genes in these artificial genomes—i.e., whethergenes are ‘‘native’’ or ‘‘foreign’’—is known with absolutecertainty. Because each core genome is described by multiplegene models, several hundred gene models may be used tocreate even the most simplistic chimeric genome, thereby
Figure 3. Variability within Genuine and Artificial E. coli Genomes Using
Different Sets of Gene Models
The distribution of percent GC of the third-codon positions of geneswithin the genuine E. coli genome (A), as well as artificial E. coli genomegenerated from E. coli genes clustered by SNC (B), DNC (C), or CUB (D).Artificial genomes were constructed using the optimal number of genemodels (see Figure 2); l and r represent the mean and standarddeviation of the distribution. For comparison between graphs, colorsdemarcate corresponding ranges of GC content.DOI: 10.1371/journal.pcbi.0010056.g003
PLoS Computational Biology | www.ploscompbiol.org November 2005 | Volume 1 | Issue 6 | e560464
Construction and Use of Artificial Genomes

providing the high degree of variability among genesobserved in genuine genomes.
Evaluating Parametric Methods for Detecting AtypicalGenes
Numerous chimeric genomes were generated and analyzedby the parametric methods to detect atypical genes (seeMaterials and Methods). We present here the results fromanalyses of mosaic artificial genomes containing 4,000 genes,with the majority (85%) generated from the E. coli core genemodels. The ‘‘foreign’’ genes were modeled after coregenomes derived from Archaeoglobus fulgidus (1%), Bacillussubtilis (1%), Deinococcus radiodurans (2%), Haemophilus influen-zae Rd (2%), Methanococcus jannaschii (1%), Neisseria gonorrhoeae(1%), Ralstonia solanacearum (2%), Sinorhizobium meliloti (2%),Synechocystis PCC6803 (1%), and Thermotoga maritima (2%). Weimplemented several methods to identify atypical genes; inthis case, the artificial E. coli core—contributing 85% of thegenome—was considered to be the recipient genome, and theten other artificial genomes were considered to be donors forsimulated lateral gene transfer events. To evaluate theperformance of each method, two error rates were consid-ered. Type I error (false negative) was calculated as 100 –sensitivity, where sensitivity is the percentage of foreign genescorrectly identified as foreign. Type II error (false positive)was calculated as 100 – specificity, where specificity is thepercentage of predicted foreign genes that were actualforeign, i.e., created by a model trained on non�E. coli genes.
As expected, there was a tradeoff between type I and type II
errors, i.e., as methods became more sensitive in detectingforeign genes (lower type I error), they were also less specificand misclassified more native genes as putatively foreign(higher type II error). As an example, Figure 5A shows theresults for Karlin’s dinucleotide method [32], where thethreshold parameter determines which genes are consideredsufficiently atypical to be deemed foreign. This tradeoff isseen for all methods examined (Figure 5B). As expected, moreconservative thresholds result in lower type II error andhigher type I error. The use of artificial genomes enablesusers of these algorithms to evaluate the stringency of theirthreshold criteria prior to application of these methods ongenuine genome sequences. Alternatively, one could use thedifferential performance of the method to assign confidencevalues to atypical gene assignments, i.e., genes declared‘‘foreign’’ at low threshold values would have higherconfidence than those declared foreign at high thresholdvalues, where type II error was greater. To compare theperformance of different methods, we established optimalthreshold criteria that minimized the average error rate(Figure 5A).The performances of several methods for identifying
foreign genes—each using threshold criteria that minimizedtheir mean error rate—are compared in Table 1. Severalresults are notable. First, it is clear that the efficiency ofdetecting foreign genes depends on the source of the gene.For example, Karlin’s codon usage method performed well inidentifying genes from A. fulgidus, R. solanacearum, and M.jannaschii but comparatively poorly in identifying genes
Figure 4. Correspondence Analysis of CUB
The first axes—indicating variability in usage among 59 synonymous codons—are plotted for genuine E. coli genes (A) and genes from artificialgenomes (see Figure 2) created from gene models sampling groups of genes clustered by SNC (B), DNC (C), or CUB (D) criteria.DOI: 10.1371/journal.pcbi.0010056.g004
PLoS Computational Biology | www.ploscompbiol.org November 2005 | Volume 1 | Issue 6 | e560465
Construction and Use of Artificial Genomes

donated from B. subtilis, N. gonorrhoeae, or SynechocystisPCC6803 (Table 1). Second, sets of foreign genes detectedwell by some parametric methods were not detected as well byothers. For example, Karlin’s dinucleotide method did well inidentifying foreign genes introduced from SynechocystisPCC6803 but not from D. radiodurans; Karlin’s CUB methodhad the opposite tendency, performing poorly in identifyingforeign genes from Synechocystis PCC6803 and doing fairly wellwith those from D. radiodurans. Third, it is clear that—at leastin identifying genes from this test set—some methods aremore robust than others; the average error rates showedsubstantial variation. Some methods minimized both type Iand type II errors (visualized on Figure 5B as curves thatapproach the intersection of the axes) better than others. As apoint of comparison, identifying foreign genes solely on thebasis of atypical nucleotide composition can show very lowtype II error (indicating that few suspected foreign genes areactually native) but very high type I error (indicating thatmany foreign genes were not identified).
The k-Means Clustering Algorithm Fails to Identify Genesfrom Variable SourcesThe k-means clustering algorithm has been implemented
on genuine genomes to group genes into either two or threeclusters, where one cluster is labeled as foreign [22]. Whenapplied to chimeric artificial genomes, this method producedhigh values of both types of error for k¼2 (two clusters, Table1). This result is not unexpected, because not all atypicalgenes are alike and would not be segregated into a singlecluster. For k ¼ 3, one of the three clusters containedpredominantly (.95%) native genes and one cluster con-tained predominantly (.95%) foreign genes. The thirdcluster typically contained approximately 60% native genes,and assignment of this third gene cluster as either native orforeign would produce either a high type I or high type IIerror.If the weakness of the k-means method lay in the high
variability of foreign genes in artificial genomes, thenreducing the complexity of the artificial genome shouldimprove the performance of this method. Therefore, weconstructed another set of artificial genomes with 75% E.coli�derived genes and the remaining genes from five otherartificial genomes (modeled after A. fulgidus, M. jannaschii, B.subtilis, R. solanacearum, and H. influenzae, at 3%–6% abun-dance per genome). Using these less-complex genomes, the k-means clustering algorithm performed better, and the meanerror of 13.0% compared favorably with the error rates ofother methods (Table 2). In addition, while Hayes andBorodovsky [22] initiated their analyses using cluster seedsderived from the GenMark algorithm, we found that randomcluster seeds were equally effective (Table 2). When theproportion of E. coli genes was increased to 85%, type II errorremained the same and type I error increased slightly to24.5% (data not shown). We conclude that when foreigngenes are less diverse, the k-means method performs better.Similar improvements were not observed for other methods(Table 2), and the AIC-based approaches remained the mostrobust.
Using the AIC to Identify Atypical GenesWe used artificial genomes as a platform to test the
implementation of a novel method for detecting foreigngenes using the AIC [20]. Here, genes within chimeric,artificial genomes were clustered using either nucleotidecomposition, DNC, or CUB as the discriminant criterion (seeMaterials and Methods). Initially, genes were assigned toindividual gene clusters (i.e., clusters containing a singlegene). The pairwise distances between clusters were assessedusing the AIC, and the closest clusters were merged if DAICwas negative, i.e., if the N – 1 cluster model better describedthe data than did the N cluster model. This process wasrepeated until cluster merger was no longer significant (seeMaterials and Methods).The largest cluster was inferred to contain ‘‘native’’ genes,
because native genes would be the most numerous genes in agenome; smaller clusters were inferred to contain foreigngenes that failed to be merged with the primary clusterbecause of their atypical sequence features. This approach ofassigning a single native gene cluster worked well for theanalysis of artificial genomes, where unusual native geneshave been excluded from the ‘‘core’’ genomes (see Figure S1).When applied to genuine genomes, additional clusters
Figure 5. Tradeoffs in Error Rates in Methods for Detecting Atypical
Genes
(A) Type I error, type II error, and mean error for predicting foreign genesaccording to Karlin’s DNC method [32]; the dashed line indicates theminimum mean error.(B) Tradeoffs in error rates for several methods of gene detection.DOI: 10.1371/journal.pcbi.0010056.g005
PLoS Computational Biology | www.ploscompbiol.org November 2005 | Volume 1 | Issue 6 | e560466
Construction and Use of Artificial Genomes

containing highly expressed genes would also be denotednative; this assignment should not be problematic orcontentious, because the ancestry of these genes is rarely indoubt [33].
Two features of the AIC-based approach are salient. First,the number of clusters arrived upon by this method is notpredetermined, as it is with the k-means algorithm [22].Because the numbers and features of foreign genes cannot bepredicted, the AIC-based clustering method avoids arbitraryassignment of genes into clusters. Second, clusters maycontain a single gene if they were never merged with othergene clusters. In this way, foreign genes that are not similar to
other genes are still identified as foreign. That is, the AICclustering method does not derive a description of foreigngenes and cluster them together; rather, typical genes areidentified and grouped together, and foreign genes are thosethat do not fall into the cluster of native genes. Third, foreigngenes that have similarity with each other are clustered, whichserves as a form of validation. That is, groups of genes withsuspected common foreign origin—e.g., the E. coli phn operon[34] or the Salmonella cob operon [35]—should fall into thesame cluster.The error rates produced by the new AIC-based gene
clustering methods show that they perform very well,
Table 1. Error Rates of Parametric Methods for Detecting Atypical Genes in an Artificial E. coli Genome
Parameter Method for Classifying Native or Foreign Genes
Karlin’s Dinucleotidea Karlin’s Codon Usageb k-Meansc AIC Nucleotided AIC Dinucleotidee AIC Codonf
Artificial gene donorg
A. fulgidus 0.1 6 0.5 1.5 6 1.7 1.6 6 3.5 21.8 6 13.5 5.4 6 20.8 2.3 6 2.2
B. subtilis 43.2 6 9.0 74.5 6 5.8 20.8 6 39.6 55.6 6 15.3 72.3 6 13.6 81.0 6 11.6
D. radiodurans 32.0 6 4.3 9.7 6 2.5 80.0 6 40.0 3.5 6 2.7 2.4 6 2.9 3.2 6 2.3
H. influenzae 51.8 6 4.6 3.6 6 2.2 20.1 6 40.0 2.5 6 2.7 1.5 6 1.3 1.8 6 1.6
M. jannaschii 0.0 6 0.0 0.0 6 0.0 20.0 6 40.0 0.1 6 0.4 0.0 6 0.0 0.7 6 1.1
N. gonorrhoeae 21.0 6 7.5 61.2 6 7.8 78.5 6 16.1 45.4 6 14.0 68.9 6 28.5 71.6 6 21.2
R. solanacearum 16.5 6 4.2 4.8 6 1.5 79.9 6 39.9 0.3 6 0.7 0.6 6 0.8 4.2 6 1.5
S. meliloti 2.0 6 1.2 12.6 6 3.7 78.9 6 39.3 3.5 6 1.1 2.6 6 2.0 8.0 6 3.9
Synechocystis 0.2 6 0.6 63.9 6 8.6 24.3 6 37.3 93.6 6 4.4 80.0 6 26.1 37.3 6 28.9
T. maritima 0.0 6 0.0 23.7 6 2.9 3.8 6 7.9 14.7 6 8.0 5.4 6 21.7 6.4 6 3.9
Type I error (100 – sensitivity) 17.9 6 1.0 20.8 6 1.6 44.8 6 3.4 17.8 6 2.5 16.9 6 6.6 15.9 6 3.9
Type II error (100 – specificity) 57.5 6 1.0 31.4 6 1.3 56.3 6 28.1 11.9 6 2.2 6.8 6 8.7 14.5 6 12.6
Mean error rate 37.7 6 0.7 26.1 6 1.2 50.6 6 15.6 14.9 6 1.2 11.8 6 3.4 15.2 6 5.1
aOptimum performance was found at threshold ¼ 0.12.bOptimum threshold ¼ 0.48.ck ¼ 2, using random initialization of cluster seeds; mean error rate was 57.4% when initializing cluster seeds using GenMark.dOptimum threshold ¼ 0.4.eOptimum threshold ¼ 1.8.fOptimum threshold ¼ 1.6.gCore genes from the specified genome were used to train Markov models for the creation of artificial genes donated into an artificial E. coli backbone.
DOI: 10.1371/journal.pcbi.0010056.t001
Table 2. Error Rates of Parametric Methods for Detecting Atypical Genes in an Artificial E. coli Genome
Method Thresholda Error Rate
Type I Error (100 � Sensitivity) Type II Error (100 � Specificity) Mean Error
Karlin’s dinucleotide 0.11 15.0 6 1.1 52.0 6 0.7 33.5 6 0.6
Karlin’s dinucleotide 0.15* 35.5 6 1.0 28.6 6 0.7 32.1 6 0.7
Karlin’s dinucleotide 0.20 62.9 6 1.2 13.4 6 0.9 38.2 6 0.8
Karlin’s codon usage 0.45 16.2 6 0.8 25.5 6 0.7 20.8 6 0.6
Karlin’s codon usage 0.52* 25.2 6 0.8 12.9 6 0.5 19.0 6 0.5
Karlin’s codon usage 0.57 36.5 6 1.4 7.4 6 0.4 22.0 6 0.7
k-means, random seeds N/A 21.1 6 1.1 4.8 6 0.6 13.0 6 0.6
k-means, GenMark seeds N/A 26.9 6 13.1 4.1 6 1.6 15.5 6 5.8
AIC, dinucleotide bias 1.3 13.5 6 5.2 12.8 6 9.7 13.2 6 3.1
AIC, dinucleotide bias 1.8* 17.1 6 4.8 4.5 6 8.2 10.8 6 2.3
AIC, dinucleotide bias 2.1 22.3 6 12.1 3.8 6 8.2 13.0 6 5.3
AIC, codon bias 1.1 17.6 6 3.2 16.0 6 12.4 16.8 6 4.7
AIC, codon bias 1.5* 19.5 6 2.5 8.9 6 8.8 14.2 6 3.3
AIC, codon bias 1.8 22.6 6 6.9 6.8 6 8.3 14.8 6 3.4
Artificial chimeric genomes were generated as follows: 75% E. coli, 7% A. fulgidus, 6% M. jannaschii, 5% B. subtilus, 4% R. solanacearum, and 3% H. influenzae; see Materials and Methods.aThreshold for Karlin’s methods, or tuning parameter for AIC-based methods. Values noted with asterisks denote ‘‘optimal’’ setting, which minimizes mean error.
N/A, not applicable.
DOI: 10.1371/journal.pcbi.0010056.t002
PLoS Computational Biology | www.ploscompbiol.org November 2005 | Volume 1 | Issue 6 | e560467
Construction and Use of Artificial Genomes
outperforming the other methods described (see Figure 5B;Tables 1 and 2). For example, in examining artificial genomeswith laterally transferred genes from ten sources (Table 1),the mean error rates for the AIC-based methods (12%�15%)were far lower than Karlin’s dinucleotide (37%–39%) or CUB(26%�28%) methods. Overall, the AIC clustering methodusing DNC performed the best on these data, minimizingboth type I and type II errors (Figure 5B). Similar results areseen when analyzing the five-donor genome case (Table 2). Inaddition, the overall performance of this method did not relyheavily on the value of the ‘‘tuning’’ parameter (see Materialsand Methods), which is analogous to threshold parameters ofother methods. As seen in Table 2, all methods show atradeoff between type I and type II errors; for the AIC-basedmethods, small adjustments in the tuning parameter did notdramatically alter performance. The performance of the AIC-based methods does not reflect the composition of the coregenomes, which were generated via an AIC-based clusteringalgorithm. When core genomes extracted using Kullback-Leibler (K-L) distance were used to train Markov models usedto generate artificial genomes, nearly identical results wereobtained (Figure S3).
Performance in Classifying the Short Open ReadingFrames
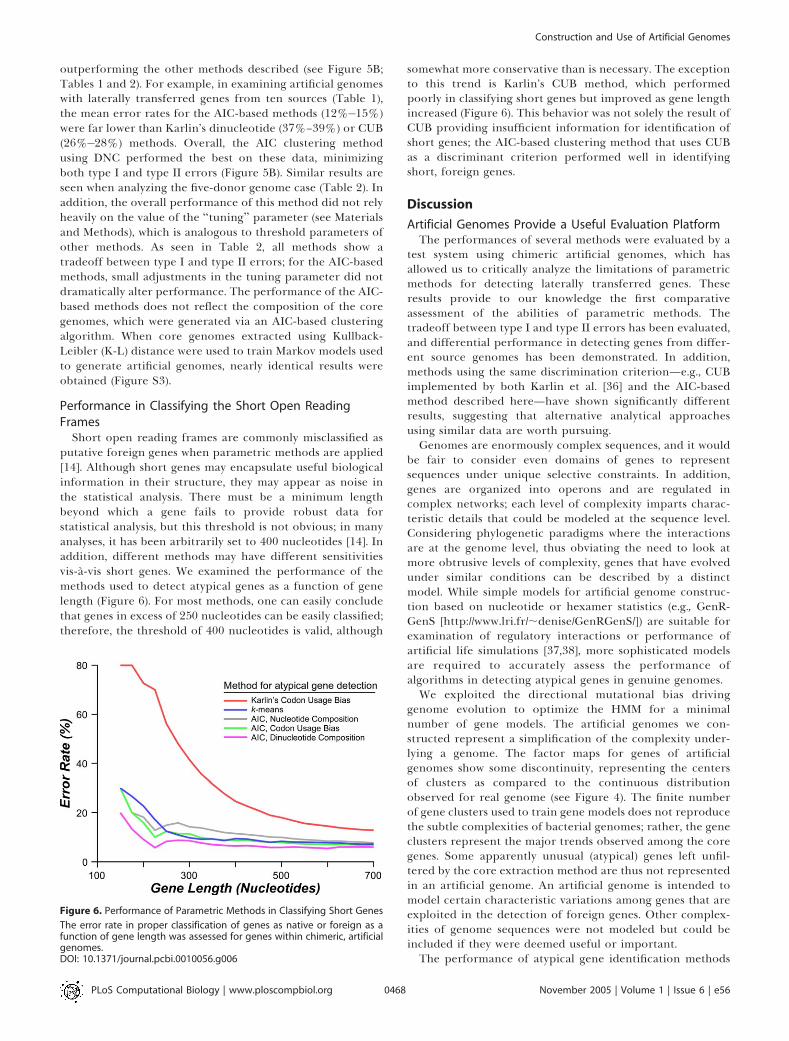
Short open reading frames are commonly misclassified asputative foreign genes when parametric methods are applied[14]. Although short genes may encapsulate useful biologicalinformation in their structure, they may appear as noise inthe statistical analysis. There must be a minimum lengthbeyond which a gene fails to provide robust data forstatistical analysis, but this threshold is not obvious; in manyanalyses, it has been arbitrarily set to 400 nucleotides [14]. Inaddition, different methods may have different sensitivitiesvis-a-vis short genes. We examined the performance of themethods used to detect atypical genes as a function of genelength (Figure 6). For most methods, one can easily concludethat genes in excess of 250 nucleotides can be easily classified;therefore, the threshold of 400 nucleotides is valid, although
somewhat more conservative than is necessary. The exceptionto this trend is Karlin’s CUB method, which performedpoorly in classifying short genes but improved as gene lengthincreased (Figure 6). This behavior was not solely the result ofCUB providing insufficient information for identification ofshort genes; the AIC-based clustering method that uses CUBas a discriminant criterion performed well in identifyingshort, foreign genes.
Discussion
Artificial Genomes Provide a Useful Evaluation PlatformThe performances of several methods were evaluated by a
test system using chimeric artificial genomes, which hasallowed us to critically analyze the limitations of parametricmethods for detecting laterally transferred genes. Theseresults provide to our knowledge the first comparativeassessment of the abilities of parametric methods. Thetradeoff between type I and type II errors has been evaluated,and differential performance in detecting genes from differ-ent source genomes has been demonstrated. In addition,methods using the same discrimination criterion—e.g., CUBimplemented by both Karlin et al. [36] and the AIC-basedmethod described here—have shown significantly differentresults, suggesting that alternative analytical approachesusing similar data are worth pursuing.Genomes are enormously complex sequences, and it would
be fair to consider even domains of genes to representsequences under unique selective constraints. In addition,genes are organized into operons and are regulated incomplex networks; each level of complexity imparts charac-teristic details that could be modeled at the sequence level.Considering phylogenetic paradigms where the interactionsare at the genome level, thus obviating the need to look atmore obtrusive levels of complexity, genes that have evolvedunder similar conditions can be described by a distinctmodel. While simple models for artificial genome construc-tion based on nucleotide or hexamer statistics (e.g., GenR-GenS [http://www.lri.fr/;denise/GenRGenS/]) are suitable forexamination of regulatory interactions or performance ofartificial life simulations [37,38], more sophisticated modelsare required to accurately assess the performance ofalgorithms in detecting atypical genes in genuine genomes.We exploited the directional mutational bias driving
genome evolution to optimize the HMM for a minimalnumber of gene models. The artificial genomes we con-structed represent a simplification of the complexity under-lying a genome. The factor maps for genes of artificialgenomes show some discontinuity, representing the centersof clusters as compared to the continuous distributionobserved for real genome (see Figure 4). The finite numberof gene clusters used to train gene models does not reproducethe subtle complexities of bacterial genomes; rather, the geneclusters represent the major trends observed among the coregenes. Some apparently unusual (atypical) genes left unfil-tered by the core extraction method are thus not representedin an artificial genome. An artificial genome is intended tomodel certain characteristic variations among genes that areexploited in the detection of foreign genes. Other complex-ities of genome sequences were not modeled but could beincluded if they were deemed useful or important.The performance of atypical gene identification methods
Figure 6. Performance of Parametric Methods in Classifying Short Genes
The error rate in proper classification of genes as native or foreign as afunction of gene length was assessed for genes within chimeric, artificialgenomes.DOI: 10.1371/journal.pcbi.0010056.g006
PLoS Computational Biology | www.ploscompbiol.org November 2005 | Volume 1 | Issue 6 | e560468
Construction and Use of Artificial Genomes
could be examined with or without additional, more complexinformation included. For example, strand bias was includedin our artificial genome generator, but artificial genomes canbe generated that lack strand identity (see Figure S4);therefore, the sensitivity of methods to this aspect of genomecomplexity could be assayed directly. This optimized HMMlies at the core of the test system developed to assess theperformance of parametric methods. The chimeric, artificialgenomes provide a level playing ground for parametricmethods to perform upon and be evaluated, i.e., we expectmethods that perform well in detecting atypical genes inartificial genomes to perform well in classifying the genes ingenuine genomes.
Comparative assessment of the parametric methods usingthe test system that we developed provides several insights.We observed that Karlin’s dinucleotide method was out-performed by methods that used codon bias as a discriminantmeasure (see Figure 5B). However, we also found that aframe-specific dinucleotide measure implemented in an AIC-based clustering algorithm better discriminated the nativeand foreign genes than did codon bias measures implementedby any other algorithm. Therefore, the performance of amethod depends both on the choice of statistic and on themethodology used. Methods like k-means clustering showed asignificant variation in performance with the number ofdonor genomes (see Tables 1 and 2), and setting k ¼ 2 doesnot seem to be a suitable choice for discriminating the poolof foreign genes from the native one. The donor genesoriginating from one source genome have distinct variabilitywith respect to other genes, so the two-cluster approach maynot always be a viable choice; increasing k can allow themethod to create more centers for the genes to clusteraround according to the genotypic variability inherent in agenome. Indeed, we have seen that an HMM with multiplegene models derived from gene clusters using the k-meansmethod generates an artificial genome having characteristicvariations of its genuine counterpart.
Other Approaches for Deducing Gene AncestryIn theory, comparing an organism’s gene inventory to that
of a close relative would provide one measure as to whichgenes were native (those shared between the two genomes)and which genes were foreign (those unique to the genome ofinterest). This approach has been applied to analyses offoreign gene detection with some success [13]. This phyloge-netic approach has several weaknesses, which can colorattempts to tune the performance of methods for atypicalgene detection or to validate the analysis of any one genomesequence. First, there are many organisms for which no closerelatives have been sequenced; in these cases, there are nosuitable genomes to provide a basis for comparison. Second,the presence of a gene only in the taxon of interest may resultfrom gain in that lineage or from loss in the sister lineage; thepolarity of this event can be determined only by the analysisof three or more genomes. Third, there is a large degree ofvariability in gene content even among very closely relatedtaxa—e.g., strains of E. coli share less than half of their species-wide gene inventories [29,39]—which will confound theidentification of lineage-specific genes.
Last, and most important, genes shared among twogenomes are ‘‘native’’ only from the perspective that theywere present in the common ancestor of those two strains.
That is, one would arrive upon very different inventories of‘‘foreign’’ genes if the Salmonella typhimurium genome werecompared to the Salmonella typhi genome, the E. coli genome,or the Yersinia pestis genome. To validate and calibrateparametric methods for detecting laterally transferred genes,assignment of genes as being ‘‘foreign’’ or ‘‘native’’ should notrely upon the designation of a particular outgroup taxon.
Combining Approaches for Detecting Foreign GenesDifferent sets of putative foreign genes are identified by
different parametric methods in genuine genomes [9,10],leading to the conjecture that different methods detectdifferent subsets of foreign genes. We believe that thishypothesis is supported by our finding that different methodsfor detecting foreign genes performed noticeably different indetecting genes from different sources (see Table 1). Becausethe identities of foreign genes are known with certainty inartificial genomes, we could test the hypothesis that acombination of methods that performed differently could,in tandem, outperform each method when used alone. Twostrategies could then be implemented. One option is to relaxdiscriminant criteria for the methods of atypical genedetection, thus identifying more foreign genes, but at theexpense of misclassifying more native genes as potentiallyforeign (see Figure 5). The final set of putative foreign geneswould be defined as those genes identified by all methods (theintersection of all gene sets). We do not favor this approach,because each method has difficulty in identifying particularforeign genes, and one would not expect them to appear in allsets.Alternatively, one could use more stringent threshold
criteria for atypical gene detection, thus misclassifying fewernative genes and minimizing type II error. The final set ofputative foreign genes would comprise all atypical genesdetected (the union of all gene sets). We favor this approach,because one method should identify some foreign genes thatare not identified by the other. In addition, analysis of errorrates (see Figure 5) allows us to choose threshold criteria thatare conservative for each method. To this end, we identifiedputative foreign genes in chimeric artificial genomes usingtwo of Karlin’s methods, those using DNC and CUB asdiscriminant criteria. These two methods showed comple-mentary strengths and weaknesses in identifying genes fromdifferent donor genomes (see Table 1).To combine results, we selected threshold criteria that were
more conservative than the optimal values, i.e., fewer nativegenes were misclassified as foreign at the expense of fewerforeign genes being correctly identified. However, when theresults of the two methods were combined—i.e., we declaredas foreign any gene that was so identified by either method—then the results of the combined methodology outperformedeither method alone (Table 3). The mean error rate of thecombined method (22.9%) was also less than the mean errorrate of the component methods at their respective optimalthresholds (37.7% and 26.1% for Karlin’s dinucleotide andcodon bias methods, respectively). Therefore, we believe theartificial genome platform has justified the concept of acombined foreign gene identification approach whereby theunion of sets of genes identified by different methods isdenoted as ‘‘foreign.’’ We believe the strong improvement indetecting atypical genes reflects a ‘‘complementarity’’ of themethods, i.e., atypical genes detected well by one method
PLoS Computational Biology | www.ploscompbiol.org November 2005 | Volume 1 | Issue 6 | e560469
Construction and Use of Artificial Genomes

were not detected well by the other, and vice versa. The threeAIC-based methods showed less complementarity (see Table1). When these methods were used together, the mostprominent improvement in performance was observed forthe combination of the AIC nucleotide and AIC codon biasmethods (mean error rate of 13.8 compared to 14.9 and 15.2at optimal thresholds for the AIC nucleotide and AIC codonbias methods, respectively; Tables 1 and S1). Understandably,addition of the AIC dinucleotide method yielded no addi-tional improvements (Table S1), likely because this methoddoes not augment detection of classes of genes leftundetected by the combination of the other two methods. Anotable feature of this analysis is that in all cases the type Ierror decreased by a large margin while the mean error rateremained almost same or less than those of the componentmethods at optimal thresholds (Tables 3 and S1). Thecombination of methods is thus suited for increasing thesensitivity substantially while keeping the number of false-positive results to a minimum.
A Novel Method for Detecting Foreign GenesNovel gene clustering algorithms based on the AIC [20]
have also been proposed. These methods use the AIC tocluster genes by any parametric measure (e.g., DNC). Thesemethods compared favorably with the existing parametricmethods of atypical gene detection, clearly outperformingthem in our test sets (see Tables 1 and 2; Figure 5B). Whereasthe k-means clustering algorithm selects an arbitrary numberof clusters (k) into which genes are apportioned, the AIC-based clustering algorithm segregates the genes into distinctgene classes reflecting the inherent complexity underlyingthe given genome. Unlike the current parametric methods,which merely detect unusual genes, it has the ability to
distinguish between distinct classes of acquired genes, i.e., itidentifies sets of genes that are atypical in a particular way.This property may be useful in identifying genes that wereacquired from similar sources and thus bear similar sequencesignatures. In addition, this feature may serve as a validationtechnique, where operons of foreign genes would comprisegenes that fall into the same AIC-defined clusters.The performance of the AIC-based methods was not
influenced by use of the AIC in the method for identifying‘‘core’’ genes for use in training Markov models to generateartificial genomes. To ensure the independence of thesemethods, we extracted the core genome using a method basedon K-L distance (see Materials and Methods). The core of theE. coli genome selected by the K-L method contained 2,445genes, where 1,788 of the genes were shared with the AIC-generated core. Because the core genomes produced by thetwo methods contain many of the same genes, the methodused to select the core does not appear to bias thecomposition of the core. Rather, the differences reflect therelative stringency of the selection method. When methodsfor detecting atypical genes were assessed using chimericgenomes created using models of these core genomes, nosignificant differences were detected (see Figure S3; compareto Figure 5B). These results support the hypothesis that little,if any, bias remains in the composition of the core genome,and any bias would have been eliminated upon the creationof a chimeric artificial genome from genes created by severalhundred Markov models. Therefore, we conclude that thisapproach provides a robust platform for evaluating theperformance of parametric methods for the detection ofatypical genes in bacterial genomes.
ConclusionsIdentifying the atypical character of a gene is a first step in
identifying and quantifying lateral gene transfer events. Eventhough parametric methods have proved to be very effectivein classifying foreign genes, reducing the margin of error isstill a challenge. Our probabilistic approach is a step forwardin assessing the atypical nature of genes through parametricmethods using different null hypotheses and provides aplatform for developing an integrated system of approachesthat can assign a confidence value to a gene to be calledtypical or atypical, thus opening a new direction in quantify-ing lateral gene flow. Use of the HMM allows for artificialchimeric genomes to be generated given any set ofprokaryotic genomes. This provides an objective test bedfor evaluating the performance of newly proposed methodsfor atypical gene detection.
Materials and Methods
Genomes. The complete genome sequences of several prokaryoticorganisms—A. fulgidus DSM4304, B. subtilis 168, D. radiodurans R1chromosome I, E. coli K12, H. influenzae Rd KW20, M. jannaschiiDSM2661, N. gonorrhoeae FA1090, R. solanacearum GMI1000, S. meliloti1021, Synechocystis sp. PCC6803, and T. maritime MSB8—were retrievedfrom GenBank. Open reading frames were extracted using coor-dinates provided in the annotation; for assigning genes to leading andlagging strands, the origins and termini of replication were localizedusing cumulative nucleotide skew [40,41].
Generalized HMM as a descriptor of a genome sequence. Markovmodels have been successfully applied in deciphering the complexstructural and functional units of a genome [42]. Borodovsky et al.[43] provided a rigorous mathematical framework in the form of acodon position�specific inhomogeneous Markov model for describ-
Table 3. Performance of Combined Parametric Methods forDetecting Atypical Genes in Prokaryotic Genomes
Parameter Method for Detecting Foreign Genes
Karlin’s
DinucleotideaKarlin’s
Codon UsagebCombinedc
Artificial Gene Donord
A. fulgidus 11.9 6 4.2 6.1 6 2.3 2.9 6 2.5
B. subtilis 87.8 6 4.7 81.3 6 6.3 76.6 6 6.5
D. radiodurans 89.0 6 3.6 16.0 6 2.6 14.4 6 2.4
H. influenzae 92.2 6 2.0 11.0 6 3.8 10.9 6 4.0
M. jannaschii 0.5 6 1.1 0.0 6 0.0 0.0 6 0.0
N. gonorrhoeae 78.3 6 4.8 72.6 6 6.7 59.7 6 6.9
R. solanacearum 67.0 6 3.7 6.0 6 2.0 5.8 6 1.9
S. meliloti 31.9 6 2.9 27.3 6 3.4 16.6 6 3.4
Synechocystis 18.8 6 7.0 77.8 6 6.8 16.5 6 5.9
T. maritima 1.4 6 1.1 45.8 6 4.3 0.9 6 0.9
Type I error
(100 – sensitivity)
50.8 6 1.7 30.1 6 1.3 16.7 6 1.1
Type II error
(100 – specificity)
30.6 6 1.4 24.6 6 1.2 29.0 6 1.2
Mean error rate 40.7 6 1.3 27.4 6 1.0 22.9 6 1.0
aThreshold ¼ 0.17, more conservative than optimum (see Table 1).bThreshold ¼ 0.52, more conservative than optimum (see Table 1).cGenes were identified as ‘‘foreign’’ if they were identified as atypical by either the dinucleotide analysis or the DNC
analysis.dCore genes from the specified genome were used to train Markov models for the creation of artificial genes
donated into an artificial E. coli backbone.
DOI: 10.1371/journal.pcbi.0010056.t003
PLoS Computational Biology | www.ploscompbiol.org November 2005 | Volume 1 | Issue 6 | e560470
Construction and Use of Artificial Genomes
ing protein-coding sequences and a homogeneous Markov model fordescribing noncoding sequences. Markov models have been usedextensively in gene-finding algorithms applied to both prokaryoticand eukaryotic genomes [19,44�47]. At the heart of such algorithms isan HMM incorporating models of distinct sequence types. Theproblem is formulated as deciphering the sequence of ‘‘hidden’’states (e.g., protein-coding or noncoding) underlying a DNAsequence.
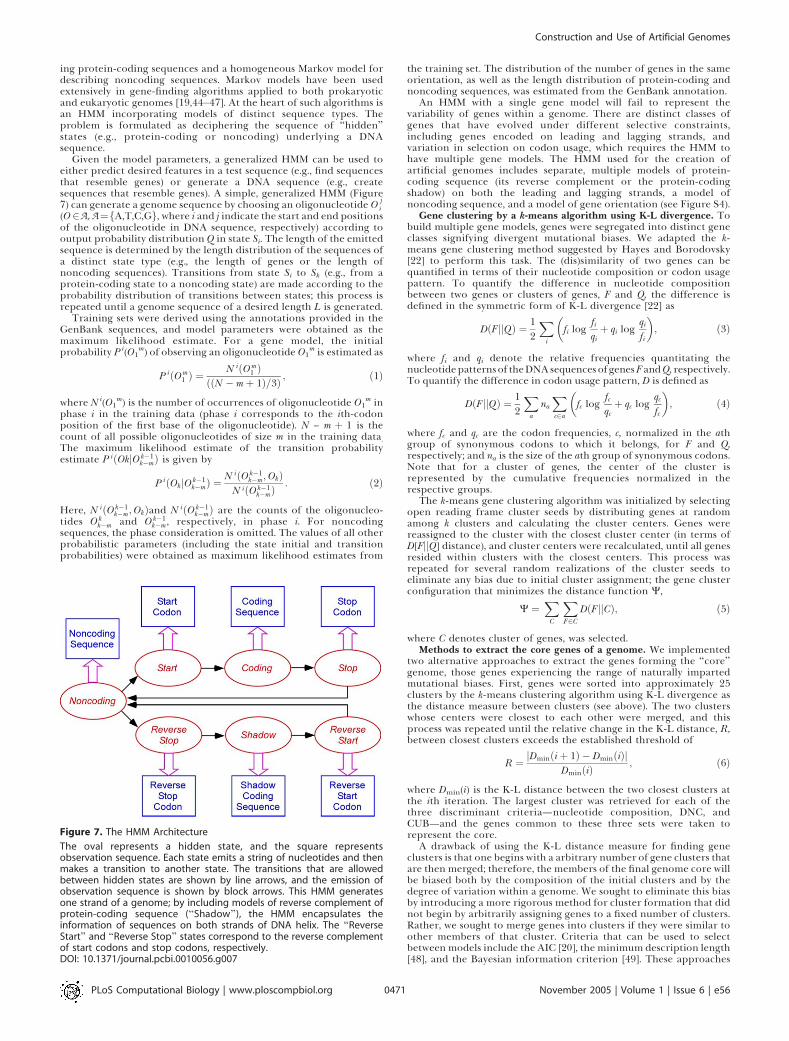
Given the model parameters, a generalized HMM can be used toeither predict desired features in a test sequence (e.g., find sequencesthat resemble genes) or generate a DNA sequence (e.g., createsequences that resemble genes). A simple, generalized HMM (Figure7) can generate a genome sequence by choosing an oligonucleotide O j
i(O2 A, A¼fA,T,C,Gg, where i and j indicate the start and end positionsof the oligonucleotide in DNA sequence, respectively) according tooutput probability distribution Q in state Si. The length of the emittedsequence is determined by the length distribution of the sequences ofa distinct state type (e.g., the length of genes or the length ofnoncoding sequences). Transitions from state Si to Sk (e.g., from aprotein-coding state to a noncoding state) are made according to theprobability distribution of transitions between states; this process isrepeated until a genome sequence of a desired length L is generated.
Training sets were derived using the annotations provided in theGenBank sequences, and model parameters were obtained as themaximum likelihood estimate. For a gene model, the initialprobability Pi(O1
m) of observing an oligonucleotide O1m is estimated as
P iðOm1 Þ ¼
N iðOm1 Þ
ððN � mþ 1Þ=3Þ ; ð1Þ
where Ni(O1m) is the number of occurrences of oligonucleotide O1
m inphase i in the training data (phase i corresponds to the ith-codonposition of the first base of the oligonucleotide). N – m þ 1 is thecount of all possible oligonucleotides of size m in the training data.The maximum likelihood estimate of the transition probabilityestimate P iðOkjOk�1
k�mÞ is given by
P iðOkjOk�1k�mÞ ¼
N iðOk�1k�m;OkÞ
N iðOk�1k�mÞ
: ð2Þ
Here, N iðOk�1k�m;OkÞand N iðOk�1
k�mÞ are the counts of the oligonucleo-tides Ok
k�m and Ok�1k�m, respectively, in phase i. For noncoding
sequences, the phase consideration is omitted. The values of all otherprobabilistic parameters (including the state initial and transitionprobabilities) were obtained as maximum likelihood estimates from
the training set. The distribution of the number of genes in the sameorientation, as well as the length distribution of protein-coding andnoncoding sequences, was estimated from the GenBank annotation.
An HMM with a single gene model will fail to represent thevariability of genes within a genome. There are distinct classes ofgenes that have evolved under different selective constraints,including genes encoded on leading and lagging strands, andvariation in selection on codon usage, which requires the HMM tohave multiple gene models. The HMM used for the creation ofartificial genomes includes separate, multiple models of protein-coding sequence (its reverse complement or the protein-codingshadow) on both the leading and lagging strands, a model ofnoncoding sequence, and a model of gene orientation (see Figure S4).
Gene clustering by a k-means algorithm using K-L divergence. Tobuild multiple gene models, genes were segregated into distinct geneclasses signifying divergent mutational biases. We adapted the k-means gene clustering method suggested by Hayes and Borodovsky[22] to perform this task. The (dis)similarity of two genes can bequantified in terms of their nucleotide composition or codon usagepattern. To quantify the difference in nucleotide compositionbetween two genes or clusters of genes, F and Q, the difference isdefined in the symmetric form of K-L divergence [22] as
DðF jjQÞ ¼ 12
Xi
fi logfiqiþ qi log
qifi
� �; ð3Þ
where fi and qi denote the relative frequencies quantitating thenucleotidepatternsof theDNAsequencesof genesF andQ, respectively.To quantify the difference in codon usage pattern, D is defined as
DðFjjQÞ ¼ 12
Xa
naXc2a
fc logfcqcþ qc log
qcfc
� �; ð4Þ
where fc and qc are the codon frequencies, c, normalized in the athgroup of synonymous codons to which it belongs, for F and Q,respectively; and na is the size of the ath group of synonymous codons.Note that for a cluster of genes, the center of the cluster isrepresented by the cumulative frequencies normalized in therespective groups.
The k-means gene clustering algorithm was initialized by selectingopen reading frame cluster seeds by distributing genes at randomamong k clusters and calculating the cluster centers. Genes werereassigned to the cluster with the closest cluster center (in terms ofD[FjjQ] distance), and cluster centers were recalculated, until all genesresided within clusters with the closest centers. This process wasrepeated for several random realizations of the cluster seeds toeliminate any bias due to initial cluster assignment; the gene clusterconfiguration that minimizes the distance function W,
W ¼XC
XF2C
DðF jjCÞ; ð5Þ
where C denotes cluster of genes, was selected.Methods to extract the core genes of a genome. We implemented
two alternative approaches to extract the genes forming the ‘‘core’’genome, those genes experiencing the range of naturally impartedmutational biases. First, genes were sorted into approximately 25clusters by the k-means clustering algorithm using K-L divergence asthe distance measure between clusters (see above). The two clusterswhose centers were closest to each other were merged, and thisprocess was repeated until the relative change in the K-L distance, R,between closest clusters exceeds the established threshold of
R ¼ jDminðiþ 1Þ � DminðiÞjDminðiÞ
; ð6Þ
where Dmin(i) is the K-L distance between the two closest clusters atthe ith iteration. The largest cluster was retrieved for each of thethree discriminant criteria—nucleotide composition, DNC, andCUB—and the genes common to these three sets were taken torepresent the core.
A drawback of using the K-L distance measure for finding geneclusters is that one begins with a arbitrary number of gene clusters thatare then merged; therefore, the members of the final genome core willbe biased both by the composition of the initial clusters and by thedegree of variation within a genome. We sought to eliminate this biasby introducing a more rigorous method for cluster formation that didnot begin by arbitrarily assigning genes to a fixed number of clusters.Rather, we sought to merge genes into clusters if they were similar toother members of that cluster. Criteria that can be used to selectbetween models include the AIC [20], the minimum description length[48], and the Bayesian information criterion [49]. These approaches
Figure 7. The HMM Architecture
The oval represents a hidden state, and the square representsobservation sequence. Each state emits a string of nucleotides and thenmakes a transition to another state. The transitions that are allowedbetween hidden states are shown by line arrows, and the emission ofobservation sequence is shown by block arrows. This HMM generatesone strand of a genome; by including models of reverse complement ofprotein-coding sequence (‘‘Shadow’’), the HMM encapsulates theinformation of sequences on both strands of DNA helix. The ‘‘ReverseStart’’ and ‘‘Reverse Stop’’ states correspond to the reverse complementof start codons and stop codons, respectively.DOI: 10.1371/journal.pcbi.0010056.g007
PLoS Computational Biology | www.ploscompbiol.org November 2005 | Volume 1 | Issue 6 | e560471
Construction and Use of Artificial Genomes

are based on the principle of finding the most parsimonious model,thus avoiding underfitting or overfitting models. After testing eachcriterion of model selection, we converged on the AIC for identi-fication of core genes, which performed well and showed no bias withrespect to cluster size or composition. The AIC is defined as
AIC ¼ �2lnðLÞ þ 2K; ð7Þ
where L is the maximum likelihood and K is the number of freeparameters in the model; the best-fitting model minimizes the AIC.
We used the AIC to determine if a one-gene (cluster) modelsignificantly improves upon a two-gene (cluster) model. Among allpossible pairings of gene clusters, the one minimizing reduction inlikelihood of the gene cluster set was selected and this process wasrepeated to segregate genes into distinct clusters. The AIC providedthe stopping criterion for the clustering procedure. In practice, for Ngenes, N single gene clusters were examined, and the pair of clusterswith the least likelihood decrease were merged, resulting in N – 1clusters. This process was repeated until the AIC for the mergedcluster model was no longer less than the AIC for the separate clustermodel. The largest cluster was retrieved for each of the threediscriminant criteria—SNC, DNC, and CUB—and the genes commonto these three sets were taken to represent the core genome.
To account for base compositional bias, the likelihood function Lcan be expressed in terms of frequencies of nucleotides (oroligonucleotides) located at specific codon positions. Consideringsingle nucleotide statistics, a 12-dimensional frequency vector withfrequencies of elements b 2 fAi , Ti , Ci , Gig, i¼1, 2, 3, which takes intoaccount both base identity and codon position, was used to calculatethe maximum likelihood L; the likelihood for the separate clustermodel was obtained as
L1 ¼ Pb2Afp 1ðbÞgN1ðbÞ P
b2Afp 2ðbÞgN2ðbÞ: ð8Þ
The likelihood for the merged cluster model was obtained as
L2 ¼ Pb2AfpðbÞgNðbÞ; ð9Þ
where fp(b)g and fp1(b), p2(b)g are the probabilities of base b in mergedcluster and the two component clusters, respectively. N(b) denotes thecount of base b in respective clusters. To allow the merger of the twoclusters, the AIC of the merged cluster model should be less than theAIC of the two-cluster model. We assessed this difference as
DAIC ¼ �2ln L2
L1
� �þ 2ðK2 � K1Þ, 0; ð10Þ
where K1 and K2 are the number of free parameters and L1 and L2 arethe corresponding likelihoods in the two random cluster model andone random cluster model, respectively. The likelihood function, andthus the stopping criterion, can be obtained similarly for oligonu-cleotide statistics and also for CUB consideration.
Methods for detection of atypical genes. Several widely used,parametric methods used in lateral gene transfer detection wereimplemented as follows. Karlin’s dinucleotide bias [32] was assessedthrough use of the odds ratio:
qXY ¼fXYfXfY
; ð11Þ
where fXY is the frequency of the dinucleotide XY and fX is thefrequency of the nucleotide X. The dinucleotide average relativeabundance difference between twoDNA sequences f and g is defined as
dð f ; gÞ ¼ 116
XXY
jqXYð f Þ � qXYðgÞj: ð12Þ
If the value of d for a gene compared to average over all genes in agenome is greater than an established threshold, the gene is classifiedas foreign. Karlin’s codon usage difference [36] of the gene family Frelative to gene family C was quantified as
BðF jCÞ ¼Xa
paðFÞXðx;y;zÞ¼a
j f ðx; y; zÞ � cðx; y; zÞj
0@
1A: ð13Þ
where ff(x,y,z)g is the set of codon frequencies for the gene family F,fc(x,y,z)g is the set of codon frequencies for the gene family C, andfpa(F)g is the set of amino acid frequencies of the genes of F.
The codon frequencies were normalized to one in each amino acidcodon family, so that
Xðx;y;zÞ¼a
f ðx; y; zÞ ¼ 1: ð14Þ
IfC is the set of all genes and F is a single gene,B(FjC)¼B(Fjall)measuresthe codon bias of F compared to the average for all genes. If B(Fjall) isgreater than an established threshold, F is classified as a foreign gene.
CUB was used as a discriminant criterion in the k-means geneclustering algorithm of Hayes and Borodovsky [22], where relativeentropy was used as a distance measure of codon usage differencebetween clusters of genes (see equation 4) in a k-means algorithm. Wealso implemented base compositional bias and CUB as discriminantcriteria in an AIC-based gene clustering algorithm. We have alreadydiscussed the utility of the AIC in identifying the genes likely to beforming the native core of a genome. We also tested the performanceof an AIC-based gene clustering algorithm in identifying atypicalgenes. Note that we used a generalized version of the AIC, defined as
AIC ¼ �2lnðLÞ þ ð1þ nn0ÞK; ð15Þ
where n is the sample size and n0 is a positive constant [50]. For n0¼n,the generalized version takes the form of a standard AIC (see equation7). The tuning parameter n0 was used to optimize the algorithm.
Supporting Information
Figure S1. Correspondence Analysis of CUB
The first axes—indicating variability in usage among 59 synonymouscodons—are plotted for 4,255 E. coli genes (A), 2,141 E. coli genesrepresenting the ‘‘core’’ genome (B), and 2,141 genes comprising theartificial E. coli core genome (C). The artificial genome was createdfrom genes clustered by frame-specific DNC.
Found at DOI: 10.1371/journal.pcbi.0010056.sg001 (826 KB TIF).
Figure S2. Variability within Genuine and Artificial E. coli Genomes
The percent GC of third-codon positions is plotted for 4,255 E. coligenes (A), 2,141 ‘‘core’’ E. coli genes (B), and 2,141 genes within theartificial ‘‘core’’ E. coli genome (C). The artificial core genome wascreated from genes clustered by frame-specific DNC; l and rrepresent the mean and standard deviation of the distribution.
Found at DOI: 10.1371/journal.pcbi.0010056.sg002 (388 KB TIF).
Figure S3. Tradeoffs in Error Rates for Several Methods of GeneDetection
Artificial genomesweregenerated fromMarkovmodels trainedoncoregenomes extractedusing aK-Ldistancemethod.Compare toFigure 5B.
Found at DOI: 10.1371/journal.pcbi.0010056.sg003 (142 KB TIF).
Figure S4. Cumulative GC-Skew Plots for Genuine and Artificial E. coliGenomes
For each gene, GC skew was calculated as (%G – %C)/(%Gþ%C) ofthird-codon positions, corrected for direction of transcription.Beginning with the first gene in a genome sequence, cumulativeskew was obtained as the sum of skew values for the preceding genes.The genuine E. coli genome comprised 4,255 protein-coding genes,whereas the artificial genomes comprised 4,000 genes. CumulativeGC-skew plots are shown for artificial E. coli genomes with andwithout gene models accounting for strand bias during training.Strand bias is evident as large domains of either G-rich or C-richgenes in the genuine E. coli genome and in the artificial genome withstrand identity incorporated into the model.
Found at DOI: 10.1371/journal.pcbi.0010056.sg004 (273 KB TIF).
Table S1. Performance of Combined Parametric Methods forDetecting Atypical Genes in Prokaryotic Genomes
Found at DOI: 10.1371/journal.pcbi.0010056.st001 (42 KB DOC).
Acknowledgments
This work was supported by grant MCB-0217278 from the NationalScience Foundation. We thank Ram Ramaswamy, Antoine Danchin,James McInerney, and Eduardo Rocha for helpful discussions.
Competing interests. The authors have declared that no competinginterests exist.
Author contributions. RKA and JGL conceived and designed theexperiment. RKA performed the experiments. RKA and JGL analyzedthe data and wrote the paper. &
PLoS Computational Biology | www.ploscompbiol.org November 2005 | Volume 1 | Issue 6 | e560472
Construction and Use of Artificial Genomes

References1. Doolittle WF (1999) Lateral genomics. Trends Cell Biol 9: M5–M8.2. Doolittle WF, Boucher Y, Nesbo CL, Douady CJ, Andersson JO, et al. (2003)
How big is the iceberg of which organellar genes in nuclear genomes arebut the tip? Philos Trans R Soc Lond B Biol Sci 358: 39–57.
3. Ochman H, Lawrence JG, Groisman E (2000) Lateral gene transfer and thenature of bacterial innovation. Nature 405: 299–304.
4. Koonin EV, Makarova KS, Aravind L (2001) Horizontal gene transfer inprokaryotes: Quantification and classification. Annu Rev Microbiol 55:709–742.
5. Lawrence JG, Hendrickson H (2003) Lateral gene transfer: When willadolescence end? Mol Microbiol 50: 739–749.
6. Koonin EV (2003) Horizontal gene transfer: The path to maturity. MolMicrobiol 50: 725–727.
7. Gogarten JP, Doolittle WF, Lawrence JG (2002) Prokaryotic evolution inlight of gene transfer. Mol Biol Evol 19: 2226–2238.
8. Nakamura Y, Itoh T, Matsuda H, Gojobori T (2004) Biased biologicalfunctions of horizontally transferred genes in prokaryotic genomes. NatGenet 36: 760–766.
9. Ragan MA (2001) On surrogate methods for detecting lateral gene transfer.FEMS Microbiol Lett 201: 187–191.
10. Ragan MA (2001) Detection of lateral gene transfer among microbialgenomes. Curr Opin Genet Dev 11: 620–626.
11. Wang B (2001) Limitations of compositional approach to identifyinghorizontally transferred genes. J Mol Evol 53: 244–250.
12. Guindon S, Perriere G (2001) Intragenomic base content variation is apotential source of biases when searching for horizontally transferredgenes. Mol Biol Evol 18: 1838–1840.
13. Koski LB, Morton RA, Golding GB (2001) Codon bias and base compositionare poor indicators of horizontally transferred genes. Mol Biol Evol 18:404–412.
14. Lawrence JG, Ochman H (2002) Reconciling the many faces of genetransfer. Trends Microbiol 10: 1–4.
15. Lawrence JG, Hartl DL (1992) Inference of horizontal genetic transfer: Anapproach using the bootstrap. Genetics 131: 753–760.
16. Rabiner L (1989) A tutorial on hidden Markov models and selectedapplications in speech recognition. Proc IEEE 77: 257–286.
17. Borodovsky M, McIninch J (1993) GenMark: Parallel gene recognition forboth DNA strands. Comp Chem 17: 123–133.
18. Azad RK, Borodovsky M (2004) Probabilistic methods of identifying genesin prokaryotic genomes: Connections to the HMM theory. Brief Bioinform5: 118–130.
19. Lukashin AV, Borodovsky M (1998) GeneMark.hmm: New solutions forgene finding. Nucleic Acids Res 26: 1107–1115.
20. Akaike H (1974) A new look at the statistical model identification. IEEETrans Automat Contr 19: 716–723.
21. Sakamoto Y, Ishiguro M, Kitagawa G (1999) Akaike information criterionstatistics. Berlin: Springer. 320 p.
22. Hayes WS, Borodovsky M (1998) How to interpret an anonymous bacterialgenome: Machine learning approach to gene identification. Genome Res 8:1154–1171.
23. Sharp PM, Li WH (1987) The codon adaptation index: A measure ofdirectional synonymous codon usage bias, and its potential applications.Nucleic Acids Res 15: 1281–1295.
24. Sharp PM (1991) Determinants of DNA sequence divergence betweenEscherichia coli and Salmonella typhimurium: Codon usage, map position, andconcerted evolution. J Mol Evol 33: 23–33.
25. McInerney JO (1998) GCUA: General codon usage analysis. Bioinformatics14: 372–373.
26. Medigue C, Rouxel T, Vigier P, Henaut A, Danchin A (1991) Evidence of
horizontal gene transfer in Escherichia coli speciation. J Mol Biol 222: 851–856.
27. Charlebois RL, Doolittle WF (2004) Computing prokaryotic gene ubiquity:Rescuing the core from extinction. Genome Res 14: 2469–2477.
28. Lawrence JG, Ochman H (1997) Amelioration of bacterial genomes: Ratesof change and exchange. J Mol Evol 44: 383–397.
29. Konstantinidis KT, Tiedje JM (2005) Genomic insights that advance thespecies definition for prokaryotes. Proc Natl Acad Sci U S A 102: 2567–2572.
30. Lerat E, Daubin V, Ochman H, Moran NA (2005) Evolutionary origins ofgenomic repertoires in bacteria. PLoS Biol 3: e130. DOI: 10.1371/journal.pbio.0030130
31. Lawrence JG, Ochman H (1998) Molecular archaeology of the Escherichia coligenome. Proc Natl Acad Sci U S A 95: 9413–9417.
32. Karlin S (1998) Global dinucleotide signatures and analysis of genomicheterogeneity. Curr Opin Microbiol 1: 598–610.
33. Jain R, Rivera MC, Lake JA (1999) Horizontal gene transfer amonggenomes: The complexity hypothesis. Proc Natl Acad Sci U S A 96: 3801–3806.
34. Metcalf WW, Wanner BL (1993) Evidence for a fourteen-gene, phnC to phnPlocus for phosphonate metabolism in Escherichia coli. Gene 129: 27–32.
35. Roth JR, Lawrence JG, Rubenfield M, Kieffer-Higgins S, Church GM (1993)Characterization of the cobalamin (vitamin B12) biosynthetic genes ofSalmonella typhimurium. J Bacteriol 175: 3303–3316.
36. Karlin S, Mrazek J, Campbell AM (1998) Codon usages in different geneclasses of the Escherichia coli genome. Mol Microbiol 29: 1341–1355.
37. Reil T (1999) Dynamics of gene expression in an artificial genome:Implications for biological and artificial ontogeny. In: Floreano D, NicoudJ-D, Mondada F, editors. Advances in artificial life. Berlin: Springer-Verlag.pp. 457–466
38. Watson J, Geard N, Wiles J (2004) Towards more biological mutationoperators in gene regulation studies. BioSystems 76: 239–248.
39. Welch RA, Burland V, Plunkett G 3rd, Redford P, Roesch P, et al. (2002)Extensive mosaic structure revealed by the complete genome sequence ofuropathogenic Escherichia coli. Proc Natl Acad Sci U S A 99: 17020–17024.
40. Lobry JR (1996) Asymmetric substitution patterns in the two DNA strandsof bacteria. Mol Biol Evol 13: 660–665.
41. Salzberg SL, Salzberg AJ, Kerlavage AR, Tomb JF (1998) Skewed oligomersand origins of replication. Gene 217: 57–67.
42. Durbin R, Eddy S, Krogh A, Mitchison G (1998) Biological sequenceanalysis: Probabilistic models of proteins and nucleic acids. Cambridge:Cambridge University Press. 356 p.
43. Borodovsky M, Sprizhitsky A, Golovanov EI, Alexandrov AA (1986)Statistical patterns in the primary structures of functional regions of thegenome in Escherichia coli: II. Nonuniform Markov models. Mol Biol 20: 833–840.
44. Krogh A, Mian IS, Haussler A (1994) A hidden Markov model that findsgenes in E. coli DNA. Nucleic Acids Res 22: 4768–4778.
45. Krogh A (1997) Two methods for improving performance of an HMM andtheir application for gene finding. Proc Int Conf Intell Syst Mol Biol 5: 179–186.
46. Larsen TS, Krogh A (2003) EasyGene: A prokaryotic gene finder that ranksORFs by statistical significance. BMC Bioinform 4: 21.
47. Burge C, Karlin S (1997) Prediction of complete gene structures in humangenomic DNA. J Mol Biol 268: 78–94.
48. Rissanen J (1987) Stochastic complexity. J R Stat Soc Ser B 49: 223–239.49. Schwarz G (1978) Estimating the dimensions of a model. Ann Stat 6: 461–
464.50. Kuha J (2004) AIC and BIC: Comparisons of assumptions and performance.
Sociol Methods Res 33: 188–229.
PLoS Computational Biology | www.ploscompbiol.org November 2005 | Volume 1 | Issue 6 | e560473
Construction and Use of Artificial Genomes