use of 3d laser scanner for rock fractures mapping · use of 3d laser scanner for rock fractures...
TRANSCRIPT
TS 8C – Terrestrial Laser Scanning II 1/ 14 Alan K. L. Kwong, Henry Kwok and Andrew Wong Use of 3D Laser Scanner for Rock Fractures Mapping Strategic Integration of Surveying Services FIG Working Week 2007 Hong Kong SAR, China, 13-17 May 2007
Use of 3D Laser Scanner for Rock Fractures Mapping
Alan K. L. KWONG, Henry KWOK and Andrew WONG, Hong Kong SAR, China Key words: Rock slopes, fracture plane, dip angle, dip direction, photogrammetry, 3D laser scanning, Autodesk 3d studio max SUMMARY In the process of investigation, design and upgrading of rock slopes, the orientation and spacing of the structural discontinuities or joints in the rock mass are thoroughly mapped in the field so that any unstable blocks can be identified and stabilization measures designed. The orientation of the structural discontinuities is traditionally measured manually using geological compass placed directly at the exposed surfaces. Scaffolding is usually erected so that the geologist can physically access the exposed rock surface. A large number of measurements are usually required in order to obtain a statistical mean of the fracture orientation. With the ongoing advances of digital technology, 3D laser scanning technique can be used to replace direct physical access and large number of manual measurements can be completely eliminated. A prototype system is described in this paper that combines the non-contact measurement technologies of photogrammetric imaging and 3D laser scanning to create dimensionally accurate and pictorially correct 3 dimensional models and orthoimages of a rock fractures. By taking photographs from at least two different locations, lines of sight are mathematically intersected to produce the 3D coordinates of the key reference points in a rock face. Automatic 3D laser scanning unit is then used to produce the 3D coordinates of the entire rock surface. By overlapping the images rectified from photogrammetry technique with the coordinates from 3D laser scanning in an Autodesk 3D Studio Max environment, the coordinates of any objects in the photographs can be selected and their orientation such as dip angle and dip direction calculated automatically. A case study is presented to compare the orientations of fracture planes measured using geological compass and the orientations from the prototype system developed.

TS 8C – Terrestrial Laser Scanning II 2/ 14 Alan K. L. Kwong, Henry Kwok and Andrew Wong Use of 3D Laser Scanner for Rock Fractures Mapping Strategic Integration of Surveying Services FIG Working Week 2007 Hong Kong SAR, China, 13-17 May 2007
Use of 3D Laser Scanner for Rock Fractures Mapping
Alan K. L. KWONG, Henry KWOK and Andrew WONG, Hong Kong SAR, China 1. INTRODUCTION Hundreds of slopes in Hong Kong are being investigated, designed and upgraded every year to reduce the likelihood of landslides and the potential loss of life and economic losses. During the process of investigation, design and upgrading of rock slopes, the orientation and spacing of structural discontinuities or joints in a rock mass must be thoroughly mapped in the field so that any unstable blocks can be identified and stabilization measures designed. Conventional mapping of rock joint orientation and spacing requires scaffolding to access to the rock face so that a hand-held geological compass can be placed directly at the rock joint surface to obtain the dip angle (maximum angle of a plane relative to horizontal) and the dip direction (angle measured clockwise from the north to the line of the dip). Because of scale effect, large amount of geological data has to be collected and plotted to come up with an interpretation of statistically significant trends. The process is rather time-consuming, potentially hazard to the geologists and workers, and limited to accessible areas only. The purpose of this paper is to introduce the non-contact measurement techniques of Photogrammetry and 3-D Laser Scanning and apply them to map the structural discontinuities so that the need to directly access the rock surface via scaffolding is removed. By eliminating the need for scaffolding, the cost of site investigation and the potential of workers falling off the slopes can be substantially reduced. 2. PHOTOGRAMMETRY AND 3D LASER SCANNING Photogrammetry is a 3-Dimensional mapping technique that uses photographs as the fundamental medium for measurement. By taking photographs from at least two different locations, lines of sight are mathematically intersected to produce the 3-D coordinates of any points of interest. Control points and tie points are identified in the overlapping photographs during the photogrammetry process in order that the orientation and location of the camera and the photos are fixed relative to each other. Once the orientation and location of the photos are fixed relative to the camera and 3-D coordinates of the tie points are determined, the 3-D coordinates of any points of interest between the tie points can be interpolated. If the points of interest between the tie points have regular shape, for example a planar surface, then the use of the photogrammetric process alone is adequate in forming a model that truly represents the coordinates and photographic textures of an object in space. Terrestrial 3-D laser scanning is a relatively new technology that has found many applications in the engineering field. A typical portable 3-D laser scanner is capable of recording positions of hundreds of thousands of points in 5 to 15 minutes with 2 mm accuracy in a 50m-target range. The minimum vertical and horizontal point-to-point measurement spacing can be less than 4 mm at 50m-target range. With a field of view of 40° horizontally and vertically and a maximum of 1000 rows and columns of points, this equates

TS 8C – Terrestrial Laser Scanning II 3/ 14 Alan K. L. Kwong, Henry Kwok and Andrew Wong Use of 3D Laser Scanner for Rock Fractures Mapping Strategic Integration of Surveying Services FIG Working Week 2007 Hong Kong SAR, China, 13-17 May 2007
to an average point spacing of about 4 mm at a distance of 50 metres. Inside the scanner, two mirrors rapidly and systematically sweep narrow, pulsing laser beam over the chosen target (or scene). A time-of-flight method is used to measure how long it takes for each laser pulse to hit a surface and return to the scanner without the need of a reflector. Range measurements are generated for every laser pulse while integrated optical encoders record mirror angles. The resulting positions commonly known as “point cloud” are displayed graphically, as they accumulate in real-time, on the system’s laptop. The point cloud is a true 3-D representation of the surfaces seen by the scanner and can be coloured according to either the intensity of the return laser pulse (which is influenced by the physical characteristics of the surface each pulse strikes) or by the distance from the scanner to the surface. It can be viewed from any direction and accurate measurements of distance, area and volume can be made between user-selected sets of points. Further processing of the point cloud allows contours, profiles, 2 dimensional drawings and 3 dimensional CAD objects and models to be created. 3. INTEGRATING “POINT CLOUD” WITH ORTHOPHOTOGRAPHS IN AN
AUTODESK 3-D STUDIO MAX ENVIRONMENT Laser scanning can produce a huge database of points with true 3-D local coordinates that can be viewed but the surface textures of the object are poorly captured. By contrast, photogrammetry offers the real texture of an object that can be visualized but the coordinates of the point are interpolated between the control points. By combining the photo images from photogrammetry and accurate coordinates from 3-D laser scanning, the photographs can be turned into dimensionally accurate and visually complete 3-D maps of the slope and hence the structural discontinuities orientation and spacing can be manually mapped on the photographs, reducing the need and extent of scaffolding. For this mergence to become a reality, a platform of storage, manipulation and visualization of data acquired from both photogrammetry and laser scanning is needed. Automated periphery functions such as the algorithms for computing orientation (dip angle and dip direction) can be added into the system to enhance the value of the system. 4. AUTOMATIC CALCULATION OF DIP ANGLE AND DIP DIRECTION OF
FRACTURE PLANES After the images and meshes are overlaid and attached together, an automated algorithm can be written to select the fracture planes that are of interest and perform automatic computation of orientation (dip angle and dip direction). 5. COMPUTATION OF DIP ANGLE AND DIP DIRECTION In geological terms, Dip Angle (DA) is the maximum downward inclination of a structural discontinuity plane to the horizontal, defined by β (0° ≤ β ≤ 90°).

TS 8C – Terrestrial Laser Scanning II 4/ 14 Alan K. L. Kwong, Henry Kwok and Andrew Wong Use of 3D Laser Scanner for Rock Fractures Mapping Strategic Integration of Surveying Services FIG Working Week 2007 Hong Kong SAR, China, 13-17 May 2007
Dip Direction (DD) is the direction of the horizontal trace of a line to dip angle, measured clockwise from the North, defined by α (0° ≤ α ≤ 360°). If a right-handed Cartesian system is adopted, then the positive Y-axis is directed to the North, the positive X-axis is directed to the East and the positive Z-axis is directed upward for a X-Y plane that is horizontal. The formula from analytical geometry can be used to compute the dip angle and dip direction of a fracture plane, which is modeled as a best-fit plane intersecting the point clouds that are of interest. Since the fracture plane is usually wavy, the orientation of the best-fit plane will be affected by the density and distribution of the point cloud. Therefore, a least squares approach that uses multivariate linear regression method can be used to define the best-fit plane representing the fracture plane. Following the work from Feng (2001), the equation of the best-fit plane representing the fracture plane can simply be expressed as:
ybxbbz 210 ++= (1) Using the method of least squares, it can be assumed that the best-fit plane is produced when the minimal sum of the deviations squared (least squares error) from a given set of data is found. In equation form, this is:
( )[ ]∑ ++−= 2210
2min iii ybxbbzε (2) For n number of points captured, the following matrix can be formed and the coefficients of the equation ,,, 210 bbb can be obtained by solving the matrix using either Gaussian Elimination or Crammer’s Theorem. In matrix algebra, solution of the best-fit plane in space depends on the existence and uniqueness of the matrix and two cases must be considered.
⎥⎥⎥⎥⎥⎥⎥
⎦
⎤
⎢⎢⎢⎢⎢⎢⎢
⎣
⎡
=⎥⎥⎥
⎦
⎤
⎢⎢⎢
⎣
⎡
⎥⎥⎥⎥⎥⎥⎥
⎦
⎤
⎢⎢⎢⎢⎢⎢⎢
⎣
⎡
∑
∑
∑
∑∑∑
∑∑∑
∑∑
=
=
=
===
===
==
n
iii
n
iii
n
ii
n
ii
n
iii
n
ii
n
iii
n
ii
n
ii
n
ii
n
ii
zy
zx
z
bbb
yyxy
yxxx
yxn
1
1
1
2
1
0
1
2
11
11
2
1
11
(3)
where iii zyx ,, are coordinates of the captured points.

TS 8C – Terrestrial Laser Scanning II 5/ 14 Alan K. L. Kwong, Henry Kwok and Andrew Wong Use of 3D Laser Scanner for Rock Fractures Mapping Strategic Integration of Surveying Services FIG Working Week 2007 Hong Kong SAR, China, 13-17 May 2007
If the determinant (D) of the matrix is equal to zero, then either the points captured are collinear (i.e., points rest on a line and do not form a plane) or the fracture plane happens to be vertical to the X-Y plane and parallel to the Z-axis. The former case can be avoided by making sure that the selected points are non collinear. For the latter case, the Dip Angle is obviously equal to 90° and since the fracture plane is vertical, the equation of a plane can be degenerated into an equation of a line, expressed simply as follows, again using the least squares method:
⎥⎥⎥⎥
⎦
⎤
⎢⎢⎢⎢
⎣
⎡
=⎥⎦
⎤⎢⎣
⎡
⎥⎥⎥⎥
⎦
⎤
⎢⎢⎢⎢
⎣
⎡
∑
∑
∑∑
∑
=
=
==
=n
iii
n
ii
n
iii
n
ii
n
ii
yx
y
ba
yxx
xn
1
1
11
1 (4)
This time, the solution of the best-fit line in the X-Y plane again depends on the existence and uniqueness of the matrix and two cases need to be considered. If the determinant (D) of the matrix is equal to zero, then there is no solution to Equation [4] and it implies that the line is parallel to the Y-axis (North) and the Dip Direction is either 90° or 270°. If the determinant (D) of the matrix is not equal to zero and b is greater than or equal to zero (means that slope is positive in the X-Y plane), then the Dip Direction can be determined by:
⎥⎦
⎤⎢⎣
⎡⎟⎟⎠
⎞⎜⎜⎝
⎛−⎥
⎦
⎤⎢⎣
⎡⎟⎟⎠
⎞⎜⎜⎝
⎛−= −−
ππ
010
010 180tan360180tan180 borbDD (5)
If the determinant (D) of the matrix is not equal to zero and b is less than or equal to zero (means that slope is negative in the X-Y plane), then the Dip Direction can be determined by:
⎥⎦
⎤⎢⎣
⎡⎟⎟⎠
⎞⎜⎜⎝
⎛−⎥
⎦
⎤⎢⎣
⎡⎟⎟⎠
⎞⎜⎜⎝
⎛−= −−
ππ
010
01 180tan180180tan borbDD (6)
If the determinant (D) of the matrix describing the best-fit plane in Equation [3] is not equal to zero, then the fracture plane is either inclined or parallel to the horizontal X-Y plane. The determination of Dip Angle and Dip Direction can be obtained by comparing Equations [1] and [3]. If 1b and 2b are both equal to zero, then the fracture plane is horizontal and the Dip Angle is 90° and Dip Direction does not exist. Otherwise, the fracture plane is inclined to the X-Y plane and determination of Dip Angle and Dip Direction can be based on unit vector computation. From analytical geometry point of view, Dip Angle is actually the angle between the fracture plane and the horizontal plane and it can be determined by the inner product of the unit

TS 8C – Terrestrial Laser Scanning II 6/ 14 Alan K. L. Kwong, Henry Kwok and Andrew Wong Use of 3D Laser Scanner for Rock Fractures Mapping Strategic Integration of Surveying Services FIG Working Week 2007 Hong Kong SAR, China, 13-17 May 2007
vector, ( )1,0,0k , of the positive Z-axis and the normal vector, ( )1,, 21 −bbn , of the fracture plane, as follows:
βcosnknk =⋅ (7) or,
11cos
22
21
1
++= −
bbβ (8)
From analytical geometry point of view, Dip Direction is actually the angle counted clockwise from the positive Y-axis to the horizontal component vector of the maximum inclination line or the horizontal component vector of the normal vector of the fracture plane. Let ( )0,1,0j be the unit vector of the positive Y-axis and ( )0,, 21 bbnh be the projection of the normal vector n onto the horizontal plane. Similar to Equation [7], the Dip Direction can be calculated as follows:
αcoshh njnj =⋅ (9)
22
21
21cosbb
b+
= −α (10)
The normal vector of a plane may point upward relative to a horizontal plane or it may point downward relative to a horizontal plane. Depending upon the pointing directions of the normal vector relative to the horizontal plane, the Dip Direction calculated from Equation [10] may differ by 180°. To follow the same geological definition, Dip Direction is determined by the upward normal vector of a fracture plane. Therefore, the directional cosine value of the normal vector is checked to determine which quadrants the normal vector is located in a Cartesian coordinate system and to identify whether the normal vector is upward or downward relative to the horizontal plane. The directional cosine value of the normal vector is simply as follows:
222
21
222
21
2
222
21
1
11cos
1cos
1cos
++±
−=
++±=
++±=
bb
bbb
bbb
ψ
δ
λ
(11)
TS 8C – Terrestrial Laser Scanning II 7/ 14 Alan K. L. Kwong, Henry Kwok and Andrew Wong Use of 3D Laser Scanner for Rock Fractures Mapping Strategic Integration of Surveying Services FIG Working Week 2007 Hong Kong SAR, China, 13-17 May 2007
where the three angles, (λ) , (δ) and (ψ) are the angles relative to the positive X-axis, Y-axis and Z-axis respectively. For plane that does not pass through the origin, 0b is the distance from the origin to the plane. When 00 ≥b , 22
22
1 1++± bb should have negative “-” sign to satisfy all the points in Equation [1]. When 00 <b , 22
22
1 1++± bb should have positive “+” sign. Depending on whether the normal vector is upward or downward and which quadrant the plane rests relative to the positive Y-axe (North), eight cases may be possible for determining the Dip Direction and is presented in Table 1. Correlation Coefficient, R2, also called multiple correlations or the coefficient of multiple determinations, is the percent of the variance in the dependent explained uniquely or jointly by the independents. Simply saying, R2 is a measure of association between the variables. In this case, it is a measure of how well the equation obtained fits the plane. R2 always lies between 0 and 1 and it represents the best fit when R2 is equal to 1, where R2 is given by:
( )( )[ ]( ) ( )∑ ∑∑
−−
−−= 22
22
ˆˆ
ˆˆR
zzzz
zzzz
ii
ii (12)
( ) ( )yybxxbbz iii −+−+= 210ˆ
(13) where zyx and, are mean of iii zyx and, respectively. 6. COMPARISON OF PLANES ORIENTATION CALCULATED FROM POINT
CLOUD WITH COMPASS The accuracy of this integrated approach has been reported by Kwong and Lee (2007). It is known from this study that for blocks which have a regular planar surface, there is only a small difference of 2° (both Dip Angle and Dip Direction) between the one measured from conventional compass and that calculated from the point clouds. In this paper, results of 5 exposed rock planes below the block (see Figure 1 on location) are presented. A 3-D laser scanner Cyrax 2500 model was used for scanning with point-to-point spacing of 4 mm, within a distance of less than 50 m. Scans from three different directions were carried out and they were registered and tied into the local coordinate system of Hong Kong using 6 nos. of control points, the coordinates of which were obtained from Global Positioning Position (GPS) device that has an accuracy of 5 mm. After registration was completed for the three different scans, regression analysis shows that the root mean square error of all the control points was less than 5 mm which indicated that the three different scans were correctly merged together.

TS 8C – Terrestrial Laser Scanning II 8/ 14 Alan K. L. Kwong, Henry Kwok and Andrew Wong Use of 3D Laser Scanner for Rock Fractures Mapping Strategic Integration of Surveying Services FIG Working Week 2007 Hong Kong SAR, China, 13-17 May 2007
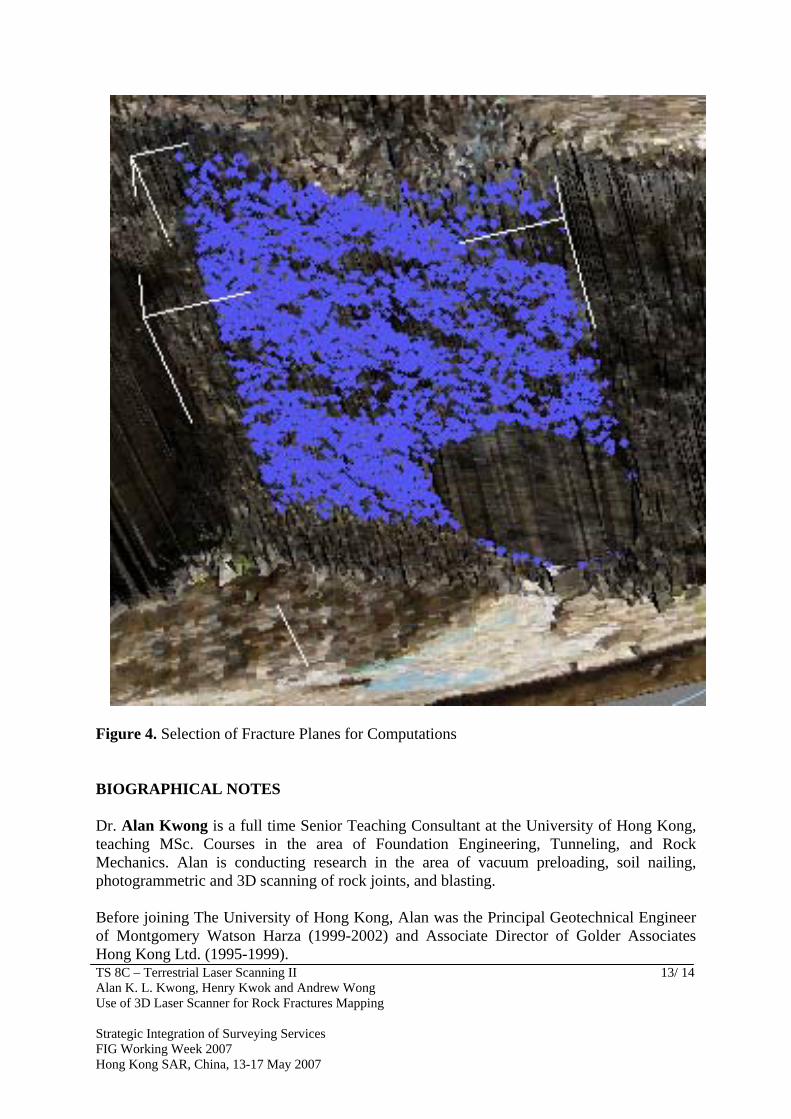
Figure 2 shows the close-up view of a rock block where comparisons of 5 different rock fracture planes are carried out. A photogrammetry program, Leica Photogrammetry Suite (Leica Geosystems, 2003a), was used to produce the orthorectified photos. The camera used was Nikon D70 with a focal length of 35 mm and Charge Coupled Device (CCD) size of 3060 pixel (horizontal) x 2030 vertical pixel (6 Megabytes). Three overlapping photos were used for exterior orientation, and the control points used were the same as that used for registration of point cloud. After interior orientation was defined, exterior orientation (Xo, Yo, Zo, ω, ϕ and κ) was computed based on the known control point coordinates using the bundle block adjustment and additional tie points were generated. These tie points were generated based on some image matching techniques (Leica Geosystems, 2003a). The standard error after bundle block adjustment was less than 1 pixel, indicating that the spatial relationship of all the control points and tie points among the overlapping photos was correctly set. After the triangulation process was completed, the exterior orientation parameters were used for rotating the point cloud to align with the photographic axis. The next step was to create a TIN model (with elevation contoured) using the point cloud. At the same time, one of the photos was orthorectified using the nearest neighbor method in the re-sampling technique. A 2nd-order polynomial was used because the control points and tie points were sufficiently accurate and closely spaced already. After the orthorectified photo is correctly overlain on top of the TIN model as shown in the 3-D Studio Max scene on Figure 3, the final step is simply selecting any plane of interests for orientation computation (see example on Figure 4). A sub-routine program using was written as an added-in module in 3-D Studio Max for selecting and computing the Dip Angle and Dip Direction. Table 2 summarizes the results and compares the Dip Angle and Dip Direction obtained from multivariate regression analysis with that obtained from conventional compass. Examination of Table 2 indicates that for the Dip Angle and Dip Direction, the absolute difference between the two methods is less than 4°. This small discrepancy amongst the two methods is beyond practical significance. 7. SUMMARY AND CONCLUSIONS A prototype system that combines the non-contact measurement technologies of photogrammetric imaging and 3-D laser scanning to create dimensionally accurate and pictorially correct 3 dimensional models and orthoimages of a rock slope is developed. These products allow safely mapping of the structural discontinuities’ orientation (Dip Angle and Dip Direction) and spacing in an exposed rock slope surface, for which the need to erect scaffolding and access to the rock face is reduced. Very high level of accuracy can be achieved based on the illustrative case described. The implications of this successful prototype to the industry is large with the following applications:

TS 8C – Terrestrial Laser Scanning II 9/ 14 Alan K. L. Kwong, Henry Kwok and Andrew Wong Use of 3D Laser Scanner for Rock Fractures Mapping Strategic Integration of Surveying Services FIG Working Week 2007 Hong Kong SAR, China, 13-17 May 2007
– Scaffolding and access to slope surface will be greatly reduced in the investigation stage
resulting in a substantial savings in cost of any slope design program. – Reduce the risk of workers falling from the scaffolding. – Reduce the amount of bamboo used in the construction industry. – Generate a permanent record of the slope via photographs of rock joint surface that are
pictorially correct in 3 dimensional space. – Allow design of slope upgrading works such as concrete buttresses, dowels or bolts
directly drawn on the rectified photographs for construction. – The creation of an accurate 3 dimensional models of the slope for additional
investigations such as boulder falls and natural landslide scar study. – The use of computer visualization methods leads to a much better understanding of the
fracture pattern because the slope features can be viewed from any virtual location, even from inside the slope.
The possible outcome of this research project may include establishing procedures for applying photogrammetry and 3-D laser scanning techniques to other types of slope studies in Hong Kong. This may include identification and measuring of boulder field in natural terrain hazard study and identification and measuring of corestone in soil slope study. The findings from this project will also allow as-built drawings be produced which can couple with true-scaled photographs for inclusion into the slope maintenance manual. ACKNOWLEDGEMENT The authors gratefully acknowledge the scanning carried out by the Hong Kong office of Leica Geosystems. The financial support by the Research Grant No. HKU7147/05E provided by the Research Grants Council of the Hong Kong Special Administrative Region, China is greatly appreciated. REFERENCES Feng, Q. (2001). Novel methods for 3-D semi-automatic mapping of fracture geometry at exposed rock faces. Ph.D. thesis, Department of Civil and Environmental Engineering, Royal Institute of Technology, Stockholm, Sweden, 69p. Kwong, A. K. L. and Lee, C. F. 2007. Mapping of Rock Fractures using 3-D Laser Scanning Technique in an Autodesk 3-D Studio Max Environment. 4th Cross-strait Conference on Structural and Geotechnical Engineering, 24 - 26 April, Zhejiang, Hangzhou. Leica Geosystems. (2003a). Leica Photogrammetry Suite OrthoBASE & OrthoBASE Pro User’s Guide, 516p.

TS 8C – Terrestrial Laser Scanning II 10/ 14 Alan K. L. Kwong, Henry Kwok and Andrew Wong Use of 3D Laser Scanner for Rock Fractures Mapping Strategic Integration of Surveying Services FIG Working Week 2007 Hong Kong SAR, China, 13-17 May 2007
Table 1. Calculation of Dip Direction based on direction of Normal Vector
Conditions Normal Vector Quadrant Dip Direction
0cos0cos,0cos ≥≥≥ ψδλ and Upward North East α
0cos0cos,0cos ≥<≥ ψδλ and Upward South East 180°- α
0cos0cos,0cos ≥<< ψδλ and Upward South West 180°+ α
0cos0cos,0cos ≥≥< ψδλ and Upward North West 360°- α
0cos0cos,0cos <≥≥ ψδλ and Downward North East α
0cos0cos,0cos <<≥ ψδλ and Downward South East 180°- α
0cos0cos,0cos <<< ψδλ and Downward South West 180°+ α
0cos0cos,0cos <≥< ψδλ and Downward North West 360°- α
Table 2. Comparisons of 5 Joint Plane Orientations (compass versus calculated)
From compass From Linear Regression Difference (Compass-Linear Regression)Plane Dip Direction Dip Angle Dip Direction Dip Angle Dip Direction Dip Angle Degree Degree Degree Degree Degree Degree
1 24 82 21 81 3 1 2 9 85 7 83 2 2 3 344 75 340 71 4 4 4 356 6 355 7 1 -1 5 349 15 345 14 4 1

TS 8C – Terrestrial Laser Scanning II 11/ 14 Alan K. L. Kwong, Henry Kwok and Andrew Wong Use of 3D Laser Scanner for Rock Fractures Mapping Strategic Integration of Surveying Services FIG Working Week 2007 Hong Kong SAR, China, 13-17 May 2007
Figure 1. Overall view of Rock Slope and Anchor Blocks at HKU Figure 1. Close-up View of Fractured Rock Planes
See Figure 2 for Close Up

TS 8C – Terrestrial Laser Scanning II 12/ 14 Alan K. L. Kwong, Henry Kwok and Andrew Wong Use of 3D Laser Scanner for Rock Fractures Mapping Strategic Integration of Surveying Services FIG Working Week 2007 Hong Kong SAR, China, 13-17 May 2007
Figure 3. TIN Overlapped on Photo
TIN overlapped with photo
Original photo
TS 8C – Terrestrial Laser Scanning II 13/ 14 Alan K. L. Kwong, Henry Kwok and Andrew Wong Use of 3D Laser Scanner for Rock Fractures Mapping Strategic Integration of Surveying Services FIG Working Week 2007 Hong Kong SAR, China, 13-17 May 2007
Figure 4. Selection of Fracture Planes for Computations BIOGRAPHICAL NOTES Dr. Alan Kwong is a full time Senior Teaching Consultant at the University of Hong Kong, teaching MSc. Courses in the area of Foundation Engineering, Tunneling, and Rock Mechanics. Alan is conducting research in the area of vacuum preloading, soil nailing, photogrammetric and 3D scanning of rock joints, and blasting. Before joining The University of Hong Kong, Alan was the Principal Geotechnical Engineer of Montgomery Watson Harza (1999-2002) and Associate Director of Golder Associates Hong Kong Ltd. (1995-1999).

TS 8C – Terrestrial Laser Scanning II 14/ 14 Alan K. L. Kwong, Henry Kwok and Andrew Wong Use of 3D Laser Scanner for Rock Fractures Mapping Strategic Integration of Surveying Services FIG Working Week 2007 Hong Kong SAR, China, 13-17 May 2007
Alan has over 20 years of experience in the field of slope engineering, foundations and tunneling in Hong Kong and Canada. Henry Kwok is a Technical Engineer at Leica Geosystems Ltd of Hong Kong, working with area of 3D Laser applications in various field and he is specialized in software processing, spatial data analysis and modeling. Henry has over 10 years of experience in Field Surveying Applications. Andrew Wong is a Product Manager at Leica Geosystems Ltd of Hong Kong, working with area of 3D Laser System Applications & Structure Monitoring Survey Instrumentation and he is specialized in Surveying Automation and Monitoring Sensors Applications. Andrew has over 18 years of experience in Surveying Sensors Hardware and Software Applications. CONTACTS Alan K. L. Kwong The University of Hong Kong Room 624 Haking Wong Building Department of Civil Engineering Hong Kong SAR China Tel. +852-2859-2673 Fax +852-2559-5337 Email: [email protected] Henry Kwok Leica Geosystems Ltd of Hong Kong Unit 1701-3, DCH Commercial Centre 25 Westlands Road, Quarry Bay Hong Kong SAR China Tel. +852-2564-2299 Fax +852-2564-4199 Email: [email protected] Andrew Wong Leica Geosystems Ltd of Hong Kong Unit 1701-3, DCH Commercial Centre 25 Westlands Road, Quarry Bay Hong Kong SAR China Tel. +852-2564-2299 Fax +852-2564-4199 Email: [email protected]