usc research comparative analysis of total project cost · pdf filecomparative analysis of...
TRANSCRIPT
Comparative Analysis of Total Project Costs with verses without a Construction Manager Research Report to the CMAA Research and Development Committee From the Departments of Civil Engineering, University of Southern California and California State University, Long Beach Contacts: John A. Kuprenas ([email protected]); Elhami B. Nasr
April 16, 2006
ii
Table of Contents
Introduction 1 Data Sources 1
Analysis – Survey Data 7 Analysis – School Data 14 Best Practices / Lessons Learned 17 Conclusions 18
Appendix I – Survey Questions 19

iii
List of Figures Figure 1. Breakdown of Survey Project Data by the State in which the Project was Built. Figure 2. Breakdown of Survey Project Data by the Client for the Project Figure 3. Breakdown of Survey Project Data by the Type of the Project Figure 4. Breakdown of Management Approach (based on number of projects) Figure 5. Breakdown of Management Approach (based on TPC of projects) Figure 6. Management Cost Influences to Change Orders – Linear Trend Line Figure 7. Management Cost Influences to Change Orders – Logarithmic Trend Line Figure 8. Management Type Influences to Change Orders – Linear Trend Line Figure 9. School Project Management Cost (% of TPC) Influence to Change Orders Figure 10. School Project Management Cost (dollars) Influence to Change Orders Figure 11. School Project Management Cost (dollars) Influence to TPC Variance Figure 12. School Project Management Cost (dollars) Influence to TPC Variance – with
excluded data points

iv
List of Tables Table 1. Survey Project Size and Cost Information Table 2. School District Project Size and Cost Information Table 3. Survey Project Costs Compared Based on Management Table 4. Survey Project Change Costs Compared Based on Management Table 5. Survey Phase in which Management Services are Provided Table 6. Survey Types of Management Practices Provided Table 7. Breakdown of Project Costs – Non-construction Costs Table 8. Breakdown of Project Costs – Construction Costs Table 9. School District Project Costs Table 10. School District Project Change Costs

Page 1 of 28
Introduction A fundamental issue within the construction management profession is demonstration of the value of a construction manager to a project. This research quantifies the project cost savings (measured through either lower change order amounts and/or a lower project total cost) by comparing projects that have varying amounts of management services. The research also identifies types of management services used and includes “best practices” type actions for managers/clients to use to ensure project cost success. A statistical validation of the strengths of the conclusions of the analysis of the research is included. Limitations of this research project are based on the availability of data. The primary source of data for this research is a web-based survey (with telephone follow-up) completed by to CMAA member firms on completed building projects throughout the United States. In addition, through the principal investigator’s association with Vanir Construction Management, the research team was able to access additional project data recently completed public sector education projects from Southern California. Data Sources Data for the research was obtained from a survey of CMAA member companies with date submitted from 01/17/06 to 03/27/06. The National Office of the CMAA sent the survey notice and a reminder follow-up email in February and March respectively. The Principal Investigator from USC answered questions regarding the survey online and by phone (about a dozen total inquires). A total of 219 surveys were submitted of which only 24 were complete in terms of usable cost date in order to allow true analysis. All surveys were done online through the survey site “zoomerang.com””. The survey consisted of 40 questions (shown in Appendix I). The survey was broken into thee sections – collection of basic project data (location and size), detailed project costs (by phase and activity), and detailed management costs and processes (by phase and services). Unfortunately, each section of the survey contained less complete information. For example, nearly 100 completed surveys included the complete section one information. Only 24 data points included the section two information, and only a few data points included the complete section three information. In order to obtain better results in future research, perhaps even a shorter survey should be used in future CMAA research projects.
Instructions for the survey were included in the survey and were also included in the solicitation. The introduction explained that the objective of this research is to quantify the total project cost savings by comparing total project costs on projects that do and projects that do not use professional construction management. Respondents were instructed to:
Complete at least 5 surveys (5 separate projects)
Provide only data on complete ed, new construction, building projects procured using a traditional design-bid-build method
Provide data on not necessarily for their “best” projects, but for a representative sample of projects based on typical types of projects and types of services
The respondents were also informed that:

Page 2 of 28
Each survey (each project) should probably take 10 to 30 minutes complete, but that one did not have data to answer every question on the survey since the survey is designed to drill down to very specific information.
All project data would be confidential, but all survey participants would be emailed the research results.
Characteristics of the survey data set are shown in Figure 1 to 3 on the next pages. Figure 1 shows the project locations. The figure shows that large majority of the completed projects are from California with over 75% of the projects from the Western United States. Figure 2 shows the breakdown of the client for the project with the majority of the projects being Government projects (47%) and Private Sector (37%). All projects in the date set are building projects, and Figure 3 shows the specific type of project. The figure shows about 1/3 of the projects are educational/institutional and 1/3 of the projects are other (defined to be a building project but not a educational/institutional, housing/lodging, healthcare, corporate, developer project). The figure also shows 18% corporate projects. One important question on the survey is whether manager on the project was an Outside Consultant project/construction manager or an In-house manager (someone who works for the agency constructing the building project). In addition, for projects that used In-house management, another important question was whether the In-house manager had any additional duties beyond managing the project. Figure 1. Breakdown of Survey Project Data by the State in which the Project was Built.
California69%
Colorado2%
Idaho2%
Illinois2%
Massachusetts5%
New York3%
Missouri3%
Ohio2%
Canada2%
Arizona2%
Oregon2%
Texas4%
Washington2%

Page 3 of 28
Government47%
Mixed5%
Other11%
Private Sector37%
Figure 2. Breakdown of Survey Project Data by the Client for the Project Figure 3. Breakdown of Survey Project Data by the Type of the Project
Corporate18%
Developer2%
Education/Institutional32%
Healthcare5%
Housing/Lodging12%
Other31%

Page 4 of 28
Table 1 shows the project size (measured in squre feet) and total project cost (measured in dollars) for the project data used in all of the research. The table shows a wide range of project sizes (from 1,035 s.f. to 1,500,000 s.f.) and total project costs (from $80,000 to $350,000,000). The table also subdivides the data into projects managed by In-house and Outside Managers and projects without a manager. On average, the largest projects (measured through square feet or dollars of TPC) are managed by Outside Consultant Managers and the smallest projects do not use a manager (either Outside or In-house). Table 1. Survey Project Size and Cost Information
Project Square Feet Total Project Cost (TPC)
42 65
156,112 $47,676,558
1,500,000 $350,000,000
1,035 $80,000
Number of Data Points 20 29
Average Value 230,744 $53,150,272
Maximum Value 1,500,000 $350,000,000
Minimum Value 5,500 $1,837,000
Number of Data Points 17 26
Average Value 99,402 $50,753,015
Maximum Value 300,000 $290,000,000
Minimum Value 6,000 $1,200,000
Number of Data Points 5 10
Average Value 50,397 $23,804,000
Maximum Value 200,000 $120,000,000
Minimum Value 1,035 $80,000
Measure
In-house Manager
No Manager
Outside Consultant Manager
Number of Data Points
Average Value
Maximum Value
Minimum Value
Page 5 of 28
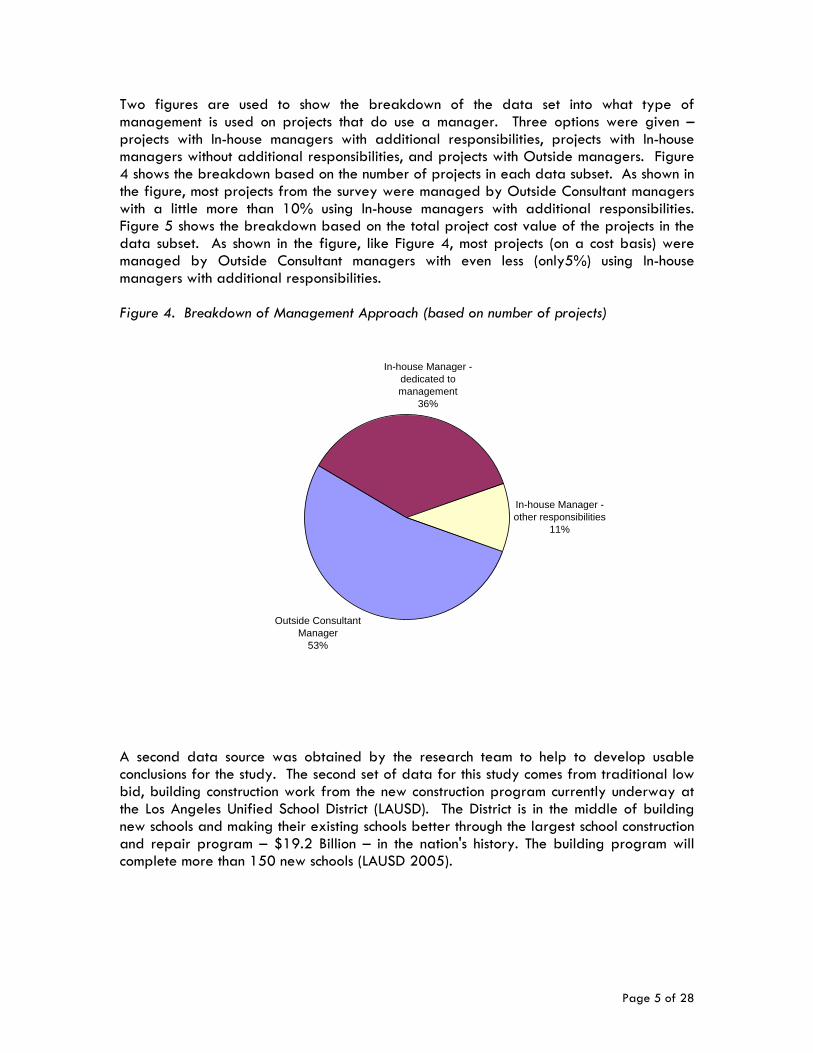
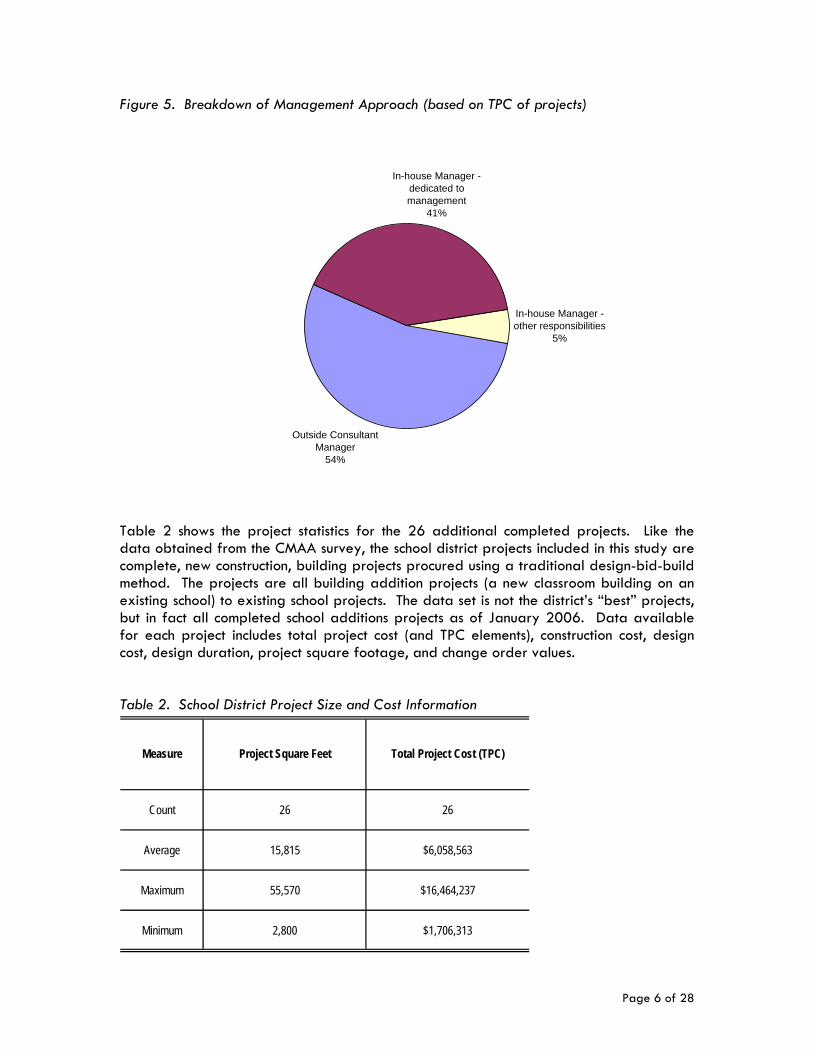
Two figures are used to show the breakdown of the data set into what type of management is used on projects that do use a manager. Three options were given – projects with In-house managers with additional responsibilities, projects with In-house managers without additional responsibilities, and projects with Outside managers. Figure 4 shows the breakdown based on the number of projects in each data subset. As shown in the figure, most projects from the survey were managed by Outside Consultant managers with a little more than 10% using In-house managers with additional responsibilities. Figure 5 shows the breakdown based on the total project cost value of the projects in the data subset. As shown in the figure, like Figure 4, most projects (on a cost basis) were managed by Outside Consultant managers with even less (only5%) using In-house managers with additional responsibilities. Figure 4. Breakdown of Management Approach (based on number of projects)
Outside Consultant Manager
53%
In-house Manager - dedicated to management
36%
In-house Manager - other responsibilities
11%
A second data source was obtained by the research team to help to develop usable conclusions for the study. The second set of data for this study comes from traditional low bid, building construction work from the new construction program currently underway at the Los Angeles Unified School District (LAUSD). The District is in the middle of building new schools and making their existing schools better through the largest school construction and repair program – $19.2 Billion – in the nation's history. The building program will complete more than 150 new schools (LAUSD 2005).
Page 6 of 28
Figure 5. Breakdown of Management Approach (based on TPC of projects)
Outside Consultant Manager
54%
In-house Manager - dedicated to management
41%
In-house Manager - other responsibilities
5%
Table 2 shows the project statistics for the 26 additional completed projects. Like the data obtained from the CMAA survey, the school district projects included in this study are complete, new construction, building projects procured using a traditional design-bid-build method. The projects are all building addition projects (a new classroom building on an existing school) to existing school projects. The data set is not the district’s “best” projects, but in fact all completed school additions projects as of January 2006. Data available for each project includes total project cost (and TPC elements), construction cost, design cost, design duration, project square footage, and change order values. Table 2. School District Project Size and Cost Information
Measure Project Square Feet Total Project Cost (TPC)
Count 26 26
Average 15,815 $6,058,563
Maximum 55,570 $16,464,237
Minimum 2,800 $1,706,313

Page 7 of 28
Analysis – Survey Data Analysis consists of comparisons of project cost performance under different management conditions. Table 3 compares non-construction, construction, and construction management costs based on the type of manager for the survey data set. The table shows that management costs (expressed as a percentage of total project cost) are on average lower for projects that use Outside Consultant managers than for projects that use In-house managers. The table also shows that non-construction and construction costs are nearly the same regardless of management use (even the use of no manager). Table 3. Survey Project Costs Compared Based on Management
Non Construction Cost as a
Percentage of TPC
Construction Cost as a
Percentage of TPC
Construction Management Cost
as a Percentage of TPC
24 24 28
20.89% 79.11% 4.82%
40.00% 94.35% 14.44%
5.65% 60.00% 0.63%
Number of Data Points 16 16 14
Average Value 21.17% 78.83% 4.63%
Maximum Value 40.00% 94.35% 10.11%
Minimum Value 5.65% 60.00% 2.03%
Number of Data Points 7 7 14
Average Value 20.37% 79.63% 5.02%
Maximum Value 35.00% 90.00% 14.44%
Minimum Value 10.00% 65.00% 0.63%
Number of Data Points 1 1 0
Average Value 20.00% 80.00% 0.00%
Maximum Value 20.00% 80.00% 0.00%
Minimum Value 20.00% 80.00% 0.00%
Measure
Number of Data Points
Average Value
Maximum Value
Minimum Value
Outside Consultant Manager
In-house Manager
No Manager

Page 8 of 28
Table 4 compares change order values (in dollars and as a percentage of construction value based on the type of manager for the survey data set. The table shows an average change order value of 7.50% (which is within industry standards for building projects). The table also shows the average change order value to be much higher for projects managed by In-house managers (10.90%) as compared to projects managed by Outside managers (6.20%). No change order data was reported through the survey for projects that did not use a manager, and the data set for projects for In-house manager change orders was already too small to try to differentiate based on whether the manager had additional responsibilities or was only performing management duties. Table 4. Survey Project Change Costs Compared Based on Management
Change Order ValueChange Order Amount as
a Percentage of Construction Value
18 20
$1,408,341 7.50%
$16,700,000 34.43%
$184 0.50%
Number of Data Points 13 14
Average Value $547,022 6.20%
Maximum Value $5,404,729 21.24%
Minimum Value $184 1.00%
Number of Data Points 5 6
Average Value $3,647,771 10.90%
Maximum Value $16,700,000 34.43%
Minimum Value $45,000 0.50%
Number of Data Points 0 0
Average Value NA NA
Maximum Value NA NA
Minimum Value NA NA
Measure
Number of Data Points
Average Value
Maximum Value
Minimum Value
Outside Consultant Manager
In-house Manager
No Manager

Page 9 of 28
The survey also collected very limited data to identify the project phases when management services were provided and what management practices were included in the services. Table 5 shows the phase in which the services were provided. Not unexpectedly, the large majority (over 90%) of management services are provided in the construction phase (based on percentage of total expenditures for the services). Table 6 shows that project management, project/contract administration, and other (constructability review, partnering, etc.) were the management practices used in performing the management services. Table 5. Survey Phase in which Management Services are Provided
Project Phase Percentage
Pre-design 1.00%
Design 4.00%
Bid / Procurement 1.00%
Construction Phase 91.00%
Close-out / Occupancy 2.00%
Other 1.00%
Table 6. Survey Types of Management Practices Provided
Management Practice Percentage
Project Management 27.5%
Scheduling 5.0%
Cost Management / Estimating 7.5%
Quality Assurance 7.5%
Contract/project administration 20.0%
Other (Construct. Review, Partnering, etc.) 27.5%

Page 10 of 28
Tables 7 and 8 show a further breakdown of project costs. Figure 7 shows the three elements included in the non-construction costs, and Figure 8 shows the two elements included in the construction project costs. The tables show on average a 20-80 relationship for the non-construction – construction cost breakdown. The highest individual value is the construction cost element of the construction contract. The management cost is included in the construction contract cost (based on the way the survey asked these questions). All of these values are as expected and consistent with industry norms. Table 7. Breakdown of Project Costs – Non-construction Costs
Pre-design Phase Design PhaseBid / Procurement
Phase
12 12 12
5.97% 10.04% 6.10%
15.00% 21.28% 10.00%
1.68% 4.00% 1.04%
Measure
Number of Data Points
Average Value
Maximum Value
Minimum Value
Table 8. Breakdown of Project Costs – Construction Costs
Construction Contract Change Orders
20 20
72.88% 6.28%
92.46% 28.92%
49.27% 0.45%
Measure
Number of Data Points
Average Value
Maximum Value
Minimum Value

Page 11 of 28
Similar tables were also created for the school district data set, but fewer conclusions can be learned form these table since the only one type of management (staff augmentation In-house) was used on all of the projects in the data set. Table 9 compares non-construction and management costs for the school district data set. The table shows that management costs (expressed as a percentage of total project cost) were significantly higher than the survey projects. This is undoubtedly because the school district projects have a project manager throughout all project phases while the survey projects have much more management emphasis during construction phase (as shown in Table 5). Table 10 shows change order values (in dollars and as a percentage of construction value) for the school district data set. The table shows an average change order value of 6.20% which is less than the 7.50% from all projects in the survey but exactly the same as the survey data set value for projects managed by Outside managers. Table 9. School District Project Costs
MeasureConstruction Cost
(CC)Management Cost
Management Cost as a
Percentage of TPC
Count 26 26 26
Average $3,974,232 $631,272 12.50%
Maximum $12,061,755 $1,635,417 29.42%
Minimum $733,927 $170,007 6.51%
Table 10. School District Project Change Costs
Measure Change Order ValueChange Orders
(Percentage of CC)
Final TPC variance (Percentage of Original TPC)
Count 26 26 26
Average $169,702 6.20% -2.17%
Maximum $461,025 19.70% 12.23%
Minimum -$8,099 -0.26% -28.30%

Page 12 of 28
Correlation plots with statistical test were used to test relationships between project costs and management variables. Figure 6 examines the relationship between management and change orders. The x-axis of the figure is management cost (measured as a percentage of total project cost). The y-axis of the figure is change orders (measured as a percentage of the construction value). The figure shows a weak negative correlation. A statistical best fit line is also shown providing a slope of -0.8896, which means for every extra percentage of management cost, change orders will go down 0.89% (of construction cost). The figure also shows a correlation coefficient value (R2) of 0.1063. This value does not prove a statistical correlation, but is a strong value based on construction research standards. A R2 value of1.00 would mean a perfect correlation (all points on the line). A R2 value of 0.00 would mean no correlation (all points random). The figure’s value of 0.1063 means that a correlation exists but other variables are influencing the relationship (i.e. type of service, management practices, phase of service, design quality, etc.). The line is also based a linear relationship. Examining the small number of points on the chart, it appears that a threshold value for management costs of 3% to 4% of TPC is needed to be reached in order to control changes. Costs spent above the threshold value may have less impact on change costs; costs spent below this value appear to have a strong influence on change costs. Based on this threshold concept, a non-linear relationship may exist. Other practices within the construction industry have been proven to have non-linear relationships. Most researched is the learning curve concept which is based on a logarithmic relationship between output and repetitions. Figure 7 shows the same data but with a logarithmic trend line. Note the correlation is slightly better in this figure as compared to Figure 6. This figure supports the idea of a management services threshold to control change costs.
y = -0.8896x + 0.1034
R2 = 0.1063
0.00%
5.00%
10.00%
15.00%
20.00%
25.00%
0.00% 2.00% 4.00% 6.00% 8.00% 10.00% 12.00%
Management Cost (% of TPC)
Ch
ang
e O
rder
s (%
of
Co
nst
. V
alu
e)
Figure 6. Management Cost Influences to Change Orders – Linear Trend Line
Page 13 of 28
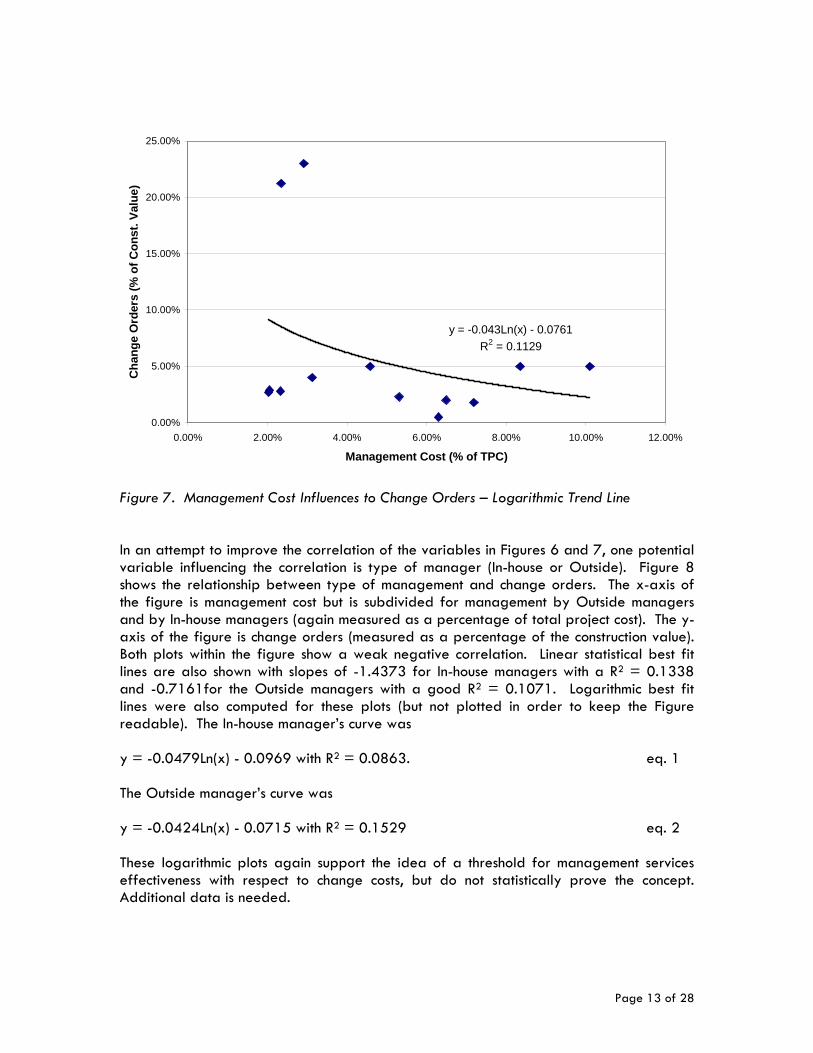
y = -0.043Ln(x) - 0.0761
R2 = 0.1129
0.00%
5.00%
10.00%
15.00%
20.00%
25.00%
0.00% 2.00% 4.00% 6.00% 8.00% 10.00% 12.00%
Management Cost (% of TPC)
Ch
ang
e O
rder
s (%
of
Co
nst
. Val
ue
)
Figure 7. Management Cost Influences to Change Orders – Logarithmic Trend Line In an attempt to improve the correlation of the variables in Figures 6 and 7, one potential variable influencing the correlation is type of manager (In-house or Outside). Figure 8 shows the relationship between type of management and change orders. The x-axis of the figure is management cost but is subdivided for management by Outside managers and by In-house managers (again measured as a percentage of total project cost). The y-axis of the figure is change orders (measured as a percentage of the construction value). Both plots within the figure show a weak negative correlation. Linear statistical best fit lines are also shown with slopes of -1.4373 for In-house managers with a R2 = 0.1338 and -0.7161for the Outside managers with a good R2 = 0.1071. Logarithmic best fit lines were also computed for these plots (but not plotted in order to keep the Figure readable). The In-house manager’s curve was y = -0.0479Ln(x) - 0.0969 with R2 = 0.0863. eq. 1 The Outside manager’s curve was y = -0.0424Ln(x) - 0.0715 with R2 = 0.1529 eq. 2 These logarithmic plots again support the idea of a threshold for management services effectiveness with respect to change costs, but do not statistically prove the concept. Additional data is needed.

Page 14 of 28
y = -1.4373x + 0.1217
R2 = 0.1338
y = -0.7161x + 0.097
R2 = 0.1071
0.00%
5.00%
10.00%
15.00%
20.00%
25.00%
0.00% 2.00% 4.00% 6.00% 8.00% 10.00% 12.00%
Management Cost (% of TPC)
Ch
an
ge
Ord
ers
(%
of
Co
ns
t. V
alu
e)
Outside Managers In-house ManagersLi (I h M ) Li (O t id M )
Figure 8. Management Type Influences to Change Orders – Linear Trend Line Analysis – School Data Given the availability of a second data set, similar correlation plots were created for the school district data to validate the survey. Figure 9 examines the relationship between management and change orders for the school district building additions projects. The plot axes are identical to Figure 6 with the x-axis of the figure measuring management cost (measured as a percentage of total project cost) and the y-axis measuring change orders (measured as a percentage of the construction value). The figure shows no correlation. A statistical best fit line shows an R2 value of nearly zero (0.0036). Figure 10 also examines the relationship between management and change orders for the school district building additions projects but with a different x-axis variable measure. The x-axis of the figure is still management cost but is now measured as a dollars spent on management. The y-axis remains the value of change orders (measured as a percentage of the construction value. Interestingly, as expected based on Figure 6 but not expected based on Figure 9, the plot shows a weak negative correlation with a poor R2 = 0.0816. It appears that in the case of the school district data, other variables are influencing the correlation. Recall that Table 9 showed that management costs for the school district data set were significantly higher than for the survey projects because the school district projects have managers throughout all project phases. This is likely a significant impact to the management/change cost correlation since management costs could be highly impacted by numerous non-construction project activities (i.e. project re-design, project re-bidding, etc.).

Page 15 of 28
y = 6.5056x + 5.3945
R2 = 0.0036
-5
0
5
10
15
20
25
0.00% 5.00% 10.00% 15.00% 20.00% 25.00% 30.00% 35.00%
Management Cost (% of TPC)
Ch
ang
e O
rder
s (%
of
Co
nst
. Val
ue)
Figure 9. School Project Management Cost (% of TPC) Influence to Change Orders
y = -5E-06x + 9.6196
R2 = 0.0816
-5
0
5
10
15
20
25
- 200,000 400,000 600,000 800,000 1,000,000 1,200,000 1,400,000 1,600,000 1,800,000
Management Cost ($)
Ch
ang
e O
rder
s (%
of
Co
nst
. V
alu
e)
Figure 10. School Project Management Cost (dollars) Influence to Change Orders

Page 16 of 28
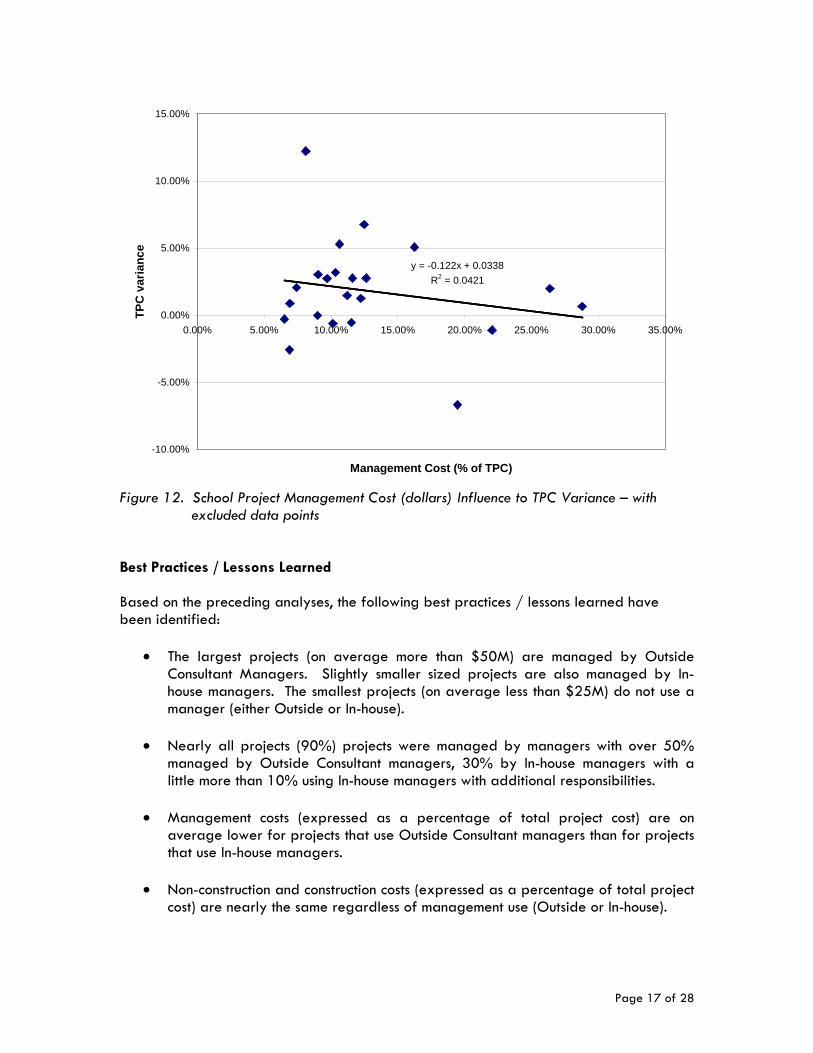
Given that the school district manager is managing a project from the pre-design phase onward, one may expect that increased management cost would improve total project cost. Figure 11 tests this hypothesis. Figure 11 shows the relationship between management and total project cost. The x-axis of the figure is management cost (measured as a percentage of total project cost). The y-axis of the figure is change in total project cost (measured as a percentage change from the original budget for total project cost). The correlation coefficient for the best fit linear line is nearly zero (0.0005) but it appears that four data points may be deemed outliers (perhaps a down scope of the project) or are costs expenditure records that were in the original budget. Figure12 shows the same analysis but excluding these three points from the analysis data set. Figure 12 shows the revised plot with x-axis of the figure is management cost (measured as a percentage of total project cost). The y-axis of the figure is change in total project cost (measured as a percentage change from the original budget for total project cost). The correlation coefficient for the best fit linear line is still poor (0.0421). The low R2 values for Figures 11 and 12 show the difficulty of analysis of project data when examining the entire cost of a project. A project is a complex, long term endeavor with dozens of people and sub-processes all significantly contributing the process. Any analysis hoping to achieve a strong correlation value would need enough data to make all variables equal expect for a critical few under analysis. For the dozens of major potential influences on a typical project, this requirement for a strong correlation would require thousands of data points so that an analysis subset of projects with dozens of common variables could be extracted.
y = 0.038x - 0.0264
R2 = 0.0005
-35.00%
-30.00%
-25.00%
-20.00%
-15.00%
-10.00%
-5.00%
0.00%
5.00%
10.00%
15.00%
0.00% 5.00% 10.00% 15.00% 20.00% 25.00% 30.00% 35.00%
Management Cost (% of TPC)
TP
C v
aria
nc
e
Figure 11. School Project Management Cost (dollars) Influence to TPC Variance
Page 17 of 28
y = -0.122x + 0.0338
R2 = 0.0421
-10.00%
-5.00%
0.00%
5.00%
10.00%
15.00%
0.00% 5.00% 10.00% 15.00% 20.00% 25.00% 30.00% 35.00%
Management Cost (% of TPC)
TP
C v
aria
nc
e
Figure 12. School Project Management Cost (dollars) Influence to TPC Variance – with
excluded data points Best Practices / Lessons Learned Based on the preceding analyses, the following best practices / lessons learned have been identified:
The largest projects (on average more than $50M) are managed by Outside Consultant Managers. Slightly smaller sized projects are also managed by In-house managers. The smallest projects (on average less than $25M) do not use a manager (either Outside or In-house).
Nearly all projects (90%) projects were managed by managers with over 50%
managed by Outside Consultant managers, 30% by In-house managers with a little more than 10% using In-house managers with additional responsibilities.
Management costs (expressed as a percentage of total project cost) are on
average lower for projects that use Outside Consultant managers than for projects that use In-house managers.
Non-construction and construction costs (expressed as a percentage of total project
cost) are nearly the same regardless of management use (Outside or In-house).

Page 18 of 28
The average change order value (expressed as a percentage of construction contract value) is much higher for projects managed by In-house managers (10.90%) as compared to projects managed by Outside managers (6.20%). No change order data was reported through the survey for projects that did not use a manager.
The large majority (over 90%) of management services are provided in the
construction phase (based on percentage of total expenditures for the services). (Note: based on limited data)
Project management and project/contract administration were the most common
management practices. Scheduling, estimating, and QA/QC were much less commonly used. (Note: based on limited data)
A correlation exists between management costs (both Outside and In-house) and
value of construction change orders. A linear statistical best fit line provides a slope of -0.8896, which means for every extra percentage of management cost, change orders will go down 0.89% (of construction cost).
A threshold value for management costs of 3% to 4% of TPC is needed to be
reached in order to control changes. Costs spent above the threshold value may have less impact on change costs; costs spent below this value appear to have a strong influence on change costs. Based on this threshold concept, a non-linear relationship (logarithmic) may exist.
No correlation was found to exist between management cost and change in total
project cost (measured as a percentage change from the original budget for total project cost).
Conclusions This research project has analyzed data obtained from an online CMAA member survey done in early 2006 and data from completed building addition projects done within the Los Angeles Unified School District. The analysis has found a correlation between management cost and value of construction change orders. The researchers suggest that a threshold value for management costs of 3% to 4% of TPC is needed to be reached in order to control changes. Costs spent above the threshold value may have less impact on change costs; costs spent below this value appear to have a strong influence on change costs. Based on this threshold concept, a non-linear relationship (logarithmic) may exist. No correlation was found to exist between management cost and change in total project cost (measured as a percentage change from the original budget for total project cost). A significant limitation to this research project was the lack of data. Future research project should attempt to expand upon the initial conclusions of this study through collection and analysis of more data ad should attempt to identify specific management practices influence on all project costs
Page 19 of 28
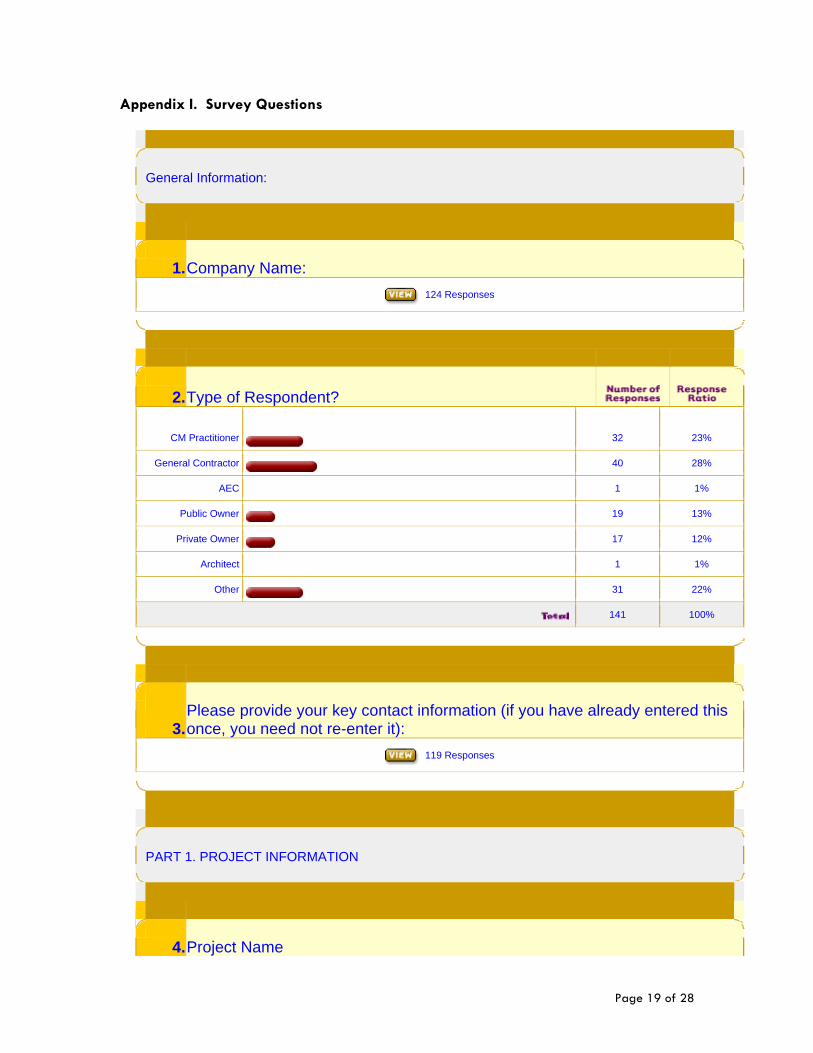
Appendix I. Survey Questions
General Information:
1.Company Name:
124 Responses
2.Type of Respondent?
CM Practitioner
32 23%
General Contractor
40 28%
AEC 1 1%
Public Owner
19 13%
Private Owner
17 12%
Architect 1 1%
Other
31 22%
141 100%
3.Please provide your key contact information (if you have already entered this once, you need not re-enter it):
119 Responses
PART 1. PROJECT INFORMATION
4.Project Name

Page 20 of 28
132 Responses
5.Project Description? Type in description of project
136 Responses
6.Project Location? Please, Type in State.
135 Responses
7.Project Location? City
135 Responses
8.Clientele (select one)?
Government
53 38%
Private Sector
62 45%
Mixed 5 4%
Other
18 13%
138 100%
9.Project Timing? Date (Month / Year)
120 Responses

Page 21 of 28
10.Type of Project (select category)?
Healthcare
7 4%
Housing/Lodging 33 21%
Developer
7 4%
Corporate/administrative/commercial 22 14%
Education/Institutional 46 29%
Other 41 26%
156 100%
11.If the project is healthcare, what is the sub-category of theproject?
Hospital
3 60%
Clinic/outpatient facility
0 0%
Medical Office
0 0%
Extended Care/nursing
0 0%
Other
2 40%
5 100%
12.If the project is Housing/Lodging, what is the sub-category of the project?
Hotel/Motel
2 6%
Apartment/Condominiums
8 24%
Single Family
17 52%
Custom
5 15%
Other
1 3%
33 100%

Page 22 of 28
13.If the project is Developer, what is the sub-category of the project?
High-rise office building
0 0%
Mid-rise office building
0 0%
Low-rise office building
2 33%
Shopping Malls (enclosed)
1 17%
Strip Shopping Centers
0 0%
Other
3 50%
6 100%
14.If the project is Corporate / Administrative / Commercial, what is the sub-category of the Project?
General Offices
6 27%
Retail Stores
3 14%
Restaurants
2 9%
Other
11 50%
22 100%
15.If the project is Education/Institutional, what is the sub-category of the project?
Classrooms
29 64%
Science/research labs
4 9%
Dormitories
0 0%
Sports/athletic facilities
3 7%
Other
9 20%
45 100%
16.If the project is considered as Other, Please describe your project?

Page 23 of 28
33 Responses
PART 2: PROJECT SIZE / COST INFORMATION
17.Project Size (fill in values- use NA (Not Applicable) as needed)?
126 Responses
Total Project Cost and Cost by Phase (fill in $ or use % - indicate which phases are included in the total project cost.
18.What is the Total Project Cost (in dollars)? This is the cost for all elements of the project (i.e. design, procurement, etc.) - not just construction.
107 Responses
19.Do you know the Cost Breakdown Percentage (%)?
Yes
46 29%
No
110 71%
156 100%
Project Cost Breakdown (%) Information

Page 24 of 28
20.What is the Cost Breakdown by Phase (% of total project cost)?
40 Responses
21.Do you know the cost breakdown for non-construction costs?
Yes
35 76%
No
11 24%
46 100%
22.What is the cost breakdown for non-construction costs (% of total project costs)?
28 Responses
23.Do you know the breakdown of the pre-design, design, bid / procurement costs?
Yes
18 51%
No
17 49%
35 100%
24.What is the cost breakdown of the Pre-design Phase (%)?
10 Responses
25.What is the cost breakdown of the Design Phase (%)?
10 Responses

Page 25 of 28
26.What is the cost breakdown of the Bid / Procurement Phase (%)?
10 Responses
27.Do you know the cost breakdown for construction costs (i.e. change order amount)?
Yes
35 76%
No
11 24%
46 100%
28.What is the cost breakdown of Construction phase (%)?
29 Responses
PART 3: CM SERVICES INFORMATION
29.Did the project use project / construction / program management services?
Yes
104 67%
No
52 33%
156 100%
30.Were the management services provided by In-house

Page 26 of 28
staff or Outside Consultants?
In-house Staff
49 47%
Outside Consultants
60 58%
31.
Were the In-house staff considered to be dedicated management staff (i.e. they had no other significant duties other than the management of the project)?
Yes
38 78%
No
11 22%
49 100%
32.What type of contract was used to pay the Outside firm providing management consulting services?
Negotiated fixed fee
19 40%
Lump sum bid
1 2%
Cost plus fixed fee 7 15%
Time spent (with maximum or timeand materials)
7 15%
Percentage of construction contract 11 23%
Other 3 6%
48 100%
33.Who provided the Outside management consulting services?
Professional Management Firm
20 36%
Contractor / CM firm 21 38%
A/E / CM firm(extension of services) 13 24%
Other
1 2%

Page 27 of 28
55 100%
34.Who performed the Outside Consultant management services (please explain "other")?
1 Responses
35.What is the total cost of PM / CM / Management Services ($)?
61 Responses
36.
Do you know the breakdown of the PM /CM / Management services across types of services (i.e. scheduling or estimating)
Yes
14 13%
No
90 87%
104 100%
37.What is the approximate breakdown of PM / CM / Management services (% of total cost of services)?
6 Responses
38.Do you know the breakdown of the PM / CM / Management services cost into the project phases?
Yes
11 79%
No
3 21%

Page 28 of 28
14 100%
39.What is the Cost breakdown of the PM / CM / Management cost across the following phases (%)?
4 Responses
40.
THANKS FOR ADDING A PROJECT TO THE DATABASE! Please use the space below to add any additional comments. To add another project, just restart the survey.
39 Responses
Copyright ©1999-2006 MarketTools, Inc. All Rights Reserved. No portion of this site may be copied without the express written consent of MarketTools, Inc. T