usaid/pakistan: tradepdf.usaid.gov/pdf_docs/pa00k24p.pdf · usaid/pakistan: trade ... economic and...
TRANSCRIPT

1
USAID/PAKISTAN: TRADE
UNAUTHORIZED TRADE BETWEEN PAKISTAN AND AFGHANISTAN
A Preliminary Assessment of its Extent and Economic Impact
April 24, 2010
APRIL 2010
This publication was produced for review by the United States Agency for International Development. It was prepared by the
USAID/Pakistan Trade Project.

USAID/PAKISTAN: TRADE
UNAUTHORIZED TRADE BETWEEN PAKISTAN
AND AFGHANISTAN: A Preliminary Assessment of its
Extent and Economic Impact1
Contract # EEM-I-00-07-00005
April 24, 2010
USAID/Pakistan: Trade Project
House 02 • Street 16
Sector F-6/2 • Islamabad
Phone +92 51 8438280 – 84
1 This draft was prepared under the USAID Pakistan Trade Project being implemented by Deloitte. The views
and opinions included are those of the authors and should not be attributed in any way to USAID or any agency
of the US government, the governments of Pakistan and Afghanistan.
USAID/Pakistan: Trade Project | UNAUTHORIZED TRADE BETWEEN PAKISTAN
AND AFGHANISTAN: A Preliminary Assessment of its Extent and Economic Impact
ii
CONTENTS
TABLE OF TABLES .......................................................................................................................................................... iii
ACRONYMS ...................................................................................................................................................................... iv
EXECUTIVE SUMMARY .................................................................................................................................................. 1
INTRODUCTION ............................................................................................................................................................ 6
CURRENT STRUCTURE OF AFGHAN TRANSIT TRADE .................................................................................. 9
FACTS ABOUT THE UNAUTHORIZED TRADE ................................................................................................. 17
THE TRADING/ECONOMIC ENVIRONMENT .................................................................................................... 21
RECOMMENDATIONS ................................................................................................................................................. 28
APPENDIX – I: AFGHAN TRANSIT TRADE THROUGH KARACHI AND PORT QASIM: By HS
Section and Chapter (In Pak Rupees) ......................................................................................................................... 32

USAID/Pakistan: Trade Project | UNAUTHORIZED TRADE BETWEEN PAKISTAN
AND AFGHANISTAN: A Preliminary Assessment of its Extent and Economic Impact
iii
TABLE OF TABLES
Table 1Trade with Pakistan ....................................................................................................... 7
Table 2: Afghan Transit Trade through Karachi and Port Qasim: High Level Aggregation
(Millions of Rupees) .................................................................................................................... 10
Table 3: Afghan Transit Trade through Karachi and Port Qasim: High Level Aggregation
(Millions of US Dollars) ............................................................................................................... 11
Table 4: Afghan Transit Trade through Karachi and Port Qasim: Nominal and Real Growth
Rates 2007/08 to 2008/09 (Percentages) .................................................................................. 11
Table 5: Recorded Afghan Imports (Millions of Afghanis) ......................................................... 13
Table 6: Relationship between Total Afghan Imports and Transit Trade (Millions of US Dollars
and Percentages) ........................................................................................................................ 14
Table 7: Relationship between Total Afghan Imports and Transit Trade (Millions of US Dollars
and Percentages) ........................................................................................................................ 16
Table 8 : Typical un-authorized goods .................................................................................... 19
Table 9: Afghanistan Tariff Rate Structures ............................................................................. 22
Table 10: Afghanistan and Pakistan Tariff Rate Differential for Transit Goods (2008/09) ..... 24
Table 11: Goods Seized by Pakistan Customs in 2007 and 2008 (Rupees and Percentages) ... 25

USAID/Pakistan: Trade Project | UNAUTHORIZED TRADE BETWEEN PAKISTAN
AND AFGHANISTAN: A Preliminary Assessment of its Extent and Economic Impact
iv
ACRONYMS
ACD Afghan Customs Department
APTTA Afghanistan Pakistan Transit Trade Agreement
ATTA Afghanistan Transit Trade Agreement
FAO Food and Agriculture Organization
FY Fiscal Year
GDP Gross Domestic Product
GoP Government of Pakistan
IMF International Monetary Fund
MFN Most Favored Nation
MoC Ministry of Commerce
N/A Non-Applicable
NGO Non-Governmental Organization
NLC National Logistic Cell
NWFP North West Frontier Province
PCD Pakistan Customs Department
PTP Pakistan Trade Project
ROZ Reconstruction Opportunity Zones
SAARC South Asian Association for Regional Corporation
SAFTA South Asia Free Trade Area
SRO Statutory Regulatory Orders
SY Solar Year
UAE United Arab Emirates
UN United Nations
US United States
USAID United States Agency for International Development
USD United States Dollars
USG United States Government
WB World Bank

USAID/Pakistan: Trade Project | UNAUTHORIZED TRADE BETWEEN PAKISTAN
AND AFGHANISTAN: A Preliminary Assessment of its Extent and Economic Impact 1
EXECUTIVE SUMMARY
BACKGROUND The governments of Pakistan and Afghanistan are currently at the final stage of negotiations for the
historic Afghanistan Pakistan Transit Trade Agreement (APTTA), a far-reaching successor to the
1965 Afghanistan Transit Trade Agreement (ATTA). APTTA will not only boost trade between the
two countries, but it will also help lay the foundation for greater economic integration between the
economies in Central Asia and South Asia –one of the least integrated regions in the World. Closer
economic relations between the South and Central Asian regions make intuitive sense. Central Asia
has some of the highest reserves of oil and natural gas, and it is also major source for industrial raw
materials like bauxite and iron ore. South Asia is home to around 1.5 billion consumers who
increasingly demand more energy and other industrial products. In essence, South Asia is the natural
growth market for Central Asia and East Asian countries. For Pakistan, the successful
implementation of APTTA would provide the opportunity to develop, over the longer run, as a
trade and investment hub linking business networks in South and East Asia, Middle-East, and Central
Asia. For Afghanistan, it would provide the external markets that are essential for a small economy
to achieve sustainable levels of economic growth.
A paper produced for the USAID entitled “The Economic Impact of APTA on Pakistan”2 has argued
that APTTA offers significant gains to Pakistan in the short-run, and in the medium to long-term. It
has also argued that the implementation of APTTA will ensure that unauthorized trade flowing into
both Pakistan and Afghanistan will be substantially reduced with greater surveillance and control at
the critical border posts. This paper draws heavily from the analysis provided in the earlier USAID
paper.
An issue often raised in the negotiations has been the impact of ‘unauthorized trade’, on the
Pakistan’s economy, whereby goods that enter Pakistan for transit to Afghanistan are diverted to the
Pakistani domestic market, and goods that legally enter the Afghanistan market are illegally diverted
to Pakistan (re-exported) to avoid higher import tariffs. The conclusions of this paper and the earlier
USAID paper indicate that APTTA will not at all have any adverse impact on Pakistan, and
Afghanistan on account of this unauthorized trade. In fact, the trade and transport facilitation
reforms embedded in the APTTA Agreement will ensure that smuggling is reduced with better
manned and controlled border posts. While there is no reliable estimate of illegal trade (not
including contraband items like drugs and weapons) between Afghanistan and Pakistan, it is roughly
estimated to be around USD 2 billion. This paper has estimated that Pakistan is losing about USD
270 million as duty forgone from smuggling. The earlier referenced USAID paper had estimated a
revenue gain of USD 135 million attributed to the implementation of the APTTA. The figure of USD
135 million of revenue gain is based on the assumption that half of the USD 2 billion a year illegal
trade would cease to exist with the removal of the incentives to smuggle. This is based on the much
higher import duty for some items in Pakistan relative to Afghanistan, which results in the smuggling
of such items into Pakistan via Afghanistan, and the average MFN applied tariff average in Pakistan is
about 13.5 percent (World Trade Indicators 2008). Most of this trade is carried out along the non-
formalized border crossing between the two countries. If the APTTA formalizes a number of these
border crossings, and harmonizes tariffs between the two economies in a manner that removes
some of the incentives to smuggling, especially of such items as tea and electronic goods, it is likely
that a large majority of the currently illegal trade would then come through official channels, allowing
Pakistan to collect Customs revenues. Given the political sensitivity attached to currently reducing
tariffs in Pakistan in light of the tight fiscal situation, the short-run revenue gain may be less than that
amount in the long-run, though the revenue gain still will be very significant. In short, APTTA will not
2 USAID The Economic Impact of APTA on Pakistan. 3 September 2009

USAID/Pakistan: Trade Project | UNAUTHORIZED TRADE BETWEEN PAKISTAN
AND AFGHANISTAN: A Preliminary Assessment of its Extent and Economic Impact 2
aggravate the flow of unauthorized trade into Pakistan, but should help to reduce it with better trade
facilitation efforts to be jointly undertaken by both governments.
The assessment in this paper corroborates these points with the use of available official data on the
Afghanistan Transit Trade, and proposes a number of possible near-term and long-term
interventions that could reduce the extent and impact of smuggling.
TRADE BETWEEN AFGHANISTAN AND PAKISTAN Afghanistan and Pakistan have long been natural trading partners, and since the overthrow of the
Taliban in 2002, formal trade between Pakistan and Afghanistan has ballooned, rising from a mere
USD 3 million in 2002 to USD 1.72 billion in 2008/09. Pakistan is Afghanistan’s largest trading
partner, accounting for 24.8 percent of Afghanistan’s imports in 2008/09, and 33.1 percent of
Afghanistan’s formal exports. The GoP has set the target of increasing exports to Afghanistan to
USD 2 billion within the next several years.
In addition to being significant trading partners, Pakistan provides Afghanistan’s most efficient route
to the sea, and thus to global markets. In turn, Afghanistan provides Pakistan with a route to
Central Asia, both a growing market for goods and services and a source of potential energy
imports. Both countries have vital interests, economic and strategic, in ensuring an ongoing and vital
transit trade. Transit trade with Afghanistan has almost certainly had a positive impact on the
growth in bilateral trade between the two countries, and has the potential to yield growing
economic benefits to both countries in the years to come. With competing transit routes to
Afghanistan now nearing completion, including new roads to major Afghan cities from the Iranian
port of Chahbahar, Pakistan has particular interests in undertaking the necessary interventions and
reforms to ensure its ability to retain its status as the primary transit route to Afghanistan.
THE PROBLEM OF UNAUTHORIZED TRADE While the 1965 Afghanistan Transit Trade Agreement (ATTA) has undoubtedly brought significant
economic benefits to Pakistan, it was not able to arrest any significant amounts of ‘unauthorized
trade’ taking place on account of poor implementation of trade facilitation at the borders. Such
‘unauthorized trade’ were conducted in two principal manners: transit diversion, whereby goods
which are notionally in transit to Afghanistan through Pakistan do not in fact enter Afghanistan, being
instead diverted for sale in Pakistan; and illegal re-export, whereby goods are transited and
physically and/or legally enter Afghanistan but are subsequently smuggled back into Pakistan across
the porous border. Some rough estimates suggest a 70/30 ratio in value terms for illegal re-export
and transit diversion.
Goods that have been identified as particularly prone to smuggling through these means include:
Tea: Although Afghans’ preference is generally for green tea rather than black, large
quantities of black tea were imported under the ATTA, much of which reportedly ended up
in Pakistan’s markets
Power Generators and Electrical Equipment: As demand in Pakistan for electrical
goods such a dry cell batteries, rechargeable lights, generators and uninterruptable power
supplies increased significantly, so too did the import of such goods through Afghanistan,
presumably destined for Pakistan’s market
Tires: It is argued that as much as 75 percent of the domestic demand for bus and truck
tires is supplied through the Afghanistan transit trade
Air Conditioners: in 1994, Pakistan recorded imports of Rs. 30 million in air conditioners,
while Afghanistan, with little electricity and very low domestic demand, recorded imports of
more than Rs. 1 billion. It was argued that a large share of the Afghan imports was re-
exported, appearing in Pakistan’s markets.

USAID/Pakistan: Trade Project | UNAUTHORIZED TRADE BETWEEN PAKISTAN
AND AFGHANISTAN: A Preliminary Assessment of its Extent and Economic Impact 3
Textile (Cloth): A common commodity re-exported illegally into the country in substantial
quantities. It is being sold in various markets in Peshawar and its surrounding areas and is a
major concern for the authorities. It is argued that the local textile industry is being damaged
by this unauthorized trade.
Vehicles and Spare parts: Another common item finding its way into the Pakistani
markets and causing huge losses to the exchequer and the local industry. The high duty
structure in Pakistan serves as a significant incentive for smugglers to bring the goods into
the country. These items, however, do not transit through Pakistan but are rather imported
through Iran from the Middle East.
Other items commonly re-exported illegally to Pakistan albeit not necessarily in great
quantities include mobile phones, blankets/quilts, cosmetics, arms and ammunition,
lubricants, items of industrial use, plastics and finished goods, antiques, timber, betel nuts,
spices and cooking oil.
EVIDENCE IN CUSTOMS DATA FOR UNAUTHORIZED TRADE Analysis of Pakistan Customs Department and Afghanistan Customs Department data paints a
picture of the transit trade that is consistent with Pakistani concerns regarding unauthorized trade.
It is, however difficult to find conclusive evidence regarding the volume or impact of unauthorized
trade through the official data. Further studies, in particular on a good-by-good basis based on
comparing trade data of exporting countries, with that of Pakistan and Afghanistan, should be
undertaken to assemble a more quantitative foundation of evidence regarding the size and impact of
unauthorized trade. In addition, analysis of other factors/players influencing Afghan Transit Trade
(ATT) needs to be thoroughly studied. But even short of that, the conclusions of this paper and the
earlier USAID paper highlight that APTTA will help reduce the volume of unauthorized trade into
both Afghanistan and Pakistan.
Results are available for a few products. What the official data do show is that synthetic fabric, along
with various types of machinery and equipment represent the largest contributors to the.ATT. The
GoP has also identified both of these categories as areas where products are likely to find their way
to Pakistan’s markets illegally. Other products, not necessarily transiting through Pakistan, include
vehicles and spare parts.
Based on PCD’s data, machinery and electrical equipment comprised around 13 percent of the
transit trade in both 2007/08 and 2008/09, with the transit trade representing a rising proportion of
total Afghan imports across the two years. Textiles, meanwhile, constituted 17 percent of the
Afghan transit trade in 2007/08, rising to almost 20 percent in 2008/09, with the majority of these
imports being synthetic fabrics. When compared to total Afghan imports of textiles, the recorded
transit trade constituted 41 percent of total Afghan imports in 2007/08, rising dramatically to 81
percent in 2008/09. It is not clear from the data alone how significant these high ratios of transit
trade to total Afghan imports are, with respect to evidence of unauthorized trade activity, although
the large size of the transit trade relative to total Afghan imports would certainly appear consistent
with concerns regarding both diversion and re-export.
While this high-level analysis of transit trade data from Pakistan, and import data from Afghanistan
thus yields inconclusive results, item by item analysis may present a fruitful avenue for future enquiry
to more concretely document the extent and impact of unauthorized trade. In the case of tea, for
example, the Pakistan Tea Association estimates the total market size for tea in Pakistan to be
approximately 175 million kilograms per year, or roughly 1 kg per person, some 70 kg greater than
the official imports of 105 million kg. By contrast, Afghanistan, with a population of only 28.4 million,
imported some 91 million kg of tea in 2007/08, and 112 million kg in 2008/09. If the demand
estimate of 1 kg per person were also to hold for Afghanistan, that would suggest surplus supply in
2007/08 of 63 million kg, and of 84 million kg in 2008/09, available for elicit re-export to Pakistan.
Because such analyses are highly sensitive to assumptions of per-capita market demand, they remain

USAID/Pakistan: Trade Project | UNAUTHORIZED TRADE BETWEEN PAKISTAN
AND AFGHANISTAN: A Preliminary Assessment of its Extent and Economic Impact 4
for the moment inconclusive, but demonstrate a fruitful path of future enquiry to more concretely
document the impact of unauthorized trade between the two countries.
POLICY-BASED INCENTIVES FOR UNAUTHORIZED TRADE More telling than the Customs data are the results of an analysis of the incentives for unauthorized
trade between Pakistan and Afghanistan. In 2003, Afghanistan embarked upon a significant
simplification of its tariff structure, and liberalization of its trade policy. Prior to 2003, Afghanistan
had a complex tariff regime with 27 different tariff bands, and rates ranging from zero to 150
percent, and averaging 43 percent. By contrast, the post-2003 Afghan regime includes just 12 ad
valorem bands, with 93 percent of all goods falling into the tariff bands of 2.5 percent, 5 percent and
10 percent, and an average tariff rate of just 5.5 percent.
While Pakistan has also undertaken significant trade liberalization in recent years, its average tariff
remains significantly higher than that in Afghanistan. Pakistan has ended most forms of quantitative
restrictions, leaving tariffs as the main trade policy instrument, with a regime of 14 different bands,
ranging from zero to 90 percent, but at 14.5 percent, its average tariff is some 8.9 percent higher
than that of Afghanistan.
Examining the goods that are argued to be particularly significant in the unauthorized trade, it quickly
becomes apparent that tariff differentials on these goods provide a significant incentive to
unauthorized trade. As the below table demonstrates, on all of these goods, tariffs are significantly
higher in Pakistan, with all goods other than tea having tariff differentials of about 8.9 percent on
average:
Goods Tariff Differential
(Pakistan Tariff less Afghanistan Tariff)
Electric Heaters 25%
Tires 22.5%
Electric Generators 17.5%
Synthetic Fabrics 12.5%
Tea 7.5%
Thus it appears that for the key goods where it is asserted that there are substantial leakages from
the transit trade, significant incentives to unauthorized trade exist, in the form of tariff differentials.
Electronic goods, textiles, tires and tea also all feature in the list of goods reported seized by
Pakistan Customs. While in contrast to other items, like vehicles, the quantities of these goods
seized are not large, this provides further evidence that is consistent with the view that these goods
form significant part of unauthorized trade. It should, however, be noted that differentials with
Afghan tariffs provide an incentive only for the re-export form of unauthorized trade, since only in
this form are tariffs in Afghanistan actually paid. In the cases of transit diversion, the incentives for
unauthorized trade rather concern absolute tariff levels in Pakistan, and their cost relative to the
probability-weighted costs of indictment for smuggling.
The large volume of smuggling on account of huge tariff differentials can be reduced only when tariffs
are harmonized between the two countries, along with implementation of the proposed trade
facilitation reforms, including strict controls at the border posts. Pakistan will need to address the
issue of further tariff rationalization in the medium-term when the fiscal situation improves in order
to boost its sagging exports.

USAID/Pakistan: Trade Project | UNAUTHORIZED TRADE BETWEEN PAKISTAN
AND AFGHANISTAN: A Preliminary Assessment of its Extent and Economic Impact 5
POSSIBLE REMEDIES AND RESPONSES In response to the problem of unauthorized trade, a number of near-term and long term
interventions could significantly reduce the incentives for unauthorized trade, both by increasing the
costs of such smuggling, and reducing the benefits that accrue from it. In the near term,
interventions focused on Customs processing systems and procedures to make trade diversion
more difficult appear the most fruitful avenue for intervention. These policies should be embedded
in the APTTA. Steps that warrant consideration in this regard include:
Improve Border Procedures including: strengthening the role of Customs brokers;
facilitating pre-arrival information and processing; use of targeting/selectivity/risk
management; reducing dwell times; strengthening control of exemptions; implementing
accountability measures; reducing full examinations by implementing an “authorized trader”
scheme supported by post clearance audit; improving information sharing between Pakistani
and Afghan Customs administrations. These interventions should be designed to reduce the
opportunity to smuggle goods into Pakistan, and raise the costs to smugglers of doing so. A
‘gap analysis’ is currently underway in Pakistan to determine the current state with regard to
Customs procedures for Afghan goods in transit, and compare these to a desired end state
as envisaged in the APTTA. Similarly, a comprehensive assessment of the physical Custom
infrastructure which supports the procedures should be carried out and any shortcomings
should be highlighted for improvement in future, possibly as part of the APTTA.
Strengthen the Bonded Transport and Guarantee System: In addition to
improvements in the use of bonded carriers, an internationally, regionally or nationally valid
guarantee system for transit trade is needed to safeguard revenue in case of transit
diversion. Such a system does not currently appear to be in place. For such a system to be
effective, reliable, and auditable, bonded carriers should be used to move the goods into
Afghanistan, with goods travelling under a bond that is released once a verifiable and reliable
Afghan Customs entry document is processed and communicated back to the point of
origin.
Improve Entry Procedures at Karachi and Port Qasim: This will be particularly
important given anecdotal evidence that currently significant amounts of under-invoicing and
mis-declaration is taking place. Improving accurate accounting of goods would reduce the
scope for transit diversion, while increasing the prospects for revenue collection by Afghan
Customs as well as ensuring that an appropriate amount is secured by a reliable bond
guarantee in suspended regimes to protect Pakistan revenue. Development of an accurate
post clearance audit function would also ultimately enable the development of a voluntary,
incentive-based system whereby carriers with strong records for accurate declaration might
be rewarded with expedited clearances and other benefits.
Explore alternative means for directly controlling ATTA imports: In categories
where unauthorized trade is deemed particularly problematic, use of a modern risk
management system should be utilized in the medium term rather than use of a negative list
or quantitative restrictions that are fraught with problems associated with discretionary
controls.
Further tariff rationalization in Pakistan to make its exports more competitive:
As stated earlier, Pakistan should seriously consider reducing its tariff levels to those
prevailing in the East Asian economies. This will boost exports, as well as reduce smuggling.
.

USAID/Pakistan: Trade Project | UNAUTHORIZED TRADE BETWEEN PAKISTAN
AND AFGHANISTAN: A Preliminary Assessment of its Extent and Economic Impact 6
INTRODUCTION
The governments of Pakistan and Afghanistan are currently engaged in negotiations for the
Afghanistan Pakistan Transit Trade Agreement (APTTA), a successor to the 1965 Afghanistan
Transit Trade Agreement (ATTA). APTTA will not only boost trade between the two countries,
but it will also help lay the foundation for greater economic integration between the economies in
Central Asia and South Asia—one of the least integrated regions in the world. And indeed closer
economic relations between the South and Central Asian regions make intuitive sense. Central Asia
has some of the highest reserves of oil and natural gas, and it is also major source for industrial raw
materials like bauxite and iron ore. South Asia is home to around 1.5 billion consumers who
increasingly demand energy and other industrial products. In essence, South Asia is the natural
growth market for Central Asia and East Asian countries.
One issue that has been raised, concerns the extent and an economic impact of what is referred to
as ‘unauthorized trade’ that takes place under the existing transit trade practices, and whether the
APTTA will have any adverse impact as a result of increased smuggling. In this context, unauthorized
trade generally refers to goods that enter Pakistan for transit to Afghanistan that are diverted before
reaching the border as well as goods that enter Afghanistan (having entered through Customs or
having turned back to Pakistan prior to reaching Customs) but are subsequently smuggled back into
the country. The Pakistan government’s principal concern is that Afghan transit trade is providing an
unintended means for substantial amounts of smuggling to take place that significantly reduces
revenues and undermines the ability of Pakistani traders and manufacturers to compete with this
illegal trade. It would appear that the Afghan government shares concerns with respect to lost
revenue due to diverted transit trade. However, Afghan trade policies aim at reducing the
transaction costs of trade and one of their stated goals for the current negotiations is to improve
the efficiency with which goods are imported and exported i.e. reduce cost of doing business3.
Hence the Government of Pakistan requested that a study be completed of the unauthorized trade
occurring between Afghanistan and Pakistan specifically in relation to the ATT, its extent and the
likely impact on Pakistan’s economy. This paper attempts to do that within limitations imposed by
the severe data gaps.
Afghanistan and Pakistan are natural trading partners. After nearly three decades of conflict and
turmoil in Afghanistan, opportunities for bilateral trade in goods and services have dramatically
increased since the overthrow of the Taliban in 2002. Indicative estimates of the extent of formal
trade between Pakistan and Afghanistan are4:
USD 3 million in 2002;
USD 492 million in 2003/04;
USD 1.63 billion in 2005/06;
USD 1.25 billion in 2006/07;
3 See Ministry of Commerce and Industry, the Government of Islamic Republic of Afghanistan, Trade Policy
Framework. 4 Note that more than 90 percent of bilateral trade are exports from Pakistan to Afghanistan, reflecting a
substantial and persistent trade surplus in Pakistan’s favor. Estimates presented in this paper have been drawn
from a variety of sources and require further verification for consistency and accuracy.

USAID/Pakistan: Trade Project | UNAUTHORIZED TRADE BETWEEN PAKISTAN
AND AFGHANISTAN: A Preliminary Assessment of its Extent and Economic Impact 7
USD 1.21 billion in 2007/08;5
USD 1.72 billion in 2008/09.
The Government of Pakistan has set a target of increasing exports to Afghanistan to USD 2 billion
within the next several years. The recent high rate of growth in trade between the countries
suggests that this goal can be achieved if barriers to trade continue to be reduced while economic
integration is strengthened, including through measures such as the effective implementation of the
South Asia Free Trade Agreement (SAFTA).
Table 1Trade with Pakistan
Proportion of Afghanistan’s total trade
2007-2008
2008-2009
Change
Imports (%) 23.7 24.8 1.1
Exports (%) 33.1 26.1 36.4
Pakistan is Afghanistan’s largest trading partner and its relative importance has increased steadily in
recent years (see table 1 above). In 2007/08 Pakistan accounted for 23.7 percent of Afghanistan’s
total recorded imports; in 2008/09 this increased to 24.8 percent.6 Pakistan is also the primary
destination for formal Afghan exports. In 2007/08 this amounted to USD 67.1 million or 33.1
percent; in 2008/09 exports increased to USD 69.5 million but declined to 26.1 percent of total
Afghan exports. (This was largely due to significant increases in exports to Tajikistan and India.)
With the expected sustained high rates of economic growth of the region it is likely that the
amounts of bilateral trade will continue to grow in the future.
In addition to being significant trading partners, Pakistan provides Afghanistan’s most efficient route
to the sea and the rest of the world’s markets. Afghanistan provides Pakistan with an export route
to the rapidly growing markets of Central Asia, a potential major supplier of energy. To provide a
legal foundation for increased trade, Pakistan and Afghanistan entered into the 1965 Afghan Transit
Trade Agreement (ATTA), which permits both countries to transit goods through their territory.
While this Agreement would appear to have largely achieved its objectives, it has not been able to
arrest the considerable amounts of ‘unauthorized trade’ taking place, which in this context amounts
to the diversion of Afghan imports transiting through Pakistan before reaching the border and/or the
illegal re-export of goods from Afghanistan after physically crossing the border and/or after payment
of duty in Afghanistan. There are a number of examples of goods which have reportedly entered
Pakistan in these ways, including:
Tea: Pakistanis prefer black tea while Afghans prefer green tea. Large quantities of black tea
were being imported under the ATTA, much of which reportedly ended up in Pakistan’s
markets.7
Power generators and other types of electrical equipment: Evidently in response to
a significant increase in demand in Pakistan for these goods (e.g. dry cells, rechargeable lights,
5 Note that the estimates for 2007/08 and 2008/09 are based on estimates for exports to Afghanistan from the
Pakistan Federal Bureau of Statistics and estimates for Afghan exports, which are relatively small, from published
estimates from the Afghanistan Customs Department. 6 ACD estimates reported on www.customs.gov.af.
7 See The Impact of Afghan Transits Trade on NWFP’s Economy, by Dr Sayed Waqar Hussain, Edited by
Alauddin Masood, Area Study Centre, University of Peshawar and Hanns Seidel Foundation, April 2004; and,
more specifically with regard to tea, for example, the article published in The Daily News (Pakistan), “Traders
demand rationalisation of ATT tariffs”, 6th November 2009.

USAID/Pakistan: Trade Project | UNAUTHORIZED TRADE BETWEEN PAKISTAN
AND AFGHANISTAN: A Preliminary Assessment of its Extent and Economic Impact 8
UPS, etc) imports of these types of goods through the ATTA increased substantially,
presumably destined for Pakistan’s market.
Tires: It is argued that as much as 75 percent of the domestic demand for bus and truck
tires is supplied through the Afghan transit trade.8
Cloth: A common commodity re-exported illegally into the country in substantial quantities.
It is being sold in various markets in Peshawar and its surrounding areas and a major
concern for the authorities. It is argued that the local textile industry is being damaged by
this unauthorized trade.
Vehicles and spare parts: Another common item finding its way into the Pakistani
markets and causing huge losses to the exchequer and the local industry. The high duty
structure in Pakistan serves as an incentive for smugglers to bring the goods into the
country. These items, however, do not transit through Pakistan but are rather imported
through Iran from the Middle East.
Other items commonly re-exported illegally to Pakistan albeit not necessarily in great
quantities include mobile phones, blankets/quilts, cosmetics, arms and ammunition,
lubricants, mobile phones, items of industrial use, plastics and finished goods, antiques,
timber, betel nuts, spices and cooking oil.
Box 1: Air conditioners
The objectives of this paper are to examine the
nature of the transit trade that is taking place under
the present ATTA; assess the procedure, nature and
scope of the unauthorized trade that may be taking
place based on facts, available data and its economic
and revenue impacts; review the relevant trade
policies of the two countries and their contribution
to conditions that foster the unauthorized trade
taking place; present recommendations on how the
issue of unauthorized trade may be addressed, and
most importantly, indicate the link of the proposed APTTA in addressing the issue of smuggling.
8 See for example the article published in The Nation, “Smuggling damaged local tyre industry”, November 14,
2009.
In 1994 Pakistan recorded imports of Rs.
30 million in air conditioners. In the same
year Afghanistan recorded imports of
more than Rs. 1billion worth of air
conditioners, while having little electricity
and very low domestic demand. It was
argued that a large share of the Afghan
imports appeared in Pakistan’s markets.

USAID/Pakistan: Trade Project | UNAUTHORIZED TRADE BETWEEN PAKISTAN
AND AFGHANISTAN: A Preliminary Assessment of its Extent and Economic Impact 9
CURRENT STRUCTURE OF
AFGHAN TRANSIT TRADE
The first step in examining the structure of Afghan transit trade is to identify the amount and type of
goods entering into the process. The focus here is entirely on goods intended as Afghan imports.
The ATTA established five border points (see figure 1) through which all transit trade is expected to
pass:
Karachi Port
Port Qasim
Peshawar-Torkham/Jalalabad
Chaman-Spin Boldak
Ghulam Khan-Kelli.
Figure 1: Some of Pakistan’s border points
Karachi Port and Port Qasim are the
points where imports to Afghanistan
may enter Pakistan for duty free transit
while the remaining three border points
above (and as identified in figure 1) are
where these goods may pass from
Pakistan into Afghanistan under the
Agreement.9 Detailed data, by 8-digit
Harmonized System code, have been
provided by the Pakistan Customs
Department for Afghan transit trade
that enters through Karachi Port and
Port Qasim for the two most recent
years, (i.e., July 2007 to June 2008 and
July 2008 to June 2009). For 2007/08
there were 1,472 different types of
goods (8-digit classification) moving
under the ATTA, which increased to
2,007 different types of goods in
2008/09. In order to provide a general picture of the general structure of these imports, Table 1
presents these data at a high level of aggregation, corresponding to main HS sections.10 Less highly
aggregated estimates, corresponding to HS Chapters, are presented in Appendix 1.
9 It is understood that the great majority of transit trade enters Afghanistan through the Peshawar-
Torkham/Jalalabad border point. Data on transit imports from the Afghanistan Customs Department are being
sought which would clarify this issue. 10
The broad HS sections used in this paper correspond to the following HS chapters: Animal and Animal
Products, Ch 01-05; Vegetable Products, Ch 06 to 15; Foodstuffs, Ch 16 to 24; Mineral Products, Ch 25 to 27;
Chemicals and Allied Industries, Ch 28 to 38; Plastics and Rubbers, Ch 39 and 40; Raw Hides, Skins, Leather,
and Furs, Ch 41 to 43; Wood & Wood Products, Ch 44 to 49; Textiles, Ch 50 to 63; Footwear and Headgear, Ch
64 to 67; Stone and Glass, Ch 69 to 71; Metals, Ch 72 to 83; Machinery and Electrical, Ch 84 and 85;

USAID/Pakistan: Trade Project | UNAUTHORIZED TRADE BETWEEN PAKISTAN
AND AFGHANISTAN: A Preliminary Assessment of its Extent and Economic Impact 10
The data indicates a major increase in the total level of transit trade between the two years, from
Rs. 56,801 million to Rs. 117,296 million or an increase of 106.5 percent. The reason (or reasons)
for this sharp increase are not readily apparent. It does not reflect a significant increase in GDP
growth. Although the Afghan economy grew at the robust rate of 16.2 percent in 2007/08,
apparently the growth rate for 2008/09 was very much lower, estimated to be 2.3 percent.11
Table 2: Afghan Transit Trade through Karachi and Port Qasim: High Level Aggregation
(Millions of Rupees)
Trade Items July 2007 – June 2008 July 2008 – June 2009
Amount Percentage Amount Percentage
Foodstuffs 10,019 17.64% 12,027 10.25%
Textiles 9,709 17.09% 23,273 19.84%
Machinery and Electrical 7,490 13.19% 17,079 14.56%
Vegetable Products 7,195 12.67% 15,394 13.12%
Transportation 5,390 9.49% 4,351 3.71%
Animal and Animal Products 3,900 6.87% 5,129 4.37%
Chemical and Allied Industries 2,933 5.16% 4,241 3.62%
Plastics and Rubber 2,824 4.97% 5,501 4.69%
Metals 2,364 4.16% 3,911 3.33%
Wood and Wood Products 1,216 2.14% 3,086 2.63%
Mineral Products 1,042 1.83% 2,028 1.73%
Miscellaneous 984 1.73% 3,923 3.34%
Services (Mainly Official Imports) 779 1.37% 15,375 13.11%
Stone and Glass 696 1.22% 1,405 1.20%
Raw Hides, Skins, Leather and Furs 131 0.23% 330 0.28%
Footwear and Headgear 131 0.23% 245 0.21%
TOTAL 56,801 100% 117,296 100%
Source: Pakistan Customs Department (Project data)
Total Afghan reported imports grew from USD 3,408 million in 2007/08 (Solar Year 1386) to USD
4,050 million in 2008/09 (SY 1387), or by 18.9 percent, (see Table 4, below). It would appear that
most of the far higher growth in imports relative to the far lower GDP growth rate can be
attributed to increased imports in three key categories: vegetable products, mineral products and to
a lesser degree transportation equipment. These sharp increases are almost certainly, largely a
reflection of the significant increases in food and fuel prices that took place globally.
Another possible explanation for the sharp increase in Afghan transit trade could be due to the
depreciation of the Pakistani Rupee, which went from an average exchange rate against the dollar of
Rs. 63.6 to Rs. 75.0, or by approximately 18 percent during the period.12 To better assess the real
changes in Afghan transit trade, the original estimates were converted to dollars using these
exchange rates, (see Table 2).
Transportation, Ch 86 to 89; Miscellaneous, Ch 90 to 97; and ‘Services’, Ch 98 and 99. Further details can be
seen in Appendix 1. 11
Based on the Afghanistan Central Statistic Office estimates for Solar Year 1386 (i.e., 2007/08) and the most
recent estimate for Solar Year 1387 (2008/09). Note that Afghanistan operates on Solar Calendar where the
year runs from 21st March to 20
th March, while Pakistan operates on a fiscal year from 1 July to 30 June. This
approximately three month difference creates difficulties in comparing some data.
12 This is based on average monthly exchange rates reported by the IMF.

USAID/Pakistan: Trade Project | UNAUTHORIZED TRADE BETWEEN PAKISTAN
AND AFGHANISTAN: A Preliminary Assessment of its Extent and Economic Impact 11
Table 3: Afghan Transit Trade through Karachi and Port Qasim: High Level Aggregation
(Millions of US Dollars)
Trade Items July 2007 – June 2008 July 2008 – June 2009
Amount Percentage Amount Percentage
Foodstuffs 157.54 17.64% 160.29 10.25%
Textiles 152.68 17.09% 310.16 19.84%
Machinery and Electrical 117.78 13.19% 227.61 14.56%
Vegetable Products 113.14 12.67% 205.16 13.12%
Transportation 84.76 9.49% 57.98 3.71%
Animal and Animal Products 61.32 6.87% 68.35 4.37%
Chemical and Allied Industries 46.11 5.16% 56.52 3.62%
Plastics and Rubber 44.40 4.97% 73.31 4.69%
Metals 37.17 4.16% 52.12 3.33%
Wood and Wood Products 19.11 2.14% 41.13 2.63%
Mineral Products 16.38 1.83% 27.03 1.73%
Miscellaneous 15.47 1.73% 52.28 3.34%
Services (Mainly Official Imports) 12.25 1.37% 204.91 13.11%
Stone and Glass 10.94 1.22% 18.73 1.20%
Raw Hides, Skins, Leather and Furs 2.06 0.23% 4.40 0.28%
Footwear and Headgear 2.05 0.23% 3.26 0.21%
TOTAL 893.17 100% 1,563.22 100%
Source: Pakistan Customs Department
The nominal and real growth rates, based on Tables 2 and 3, are presented in Table 4.
Denominated in dollars, total Afghan transit trade increased from USD 893.17 million to USD
1,563.22 million. (Thus, transit trade amounted to 26.2 percent of total imports in 2007/08 and 38.6
percent in 2008/09.) When measured in real (or dollar) terms, the increase in Afghan transit trade
between 2007/08 and 2008/09 is substantially less than in nominal (or Rupee) terms: 75.0 percent as
compared with 106.5 percent.
It is worth examining briefly the changing pattern of Afghan transit trade in trying to explain the
determinants underlying the sharp increase in total Afghan transit trade. There are seven broad
sections where real growth was above average.
Services (Mainly Official Imports): This accounted for 1.37 percent of transit trade in
2007/08, but increased substantially to 13.11 percent the following year. It appears that
there was a shift in procedures that results in substantially increased amounts of goods
imported by diplomats, embassies or other exempt entities being imported as transit trade.
In any case, this is a relatively small category and little impact on to overall increase.
Table 4: Afghan Transit Trade through Karachi and Port Qasim: Nominal and Real Growth
Rates 2007/08 to 2008/09 (Percentages)
Trade Items Growth Rate
(Nominal)
Growth Rate
(Real)
Foodstuffs 20.0% 1.7%
Textiles 139.7% 103.1%

USAID/Pakistan: Trade Project | UNAUTHORIZED TRADE BETWEEN PAKISTAN
AND AFGHANISTAN: A Preliminary Assessment of its Extent and Economic Impact 12
Trade Items Growth Rate
(Nominal)
Growth Rate
(Real)
Machinery and Electrical 128.0% 93.2%
Vegetable Products 113.9% 81.3%
Transportation -19.3% -31.6%
Animal and Animal Products 31.5% 11.5%
Chemical and Allied Industries 44.6% 22.6%
Plastics and Rubber 94.8% 65.1%
Metals 65.5% 40.2%
Wood and Wood Products 153.9% 115.2%
Mineral Products 94.6% 65.0%
Miscellaneous 298.8% 238.0%
Services (Mainly Official Imports) 1,873.3% 1,572.5%
Stone and Glass 102.0% 71.2%
Raw Hides, Skins, Leather and Furs 151.8% 113.4%
Footwear and Headgear 87.3% 58.8%
TOTAL 106.5% 75.0%
Source: Tables 2 and 3. See text for details.
Miscellaneous: This area includes optical, photographic, telephonic equipment, and related
materials, but accounted for only 1.73 percent (2007/08) and 3.34 percent (2008/09) of total
Afghan transit trade. An examination of the detailed data suggests that there were some
increases in equipment related to the ongoing investment in the telecom sector, including
the implementation of the fiber optic system. None of these are particularly large increases
in value terms and as a result contributed relatively little to the overall increase.
Wood and Wood Products: This area includes paper and paperboard and articles of
paper pulp. Relatively important imports included toilet and facial tissues, diapers for infants
and photocopy paper, et al. The area accounted for only 2.14 percent (2007/08) and 2.63
percent (2008/09) and did not have a significant impact on total transit trade.
Hides and Leather: This is another relatively small area, contributing 2.06 percent
(2007/08) and 4.40 percent (2008/09) to total Afghan transit trade. The high growth rate
was a result primarily of increased imports of a number of different leather products.
Textiles: This is a major area contributing substantially to Afghan transit trade, 17.09
percent (2007/08) and 19.84 percent (2008/09). The largest single good (HS eight-digit) in
both years was synthetic fabric. In 2007/08, HS 5514.2100 polyester fiber, plain weave alone
accounted for 8.13 percent of total transit trade. In 2008/09, this good was still significant
but its share of the total declined considerably to 1.05 percent. At the same time HS
5512.1900, a similar type of synthetic fabric, accounted for 13.3 percent of total transit trade
in 2008/09 where the year before it contributed 2.91 percent of transit trade. It would
appear that there may have been a shift in the type of synthetic fabric being imported in high
volumes. It is worth noting that synthetic fabric imports through Afghan transit trade as a
share of Afghanistan’s total textile imports doubled between these two years, (see Tables 6
and 7 below).
Machinery and Electrical Equipment: This area is a major source of transit trade
imports in both of the years examined: 13.19 percent (2007/08) and 13.56 percent
(2008/09). There are no goods within this group with exceptionally large levels of transit
trade imports. Rather, there are substantial amounts for a number of different types of

USAID/Pakistan: Trade Project | UNAUTHORIZED TRADE BETWEEN PAKISTAN
AND AFGHANISTAN: A Preliminary Assessment of its Extent and Economic Impact 13
goods. Amongst the most prevalent goods are transformers and generators. As was the
case with textiles, the share of transit trade for this group increased substantially between
the two years, (see Tables 6 and 7 below).
Vegetable Products: There are two types of goods that predominate in this area: edible
oils and tea. Edible oils contributed 6.74 percent (2007/08) and 6.66 percent (2008/09) to
total Afghan transit trade while tea was responsible for 5.16 percent (2007/08) and 5.60
percent (2008/09), (see Appendix Table 1). In contrast to the preceding two areas, transit
trade in vegetable products did not contribute substantially to total Afghan imports in either
year. In 2007/08 it accounted for 21.7 percent and in 2008/09 24.8 percent.
Based on the data available, it would appear that there are two areas where Afghan transit trade is
most likely to find its way to Pakistan’s markets, notably synthetic fabric, and various types of
machinery and equipment. It has also been argued elsewhere that tea, edible oils and other types of
food and vegetable products are subject to substantial levels of smuggling.
Any assessment of the transit trade component should be considered on the basis of the entire
structure of imports. A comparable set of estimates for total Afghan imports is presented in Table
5, below. This is based on data published by the Afghanistan Customs Department for the years
1386 (2007/08) and 1387 (2008/09). It should be kept in mind that Afghan and Pakistani agencies
report data using different periods and therefore these data may not be strictly comparable. There
are several other differences that have been addressed in compiling these data that may still leave,
what are expected to be, minor discrepancies. For example, the reporting structure requires some
further aggregation to correspond to the presentation of the data from the Pakistan Customs
Department presented here.
Table 5: Recorded Afghan Imports (Millions of Afghanis)
Description 2007/08
(SY 1386)
2008/09
(SY 1387)
Change Growth Rate
Animal and Animal Products 5,397.98 4,999.70 (398.28) -7.38%
Vegetable Products 26,037.97 41,299.52 15,261.55 58.61%
Foodstuffs 12,504.73 11,532.62 (972.11) -7.77%
Mineral Products 23,736.89 30,879.97 7,143.08 30.09%
Chemical and Allied Industries 6,935.51 8,671.85 1,736.34 25.04%
Plastics and Rubber 11,430.40 10,968.09 (462.31) -4.04%
Raw Hides, Skins, Leather and Furs 375.31 489.26 113.95 30.36%
Wood and Wood Products 6,541.59 7,299.72 758.13 11.59%
Textiles 18,658.34 19,067.01 408.67 2.19%
Footwear and Headgear 1,850.44 1,993.57 143.13 7.73%
Stone and Glass 2,771.85 3,099.91 328.06 11.84%
Metals 17,279.42 17,382.52 103.10 0.60%
Machinery and Electrical 22,734.98 22,595.69 (139.29) -0.61%
Transportation 11,633.98 19,323.67 7,689.69 66.10%
Miscellaneous 2,492.92 2,914.09 421.17 16.89%
Not Elsewhere Classified 3.10 0.57 (2.53) -81.61%
TOTAL 170,385.41 202,517.76 32,132.35 18.86%
Source: Afghanistan Customs Department

USAID/Pakistan: Trade Project | UNAUTHORIZED TRADE BETWEEN PAKISTAN
AND AFGHANISTAN: A Preliminary Assessment of its Extent and Economic Impact 14
It should also be kept in mind that these data are based on documented imports and that there are
serious concerns regarding the accuracy of the documentation being processed and the substantial
amounts of unrecorded trade that is reportedly taking place.
In addition to the high rate of import growth reported, 18.86 percent (mentioned above), perhaps
the most noteworthy characteristic of these estimates is the apparent stability in the overall
structure of imports for these two years. Relative levels for most groups remained generally close
in most areas and where there were significant increases; there are readily apparent reasons (e.g.,
the increases in food and fuel prices).
Table 6: Relationship between Total Afghan Imports and Transit Trade (Millions of US Dollars
and Percentages)
Items
Total Afghan Imports
Total Transit Trade
Percentage
March 21, 2007-March 20, 2008
(1386)
July 2007- June 2008
Textiles 373.17 152.68 40.9%
Machinery and Electrical 454.70 117.78 25.9%
Vegetable Products 520.76 113.14 21.7%
Services (Mainly Official Imports) N/A N/A N/A
Foodstuffs 250.09 157.54 63.0%
Plastics and Rubber 228.61 44.40 19.4%
Animal and Animal Products 107.96 61.32 56.8%
Transportation 232.68 84.76 36.4%
Chemical and Allied Industries 138.71 46.11 33.2%
Miscellaneous 49.86 15.47 31.0%
Metals 345.59 37.17 10.8%
Wood and Wood Products 130.83 19.11 14.6%
Mineral Products 474.74 16.38 3.5%
Stone and Glass 55.44 10.94 19.7%
Raw Hides, Skins, Leather and Furs 7.51 2.06 27.5%
Footwear and Headgear 37.01 2.05 5.5%
TOTAL 3,407.71 893.17 26.2%
Tables 6 and 7 present estimates for the two years that are generally comparable; including total
Afghan imports (from ACD) and total transit trade (from Pakistan Customs Department).13 There
are several points that should be made with regard to these estimates. First, at this aggregate levels
the average ratio of goods entering through transit trade and total imports are 26.2 percent
(2007/08) and 38.6 percent (2008/09). The maximum ratios including both years are for
‘Miscellaneous’ 89.7 percent and ‘Textiles’ 81.3 percent, both in 2008/09. (As indicated previously,
the high ratio for Miscellaneous category was probably due to a surge in imports for goods related
to ongoing investment in the telecoms industry.)
13
‘Services’ is one area that is clearly inconsistent. It appears that the Afghan data do not include goods
imported by diplomats, embassies and other official exempt parties. Therefore, these data have been excluded
from these tables until some way of reconciling these differences is found.

USAID/Pakistan: Trade Project | UNAUTHORIZED TRADE BETWEEN PAKISTAN
AND AFGHANISTAN: A Preliminary Assessment of its Extent and Economic Impact 15
Together the estimates presented in these tables suggest that at least for these two years, the
relationship between the structure of total imports and the structure of goods entering into the
transit trade is relatively stable. (Possible exceptions have been discussed above.)

USAID/Pakistan: Trade Project | UNAUTHORIZED TRADE BETWEEN PAKISTAN
AND AFGHANISTAN: A Preliminary Assessment of its Extent and Economic Impact 16
Table 7: Relationship between Total Afghan Imports and Transit Trade (Millions of US Dollars
and Percentages)
Real Values (US Dollars)
Total Afghan Imports Total Transit Trade
Ratio March 21, 2008-March 20, 2009
(1387) July 2008-June 2009
Textiles 381.34 310.16 81.3
Machinery and Electrical 451.91 227.61 50.4
Vegetable Products 825.99 205.16 24.8
Services (Mainly Official Imports) N/A N/A N/A
Foodstuffs 230.65 160.29 69.5
Plastics and Rubber 219.36 73.31 33.4
Animal and Animal Products 99.99 68.35 68.4
Transportation 386.47 57.98 15.0
Chemical and Allied Industries 173.44 56.52 32.6
Miscellaneous 58.28 52.28 89.7
Metals 347.65 52.12 15.0
Wood and Wood Products 145.99 41.13 28.2
Mineral Products 617.60 27.03 4.4
Stone and Glass 62.00 18.73 30.2
Raw Hides, Skins, Leather and Furs 9.79 4.40 45.0
Footwear and Headgear 39.87 3.26 8.2
TOTAL 4,050.36 1,563.22 38.6

USAID/Pakistan: Trade Project | UNAUTHORIZED TRADE BETWEEN PAKISTAN
AND AFGHANISTAN: A Preliminary Assessment of its Extent and Economic Impact 17
FACTS ABOUT THE
UNAUTHORIZED TRADE
During the early days of Pakistan’s emergence on the world map the tribal people living in the
bordering areas of Afghanistan and Pakistan were allowed to trade without formalities. Informal
cross border trade became a way of life and for many the primary source of income. Having become
used to this way of life the tribal people continued to trade in this way for many years without
considering it a crime. It was considered a legitimate trade with the brotherly neighbours. Similarly,
the government has not actively cracked down on such cross border trade primarily because of the
lack of alternative sources of income for these people. This source of income in the absence of
alternative means has helped to avoid exacerbating the greater problems of crime, drug smuggling
and other unsocial activities in the region.
Unauthorized trading of goods has long been carried out throughout the Federally Administered
Tribal Areas (FATA). Goods are brought into the tribal areas through dirt tracks and un-metalled
roads from across the border. Where tracks are not available and mechanical transport cannot
negotiate, animals are used for transportation purposes. Although the security and protection of the
region comes under the ambit of the paramilitary forces, there are areas within the region that are
inaccessible to all. The Choora Valley in Khyber agency, for example, is a popular route for drug
smugglers; however, it is also used for transport of unauthorized goods.
Routes
Along the 1100 km porous
border between Afghanistan and
Pakistan many routes are used
by traders for the exchange of
goods. These routes are spread
across the tribal belt along the
border. The mode of
transportation used to carry the
goods varies from pickup trucks,
trucks, tractors with trolleys to
mules and camels depending on
the size of the consignment and
the route being used. Some of
the most popular recognized
routes used for the
unauthorized trade with ‘type of
goods’ are show in the map
above and described in text below:
Nangrahar (Afghanistan) – Landikotal- Khyber Agency (Pakistan tribal region). This is the most common
route emanating from Jalalabad and its surrounding areas in Afghanistan and ending in the tribal area
of Landikotal in the Khyber Agency of Pakistan. There are several tracks and mud roads through this
mountainous and harsh terrain used for transportation of goods. The main tribes operating in these
areas are Afridi’s and Shinwaris.

USAID/Pakistan: Trade Project | UNAUTHORIZED TRADE BETWEEN PAKISTAN
AND AFGHANISTAN: A Preliminary Assessment of its Extent and Economic Impact 18
Paktia (Afghanistan) –Waziristan (Pakistan tribal region). In the south east of Afghanistan, from Paktia
into the tribal region of northern Waziristan in Pakistan is the second most commonly used route
for the unauthorized trade. The muddy tracks in this mountainous terrain are used for transport of
goods. The two main tribes of Wazir and Mehsud inhabit the bordering area and are responsible for
the trade in the area.
Khost (Afghanistan) - Kurram agency (Pakistan tribal region). This is the third most commonly used
route for the unauthorized trade. Like the other routes the area around the border is mountainous
with vegetation and unpaved paths which are used to transport goods on mules and other animals.
Konar (Afghanistan)-Mohamand agency (Pakistan tribal region). This is the fourth route but with low
priority due to the inhospitable terrain on both sides of the border and long distance from the road
head making it an expensive choice. Around this area, given the current circumstances, the border
between the two countries is manned heavily by the paramilitary and the army making it difficult for
such trade.
Another Dimension
Afghan goods have been transiting through Pakistan for many years now. It is widely believed that
goods transiting through Pakistan bear no relevance to the consumption in Afghanistan. It is thought
that many of these goods are primarily meant for the Pakistani markets to benefit from the tariff
differential between the two countries. It is now common knowledge that traders from Pakistan,
primarily from the tribal region, are actively involved in the unauthorized trade previously believed
to be the purview of Afghan traders. Financiers from Pakistan and Afghanistan as well as abroad also
provide funding for such illicit trade. As previously mentioned, due to the circulation of “black”
money in the economy many of the financiers attempt to ‘launder’ their earnings through the sale of
such goods in the market.
The procedure
In order for a Pakistani trader to import goods under the ATT agreement for illegal re-export back
to Pakistan the following procedure is followed:
1. A Pakistani trader in Peshawar negotiates with an Afghan agent to import goods under
transit through Pakistan intended to be illegally re-exported back to Pakistan.
2. With the help of an Afghan agent, the trader obtains an LC (Letter of Credit) from a bank in
Afghanistan or (as in most cases) makes an advance payment to import goods from abroad
under an Afghanistan registered company.
3. The Afghan agent prepares the requisite documentation to import goods under the
provisions of the Afghan Transit Trade Agreement (ATTA) through Pakistan. The fee
charged by the agent for his services range between 1 and 1.5 percent of the total invoice
value of goods being imported.
4. The trader in Pakistan transfers the advance payment for goods equivalent to the value of
invoice through informal channels to the Afghan agent. A receipt is issued for the transaction
by the agent that later act as a proof at the point of delivery of goods.
5. The Afghan agent makes the payment to the company exporting the goods through informal
channels such as Hundi (money laundering). Upon receipt of payment, the company
dispatches the goods to Afghanistan transiting through Pakistan.

USAID/Pakistan: Trade Project | UNAUTHORIZED TRADE BETWEEN PAKISTAN
AND AFGHANISTAN: A Preliminary Assessment of its Extent and Economic Impact 19
6. Goods arrive at Pakistani ports from abroad and under the normal procedure of Afghan
transit are transported to one of the borders with Afghanistan for onward delivery.
7. After arrival of goods in Afghanistan, for example at Jalalabad, custom duty according to the
applicable tariff is paid and the goods are released as per the normal procedure.
8. The goods are then stored in nearby warehouses for transportation back in to Pakistan. This
is done either through Torkham border or any of the other borders crossing point identified
in the map above for onward transportation to Pakistan.
9. The trader presents the receipt to the agent importing the goods and arranges for
transportation to Pakistan through a reliable carrier.
There are mainly two types of carriers who transport unauthorized goods into Pakistan:
a) Carries that guarantee the delivery of goods. These carriers are expensive but ensure
safe delivery. The carrier deposits a sum equivalent to the value of goods being
transported with the owner of the goods.
b) Carriers of small cargo. These carriers are professionals who carry smaller quantities
of goods and are mostly new in the market. The basic attraction of these carriers is
the lower price of transportation. Smaller traders usually use their services and
distribute goods among them to mitigate the risk of detection and seizures.
10. Upon safe delivery of goods the owner refunds the money back to the carrier. In case goods
are confiscated by authorities, the owner keeps the deposit and the carrier bears the loss.
11. Upon arrival at the warehouses, goods are marketed by the owner/traders to wholesalers.
Every Friday the wholesalers visit the warehouses to see goods, obtain samples, negotiate
prices and make purchases. Deals are struck with the owners of goods in bulk and cash
payments are made. Once the payments are made the goods are ready to be transported to
the wholesalers’ outlets within, as well as outside, the tribal region.
From here onwards the goods are also transported to other parts of the country and often seen in
‘Bara markets’ in Rawalpindi, Lahore and Karachi. These markets, located in the settled areas have
recently emerged across the country selling smuggled items. The most common commodities, their
prices at source and destination, the typical profits made and the tribes involved in the trade are
identified in table 8 below.
Table 8 : Typical un-authorized goods
S. Description
Total No. of Shops at all Locations
Range of unit price in rupees (all Locations)
Tribes Involved
% of Price benefit for all retail outlets
At source in tribal areas
At retail outlets
MIN MAX MIN MAX MIN MAX A. Textile (Cloth)
1. Silk suites ( Chinese- 5 yards)
134 890 3,000 1,250 4,000 Afridi/ Shinwari/Turi/Wazir 50 72
2. Summer cotton suites(Chinese- 5 yards)
165 900 3,000 1,400 (3 piece suite)
1,600 Afridi/ Shinwari/Turi/Wazir 40 65
3. Winter suites (Chinese- 5 yards)
165 250 1,200 300 2,000 Afridi/ Shinwari/Turi/Wazir 65 83
B. Electronics

USAID/Pakistan: Trade Project | UNAUTHORIZED TRADE BETWEEN PAKISTAN
AND AFGHANISTAN: A Preliminary Assessment of its Extent and Economic Impact 20
In addition to the most popular items given in the table above the following commodities are also
smuggled and sold in the markets in the tribal as well as settled areas: (1) blankets/quilts; (2)
cosmetics; (3) arms and ammunition; (4) lubricants; (5) mobile phones; (6) items of industrial use;
(7) plastics and finished goods; (8) antiques; (9) timber; (10) tea; (11) betel nuts; (12)spices (e.g. large
cardamoms, red chilies ); and prepared Spices containing various other spices. It is interesting to
note that certain items such as cloth and cutlery, in some cases, are actually made in Pakistan (e.g. in
Sialkot and Gujranwala) but are sold as smuggled goods with ‘Made in Japan’ or ‘Made in Korea”
forged stamps which are in high demand due to superior quality.
It is worth noting that the goods coming through transit via Pakistan are not the only goods that
enter Pakistan unlawfully. Other unauthorized commodities are also finding their way through
informal routes into Pakistan. These include: (i) cooking oil/ghee manufactured in the only plant in
Kabul and smuggled through Torkham/Ladikotal; (ii) Brazilian sugar (it is making its way into the
tribal belt of Pakistan although in small quantities - but it is on the rise); (iii) American knives,
bayonets and other tools; and (iv) Iranian machine-made synthetic carpets.
4. Electric iron (Phillips -Malaysian)
185 1,000 1,200 2,000 3,500
Afridi/ Shinwari/Turi/Wazir
25 50
5.
Microwave ovens (220/240 volts Phillips- Malaysian)
110 2,500 Rs 3,000 4,000 8,000
Afridi/ Shinwari/Turi/Wazir
50 62
6. Televisions (56 inch Samsung- South Korean)
145 45,000 48,000 74,000 78,000
Afridi/ Shinwari/Turi/Wazir 55 60
7.
Air conditioners(Haire 220/240volts)
136 18,000 25,000 40,000 65,000
Afridi/ Shinwari/Turi/Wazir
35 45
C. Vehicles, spare parts and tires
8. Jeep (Toyota Prado)
140 1,000,000
1,400,000 3,200,000
3,500,000 Afridi/ Shinwari/Turi/Wazir
30 50
9. Spare parts used (Toyota body)
120 60,000 70,000 120,000 140,000 Afridi/ Shinwari/Turi/Wazir
34 50
10.
Spare parts (used whole engine Toyota 2800cc to 4500cc)
110 45,000 95,000 110,000 120,000 Afridi/ Shinwari/Turi/Wazir
32 41
D. Crockery/Cutlery
11. Chinese (stone ware set for 6 people)
165 1,500 16,000 3,500 22,000
Afridi/ Shinwari
32 42
12. Bone china tea set (6 people)
165 1,200 5,500 3,400 8,000 Afridi/ Shinwari
23 35
13. Cutlery ( Chinese- 12 pieces)
145 850 2,200 1,000 4,000 Afridi/ Shinwari
63 85

USAID/Pakistan: Trade Project | UNAUTHORIZED TRADE BETWEEN PAKISTAN
AND AFGHANISTAN: A Preliminary Assessment of its Extent and Economic Impact 21
THE TRADING/ECONOMIC
ENVIRONMENT
One of the key objectives of this study is to examine the possible causes for the unauthorized transit
trade that is reportedly taking place. There are essentially two basic factors that determine the
economic incentives for smuggling: for a particular good this entails the level of demand, reflected in
the price differential and the size of the local market for the good; and the relative costs of legal and
illegal smuggling, which reflect the costs associated with seizures, bribes, etc.14
When a country imposes import duties or other taxes or trade restrictions on a good, it raises the
domestic price relative to the world price (and relative to the domestic prices in other markets with
lower tariffs and trade barriers). If the size of the market is sufficient and the costs of illegally
moving the goods into the country are sufficiently low, (i.e., below the costs that would be incurred
through legal importation) then smuggling activity may take place if the probabilities and penalties
associated with detection is sufficiently low. Therefore, it is possible that a major contributing factor
to the unauthorized transit trade taking place is the disparities in the trade policies of the two
countries. Very broadly, Pakistan has pursued trade policies aimed at providing protection for a
number of targeted import substitution industries. Afghanistan, since 2002, has followed a more
open trade policy characterized by generally lower import duties.
In this context, it is useful to distinguish between two ways in which unauthorized transit trade might
be taking place between Pakistan and Afghanistan, which will be referred to here as,
‘Type 1’ unauthorized trade which amounts to the diversion of goods before they enter
Afghanistan; and
‘Type 2’ unauthorized trade which is comprised of goods that physically enter Afghanistan
but are then illegally re-exported (smuggled) back into Pakistan.15
Pakistan has now ended its reliance on most forms of quantitative restrictions leaving tariffs as the
main trade policy instrument.16 In the medium term, the government is committed to maintaining
the liberalization process, reducing the level and disparities in tariff rates. In Pakistan, the average applied tariff in 2007/08 was 14.5 percent.17 It is high compared to the prevailing rates in all
successful exporting countries. There were 14 different ad valorem tariff rate bands, ranging from
zero to 90 percent and specific rates of duty on 44 products. In the 2008/09 budget, the
government increased duties on 300 non-essential and luxury items from the 15 to 25 percent range
to between 30 and 35 percent. These items include cosmetics, many domestic appliances, luxury
food items and cigarettes. The government also grants sector-specific duty exemptions,
14
There are other reasons for smuggling other than differential prices. There is a lot of money in circulation in
the “black” economy, which is reportedly used to finance smuggling. Gradually the money is turned “white” by
sale of such goods in the local markets. 15
Note that this type of smuggling could very well include goods that did not enter as transit trade, but which
may, for example, be imported to Afghanistan from Iran or Central Asia. 16
The most useful quantitative analysis on Pakistan’s trade policies can be found in Effective Protection of
Manufacturing Industries in Pakistan, (Study 2) for the Ministry of Commerce, Government of Pakistan, by
Innovative Development Strategies, pvt Ltd, Islamabad, and Trade Policies in South Asia, The World Bank,
September 2004 (in three volumes). (Given the changes in the regional trade environment that have taken place,
it would be useful for policy makers to update this analysis.) 17
This information is drawn from a variety of sources, including the 2009 National Trade Estimate Report on
Foreign Trade Barriers, Office of the US Trade Representative.

USAID/Pakistan: Trade Project | UNAUTHORIZED TRADE BETWEEN PAKISTAN
AND AFGHANISTAN: A Preliminary Assessment of its Extent and Economic Impact 22
concessions, and protections under Statutory Regulatory Orders (SROs). (Note further information
is needed to assess the potential impacts of SROs in this regard and to produce comparable table
and figure for Pakistan’s tariff rate structure.)
Pakistan’s tariffs reflect a cascading rate structure where in general the tariff rates for final goods are
higher than those for raw material and intermediate goods. Based on the tariff rates for 2004/05,
the average tariffs for each level of production were:18
Raw materials 10.78 percent;
Semi-processed goods 12.54 percent; and
Fully processed products 19.77 percent.
Although the average tariff rate during the last five years has declined from 17.09 percent to 14.5
percent, it would appear that a similar cascading structure continues to be embodied in the current
tariff rate structure.
Afghanistan, in contrast, has a lower average tariff rate; the simple average tariff rate in 2008/09 was
5.65 percent.19 Tariffs fall into 12 bands, although over 93 percent of rates fall into the bands for 2.5
percent, 5 percent and 10 percent (See Table 9, below). The current tariff rate structure represents
a significant simplification from as recently as 2003, when there was a highly complicated and
differentiated tariff regime with 27 tariff bands, rates varying from zero to 150 percent with an
average rate of 43 percent.20 The Afghan tariff rate structure also cascades, with higher rates on
finished goods, lower rates on manufactured inputs and lowest rates on basic raw materials.21
Table 9: Afghanistan Tariff Rate Structures
No Tariff Band Tariffs Lines in Band
1 0 28
2 1 64
3 2.5 1663
4 3.5 11
5 5 1968
6 8 31
7 10 1078
8 12 5
9 16 170
10 20 6
11 25 10
12 40 5
18
See the Ministry of Commerce study on effective protection cited above. 19
Afghanistan’s trade policy is contained in two documents produced by the Ministry of Commerce and Industry,
Trade and Tariff Policy – Afghanistan and Trade and Tariff Policy Framework, May 2008. 20
Note that because an administered exchange rate was used in calculating tariffs, which was about 10
percent of the prevailing exchange rate, the effective tariff rate was much lower. Now tariffs are based on the
current market determined exchange rate published daily by Da Afghanistan Bank (the central bank). 21
A cascading tariff structure tends to be biased against production activities characterized by high value added (e.g., agriculture) and consequently is biased towards low value added activities (e.g., simple assembly).

USAID/Pakistan: Trade Project | UNAUTHORIZED TRADE BETWEEN PAKISTAN
AND AFGHANISTAN: A Preliminary Assessment of its Extent and Economic Impact 23
No Tariff Band Tariffs Lines in Band
5039
Source: Ministry of Commerce and Industry, Government of Islamic Republic of Afghanistan
Source: Ministry of Commerce and Industry, Government of Islamic Republic of Afghanistan
The most critical question in this context is the difference between the tariff rates for the specific
goods entering Pakistan for Afghan transit trade. Using the detailed data for goods admitted at
Karachi Port and Port Qasim for transit to Afghanistan reported by the Government of Pakistan (i.e.,
8-digit HS code) it has been possible to match the relevant tariff rates for each country. (Note that
because the Afghan tariff rate structure is less detailed than Pakistan’s rate structure, and because
the variation in tariff rates is much less, it was not possible to identify an unambiguous link.) The
results for 2008/09 for all goods which contributed 0.25 percent or more to total transit trade for
that year are presented in Table 10. (This accounted for more than 70 percent of total transit trade
reported for 2008/09.)
There were five tariff lines for different types of edible oils where Pakistan maintains specific duties.
Based on the value and quantity data provided, it was possible to estimate an ad valorem duty rate in
each case. These estimates were included in Table 10:
1511.9020 Palm oil 10,800/MT 5.4%
1511.9030 Palm oil 9,050/MT 3.8%
1516.2010 Vegetable fats 10,200/MT 0.9%
1516.2020 Vegetable oil 10,200/MT 7.3%
1517.9000 Margarine 10,800/MT 25.7%
(These estimates of tariff equivalents may be made more robust with additional information to be
obtained from Pakistan Customs.)
The principal interest in the estimates presented in Table 10 in this context is the relationships
between the two countries’ tariff rates. The table has been sorted by the size of the tariff rate
differential, with the largest differences at the top. Overall, the (un-weighted) average for Pakistan
tariffs for these goods is 17.0 percent; for Afghanistan tariffs the average is 6.0 percent; leading to an
average 11.0 percent differential. This no doubt encourages smuggling of goods that legally enter
into Afghanistan before being illegally re-exported to Pakistan.
0%
5%
10%
15%
20%
25%
30%
35%
40%
0 1 2.5 3.5 5 8 10 12 16 20 25 40
0.6% 1.3%
33.0%
0.2%
39.1%
0.6%
21.4%
0.1% 3.4%
0.1% 0.2% 0.1%
Afghanistan: Breakdown of Tariff Bands with percentage of tariff lines in each band
% Tariff lines

USAID/Pakistan: Trade Project | UNAUTHORIZED TRADE BETWEEN PAKISTAN
AND AFGHANISTAN: A Preliminary Assessment of its Extent and Economic Impact 24
Table 10: Afghanistan and Pakistan Tariff Rate Differential for Transit Goods (2008/09)
HS Code Description Share
TT PAK
Tariff AF
Tariff Difference
8703.2321 Components to assemble vehicles 0.27% 100 25 75 3401.1100 Soap (toilette) 0.31% 35 5 30 3401.1900 Soap 0.39% 35 5 30 1905.9000 Bread, biscuits 0.29% 35 10 25 2106.9090 Food prep NEC 2.43% 35 10 25 8516.8090 Electric heaters (other) 0.38% 30 5 25 9403.3000 Furniture 0.31% 35 10 25 1517.9000 Margarine 0.65% 25.7 2.5 23.2 0207.1300 Chicken 0.59% 25 2.5 22.5 0207.3600 Frozen chicken 0.81% 25 2.5 22.5 1701.1100 Cane sugar 0.71% 25 2.5 22.5 4011.1000 Tyres 0.37% 25 2.5 22.5 4012.1100 Used tyres 1.61% 25 2.5 22.5 1701.9910 White sugar 1.34% 25 5 20 1901.9090 Food preparations (eg,malt extract) 1.42% 30 10 20 8537.1090 Electric panels 0.67% 25 5 20 4809.2000 Paper (self-copy) 0.26% 20 2.5 17.5 8502.1120 Electric generators 0.30% 20 2.5 17.5 2710.1951 Lubricating oil 0.74% 25 8 17 2105.0000 Ice cream 0.28% 35 20 15 3924.9000 Tableware 0.50% 25 10 15 4803.0000 Toilette tissue stock 0.45% 20 5 15 4823.9090 Paper (other) 0.34% 25 10 15 9406.0090 Prefab buildings 1.32% 25 10 15 5407.5200 Woven fabrics 1.70% 15 2.5 12.5 5512.1900 Synthetic fabric 13.30% 15 2.5 12.5 5512.2900 Synthetic fabric 0.43% 15 2.5 12.5 5514.1900 Synthetic fabric 0.28% 15 2.5 12.5 5514.2100 Synthetic fabric 1.05% 15 2.5 12.5 8502.1200 Generator sets 1.24% 15 2.5 12.5 8502.1310 Electric generators 0.37% 15 2.5 12.5 3926.9099 Office supplies (other) 0.30% 20 10 10 0902.2000 Tea 0.98% 10 2.5 7.5 0902.4020 Tea 2.19% 10 2.5 7.5 0902.4090 Tea 1.83% 10 2.5 7.5 3004.2000 Medicines (antibiotics) 0.34% 10 2.5 7.5 3004.3900 Medicines (other) 0.33% 10 2.5 7.5 7210.4990 Flat rolled iron 0.26% 10 2.5 7.5 8504.4090 Electric transformers 0.95% 10 2.5 7.5 0902.3000 Tea (black) 0.37% 10 5 5 1701.9100 Sugar w/ flavouring 0.54% 10 5 5 1701.9990 Sugar 0.42% 10 5 5 1516.2020 Vegetable Oil 3.76% 7.3 2.5 4.8 1511.9020 Palm oil 0.38% 5.4 2.5 2.9 4011.2090 Tyres (other) 0.36% 5 2.5 2.5 8417.1090 Furnaces & oven 0.49% 5 2.5 2.5 8428.3100 Machinery for lifting 0.27% 5 2.5 2.5 8479.1000 Machinery 0.25% 5 2.5 2.5 8479.9090 Machinery (other) 1.08% 5 2.5 2.5 1511.9030 Palm oil 1.04% 3.8 2.5 1.3 0407.0090 Eggs 0.54% 5 5 0 7219.9090 Flat rolled stainless steel 0.55% 5 5 0 7612.9010 Aluminium drums 0.27% 10 10 0

USAID/Pakistan: Trade Project | UNAUTHORIZED TRADE BETWEEN PAKISTAN
AND AFGHANISTAN: A Preliminary Assessment of its Extent and Economic Impact 25
HS Code Description Share
TT PAK
Tariff AF
Tariff Difference
8609.0000 Containers for transport fluids 1.76% 10 10 0 9901.0000 UN Imports 0.33% 0 0 0 9901.0000 UN Imports 0.25% 0 0 0 9902.0000 Diplomatic goods 11.03% 0 0 0 9902.0000 Diplomatic goods 1.44% 0 0 0 1516.2010 Vegetable fats 0.45% 0.9 2.5 -1.6 0202.3000 Meat (frozen) 0.27% 0 2.5 -2.5 0204.4200 Meat (sheep/goat) 0.74% 0 2.5 -2.5 2201.1010 Mineral waters 0.44% 35 40 -5 2202.9000 Soft drinks 0.44% 35 40 -5 8525.8090 TV transmission equipment 0.26% 5 10 -5 8540.7900 Valves and tubes 0.72% 5 10 -5
Source: Project estimates
Although it is impossible to be precise about how much of a tariff rate differential would be required
to make significant unauthorized trade financially attractive (subject to the probability of goods
seized and penalties applied), it does appear that the disparities are substantial. The view of
Customs officials is evidently that the 12.5 percent tariff rate differential for synthetic fabrics (HS
5512 and 5514) is sufficient to lead to widespread smuggling. (It has been suggested that this view is
supported by the very large number of Bara Market’s selling smuggled fabrics throughout the
country.) It is also argued by Customs that for some goods smuggling is profitable with tariff rate
differentials as low as 4 percent.
Consider tariff rate differentials for the types of goods where it is argued that substantial amounts of
unauthorized transit trade are taking place:
Electric heaters 25%;
Tires 22.5%;
Electric generators 17.5%;
Synthetic fabrics 12.5%;
Tea 7.5%.
All of these (except tea) have ‘above average’ tariff rate differentials, lending weight to the argument
that the unauthorized transit trade taking place is being driven at least in part by differences in trade
policies.22 (There are a number of goods where the differential is zero or negative i.e. where the
Afghan tariff is higher than that for Pakistan, including mineral waters and soft drinks.)
Undoubtedly tariff rate differentials alone do not fully account for smuggling. The costs of
transportation and the probability-weighted costs of interdiction must also be taken into account.
Insight into the types of goods that are being smuggled can be drawn from the reports by Customs
on the goods that are being seized (see Table 11).
Table 11: Goods Seized by Pakistan Customs in 2007 and 2008 (Rupees and Percentages)
PTC Code Description of Goods June 2007 Percentage June 2008 Percentage
5407.0000 Vehicles U/S 16 (NDP) 2,828,348,726 69.9% 1,129,217,238 52.0%
8703.0000 Vehicles U/S 157 514,371,635 12.7% 334,848,659 15.4%
22
Keep in mind that the average differential of 11 percent refers to the average of the goods included in Table-
8. However, this is not inconsistent with the difference in simple (unweighted) average tariffs: 14.5 percent for
Pakistan and 5.6 percent for Afghanistan, yielding a differential of 8.9 percent.

USAID/Pakistan: Trade Project | UNAUTHORIZED TRADE BETWEEN PAKISTAN
AND AFGHANISTAN: A Preliminary Assessment of its Extent and Economic Impact 26
PTC Code Description of Goods June 2007 Percentage June 2008 Percentage
Misc. Goods 194,349,346 4.8% 213,288,076 9.8%
802.0000 Cloth F/O 131,833,167 3.3% 98,320,893 4.5%
7104.0000 Liquor 65,669,214 1.6% 86,378,907 4.0%
3003.0000 Medicine 62,746,810 1.6% 7,904,441 0.4%
9706.0000 Antiques 30,000,000 0.7% 2,022,800 0.1%
2710.0000 Diesel 29,363,348 0.7% 11,344,856 0.5%
9902.3000 Tea 27,384,058 0.7% 22,286,791 1.0%
9302.0000 Currency (Pak) 26,518,482 0.7% 9,505,040 0.4%
106.0000 Gold/Silver 25,897,827 0.6% - 0.0%
7113.0000 Petrol 21,854,662 0.5% 3,343,120 0.2%
8708.0000 Tyres & Tubes 17,631,777 0.4% 16,615,353 0.8%
2402.2000 Electronic Goods 17,233,278 0.4% 157,620,125 7.3%
9101.0000 Auto/Spare Parts 15,750,692 0.4% 22,665,267 1.0%
2710.0000 Mobil Oil 9,769,644 0.2% 5,027,278 0.2%
2710.0000 Timber 5,854,500 0.1% 5,866,199 0.3%
6301.0000 Blankets 3,929,620 0.1% 676,802 0.0%
2710.0000 Grease 2,938,328 0.1% 337,680 0.0%
9302.0000 Currency (For US$) 2,552,580 0.1% 25,658,700 1.2%
2402-2000 Cigarettes(Fake/Foreign) 1,949,992 0.0% 4,089,330 0.2%
4011-4013 Food Grains 1,813,156 0.0% 175,000 0.0%
9923.0000 Betel Nuts 1,118,263 0.0% - 0.0%
Cooking Oil & Vegetable Ghee
1,094,105 0.0% 5,670,869 0.3%
5701.0000 Carpets 963,350 0.0% 726,800 0.0%
Toiletries 733,892 0.0% 1,846,523 0.1%
Dinner Set/Crockery 660,342 0.0% 1,565,172 0.1%
Arms & Ammunition 648,950 0.0% 1,076,684 0.0%
Gutka (All Brands/Origin)
551,600 0.0% 740,000 0.0%
8501.0000 Pirated CDs/DVDs 471,270 0.0% 700,200 0.0%
2403.0000 Pan Parag/Zafrani Patti 338,720 0.0% 200,000 0.0%
Urea 273,250 0.0% 131,000 0.0%
9503.0000 Toys - 0.0% 472,390 0.0%
TOTAL 4,044,614,584 2,170,322,193
There are a number of points to be drawn from Table 11:23
The totals amount to relatively small proportions of the total Afghan trade for these years:
7.12 percent in 2007 and 1.85 percent for 2008. While Afghan transit trade was increasing
substantially, the total amounts of goods seized was declining. The seizures recorded above
are by Customs which constitute 90 – 95 percent of total seizures.
23
It should be noted that these data do not appear to fully correspond to the transit data presented earlier.
Further work needs to be done to identify the extent of the discrepancies that may exist. The data available is for
Customs Department only. Reportedly this corresponds to about 95 percent (plus) of all goods seized excluding
drugs e.g. Heroin, Marijuana etc. Seizures by various agencies including Customs are estimated to be about 5
percent of all the smuggled goods. This will take the volume of smuggling to Rs.80 billion in 2006 – 2007 (USD
1.3 billion) and Rs.40 billion in 2007 – 2008 (USD 700 million)

USAID/Pakistan: Trade Project | UNAUTHORIZED TRADE BETWEEN PAKISTAN
AND AFGHANISTAN: A Preliminary Assessment of its Extent and Economic Impact 27
These seizures include substantial amounts of illicit goods (illegal in this context), such as
liquor, pirated CDs/DVDs, currency (fake and otherwise), gold/silver, antiques, etc, that have
no bearing on the Afghan transit trade regime.
A number of goods where substantial transit trade takes place are reflected in this list,
including cloth, tea, tires and electronic goods.
The largest category of goods, by a substantial margin, is vehicles that were seized. These
accounted for 82.6 percent of the total in 2007 and 67.4 percent of the total in 2008. It
should be noted that these goods are imported to Afghanistan through Iran from Japan and
UAE.
In summary, while Pakistan and Afghanistan maintain broadly similar structures in their trade policies,
Pakistan’s tariff rates are generally significantly higher, particularly for the types of goods where it is
argued that substantial amounts of unauthorized trade are taking place. Pakistan’s average tariff rate
is 14.5 percent, some two and one-half times the average tariff for Afghanistan (i.e., 5.65 percent).
Note, however, that Pakistan’s tariff rates do not exceed those for Afghanistan in every case; for
goods such as edible fats, meat and soft drinks, the duties in Afghanistan are higher. Nevertheless,
for the key goods where it is asserted that there are substantial leakages from the transit trade, it
would appear that the incentives to smuggle as measured by the differences in tariff rates are
significant, (i.e., electric heaters and generators, tires, synthetic fabrics and tea). The fact that some
of these goods are also reported among the types of goods seized by Pakistan Customs, albeit not
necessarily in large quantities, is consistent with this view.
More detailed analysis, on a good-by-good basis, would be possible and should be undertaken. For
example, consider tea. The Pakistan Tea Association, in a presentation to the Karachi Chamber of
Commerce and Industry, argued that the total market for tea in Pakistan is approximately 175
million kilograms per year (i.e., an average of one kilogram per person)24. 105 million kg were
imported officially, leaving an estimate of 70 million kilograms of tea being smuggled. The data for
tea entering the transit trade indicated a total of 91 million kilograms in 2007/08 and 111.9 million
kilograms in 2008/09. If the consumption estimate of one kilogram per person is accurate,
Afghanistan’s population being 28.4 million suggests that somewhere between 62.7 million to 83.5
million kilograms went elsewhere. This is precisely what the Pakistan Tea Association asserted,
although it is difficult to determine how much of this calculated surplus found its way to Pakistan’s
markets. However, it should be stressed that the United Nations Food and Agriculture
Organization (FAO) estimated that per capita tea consumption in Pakistan ranged between 0.65 kg
and 0.89 kg25. If actual consumption were 0.6 kg per capita, slightly below the bottom of the
estimated range, then total consumption would have been entirely met by official imports. Having
said that, it is a widely known fact that markets in Peshawar and other cities in NWFP are flooded
with black Tea (bulk packing) imported in transit to Afghanistan. Secondly, it is often argued that
Black Tea consumption in Afghanistan is quite low and they generally prefer Green Tea. This
obviously needs further analysis.
24
See the article in the Daily News cited above. 25
This covered the years 1994 to 2003. See UN FAO report by the Intergovernmental Group on Tea, July
2005.

USAID/Pakistan: Trade Project | UNAUTHORIZED TRADE BETWEEN PAKISTAN
AND AFGHANISTAN: A Preliminary Assessment of its Extent and Economic Impact 28
RECOMMENDATIONS
The available information presented in this paper is consistent with the view that substantial amounts
of unauthorized goods are entering Pakistan (the report accepts the unofficial level of USD 2 billion
provided in the earlier USAID paper on The Economic Impact of APTA on Pakistan). Given the time
and resource constraints, the report was not able to quantify the volume of authorized trade or its
disaggregation into the two forms of unauthorized trade—trade diversion and illegal re-export,
although some estimates had suggested that about 70 percent of the unauthorized trade in value
terms is the illegal re-exports of Afghanistan into Pakistan.
Most of this unauthorized trade is carried out along the non-formalized border crossing between the
two countries. If the APTTA formalizes a number of these border crossings, and Pakistan over time
harmonizes tariffs between the two economies in a manner that removes some of the incentives to
smuggling, especially of items such as tea and electronic goods, it is likely that a large majority of the
currently illegal trade would come through official channels, allowing Pakistan to collect Customs
revenues. The earlier USAID paper estimates about USD 135 million of revenue gain for Pakistan
from APTTA.
The key immediate issue concerns ways in which the goods entering through Karachi and Port
Qasim for transit can be more effectively handled, increasing the prospect that these goods will
efficiently arrive at the appropriate border crossing for processing by the Afghanistan Customs
Department. The following steps warrant consideration in this regard:
Improve procedures in ways that would reduce both the incentive and the opportunity to
smuggle these types of goods into Pakistan and make it easier and more cost effective to
maintain control over the movement of goods through the country. For example, further
study should be undertaken to examine: border procedures; the role of Customs brokers;
pre-arrival information and processing; targeting/selectivity; dwell times; control of
exemptions; accountability measures; development of comprehensive IT based information
sharing program for Pakistani and Afghan Customs; other government department/agency
requirements; legal impediments; etc. With this in mind a ‘gap analysis’ is currently underway
in Pakistan that will determine the current state with respect to Customs procedures and
compare this with the desired ‘end state’ as envisaged in the APTTA. Preliminary findings
indicate that there are a number of effective measures that can be undertaken to address
deficiencies. A similar assessment of the physical infrastructure and human resource
capacity is needed for Customs to carry out its functions effectively needs to be undertaken
which will also help in establishing the ground realities and suggest improvements.
Strengthen the Bonded Transport and Guarantee System: There needs to be
improvements in the use of bonded carriers and an internationally, regionally or nationally
valid guarantee system for transit trade to safeguard revenue in case of inland diversion of
transit goods. It would appear, as a preliminary result of the ‘gap analysis’ that such a system
is not in place in Pakistan. Transit trade moves only through the Pakistan Railway or the
National Logistic Cell (NLC)26, both of which are government operated agencies. A Pakistan
government agency guarantee for payment of customs duty and taxes owing on diverted
Afghan owned trade does not appear to be the most effective system of revenue protection.
A Guarantee System should be introduced that will include mechanisms for accepting a
mandatory bond/guarantee for Transit from a Customs bonded entity, then subsequently
26
Afghan commercial transit goods moved exclusively by Pakistan Railway under the Afghan Transit Trade
Agreement (ATTA), 1965, and non-commercial Afghan transit goods were moved by NLC. In 2005, in order to
facilitate Afghan transit trade, the NLC was authorized to carry Afghan commercial goods as well.

USAID/Pakistan: Trade Project | UNAUTHORIZED TRADE BETWEEN PAKISTAN
AND AFGHANISTAN: A Preliminary Assessment of its Extent and Economic Impact 29
releasing the bond (this bond/guarantee system does not yet exist) only when the goods
reach the final destination within Afghanistan. Currently, goods are entered into Afghanistan
at the border post, however, they are not cleared until they reach an ASYCUDA Inland
Customs Department (ICD), which in most cases will be one of the major economic
centers, (i.e., Kabul, Mazar-e-Sharif, Herat, Kandahar and Jalalabad). All of these, except
Jalalabad, are some distance from the border. Initial findings of the ‘gap analysis’ indicate that
in order for this system to be effective and reliable, a transit system must be designed
wherein reliable, auditable and bonded carriers move the goods into Afghanistan. These
goods should travel under a bond that is only released once a verifiable and reliable Customs
entry document is processed and communicated back to the point of origin. In light of
Afghanistan’s current import processing regime, it is difficult to rely on the information
exchanged with Afghanistan. Establishing a Customs data exchange system between the two
countries will help in reconciliation/verification of such information.
Improve entry procedures at Karachi and Port Qasim in order to ensure more
accurate documentation. Under the current Afghan trade transit regime, documentation
presented upon arrival of goods moving in-transit through Pakistan to Afghanistan are
accorded only the most cursory of examinations by Customs. However, in Afghanistan and
Pakistan, it is widely understood that there is a large informal trading sector in which
invoices are absent and where use of under-invoicing and mis-description with respect to
imported goods is widespread. In response to the concern for the high risk of Afghan in-
transit goods being diverted, a more thorough accounting is required to provide the
protection of potential revenue leakage. Thus, using risk management techniques, a more
thorough verification of supporting documentation in respect to value and description of the
goods and the exchange of this information between Customs administrations would be in
the interest of both governments. The preliminary findings of the ‘gap analysis’ suggest that
the appropriate methods for addressing these issues are the implementation of a reliable and
comprehensive national import/export data collection system that includes information
related to Customs value, description of goods and quantities involved, and information
exchange process between Afghanistan and Pakistan. Furthermore, this system must be
supported by the development of an effective Customs ‘post entry’ audit capability in both
countries and the identification of reliable, auditable carriers which would ultimately help to
develop a system of voluntary compliance with respect to these issues. Incentives must be
developed and implemented that reward ‘good’ importers/exporters/carriers with, for
example, expedited clearance and the opportunity to profit from the new system (which will
mean privatizing certain transit activities currently undertaken by the GoP). This could be
started through some public/private partnership Transport Scheme where the private sector
would control the operations after Customs have cleared the goods for transit. The public
sector should have only a regulatory and supervisory role.
Alternative means for directly controlling ATTA imports through a modern risk
management system: An approach through quotas or a negative list has not worked
very well since it provides uncontrolled discretionary powers to the authorities. A modern
risk management that would be based on the initiatives discussed in the previous paragraph
should instead be adopted on ATTA imports in troublesome categories.
Better control over ATTA transshipments: There are four places where containers
are de-stuffed and then reloaded on Railway wagons (Covered) and Afghan Trucks. These
locations are Amangarh, Peshawar Railway Station, Karachi Port Trust (Transit Shed—for
loading in covered railway wagons) and Chaman. It is suspected that most of the Type 1
smuggling, takes place after this de-stuffing. There is, therefore, a need to probe this further
and also to see if this de-stuffing can be avoided and some alternate mechanism adopted.
Trade policy reforms: In the medium to long term, smuggling will continue to take place
for as long as there are sufficiently high financial incentives to do so. Borders can be made
less porous, but only over time and at high cost. The primary reason for the underlying

USAID/Pakistan: Trade Project | UNAUTHORIZED TRADE BETWEEN PAKISTAN
AND AFGHANISTAN: A Preliminary Assessment of its Extent and Economic Impact 30
incentives for smuggling is the intention by both countries to maintain fundamentally
different orientations in their trade policies. (Actually these differences in trade policy
orientation extend to other countries in the region as well.) In the medium to long term,
the only viable solution to unauthorized transit trade will be to substantially reduce the
incentives and the opportunities for smuggling through increased consistency in approaches
to trade and through greater regional economic integration. As a first step to this process,
Pakistan will need to further rationalize its tariffs and bring it down to a single digit level.
The earlier USAID paper on The Economic Impact of APTTA on Pakistan had clearly
indicated the tremendous benefits from APTTA in the Short-Run, and in the Medium to
Long-Run that will accrue to the Pakistani economy. These are recapitulated below:
Short-Run Impact
Foreign Exchange gain of USD 150 to 170 million arising out of the improved efficiency of
the cross-border infrastructure between Afghanistan and Pakistan. According to estimates
coming from experts in trade facilitation, the transaction costs imposed by inefficient
borders range from 10-15 percent of the total value of trade crossing borders. Based on
these figures, the transaction costs of Afghanistan-Pakistan cross-border trade (currently
around USD 1.2 billion) can be estimated to be the region of USD 150-170 million.
Customs revenue gain of around USD 135 million with the unauthorized trade estimated to
be around USD 2 billion. Most of this trade is carried out along the non-formalized border
crossing between the two countries. If the APTTA formalizes a number of these border
crossings, and harmonizes tariffs between the two economies in a manner that removes
some of the incentives to smuggling, especially of such items such as tea and electronic
goods, it is likely that a large majority of the currently illegal trade would come through
official channels, allowing Pakistan to collect Customs revenues.
With the better connectivity between the border regions of Afghanistan and Pakistan, cross-
border trade between North West Frontier Province (NWFP), Federally Administered
Tribal Areas (FATA) in Pakistan and the 13 major border provinces in Afghanistan is bound
to increase. As economic development and increase in consumption follows new and more
focused foreign aid and foreign direct investment (FDI) in the border areas, demand from
consumer goods, especially from Pakistan’s relatively more sophisticated manufacturing and
agriculture sector is also expected to take-off. In realistic terms and increase of around
USD 130-150 million worth of Pakistani exports (to border regions of Afghanistan) can be
expected to materialize within the first couple of years of the agreementi.
Medium to Long-term impact
A more developed Afghanistan will import much more from Pakistan. If the development
goals of renewed reconstruction efforts are met, investment and consumption should rapidly
scale up in Afghanistan. Pakistan is a major producer of several items of low-cost
manufacturing and agricultural products that will find a ready market in Afghanistan. Linkages
between Pashtun- owned businesses are likely to prosper across the border given their
close cultural and kinship connections
Pakistani exports to Central Asian region are less than 1 percent of their total portfolio. An
effective APTTA will over the long-run help Pakistan make inroads into this growing market.
Given Pakistan human-resource skills and growing maturity in services sectors such as
banking, media, education, and construction, it should be well placed to make gains in the
export of services to the Central Asian countries

USAID/Pakistan: Trade Project | UNAUTHORIZED TRADE BETWEEN PAKISTAN
AND AFGHANISTAN: A Preliminary Assessment of its Extent and Economic Impact 31
Both Pakistan and Afghanistan are energy importers. The APTTA will provide the
institutional building block for a future energy corridor that links South Asia and Central
Asia, addressing the energy security concerns of Afghanistan and Pakistan, as well as enabling
both economies to earn substantive transit fees for the gas and oil pipelines that pass
overland through their territory
Pakistan will emerge as the hub of trade and investment for the larger region that connects
Middle-East, Central Asia, and South Asia. The regional business networks based in Pakistan
will attract significant amount of FDI. Over time, this regional trade, transit and energy
corridor can extend to include India to the east and beyond emerging as a new ‘silk route’
for the 21st century
Economic development and commercial links, especially in the Afghanistan-Pakistan border
region will help in winning the war on terror, as local populations develop a stake in peace
and the maintenance of stable borders
The implementation of the proposed Reconstruction Opportunity Zones (ROZs), the bill
for which is before the US Congress, will provide another important vehicle towards the
rapid development of the depressed border areas. Success of the ROZs is, to a great extent,
predicated upon a functioning APTTA.
This paper corroborates the findings of the earlier USAID report that APTTA will be a win-win for
both Pakistan and Afghanistan, and that it will in no way promote or increase unauthorized trade.
The importance of the APTTA should be seen in this forward-looking perspective. For Pakistan, the
successful implementation of APTTA would provide the opportunity to develop, over the longer
run, as a trade and investment hub linking business networks in South, Middle-East, and Central Asia.
For Afghanistan, it would provide the external markets that are essential for a small economy to
achieve sustainable levels of economic growth.

USAID/Pakistan: Trade Project | UNAUTHORIZED TRADE BETWEEN PAKISTAN
AND AFGHANISTAN: A Preliminary Assessment of its Extent and Economic Impact 32
APPENDIX – I: AFGHAN TRANSIT TRADE THROUGH KARACHI AND PORT
QASIM: By HS Section and Chapter (In Pak Rupees)
Description July 2008-June 2009 July 2007-June 2008
Animal and Animal Products
02 MEAT & EDIBLE MEAT OFFAL 3,272,068,757 2.79% 2,853,162,285 5.02%
03 FISH & CRUSTACEANS 23,091,960 0.02% 328,276 0.00%
04 DAIRY, EGGS, HONEY & EDIBLE PRODUCTS 1,828,641,136 1.56% 1,035,746,212 1.82%
05 PRODUCTS OF ANIMAL ORIGIN 4,893,811 0.00% 10,277,007 0.02%
5,128,695,664 4.37% 3,899,513,780 6.87%
Vegetable Products
06 LIVE TREES & OTHER PLANTS 1,239,115 0.00% 3,624,826 0.01%
07 EDIBLE VEGETABLES 226,688,787 0.19% 184,119,018 0.32%
08 EDIBLE FRUITS & NUTS, PEEL OF CITRUS/MELONS 175,553,279 0.15% 85,076,443 0.15%
09 COFFEE, TEA, MATE & SPICES 6,567,489,821 5.60% 2,930,907,124 5.16%
10 CEREALS 346,581,419 0.30% 15,071,641 0.03%
11 MILLING INDUSTRY PRODUCTS 206,267,761 0.18% 39,261,244 0.07%
12 OIL SEEDS/MISC. GRAINS/MED. PLANTS/STRAW 62,574,677 0.05% 103,509,957 0.18%
13 LAC, GUMS, RESINS, ETC. 1,004,789 0.00% 2,038,397 0.00%
14 VEGETABLE PLAITING MATERIALS 369,072 0.00% 2,917,538 0.01%
15 ANIMAL OR VEGETABLE FATS, OILS & WAXES 7,806,205,682 6.66% 3,828,629,408 6.74%
15,393,974,402 13.12% 7,195,155,596 12.67%
Foodstuffs
16 EDIBLE PREP. OF MEAT, FISH, CRUSTACEANS, ETC 256,570,260 0.22% 144,869,066 0.26%
17 SUGARS & SUGAR CONFECTIONERY 3,782,289,286 3.22% 3,973,919,904 7.00%
18 COCOA & COCOA PREPARATIONS 43,176,947 0.04% 31,811,882 0.06%
19 PREPS. OF CEREALS, FLOUR, STARCH OR MILK 2,089,111,934 1.78% 2,345,123,837 4.13%
20 PREPS OF VEGS, FRUITS, NUTS, ETC. 663,533,342 0.57% 225,543,044 0.40%

USAID/Pakistan: Trade Project | UNAUTHORIZED TRADE BETWEEN PAKISTAN
AND AFGHANISTAN: A Preliminary Assessment of its Extent and Economic Impact 33
Description July 2008-June 2009 July 2007-June 2008
21 MISC. EDIBLE PREPARATIONS 3,625,311,252 3.09% 2,303,762,677 4.06%
22 BEVERAGES, SPIRITS & VINEGAR 1,484,333,260 1.27% 966,542,090 1.70%
23 RESIDUES FROM FOOD INDUSTRIES, ANIMAL FEED 4,939,295 0.00% 1,817,344 0.00%
24 TOBACCO & MANUF. TOBACCO SUBSTITUTES 77,724,722 0.07% 25,273,668 0.04%
12,026,990,298 10.25% 10,018,663,512 17.64%
Mineral Products
25 SALT, SULPHUR, EARTH & STONE, LIME & CEMENT 79,329,668 0.07% 14,327,923 0.03%
26 ORES SLAG & ASH 21,485,315 0.02% 437,937 0.00%
27 MINERAL FUELS, OILS, WAXES & BITUMINOUS SUB 1,927,256,355 1.64% 1,027,149,686 1.81%
2,028,071,338 1.73% 1,041,915,546 1.83%
Chemical and Allied Industries
28 INORGANIC CHEM, ORG/INORG COMPOUNDS OF PRECIOUS METALS, ISOTOPES
124,625,948 0.11% 117,872,376 0.21%
29 ORGANIC CHEMICALS 100,742,598 0.09% 68,317,454 0.12%
30 PHARMACEUTICAL PRODUCTS 1,712,295,109 1.46% 1,121,069,171 1.97%
31 FERTILIZERS 4,477,374 0.00% 1,311,768 0.00%
32 TANNING OR DYEING EXTRACTS, DYES, PIGMENTS, PAINTS & VARNISHES, PUTTY, & INKS
67,543,780 0.06% 18,615,513 0.03%
33 OILS & RESINOIDS, PERFUMERY, COSMETIC OR TOILET PREPARATIONS
675,663,020 0.58% 214,898,417 0.38%
34 SOAPS, WAXES, SCOURING PRODUCTS, CANDLES, MODELING PASTES, DENTAL WAXES
1,278,551,999 1.09% 604,288,409 1.06%
35 ALBUMINOIDAL SUB, STARCHES, GLUES, ENZYMES 28,850,203 0.02% 14,736,836 0.03%
36 EXPLOSIVES, MATCHES, PYROTECHNIC PRODUCTS 21,244,751 0.02% - 0.00%
37 PHOTOGRAPHIC OR CINEMATOGRAPHIC GOODS 38,267,215 0.03% 24,041,788 0.04%
38 MISCELLANEOUS CHEMICAL PRODUCTS 188,409,199 0.16% 747,488,924 1.32%
4,240,671,196 3.62% 2,932,640,656 5.16%
Plastics and Rubber
39 PLASTICS & ARTICLES THEREOF 2,247,330,496 1.92% 1,053,563,097 1.85%
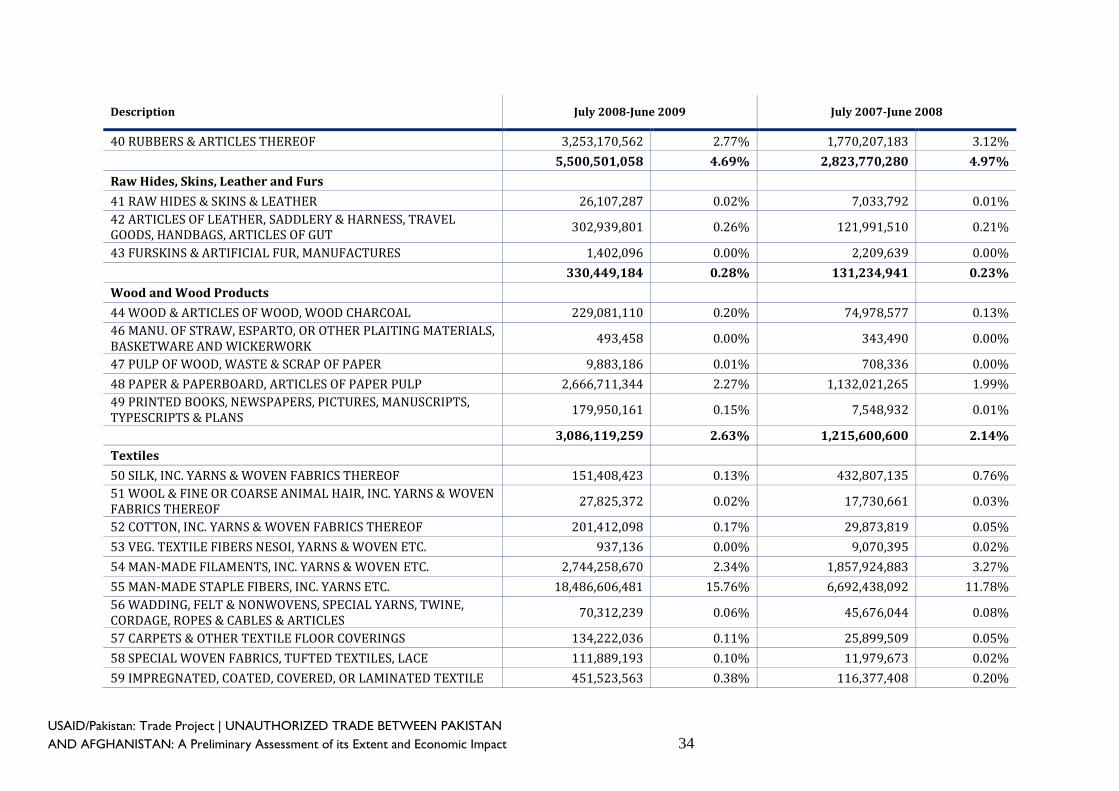
USAID/Pakistan: Trade Project | UNAUTHORIZED TRADE BETWEEN PAKISTAN
AND AFGHANISTAN: A Preliminary Assessment of its Extent and Economic Impact 34
Description July 2008-June 2009 July 2007-June 2008
40 RUBBERS & ARTICLES THEREOF 3,253,170,562 2.77% 1,770,207,183 3.12%
5,500,501,058 4.69% 2,823,770,280 4.97%
Raw Hides, Skins, Leather and Furs
41 RAW HIDES & SKINS & LEATHER 26,107,287 0.02% 7,033,792 0.01%
42 ARTICLES OF LEATHER, SADDLERY & HARNESS, TRAVEL GOODS, HANDBAGS, ARTICLES OF GUT
302,939,801 0.26% 121,991,510 0.21%
43 FURSKINS & ARTIFICIAL FUR, MANUFACTURES 1,402,096 0.00% 2,209,639 0.00%
330,449,184 0.28% 131,234,941 0.23%
Wood and Wood Products
44 WOOD & ARTICLES OF WOOD, WOOD CHARCOAL 229,081,110 0.20% 74,978,577 0.13%
46 MANU. OF STRAW, ESPARTO, OR OTHER PLAITING MATERIALS, BASKETWARE AND WICKERWORK
493,458 0.00% 343,490 0.00%
47 PULP OF WOOD, WASTE & SCRAP OF PAPER 9,883,186 0.01% 708,336 0.00%
48 PAPER & PAPERBOARD, ARTICLES OF PAPER PULP 2,666,711,344 2.27% 1,132,021,265 1.99%
49 PRINTED BOOKS, NEWSPAPERS, PICTURES, MANUSCRIPTS, TYPESCRIPTS & PLANS
179,950,161 0.15% 7,548,932 0.01%
3,086,119,259 2.63% 1,215,600,600 2.14%
Textiles
50 SILK, INC. YARNS & WOVEN FABRICS THEREOF 151,408,423 0.13% 432,807,135 0.76%
51 WOOL & FINE OR COARSE ANIMAL HAIR, INC. YARNS & WOVEN FABRICS THEREOF
27,825,372 0.02% 17,730,661 0.03%
52 COTTON, INC. YARNS & WOVEN FABRICS THEREOF 201,412,098 0.17% 29,873,819 0.05%
53 VEG. TEXTILE FIBERS NESOI, YARNS & WOVEN ETC. 937,136 0.00% 9,070,395 0.02%
54 MAN-MADE FILAMENTS, INC. YARNS & WOVEN ETC. 2,744,258,670 2.34% 1,857,924,883 3.27%
55 MAN-MADE STAPLE FIBERS, INC. YARNS ETC. 18,486,606,481 15.76% 6,692,438,092 11.78%
56 WADDING, FELT & NONWOVENS, SPECIAL YARNS, TWINE, CORDAGE, ROPES & CABLES & ARTICLES
70,312,239 0.06% 45,676,044 0.08%
57 CARPETS & OTHER TEXTILE FLOOR COVERINGS 134,222,036 0.11% 25,899,509 0.05%
58 SPECIAL WOVEN FABRICS, TUFTED TEXTILES, LACE 111,889,193 0.10% 11,979,673 0.02%
59 IMPREGNATED, COATED, COVERED, OR LAMINATED TEXTILE 451,523,563 0.38% 116,377,408 0.20%

USAID/Pakistan: Trade Project | UNAUTHORIZED TRADE BETWEEN PAKISTAN
AND AFGHANISTAN: A Preliminary Assessment of its Extent and Economic Impact 35
Description July 2008-June 2009 July 2007-June 2008
PROD, TEXTILE PROD FOR INDUSTRIAL USE
60 KNITTED OR CROCHETED FABRICS 105,260,598 0.09% 3,139,653 0.01%
61 ARTICLES OF APPAREL & CLOTHING ACCESSORIES-KNITTED OR CROCHETED
69,120,425 0.06% 43,361,795 0.08%
62 ARTICLES OF APPAREL & CLOTHING ACCESSORIES-NOT KNITTED OR CROCHETED
93,494,486 0.08% 44,037,141 0.08%
63 MADE-UP TEXTILE ARTICLES NESOI, NEEDLECRAFT SETS, WORN CLOTHING, RAGS
624,375,863 0.53% 379,010,505 0.67%
23,272,646,583 19.84% 9,709,326,713 17.09%
Footwear and Headgear
64 FOOTWEAR, GAITERS, & THE LIKE 237,038,585 0.20% 125,522,064 0.22%
65 HEADGEAR & OTHER PARTS 3,743,773 0.00% - 0.00%
66 UMBRELLAS, SUN UMBRELLAS, WALKING-STICKS, WHIPS, RIDING-CROPS & PARTS
1,374,811 0.00% 629,781 0.00%
67 PREPARED FEATHERS, HUMAN HAIR & ARTICLES THEREOF, ARTIFICIAL FLOWERS
2,451,117 0.00% 4,432,946 0.01%
244,608,286 0.21% 130,584,791 0.23%
Stone and Glass
68 ARTICLES OF STONE, PLASTER, CEMENT, ASBESTOS, MICA OR SIMILAR MATERIALS
272,597,554 0.23% 147,687,450 0.26%
69 CERAMIC PRODUCTS 530,687,877 0.45% 227,880,124 0.40%
70 GLASS & GLASSWARE 597,643,526 0.51% 319,438,754 0.56%
71 PEARLS, STONES, PREC. METALS, IMITATION JEWELRY, COINS 4,196,698 0.00% 556,079 0.00%
1,405,125,655 1.20% 695,562,407 1.22%
Metals
72 IRON & STEEL 1,507,458,060 1.29% 918,086,508 1.62%
73 ARTICLES OF IRON OR STEEL 1,190,642,911 1.02% 989,614,301 1.74%
74 COPPER & ARTICLES THEREOF 210,447,074 0.18% 67,026,993 0.12%
75 NICKEL & ARTICLES THEREOF 2,446,180 0.00% 1,026,011 0.00%
76 ALUMINUM & ARTICLES THEREOF 519,580,597 0.44% 164,584,389 0.29%

USAID/Pakistan: Trade Project | UNAUTHORIZED TRADE BETWEEN PAKISTAN
AND AFGHANISTAN: A Preliminary Assessment of its Extent and Economic Impact 36
Description July 2008-June 2009 July 2007-June 2008
78 LEAD & ARTICLES THEREOF 411,885 0.00% - 0.00%
79 ZINC & ARTICLES THEREOF 16,250,386 0.01% 2,165,734 0.00%
80 TIN & ARTICLES THEREOF 3,005,469 0.00% - 0.00%
81 BASE METALS NESOI, CERMETS, ARTICLES ETC. 4,927,083 0.00% 1,117,488 0.00%
82 TOOLS, SPOONS & FORKS OF BASE METAL 242,783,299 0.21% 97,811,929 0.17%
83 MISCELLANEOUS ARTICLES OF BASE METAL 212,814,067 0.18% 122,170,199 0.22%
3,910,767,011 3.33% 2,363,603,552 4.16%
Machinery and Electrical
84 BOILERS, MACHINERY & MECHANICAL APPLIANCES, COMPUTERS
6,412,296,438 5.47% 3,399,364,866 5.98%
85 ELECTRICAL MACHINERY & EQUIP. & PARTS, TELECOMMUNICATIONS EQUIP., SOUND RECORDERS, TELEVISION RECORDERS
10,666,480,656 9.09% 4,090,932,354 7.20%
17,078,777,094 14.56% 7,490,297,220 13.19%
Transportation
86 RAILWAY OR TRAMWAY LOCOMOTIVES, ROLLING STOCK, TRACK FIXTURES & FITTINGS, SIGNALS
2,060,955,180 1.76% 1,693,592,989 2.98%
87 VEHICLES OTHER THAN RAILWAY OR TRAMWAY ROLLING STOCK
2,279,550,613 1.94% 3,695,859,825 6.51%
88 AIRCRAFT, SPACECRAFT, & PARTS THEREOF 10,003,671 0.01% 689,096 0.00%
4,350,509,464 3.71% 5,390,141,910 9.49%
Miscellaneous
90 OPTICAL, PHOTOGRAPHIC, CINEMATOGRAPHIC, MEASURING, CHECKING, PRECISION, MEDICAL OR SURGICAL INSTRUMENTS & ACCESSORIES
731,566,384 0.62% 413,985,610 0.73%
91 CLOCKS & WATCHES & PARTS THEREOF 3,528,804 0.00% 3,921,287 0.01%
92 MUSICAL INSTRUMENTS, PARTS & ACCESSORIES 1,363,359 0.00% 163,605 0.00%
93 ARMS & AMMUNITION, PARTS & ACCESSORIES 1,932,370 0.00% - 0.00%
94 FURNITURE, BEDDING, CUSHIONS, LAMPS & LIGHTING FITTINGS NESOI, ILLUMINATED SIGNS, NAMEPLATES & THE LIKE,
2,755,200,761 2.35% 406,883,703 0.72%

USAID/Pakistan: Trade Project | UNAUTHORIZED TRADE BETWEEN PAKISTAN
AND AFGHANISTAN: A Preliminary Assessment of its Extent and Economic Impact 37
Description July 2008-June 2009 July 2007-June 2008
PREFABRICATED BUILDINGS
95 TOYS, GAMES & SPORTS EQUIP, PARTS & ACCES. 44,882,965 0.04% 26,766,777 0.05%
96 MISCELLANEOUS MANUFACTURED ARTICLES 382,743,674 0.33% 131,946,634 0.23%
97 WORKS OF ART. COLLECTORS' PIECES, ANTIQUES 1,548,360 0.00% - 0.00%
3,922,766,677 3.34% 983,667,616 1.73%
Services
99 MAINLY OFFICIAL AND DIPLOMATIC COVERED GOODS 15,375,059,324 13.11% 779,142,435 1.37%
TOTAL
117,295,732,493 100.00%
56,800,821,555
100.00%

i Population in Afghan provinces close to the Pakistan border is around 15 million, the per capita imports of Afghanistan is about
$151, a third of which comes from Pakistan. A doubling of that figure can be expected over a period of 2 years given the
cultural proximity and the growing economic needs of the Afghan border areas.
USAID Pakistan Trade Project
Deloitte Consulting, LLP
http://www.usaidpakistantrade.org