usaid/lebanonpdf.usaid.gov/pdf_docs/pa00k5ww.pdf · processed foods value chain assessment report 2...
TRANSCRIPT

USAID/LEBANON
PROCESSED FOODS VALUE CHAIN ASSESSMENT REPORT
LEBANON INDUSTRY VALUE CHAIN DEVELOPMENT (LIVCD) PROJECT
FEBRUARY 2014
This publication was produced for review by the United States Agency for International
Development. It was prepared by DAI.


PROCESSED FOODS VALUE CHAIN ASSESSMENT REPORT LEBANON INDUSTRY VALUE CHAIN DEVELOPMENT (LIVCD) PROJECT
Program Title: Lebanon Industry Value Chain Development (LIVCD)
Sponsoring USAID Office: USAID Lebanon
Contract Number: AID-268-C-12-00001
Contractor: DAI
Date of Publication: February 2014
The authors’ views expressed in this publication do not necessarily reflect the views of the United
States Agency for International Development or the United States Government.


PROCESSED FOODS VALUE CHAIN ASSESSMENT REPORT I
CONTENTS
1. OVERVIEW ................................................................................................................... 1
2. DETAILED ANALYSIS OF SELECTED PROCESSED FOODS .............................................. 13
3. PICKLED VEGETABLES ............................................................................................... 21
4. DAIRY PRODUCTS - WHITE CHEESES, LABNEH, AND AYRAN......................................... 26
5. READY-TO-EAT MEALS .............................................................................................. 34
6. BUSINESS ENVIRONMENT FACTORS AFFECTING THE PROCESSED FOODS VALUE CHAIN42
7. REGULATORY ENVIRONMENT FOR FOOD SAFETY ......................................................... 42
8. SPECIFIC GOVERNMENT AND DONOR PROJECTS OF RELEVANCE TO PROCESSED FOODS44
9. ACCESS TO FINANCE .................................................................................................. 45
10. FOOD PROCESSING COOPERATIVES ........................................................................... 45
11. UPGRADING STRATEGIES FOR PROCESSED FOODS ..................................................... 46
ANNEX A: CLASSIFICATION METHODOLOGY .......................................................................... 50
ANNEX B: FOOD PROCESSING COOPERATIVES ...................................................................... 51
ANNEX C: LIST OF DONORS & NGO’S THAT SUPPORTED COOPERATIVES ACROSS ALL LEBANESE
RURAL AREAS ...................................................................................................................... 67
ANNEX D: TOP 12 COOPERATIVES WITH THE MOST POTENTIAL AND READINESS FOR DEVELOPMENT
........................................................................................................................................... 68
ANNEX E: ANALYSIS OF OTHER PROCESSED FOODS .............................................................. 69

PROCESSED FOODS VALUE CHAIN ASSESSMENT REPORT II
TABLES AND FIGURES
TABLE
TABLE 1: ISIC structure- Section C Manufacturing ...................................................................................... 8
TABLE 2: ISIC Category Scoring, Raw Data ............................................................................................... 7
TABLE 3: Summary ISIC Scoring Table ....................................................................................................... 9
TABLE 4: Ranking of 4-digit HS codes ....................................................................................................... 11
TABLE 5: Lebanese Jam Products ............................................................................................................. 13
TABLE 6: Estimated Consumption of Dairy Products in Lebanon 2008-2009 ........................................... 31
TABLE 7: Major Domestic Dairy Products .................................................................................................. 31
TABLE 8: Relative contribution of women’s income to household income in rural areas .......................... 54
TABLE 9: Food processing cooperatives in Lebanon (Women & mixed) ................................................... 58
TABLE 10: List of products by regions and coops of specialty ................................................................... 62
FIGURE
FIGURE 1: Value of Exports of Processed Foods ........................................................................................ 1
FIGURE 2: Imports & Exports of Processed Foods ...................................................................................... 2
FIGURE 3: Jam Value Chain Map .............................................................................................................. 16
FIGURE 4: Jams Exports vs. Imports ......................................................................................................... 19
FIGURE 5: Top Importing countries ............................................................................................................ 19
FIGURE 6: Pickled Vegetable Value Chain Map ........................................................................................ 23
FIGURE 7: - Pickle Exports......................................................................................................................... 25
FIGURE 8: Top Importing Countries of Lebanese Pickles in 2012............................................................. 25
FIGURE 9: Dairy Value Chain Map ............................................................................................................ 29
FIGURE 10: Babaghanouge Value Chain Map .......................................................................................... 36
FIGURE 11: Fresh cut salads Value Chain Map ........................................................................................ 37
FIGURE 12: Geographic distribution of active Processed foods cooperatives in lebanon ......................... 52

PROCESSED FOODS VALUE CHAIN ASSESSMENT REPORT 1
1. OVERVIEW Processed foods are classified in sections 3 and 4 of the Harmonized System (HS) code systems under
chapters 15 to 23. They are also included in section 15 of the International Standards Industrial
Classification (ISIC) under chapter 1598. These classifications include animal fats, oils, processed meat,
fish and poultry, processed fruits, vegetables, and beans, as well as drink concentrates and bottled water.
Lebanese exports of processed foods increased at an annual average of 13 percent from 2009 through
2012 from $303 million to $419 millioni with a potential significant increase in the next few years as a
result of the Syrian crisis that has significantly impacted the competing Syrian food industrial sector.
Lebanese processed food exports averaged seven percent of total exports between 2009 and 2012, which
represents a reduction from 11.5 percent from 2000 and 8.6 percent in 2008.
As a comparison, Lebanon imports three times the value of processed foods that it exports; reaching a
value of $885 million in 2009 and $1.2 Billion in 2012.
FIGURE 1: VALUE OF EXPORTS OF PROCESSED FOODS
Data Source: Lebanese Customs
200,000
250,000
300,000
350,000
400,000
450,000
2009 2010 2011 2012
x$
1,0
00

PROCESSED FOODS VALUE CHAIN ASSESSMENT REPORT 2
FIGURE 2: IMPORTS & EXPORTS OF PROCESSED FOODS
Data Source: Lebanese Customs
Based on a survey conducted in 2007 by the Syndicate of Lebanese Food Industrialists (SLFI) and
UNIDO, there are 736 registered foods processing enterprises in Lebanon that employ five or more
workers. This represents 18 percent of all industrial companies retaining 20,607 employees, or 25 percent
of the total industrial workforce. In 2007 these companies had an output of $1.75 billion with 27 percent
of the country’s total value added. According to SLFI estimates, there are over 2,000 food processing
companies today in Lebanon. If all of these food processors are taken into consideration, including those
that employ less than five workers and those that are not registered, then, according to Chambers of
Commerce, the output of the processed foods industry exceeds $3 billion which accounts for 7 percent of
Lebanon’s total GDP.
The LIVCD assessment is organized into five sections. The first of these covers the process by which we
narrowed down the multitude of processed food products in order to choose four illustrative cases for
further detailed analysis. The second part of the paper provides a more detailed analysis of the four
specific processed food products that remained after the selection process: jams, pickled vegetables, dairy
products, and ready-to-eat prepared meals. The third section addresses relevant factors in the business
enabling environment. Finally, the fourth section provides an overview of LIVCD’s proposed upgrading
strategy for processed foods.
$200,000
$400,000
$600,000
$800,000
$1,000,000
$1,200,000
$1,400,000
2009 2010 2011 2012
x$
1,0
00
Import $K Export $K

PROCESSED FOODS VALUE CHAIN ASSESSMENT REPORT 3
SWOT ANALYSIS
Strengths:
Lebanon’s geographic location makes the Gulf
& EU markets easily accessible
Lebanese cuisine is highly recognized among
Arab consumers,
Lebanese food processors were pioneers in the
region and have several well recognized and
leading brand names.
Factories have the flexibility to produce and
ship many SKU's
Lebanon being a Mediterranean country with
an old history provides good material for a
product story, which along with attractive
packaging can have an impact; story of the
product can make a big difference in whether
the product is successful.
Lebanese business owners have good
international exposure and experience.
Weaknesses:
Old facilities that were not set up to meet
modern international food safety standards.
Upgrading cost is very high. In a previous
USAID project, this cost was estimated at an
average of $100K.
Old and outdated equipment that affect quality,
capacity, and productivity.
High operating cost relative to neighboring
countries that provide similar products
Product quality is not to par with average
selling price (ASP). ASP is relatively high for
ethnic markets, yet quality is not adequate for
high value markets.
Opportunities:
Being a Mediterranean cuisine, Lebanese
processors can benefit from the growing
awareness of Mediterranean cuisine in
international markets.
Large Lebanese Diaspora that tend to be
affluent and with strong social interconnections
with specialty food consumers in high value
markets
Threats:
Regional countries are investing in their
processed foods industry which is leading to
serious competition
International markets are requiring food
processors to meet international food safety
standards.
High level of insecurity and political
instability.

PROCESSED FOODS VALUE CHAIN ASSESSMENT REPORT 4
VISION FOR THE FOOD PROCESSING VALUE CHAIN
The processed foods value chain will grow by increasing exports to existing markets through high value
channels and by entering new markets and replacing imports in the local market. The value chain will see
increased integration of small and medium processors and better vertical and horizontal cooperation
among actors. To achieve this vision, the project will:
Take a coherent, multifaceted, market pull approach at the export level that will focus on high
value channels that Lebanese products have a high potential to succeed in; seek relevant market
intelligence and Identify the most appropriate market entry channels in new markets and prepare
food processors to enter target markets through these channels.
In the local market, the project will assist food processors in replacing imported food items that
Lebanon can competitively and sustainably produce.
Support small and medium food processing enterprises in customizing products in terms of
variety, quality, packaging, technical and regulatory requirements in order to adapt to market
expectations.
Increase participation of small and medium processors through financing and co-financing
packages through Public Private Partnerships in conjunction with the private sector.
Increase procurement of local inputs and integrate micro, small, and medium enterprises in the
processed foods value chain through manufacturing contracts, co-manufacturing, and other
schemes.
Maximize project impact by leveraging existing resources already developed by donor-funded
projects, especially those funded by USAID.
Assessment of the difficulty, and probability of success for LIVCD to address the constraints within
the processed foods VC:
As mentioned in the SWOT analysis, there are several constraints that exist in the processed foods VC;
some of these cannot be addressed by LIVCD. These include the country’s political instability, the
country’s poor infrastructure, and the high cost of operation. However, these constraints do not limit the
project’s ability to create successes within the value chain that be built upon. Even with these constraints,
some companies have built sustainable successful models. With proper intervention that addresses
selected constraints, LIVCD can create a measureable and sustainable impact.

PROCESSED FOODS VALUE CHAIN ASSESSMENT REPORT 5
SELECTION OF PROCESSED FOOD
The label “Processed Foods” covers an extremely wide variety of items. The goal of this study is to
identify and assess possibilities for productive interventions by LIVCD in a small sub-set of processed
foods- particularly where they have the potential to build on supply linkages to the domestic agricultural
sector. Given the wide diversity of processed foods and the necessity of focusing possible interventions
on concrete cases to yield meaningful analysis, it was necessary to engage in an initial analysis to identify
and narrow down specific target processed food products that are analyzed in the second part of this
assessment. The first section describes the analytical process used to focus on four target products
described in detail. The selection process has two distinct phases: a first phase that analyzes data at the
ISIC level for all economic activities, to identify larger categories of processed foods for further
investigation, and a second phase to select individual products within the retained ISIC codes through a
process of scoring on a range of specific criteria designed to assess the fit between different products and
LIVCD priorities and capacity for intervention.
PHASE 1: RANKING BROAD CATEGORIES OF PROCESSED FOODS
To narrow the field of broad groups of processed foods we started by considering all the four digit ISIC
codes in Table 1 below under the category of manufactured food products (Division 10). These
categories formed the entire universe for the study.

PROCESSED FOODS VALUE CHAIN ASSESSMENT REPORT 6
TABLE 1: ISIC STRUCTURE- SECTION C MANUFACTURING
Next, we collected data on five objective data-driven selection criteria for all the four digit ISIC codes
with a one to four ordinal scale scoring as follows:
Criteria 1: Value of production. This simply measures the aggregate value of production for each ISIC
code with data from the Ministry of Industry that was published in 2010. Since the available data were
from 2007, we have inflated it at the average rate of GDP growth to yield estimates of 2011 production
levels to make these data comparable with the most recent trade data used in the other selection criteria.
Larger numbers were ranked higher than smaller numbers.
Thresholds: Scores 1 to 4 by tranches of 25 percent based on the largest figure.
Criteria 2: Value of exports in 2011. This simply measures the absolute value of exports, as an
indication of the potential for rapid scaling-up of project impact to improve competitiveness. Data are
from TRADEMAP. Larger numbers are more highly ranked than smaller numbers.
Thresholds: Scores 1 to 4 by tranches of 25 percent based on the largest figure.
Criteria 3: Percentage change in Lebanese exports between 2009 and 2011. This provides an
indication of the recent trend of exports, with larger numbers being ranked higher than smaller numbers.
Data are from TRADEMAP. This provides an indication of the dynamism of Lebanese exports.

PROCESSED FOODS VALUE CHAIN ASSESSMENT REPORT 7
Thresholds: Above 30 percent = 4; 20 percent - 30 percent = 3; five percent - 20percent = 2; < 5
percent = 1
Criteria 4: Exports as percent of production. This is simply the ratio of Criteria 2 to Criteria 1. It
serves to provide an indication of the importance of exports within the product category, indicating that
there are significant links to wider international markets. Larger numbers are ranked higher.
Thresholds: Above 50 percent = 4; 25 percent - 50 percent = 3; 5 percent – 25 percent = 2, < 5
percent = 1
Criteria 5: Annual average growth in regional exports from 2009 to 2011. This provides an
indication of the dynamism of regional markets and their eventual receptivity to Lebanese exports. Data
is from TRADEMAP and larger numbers are ranked higher.
Thresholds: Above 25 percent = 4; 15 percent - 25 percent = 3; 5 percent - 15 percent = 2; < 5
percent = 1
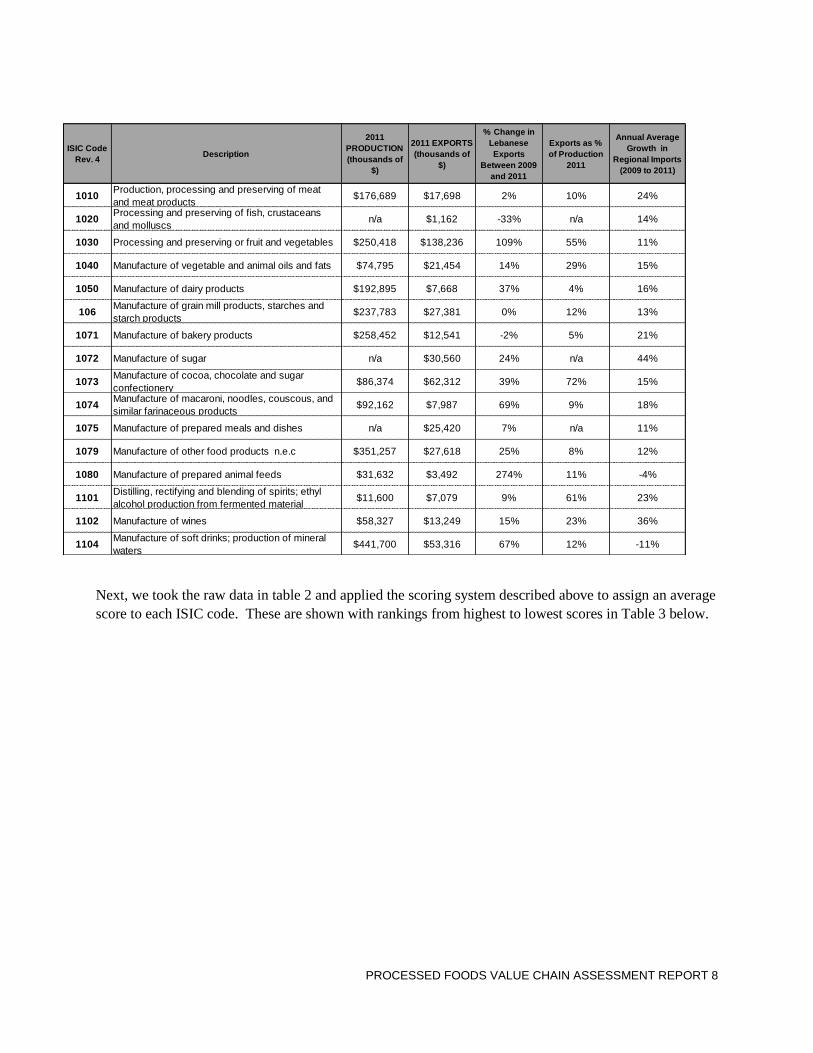
The raw results of this data gathering process are shown below in Table 2.
TABLE 2: ISIC CATEGORY SCORING, RAW DATA
PROCESSED FOODS VALUE CHAIN ASSESSMENT REPORT 8
Next, we took the raw data in table 2 and applied the scoring system described above to assign an average
score to each ISIC code. These are shown with rankings from highest to lowest scores in Table 3 below.
ISIC Code
Rev. 4Description
2011
PRODUCTION
(thousands of
$)
2011 EXPORTS
(thousands of
$)
% Change in
Lebanese
Exports
Between 2009
and 2011
Exports as %
of Production
2011
Annual Average
Growth in
Regional Imports
(2009 to 2011)
1010Production, processing and preserving of meat
and meat products$176,689 $17,698 2% 10% 24%
1020Processing and preserving of fish, crustaceans
and molluscsn/a $1,162 -33% n/a 14%
1030 Processing and preserving or fruit and vegetables $250,418 $138,236 109% 55% 11%
1040 Manufacture of vegetable and animal oils and fats $74,795 $21,454 14% 29% 15%
1050 Manufacture of dairy products $192,895 $7,668 37% 4% 16%
106Manufacture of grain mill products, starches and
starch products$237,783 $27,381 0% 12% 13%
1071 Manufacture of bakery products $258,452 $12,541 -2% 5% 21%
1072 Manufacture of sugar n/a $30,560 24% n/a 44%
1073Manufacture of cocoa, chocolate and sugar
confectionery$86,374 $62,312 39% 72% 15%
1074Manufacture of macaroni, noodles, couscous, and
similar farinaceous products$92,162 $7,987 69% 9% 18%
1075 Manufacture of prepared meals and dishes n/a $25,420 7% n/a 11%
1079 Manufacture of other food products n.e.c $351,257 $27,618 25% 8% 12%
1080 Manufacture of prepared animal feeds $31,632 $3,492 274% 11% -4%
1101Distilling, rectifying and blending of spirits; ethyl
alcohol production from fermented material$11,600 $7,079 9% 61% 23%
1102 Manufacture of wines $58,327 $13,249 15% 23% 36%
1104Manufacture of soft drinks; production of mineral
waters$441,700 $53,316 67% 12% -11%

PROCESSED FOODS VALUE CHAIN ASSESSMENT REPORT 9
TABLE 3: SUMMARY ISIC SCORING TABLE
With the average scores for each four digit ISIC category in Table 3 as our basic reference point, we then
decided to retain the five ISIC codes marked in blue for deeper analysis. The decision regarding which
ISICs to choose was based, not just on the numerical rankings, but also LIVCD’s knowledge of the
processed foods sector resulting in two specific choices that were not purely consistent with the ranking
systems, including the following:
Decision 1: Eliminate from consideration ISICs 1072 (manufactured sugar) and 1104 (soft drinks and
mineral waters) since they are populated by a small number of highly concentrated large industries that
use mainly imported raw materials;
Decision 2: Include ISIC 1075 (ready-to-eat prepared meals) since this is a sector that has very high
linkages to local agriculture and it is growing steadily due to an increase in demand by the domestic retail
and food service industry and because of the high potential to capitalize on a favorable image for
Lebanese foods in regional markets.
AVERAGE SCORES- SORTED FROM HIGHEST AVERAGE SCORES TO LOWEST
ISIC Code
Rev. 4Description
2011 PRODUCTION
(thousands of $)
2011 EXPORTS
(thousands of $)
% Change in
Lebanese Exports
Between 2009 and
2011
Exports as % of
Production 2011
Annual Average
Growth in Regional
Imports (2009 to
2011)
Average
1030Processing and preserving
or fruit and vegetables3 4 4 4 2 3.4
1072 Manufacture of sugar n/a 1 4 n/a 4 3.0
1073
Manufacture of cocoa,
chocolate and sugar
confectionery
1 2 4 4 3 2.8
1079Manufacture of other food
products n.e.c4 1 4 2 2 2.6
1104Manufacture of soft drinks;
production of mineral waters4 2 4 2 1 2.6
1050Manufacture of dairy
products2 1 4 1 3 2.2
1074
Manufacture of macaroni,
noodles, couscous, and
similar farinaceous products
1 1 4 2 3 2.2
1101
Distilling, rectifying and
blending of spirits; ethyl
alcohol production from
fermented material
1 1 2 4 3 2.2
1040Manufacture of vegetable
and animal oils and fats1 1 2 3 3 2.0
1071Manufacture of bakery
products3 1 1 2 3 2.0
1102 Manufacture of wines 1 1 2 2 4 2.0
1010
Production, processing and
preserving of meat and meat
products
2 1 1 2 3 1.8
106
Manufacture of grain mill
products, starches and
starch products
3 1 1 2 2 1.8
1080Manufacture of prepared
animal feeds1 1 4 2 1 1.8
1075Manufacture of prepared
meals and dishesn/a 1 2 n/a 2 1.7
1020
Processing and preserving
of fish, crustaceans and
molluscs
n/a 1 1 n/a 2 1.3

PROCESSED FOODS VALUE CHAIN ASSESSMENT REPORT 10
PHASE 2: SELECTING PROMISING PRODUCTS FROM WITHIN SELECTED ISIC CODE
CATEGORIES
In the next selection phase, the team utilized its own mapping of four digit HS codes to four digit ISIC
codes- provided in Annex 1- to conduct internal scoring of all the four digit HS code products in the five
selected ISICs in order to attain a second ranking of products at the more detailed four digit HS code
level. This action was taken based on three scoring criteria that were filled out using LIVCD expert
knowledge of the processed food sector. Each of these criteria was ranked on a simple High=3; Medium =
2; and Low = 1 scoring scale. The criteria used are noted below:
Criteria 1: Importance of local raw material inputs. This criterion measures the degree to which
Lebanese raw materials are used in the production process. Many processed food products in Lebanon
rely mainly on imported raw materials-some of which can be replaced with local raw materials under
certain conditions and some that cannot. The team did not specifically seek to adjust for this element of
“potential” and scored purely on the basis of existing patterns.
Criteria 2: Relevance to rural populations. This criterion measures the degree to which rural
populations are involved in the production of each product, either as employees or as producers and
members of cooperative processors, often operating at the small industry scale.
Criteria 3: Value added. This criterion measures the degree of value addition in the product group-
essentially the added value creation by the manufacturing process above the simple sum of material
inputs. Some products such as chocolate have a very high value added in which the raw materials are
small relative to the total value of output, while some products, such as jams, tend to have lower value
added above the basic raw materials cost.
With the application of the above ranking criteria to all four digit HS code products under the five ISIC
codes shaded in blue in Table 3, we obtained a ranking order that is shown in Table 4. We have retained
the five top-ranked four digit HS codes in Table 4 that are drawn from three ISIC codes for further
analysis in the second part of this study.
The final lists of products to be analyzed are:
Jams and fruit preserves;
Pickled vegetables;
White cheese and ayran/lebneh/yogurt; and
Ready-to-eat meals consisting mainly of traditional Lebanese items such as hummus and
babaghannouj.
In the following analysis we have merged the two dairy products (Cheese and yoghurt/ayran/lebneh)
since they are similar in terms of technical processing requirements and markets. We also decided to
not include roasted nuts despite having the same score as the dairy products simply because we are
unable to cover more than four products in detail and roasted nuts rely mainly on imported raw
materials.

PROCESSED FOODS VALUE CHAIN ASSESSMENT REPORT 11
TABLE 4: RANKING OF 4-DIGIT HS CODES
ISIC
Code
Rev. 4
HS Code HS Description Description, and Products
Local Raw
Material
Input (High
/ Medium /
Low)
Rural
Population
Linkages
(High /
Medium /
Low)
Value
AddedAdditional Comments Rank
1075
0207-14,
0304-99,
0206-90,
0710-90,
2005-59,
170490
Ready to eat meals
Ready to eat meals, includes traditional Lebanese
cooked dishes and Hummos, Babaghannouj, Fresh Cut
vegetables…
3 2 3
Processes and products need to be further
developed. Fresh Cut vegetables with salad dressing:
Has high local and export market potential to GCC.
Could be combined with "Lebanese Dressing" that
include olive oil, herbs, and lemon juice.
2.7
1030 2001 Pickled vegetables Pickled vegetables 3 3 2should be developed on the processing side as well
as product development aspect.2.7
1030 2007 Jams, fruit jellies, marmalades, fruit or nut puré Jams, fruit jellies, marmalades, fruit or nut puré 3 3 2
Has positive impact on cooperatives and artisanal
processors. Limited markets and limited to certain
varieies . Need to develop new products for high
value, niche markets
2.7
1050 0403, 0406 Cheese and curd Focus on white cheese, Labneh and Ayran 2 3 2
Low entry barrier. Can be processed by small firms
and coops. Inconsistent milk supply; Potential to
increase exports. Need product and process
development to improve shelf life, product variety
2.3
1030 2008
Fruit, nuts and other edible parts of plants, otherwise
prepared or preserved, whether or not containing added
sugar or other sweetening matter or spirit, not elsewhere
specified or included.
Mainly roasted nuts 1 3 3
Strong Exports, high differentiation of lebanese nuts
vs. non lebanese, High added value, Low barrier to
entry. Enhances image of Lebanese food specialities.
2.3
1079 190110 Preparations for infant use, put up for retail sale Baby food2 1 3
emerging products low leverage; requires heavy
marketing2.0
1030 2006Vegetables, fruit, nuts, fruit-peel and other parts of plants,
preserved by sugar (drained, glacé or crystallised).Galzed fruits 2 2 2
Good for Artisanal, but need to upgrade process and
quality of product. Low availability of raw material to
compete on an industrial level
2.0
1030 2004
Other vegetables prepared or preserved otherwise than by
vinegar or acetic acid, frozen, other than products of
heading No. 20.06.
Frozen semi processed foods that are not ready to eat. 1 3 2 Frozen; semi cooked. Limited to certain items. 2.0
1030 2005
Other vegetables prepared or preserved otherwise than by
vinegar or acetic acid, not frozen, other than products of
heading No. 20.06
Canned foods 1 3 2 Canned. Limited to certain items: 2.0
1073 1806 Chocolate and other food preparations containing cocoa. Chocolates 1 2 3 good export potential; 2.0
1079 0910.99.90 Mixed Spices Spices 1 2 3 demand in diaspora markets and GCC 2.0
Tahina1 Tahina 1 2 3 High local and export demand 2.0
1075 0710 Frozen vegetables Frozen vegetables 1 2 2 Absence of consistent raw materials 1.7
1075 0712Dried vegetables, whole, cut, sliced, broken or in powder,
but not further prepared.Dried vegetables 1 2 2 no apparentmarket 1.7
1075 1105 Flour, meal, powder, flakes, granules and pellets of
potatoes.Flour 1 1 3 one factory in lebanon importing potato starch 1.7
1075 2002Tomatoes prepared or preserved otherwise than by vinegar
or acetic acid.1 2 2 absence of industrial variety of tomatoes 1.7
1075 2003Mushrooms and truffles, prepared or preserved otherwise
than by vinegar or acetic acid.1 1 3
Requires sophisticated process ;howver market is
there.1.7
1030 2009 Fruit juices 1 2 2 limited quantiies;limited to fresh product 1.7
1073 1704 Sugar confectionery (including white chocolate), not
containing cocoa; excluding halawa1 2 2 artisanal level 1.7
1079 0901 Coffee, whether or not roasted or decaffeinated; 1 1 3 added value to an imported commodity 1.7
1079 0903 Maté. 1 1 3 added value to an imported commodity 1.7
1050 0404
Whey, whether or not concentrated or containing added
sugar or other sweetening matter; products consisting of
natural milk constituents, whether or not containing added
sugar or other sweetening matter, not elsewhere specified
or included.
1 2 2 Whey used locally for cheese 1.7
1061 1904
Prepared foods obtained by the swelling or roasting of
cereals or cereal products (for example, corn flakes); cereals
(other than maize (corn)) in grain form or in the form of
flakes or other worked grains (except flour, groats and
meal), pre-cooked, or otherwise prepared, not elsewhere
specified or included.
1 1 2 controversial product;high international competition 1.3
1079 0902 Tea, whether or not flavoured. 1 1 2 added value to an imported commodity 1.3
1079 0904Pepper of the genus Piper; dried or crushed or ground fruits
of the genus Capsicum or of the genus Pimenta1 1 2 added value to an imported commodity 1.3
1079 0905 Vanilla 1 1 2 added value to an imported commodity 1.3
1079 0906 Cinnamon and cinnamon-tree flowers. 1 1 2 added value to an imported commodity 1.3
1079 0907 Cloves (whole fruit, cloves and stems). 1 1 2 added value to an imported commodity 1.3
1079 0908 Nutmeg, mace and cardamoms. 1 1 2 added value to an imported commodity 1.3
1079 0909Seeds of anise, badian, fennel, coriander, cumin or caraway;
juniper berries.1 1 2 added value to an imported commodity 1.3
1050 0405Butter and other fats and oils derived from milk; dairy
spreads.1 1 2 practically non-existent 1.3


1. DETAILED ANALYSIS OF SELECTED PROCESSED FOODS
JAMS
1.1 Product Definition
Jam products which include marmalades, preserves, and jellies are produced from the mixture of sugar
and fruit.
They are categorized into jams, preserves, jellies, and marmalades. They are defined by the codex
Alimentarius as follows:
1. Jam" or "Preserves" or "Conserves" is a product brought to suitable consistency, made from the
whole fruit, pieces of fruit, regular and/or concentrated fruit pulp or fruit puree, of one or more
kinds of fruit that is mixed with foodstuffs with sweetening properties, with or without the
addition of water.
2. "Jellies” are products brought to a semi-solid gelled consistency and made from juice and/or
aqueous extracts of one or more fruits, mixed with foodstuffs and sweetening properties with or
without the addition of water; the product is prepared from a suitable fruit ingredient.
3. ‘Marmalade” is a product obtained from a single or a mixture of citrus fruits and brought to a
suitable consistency. It may be made from one or more of the following ingredients: whole fruit
or fruit pieces- which may have all or part of the peel removed, fruit pulp, puree, juice, aqueous
extracts, and peel. It is mixed with foodstuffs with sweetening properties, with or without the
addition of water.
4. “Non-citrus marmalade”: is a product prepared by cooking fruit, whole, in pieces, or crushed
adding foodstuffs with sweetening properties to obtain a semiliquid or thick liquid.
5. Jelly Marmalade: is a product described under citrus marmalade from which all the insoluble
solids have been removed, and may or may not contain a small proportion of thinly cut peel.
International quality parameters for jams include specifications for “extra jam,” “preserves” or “high-
fruit jam” for which the final product is manufactured from not less than 45 percent, by weight, of the
original fruit ingredient, exclusive of any added sugar or optional ingredients.
For jam or “low-fruit jam”, “light jam” or “fruit spread,” the product shall be manufactured from not less
than 33 percent, by weight, of original fruit ingredients, exclusive of any added sugar or optional
ingredients used in the preparation of the fruit ingredient. 1 The major types of jams produced in Lebanon
are given in Table 5 below.
TABLE 5: LEBANESE JAM PRODUCTS
Types of jam Varieties produced in Lebanon
Jam or preserve Apricot, Strawberry, Fig, Cherry, Quince, Pumpkin, Eggplant
1 Quince jams and jellies have slightly different allowable fruit weight thresholds.

PROCESSED FOODS VALUE CHAIN ASSESSMENT REPORT 14
Jelly Quince
Marmalade Orange, Apple, Quince, Apricot and a mixture of fruits
Jelly Marmalade Bitter orange jam.
The main jam items produced in Lebanon are apricot, strawberry, fig, quince, cherry, and bitter orange.
There is also a variety of traditional jams that are labor intensive and produced by small processors and
cooperatives such as dates rose petal, whole fig, pumpkin, and eggplant jams. Looking at this sector over
the last 15 years, it is clear that there has been significant replacement of imports by local production;
especially when the packaging shifted from the one kg tin to the 450g glass jar. Today you can still find
imported items from Europe and the U.S., however they constitute a smaller share of the retail market;
(approximately 30 percent by volume; based on 2009 data) and are more expensive than Lebanese jams,
which indicates the potential for high quality Lebanese jams to further replace imports. Total jam imports
represent 47% of the local jams market with Egyptian and Saudi jams capturing approximately 16% of
the retail market.
In 2012, Lebanon produced 4,362 tons of jam which represents an increase of 33 percent relative to 2009,
while exports increased in value by 72 percent in 2012 compared to 2009.
1.2 VALUE CHAIN ACTORS
The major actors in the jam value chain are listed below:
Raw material suppliers these are mainly small farmers, wholesalers in the major wholesale markets, and
importers.
Aggregators/damans are either farmers themselves or traders who also buy from other farmers or traders
that purchase the fruit while still on the trees- one to two months before the season starts based on
available potential markets.
Semi-processors These are growers, or damans who have a cold storage facility for freezing and storing
excess raw material (fruits) to sell out of season to jam producers as well as canners, ice cream
manufacturers, and pastry shops.
Industrial Processors: there are two main types of industrial processors.
Medium to Large Industrial processors There are seven major companies producing jam along
with other products during the various fruit seasons. Some of them even import some fruits to
extend the range of their product offering. The average output of large companies is
approximately 400 tons of jam per season, while small companies average around 50 to 150 tons
per season. Processing companies in general employ between 15 and 150 workers, excluding
seasonal workers. Utilized capacity during the peak season ranges between 40 to 60% indicating
that with little investments, these companies can easily double their output.
Most of the factories rely on automated or semi-automated lines with a high capacity of
production varying between three to 10 tons per shift. Factories with automated lines still need
significant labor inputs, especially for sorting and trimming raw fruit. Several factory owners
have stated their interest in subcontracting these activities to their suppliers or a third party. The
project could potentially link the interested companies to cooperatives who would perform these
services at a lower cost than processers can provide.

PROCESSED FOODS VALUE CHAIN ASSESSMENT REPORT 15
Small Industrial Processors These are highly developed artisanal producers having a large range
of products as well as good brand and distribution channels. Their capacity does not exceed one
metric ton per day. The work is labor intensive and has the capacity to produce complex products
requiring manual input. These processors along with rural cooperatives produce approximately
1,000 tons of jams.
The quality of the end product can vary depending on the industrial processors specific formulations. The
product obtained can be standard and consistent in quality especially through the utilization of pectin (for
consistency and citric acid for acidity
Rural Agricultural coops. These are usually linked to one or few villages in the rural area with
members varying between 10 and 50, most of whom are women. Many coops have been equipped with
tools to prepare jam through donor projects. Some of the coops are active and quality oriented and others
are much weaker and are just striving to keep their members. These weaker coops have serious human
resource problems in developing and retaining skilled workers for processing. The type of equipment
used at this level is that found in industrial kitchens and is far from being automated. The production is
very much labor dependent and consistency, even though difficult to attain, is possible with the right
skills and vigilance. The overall productive capacity of the coops is considered small if it is to be
compared to the industrial and small producers mentioned above, but is well adapted to manual operation.
Although coops and commercial producers basically produce similar product lines, the more labor
intensive jam products, such as bitter lemon jams, eggplant jams and date jams are mainly produced
mainly by coops.
Homemade processors These are playing a considerably smaller commercial role because of the
development of cooperatives and the shift in purchasing habits of consumers and the migration from rural
to urban areas.
An overview of the value chain appears in the map given below in Figure 3.

PROCESSED FOODS VALUE CHAIN ASSESSMENT REPORT 16
FIGURE 3: JAM VALUE CHAIN MAP
1.3 PRODUCTION PROCESS
Input requirements for jams are basic, consisting mainly of packaging materials and raw fruit. The main
packaging material inputs are imported glass jars that are available from the major local supplier.
Available sizes and shapes tend to be fairly limited. Tin cans are also imported through one single local
supplier. Traditionally, Lebanese processors used tin cans for packaging jams, however in the last 10-15
Local Market: 55% of total Sales Export Market: 45% of total Sales
Markets
10% 61% 29% 50% 24% 13% 4%
Direct Sales Food Service Incl. Super M. 11% GCC: 45% USA 16% Europe Australia
Bakeries Groceries 18% Other Arab: 5% Canada 8%
Distribution
Distributors Importers / Distributors
Processors
10%
Cooperatives 85% 5%
Industrial home made
pectin
Sugar &
sweetners
Packaging suppliers
local & Imported
Semi
Processed
inputs
Aggregators
Fresh Inputs
30% 60% 30%
Wholesale market Imports
Farmers
Agreggators
semi processors
Aggregators/sorters
damman
prices per Kg in USDFP=Finished productPrices are based on apricots, however margins apply to all jam varieties
$0.75
$0.90
$2.4 FP
$3.4 FP
$2.82 FP
$1
$22/Kg

PROCESSED FOODS VALUE CHAIN ASSESSMENT REPORT 17
years tin cans were replaced for the most part by glass jars. Packaging lines range from manual packing to
fully automated packaging and pasteurization lines.
Jams are one of the rare processed food products where the raw material comes almost entirely from local
agricultural products. Raw materials such as apricots, strawberry, figs, quince, and cherries, are
purchased from the wholesale market or directly from farmers through Daman or lead farmers. In some
cases companies might import some frozen fruits or puree to use in their jams if the season is low or
prices are high, or in order to produce a non-citrus marmalade. The best quality jams come from using the
right variety of fresh fruits, in the right proportion, having the right ripeness (sugar content) and that are
well sorted and properly cleaned. It is important to mention that jam variety fruits are not necessarily the
same as those sold at the wholesale market.
The production processes for fruit jams is quite simple. The technology used can be very primitive and
configured to deliver small batches- such as some rural cooperatives- or it can be more sophisticated, with
automation utilized by the medium and large processors.
The process of jam production might differ from one fruit to another, though the principle is the same. It
works as follows:
Reception and storage of the fruits;
Sorting and washing of the fruits;
Trimming, pitting, defoliating, cutting or halving the fruits depending on the type of fruits;
Sorting of the treated fruit; and
Weighing fruits and sugar, as well as other ingredients.
Fruit jam processing operations used by cooperatives and homemade processors are performed using an
open kettle that has a maximum batch size of 50 to 100 kg. In this type of line, fruits and sugar and other
flavoring ingredients are simply mixed in a kettle and boiled until the product is concentrated to the right
brix measure (soluble sugar concentration). Temperatures in this process can reach as high as 1050 C.
Industrial processors use a vacuum kettle process in which fruit, sugar and flavoring ingredients are
combined in a mixer and then drawn into a vacuum kettle where they are heated in two separate stages.
First there is heating at a low temperature (700 C) to foster evaporation of water and then a shorter higher
temperature (900 C) heating period in which the jam is pasteurized. Vacuum kettle processing has a
maximum batch size of 1,500 kg.
Filling processes are largely the same for both open and vacuum kettle processes. First the hot jam is
filled into the clean, slightly pre-heated glass jar in order to avoid glass breakage. The hot filling is
important to have a good preservation of the jam and in order to avoid further re-heating in the
pasteurizer. Next the jars are tightly closed with metallic covers, usually of the twist-off type. The jars are
then either tipped on their covers to pasteurize the cover with the hot jam or they pass under a heating
tunnel for a short time in order to assure sterilization of the cover. After the hot fill, closing and cover-
sterilization phase, the jams are cooled. When in glass jars, cooling is gradually done to avoid glass
breakage as a result of the heat shock. It is not necessary to take these steps when using tins. After
pasteurization the jars are dried and stored in a cool and dry place or labeled and boxed and then sent to
market.
Considering that jams produced from fresh fruits are seasonal, jam processors must address the issue of
raw product availability during the period of the year when no fresh fruit is available. The harvest period

PROCESSED FOODS VALUE CHAIN ASSESSMENT REPORT 18
for apricots is three weeks, for figs 45 days, for strawberries three months, and for cherries about 45 days.
In order to avoid large inventory of finished jam and in order to avoid product deterioration as a result of
storage in warm temperatures, processors prepare frozen semi-processed raw materials that can be used
for jam any time of the year after thawing. This works very well for strawberries and other berries. It
could also work for apricots; however this is not generally done in Lebanon and would require more
investigation to ensure technical feasibility. Some companies subcontract the treatment and freezing of
the fruits to farmers who are willing to provide these services.
The impact of labor on jam production is significant; especially at the upstream section of the production
process at the level of sorting, washing, and pitting or cutting. Only a few medium and large processors
rely on automated jam lines with vacuum cooking. These companies focus on large scale production
benefiting from economies of scale and covering mainstream local and export markets. While rural
cooperatives and small companies target niche local markets and distinguish themselves from industrial
companies by using local fruits and traditional recipes, in addition to labor intensive processing. Some of
the small companies such as Mymoune and AnNabil, have invested in packaging and labeling and have
been able to reach niche export markets such as the specialty food market in the U.S.
Initial fixed investment can be a function of the capacity needed. It could start with as little as $20,000
to$30,000 and can run up to a million dollars.
1.4 MARKETS
Domestic Market
Despite its advantage in fruit production, Lebanon still imports a significant amount of packaged jam
from countries such as France, Belgium, U.S., and Egypt. In 2012, according to Lebanese customs,
Lebanon imported 2,375 tons of different jams having a value of about $3.4 million. These figures are in
addition to local production estimated at 4,405 tons, with 54 percent sold in the local market. The jam varieties
sold in the local market are apricot jam (41percent); strawberry (17 percent); fig (12 percent), apple (25
percent), quince (3 percent), and other varieties (2 percent).
Lebanese jam processors have eaten away the share of imports by developing a range of products in glass
jars. Initially jam production was limited to tin cans, which was limited mainly to apricot and strawberry
jams. This trend is continuing, though at a slower pace as the market is often flooded with cheap Egyptian
origin product under an international brand such as “Hero”, or an even cheaper product under the
Egyptian brand “Vitrac.”
Export Market
Global trade in jams totaled $2.28 billion in 2011, with an increase of 17 percent relative to 2010. In
2011, GCC countries that represent a strong target market for Lebanese jams, imported $72 million worth
of jam. Iraq, another growing market imported $6.9 million in 2011, a 37 percent increase compared to
2010. Lebanese jam exports have been steadily increasing since 2009, with further growth potential
available. Approximately 46 percent of jams are exported; mainly to GCC countries and ethnic markets in
the U.S. and Australia. The top five importing countries in 2011 were KSA (28 percent), U.S. (19
percent), Kuwait (12 percent), UAE (75 percent), and Canada (5 percent). Since 2009 the jam export
market for Lebanese jams has been growing steadily in volume and in value and is shared between the
GCC market and North America. A large quantity of jams exported to the GCC and mainly KSA are
lower quality apple based jams produced by some of the Lebanese factories in the Bekaa.

PROCESSED FOODS VALUE CHAIN ASSESSMENT REPORT 19
FIGURE 4: JAMS EXPORTS VS. IMPORTS
Data Source: Lebanese Customs
FIGURE 5: TOP IMPORTING COUNTRIES
Data Source: Lebanese Customs
1.5 OPPORTUNITIES AND CONSTRAINTS
Because of its climatic conditions, soil, and relative availability of water, Lebanon is one of the few
countries in the region that can grow a variety of fruits suitable for jam production. As a result, Lebanese
processors can produce all the major fruit jam varieties available in international markets except for
tropical fruits such as pineapple and kiwi. Moreover, producing jam from fresh fruit (not from puree)
$0
$500
$1,000
$1,500
$2,000
$2,500
Saudi USA Kuwait UAE Canada
x $
1,0
00
$-
$1,000
$2,000
$3,000
$4,000
$5,000
$6,000
$7,000
$8,000
$9,000
$10,000
2009 2010 2011 2012
x$
1,0
00
Exports
Imports
PROCESSED FOODS VALUE CHAIN ASSESSMENT REPORT 20
allows for the production of premium quality jam that contain pieces or chunks of fruit that in some
markets are referred to as “preserves”. This helps distinguish Lebanese jams from other regional jams that
are typically made of imported fruit purees (such as Halawani of Saudi Arabia and Vitrak of Egypt). In
view of the fact that there is a global trend to reduce industrial sugar in food and a focus on natural sugar
sources other than sucrose, Lebanese jam processors can easily adapt to this trend by producing low sugar
preserves and fruit spreads, or even utilize Lebanon’s large potential of fruit sugar source such as grapes
to formulate low sugar jams. This strategy will add value to the jam, reduce Lebanon’s imports of raw
sugar, and develop a new outlet for grape surpluses.
Thus, the key opportunities for Lebanese jams are to increase exports in the region for the following
product types:
Low calorie, low sugar where sugar is replaced by natural sweeteners such as grape juice.
High content fruit pieces- also referred to as “preserves”.
Relatively small jars- 250 g and 340 g as opposed to the more common 370 g, 450 g, and 1,000 g
jars currently produced by most Lebanese processors.
Gift sets where one elegant package contains multiple flavors of preserves in small jars (40 g to
50 g each). These packages could also contain jars of high end honey, carob molasses, or grape
molasses.
The following constraints apply to all processors of jams:
Even though in regional markets Lebanese brands have a superior image to other regional brands,
they do suffer from an inferior brand image relative to well established international brands such
as Bonne Maman, Hero, and Smucker’s in both local and regional markets.
A lack of understanding of high quality market requirements, weak market links, and no
marketing strategies outside of Lebanon.
High costs in large part due to inefficient processing and poor supply chain management.
High listing fees in the GCC.
Quality shortcomings and inconsistent product standards.
A lack of international food safety certification, including the ability to demonstrate respect of
minimum pesticide residue limits.
Inadequate supplies of raw fruit from both a quantity and quality standpoint, including both filler
fruit used to provide sweetness and thickening (mainly apples), and the other major types of fruit
used in jams in Lebanon.
A number of specific constraints affect small jam processors and cooperatives. These include:
Lack of financial resources and revenue streams to justify upgrading their facilities and
operations to meet the requirements of the international food safety standards.
Turnover levels too small to gain the interest of medium to large retailers.
Higher costs than larger processors and imports due to economy of scale and lack of equipment
and systems that could reduce unit costs.

PROCESSED FOODS VALUE CHAIN ASSESSMENT REPORT 21
2. PICKLED VEGETABLES
2.1 PRODUCT DEFINITION
The pickle industry is an important industry in Lebanon with a total production value estimated at $27
million with exports representing 63% of total production. According to Lebanese customs data, exports
increased from $15.5 million in 2009 to $17.3 million in 2012. The total local market is estimated at $10
million with over 95% locally produced.
Pickled vegetables are defined as:
1. Prepared from sound, clean and edible vegetables, with or without seeds, spices, aromatic herbs
and/or condiments which are then;
2. Processed or treated to produce an acid or acidified product that is preserved through natural
fermentation or with the resulting acidulates. Depending on the type of pickle, appropriate
ingredients are added in order to ensure preservation and quality of the product;
3. Packed in an appropriate manner, being hermetically sealed in a container, so as to ensure the
quality and safety as well as to prevent spoilage; and/or
4. Packed with a suitable liquid packing medium (e.g., oil, brine or acidic media such as vinegar)
with ingredients appropriate to the type and variety of pickled product, to ensure an equilibrium
pH of less than 4.6.
In the case of cucumbers, gherkins, or wild cucumbers there is a type that have been cured in salt brine or
in another suitable curing solution with or without natural or controlled fermentation. Another type of
processing is the fresh pack prepared from fresh, uncured and unfermented cucumbers. Product can be
packed whole or sliced.
The main pickled items produced in Lebanon are cucumbers (including wild cucumbers and gherkins),
carrots, cauliflower, sweet and hot pepper, olives, eggplant, and turnips. For cured products, processing
involves fermentation in drums which can then be stored in drums and repacked. Fresh-packed pickles
are simply packed in a salt and vinegar solution. Fresh packed product commands a price premium
relative to the cured product. Cucumbers are the main product sold in fresh-packed salt and vinegar
solutions.
The commercial packing of pickles is done either in glass jars of various sizes (0.6 liters, one liter, 1.6
liters, 2.3 liters and three liters) as well as catering size plastic pails of five liters and 20 liters. One of the
pickle processors, Mechaalany, has installed new packaging equipment that can process pickles in trays
and plastic bags that target food service industry customers.
The output of pickled vegetables in Lebanon is estimated at over 25,000 tons with 60 percent of total
production being exported. Lebanon has a comparative advantage in this sector due to the long production
season, the high quality of vegetables that are suitable for pickling, and the regional reputation of
Lebanese Cuisine. Consequently, pickled vegetables are a promising sector. However some work must be
done to increase its added value by focusing more on the freshly packed product instead of drum packed
that is usually sold at a very low mark-up. Also, more attention should be paid on improving agricultural
practices, especially when applying pesticides.

PROCESSED FOODS VALUE CHAIN ASSESSMENT REPORT 22
The sector becomes even more promising if we include pickled olives (green and black), stuffed olives,
and stuffed eggplant in oil (Makdous). These items are growing on a yearly basis and are considered to
be high value added products.
2.2 ACTORS
The main actors in the pickled vegetable value chain are noted below:
Damans/Aggregators Their role is to buy from farmers and supply processors; and in some cases they
sell to the wholesale market. They facilitate access to industries, especially for those who are distant from
the sources of raw material.
Wholesalers: Wholesalers in the main wholesale markets are the focal point for the delivery and sales of
highly perishable vegetables to processors. Most farmers bring their goods to the market to sell to these
wholesalers, while a small minority of wholesalers is specialized industry suppliers who will seek
specifically to buy product from farmers that are acceptable for pickled vegetable processors’
specifications.
Small pickle packers These are family run businesses in rural areas where the vegetables are harvested.
There are between 50 and 100 processors. They produce cured pickles and mostly sell them in bulk hotel,
restaurant, and catering (HoReCa) businesses. These companies use mainly unpaid family labor working
during the season to ferment and pack pickles to sell them in pails throughout the year.
Medium and large commercial packers there are over 10 medium to large companies that process
pickles. Some are focused on bulk sales. Others sell pickles in glass jars to the retail market.
Rural cooperatives: There are around 120 small rural cooperatives (the majority are run by women)
producing small quantities of pickled vegetable products.
A schematic map of the product flows in the pickled vegetable value chain appears below in Figure 4.

PROCESSED FOODS VALUE CHAIN ASSESSMENT REPORT 23
FIGURE 6: PICKLED VEGETABLE VALUE CHAIN MAP
2.3 PRODUCTION PROCESS AND TECHNOLOGY:
The pickling industry is seasonal with production based on the availability of products according to the
agricultural calendar. Pickling processors absorb relatively large quantities of cucumbers, turnips, carrots,
cauliflower, and eggplant. The technology used does not differ much between large-scale and smaller
processors. In each case, whether the product is cured in drums or fresh-packed in retail containers, there
are high manual labor requirements. The main difference is that at the industrial level, quantities are
much bigger, the pasteurization process is more mechanized, and the range of products differs.
Specifically, medium and large processors focus mainly on cucumbers, mixed pickles, and turnips.
Cooperatives and small packers tend to focus more on stuffed eggplant, stuffed olives, and other items
that require more intensive labor inputs from skilled workers.
markets local market Exports
Distribution
Products
Processing
Vinegar
& Salt
Suppliers
fresh produce Wholesale Importers
Market Acet. acid
Packaging
fresh produce materials
Vegetable
farmers
Direct sales
wholesalers /
Distributors.
Bulk and indiv.
Packed
medium & large
Processors
Small
ProcessorsCoops
AustraliaUSAEUGCCRetailFood service
$0.2-0.80
$0.15-0.66
Prices per Kg in USD
$1- $1.5$0.6- $1.5
$0.66- $2.0

PROCESSED FOODS VALUE CHAIN ASSESSMENT REPORT 24
The pickling industry has evolved quickly in the last decade and has improved in quality, food safety, and
branding. New factories such as Gardenia were established. These players have a clear focus on
compliance with international food safety standards. Some of the old factories have also improved their
operations and facilities to meet these standards, as well as upper end market requirements.
Pickle processors in Lebanon produce using both cured and fresh pack processes. The latter method has a
slower processing time which limits the quantity that one unit can produce during the season. In contrast
cured pickles have a higher capacity of production due to shorter processing times and they can be stored
and re-packed at a later stage. The fresh pack product has the reputation for having better crunch-ability
and superior taste. However, this depends on the type of vinegar utilized in the fresh pack as well as on
the skills of the workers doing the processing. A large factory can produce up to a maximum of 1,000
cases per day of fresh pack (about 18 tons of pickled vegetables) while it can pack in drums for
fermentation about 30 tons. Curing of vegetables in small plastic drums becomes inefficient, difficult to
monitor, and cumbersome when large quantities are involved. The conditions of the drums, the lack of
hygiene, and the quality of the salt and human error result in defects such as having incorrect flavors and
softness in consistency. This inadequate quality can be easily noticed in the market especially in the food
service sector. The proper knowledge of curing pickles requires skill and know-how that is still not
available among all Lebanese processors.
The initial investment for pickles can be very small, ranging from $5,000 to $500,000 depending on the
capacity and products. The reason for this is the fact that pickles can be a highly labor intensive process.
Any increase in investment should be linked to an increase in required capacity and eventually tied to a
reduction in unit costs.
2.4 MARKETS
Domestic Market
The local market is highly dominated by the fermented cured pickles mainly sold in large quantities, in
bulk packs to the food service sector and to bulk sales in supermarkets. The jar-packed product, which
can either be fresh packed or cured, is produced in lower quantities and is usually sold on shelves inside
supermarkets or grocery stores. Every year an estimated quantity of 11,512 tons are produced and sold
locally (value at approximately $10 million). The biggest item is cucumbers at 33 percent of total sales,
followed by wild cucumbers at 12 percent, and turnips at 11 percent.
Export Market
Lebanese exports of pickles saw a 49 percent increase from 2009 to 2012 with the total export volume in
2012 of 17,336 tons with a value of $17.7 million. Cucumbers accounted for 22% of exported pickles
while mixed pickles accounted for 78 percent of exports.

PROCESSED FOODS VALUE CHAIN ASSESSMENT REPORT 25
FIGURE 7: - PICKLE EXPORTS
Data Source: Lebanese Customs
The largest importing country by far, is KSA which accounted for 56% of total Lebanese exports of
pickles, followed by Kuwait, U.S., Canada, and UAE.
FIGURE 8: TOP IMPORTING COUNTRIES OF LEBANESE PICKLES IN 2012
Data Source: Lebanese Customs
Lebanese pickles are mainly sold to local distributors and chains in the GCC countries while it is
mainly handled by ethnic product distributors in the West.
$0
$1,000
$2,000
$3,000
$4,000
$5,000
$6,000
$7,000
$8,000
$9,000
$10,000
Saudi Kuwait USA Canada UAE
1,0
00
USD

PROCESSED FOODS VALUE CHAIN ASSESSMENT REPORT 26
2.5 OPPORTUNITIES AND CONSTRAINTS
The major opportunities for pickles are as follows:
1. Increase quality and competitiveness of cured pickles through the improvement of workers’
skills;
2. Increase sales to export markets by increasing production of competitive high-quality fresh pack
pickles in individual packs.
Capitalizing on these two opportunities will require strong collaboration between farmers and processors with the
elaboration of outsourcing arrangements for fermentation and raw product production. It will also require closer
market communications with clients in the GCC and western countries.
Constraints that are specific to pickles include:
The unavailability of consistent quality vegetables This is especially true for cucumbers. The reasons for this
lack of supply are: poor production practices among farmers; a lack of farmer specialization in vegetables for
pickling; and poor post-harvest handling.
Poor training of workers and managers Pickling facilities in Lebanon do not follow common industry
leading practices. Raw material is not properly treated and many processors use plastic drums that
are unhygienic. Supervision of fermentation is also often inadequate. These practices are easy to
change through training.
Lack of understanding of destination market channels Lebanese pickle processors have a limited
understanding of how destination markets are structured and what the major trends are. In particular,
most exports to the GCC countries are of low-quality underpriced cured pickles despite the fact that
market prospects for high quality pickles are quite good.
4. DAIRY PRODUCTS - WHITE CHEESES, LABNEH, AND AYRAN
2.1 PRODUCT DEFINITION
The dairy industry included about 15 percent of the total food and beverage industries in 2007 (110
establishments). The Lebanese dairy industry has the following characteristics:
Fresh milk production in Lebanon is relatively costly as farms are mostly small entities and the cost
of fodder is high. Powdered milk is still predominantly used in households and in industry.
Enforcement of regulatory rules on raw milk and on milk products is arbitrary. The local market is
highly open to competition from imported processed items, especially cheese.
Local brand UHT milk is now imported after the only producer, Liban Lait’s factory was destroyed
during the 2006 Israeli war. Imports of milk from Arab countries benefit from favorable duty
treatment. The major exporting countries are Egypt and KSA. Low shelf life pasteurized milk
constitutes a small but growing segment.
Ayran, plain yogurt, and Labneh are locally produced in significant quantities.
Milk processing is a seven day per week business. Most companies work six days a week and keep
Sunday for storage. The bulk of the dairy processing is done by about eight factories. Raw milk is
mainly cow’s milk outsourced from the Akkar Region, the Bekaa Region, and from farmers in Mount
Lebanon. All the companies utilize milk powder, though the extent of their reliance varies from

PROCESSED FOODS VALUE CHAIN ASSESSMENT REPORT 27
company to company. In some cases goat milk and sheep milk are utilized for special products, yet
the quantities are still small.
In order to assure a minimum quantity of high quality raw milk, many processors are vertically
integrating their manufacturing processes. Factories have established or purchased their own farms.
The largest one with about 1,800 animals. The remaining independent farmers are located around the
factories, especially in Mount Lebanon. Most of these factories comply with at least the minimum
hygienic requirements for the production of dairy products.
For practical requirements, and in order to cover most of the economic parameters related to the sector,
we have focused on three dairy products: labneh, white cheeses, and Ayran. The main reasons are:
- Labneh and white cheeses constitute higher added value products compared to other locally
produced dairy products.
- Labneh and white cheese are both high consumption items, locally and in Arab countries.
- Ayran is growing in popularity and has the largest potential for export to regional countries.
- All products (except some white cheeses like halloum and akawi) can be produced from fresh
milk and/or powdered milk, which makes raw material more available.
- Al items require skilled labor.
Yellow ripened cheeses were not selected, despite their excellent potential, because of their high fresh
milk requirements. This poses many difficulties due to the general lack of fresh milk in Lebanon.
Specific product specifications are given below:
Ayran drinking yoghurt: Liquid cultured milk made from 50 to 60 percent diluted milk and lactic
culture. Salt and some stabilizers are added. Ayran has almost fully replaced full strength yogurt
drinks on the commercial market. Ayran is mainly consumed as refreshment rather than a dairy
product and is in direct competition with other non-alcoholic drinks. The largest sales at present are
in the food service sector rather than in the retail sector. The largest brands are Taanayel, Liban Lait,
and Khoury; however there are many small processors that sell in areas that are in close proximity to
their factories. Most of these small factories do not meet international food safety standards.
Labneh: Produced from yoghurt (coagulated milk undergoing lactic acid fermentation) where salt is
added and the product is concentrated to a minimum 23 percent solid content by removing water.
Labneh is simply strained yoghurt and, therefore, all yogurt processors have labneh available.
Labneh exist in full fat and low fat and is generally a short shelf life product reaching a maximum of
30 days if the cold chain is well maintained.
White cheeses: Include the traditional Lebanese cheeses such as Akawi, Halloum, Double Crème,
baladi, and shanklish. White cheeses are mostly locally produced, though a large quantity is
imported from Syria. They are coagulated and fermented milk products using an enzymic
fermentation sometimes supplemented with lactic fermentation. White cheeses should be produced

PROCESSED FOODS VALUE CHAIN ASSESSMENT REPORT 28
from raw fresh milk in order to achieve desirable qualities; however powdered milk can be added to
compensate for shortage of raw milk without greatly affecting quality.
3.2 ACTORS
The main actors in the value chain are listed below.
Dairy farmers these vary from small individual farmers (two to five cows) to medium sized entities (150
cows) to larger entities (1,500 cows). Most of the farmers buy their fodder from special suppliers, except
for one or two who are vertically integrated and grow their own crops for fodder production. The
productive capacity of the dairy farms varies between 150 liters to 25,000 liters per day. The majority
though are on the lower side of the scale. Few farms have refrigerated storage facilities which make it
imperative that they deliver their milk the same day they extract it from the cows.
Small processors There are over 300 small dairy processors in Lebanon. Most consist only of one
foreman with a few workers who receive raw milk from dairy farmers and produce a standard range of
dairy products such as Labneh, Laban, white cheeses, and shanklish. A lot of these small processors
possess their own sales outlets adjacent to their processing facilities. The hygienic condition in most of
these small processors is questionable. They are usually able to sell their products on a daily basis in
small volumes. Thus, given this quick turnover and low volume, the fact that they may be producing
products that do not have a long shelf life because of questionable hygiene is not a major problem.
Cooperatives Few agricultural cooperatives produce dairy products. There are four or five cooperatives
in the Bekaa and in the north and a similar number in the south of Lebanon.
Medium and large processors these are companies that buy fresh milk from farmers and powdered milk from local
importers, treat it, and produce pasteurized milk products. Powdered milk is utilized to fill the gap in fresh milk
deliveries as well as to standardize fresh milk and, in many cases, replace fresh milk as less expensive raw material.
Medium and large processors can vary between 25 and 100 workers with capacities that run from 2,000 liters to
30,000 liters of milk per day.
Factory distributors/exporters These are distribution agents who work with most of the medium and large
processors. They own refrigerated vans and deliver to supermarkets and to groceries. Their role is to deliver
fresh products on a daily basis, remove old product from the market, and assure that their product is
always available on shelves. Some of these distributors act as exporters. Many are also owned by larger
dairy processors.
Wholesalers These are intermediary sellers and distributors of many items including dairy products.
Their main role is to access small shops and groceries. They are not very active in the dairy business
because it requires a large investment and carries high risk due to the limited shelf life of most products.

PROCESSED FOODS VALUE CHAIN ASSESSMENT REPORT 29
FIGURE 9: DAIRY VALUE CHAIN MAP
3.3 PRODUCTION AND PROCESSING TECHNOLOGY
Dairy products are produced in Lebanon using raw milk and recombined milk using imported powdered
milk. Similar to all regional countries, the presence of powdered milk is important because it facilitates
constant availability even when raw milk may not be available. The production of raw milk at the farm
level is still controversial as it is expensive and non-hygienic. While cheeses are produced mainly from
fresh milk, ayran and labneh are produced from a mixture of fresh milk and powdered milk or in some
cases completely from powdered milk. The processing steps for labneh and ayran and white cheeses are
detailed below.
Markets local market Direct Sup /groc Food service Export market Ayran cheese labneh
cheese 10% 60% 30% GCC 500k 0
labneh 10% 75% 15% Other
Ayran 25% 75% Iraq 1600k 500k 0
Other
Distribution
factory distributors Wholesalers
Finished goods Cheeses
Milk processing
Medium /large Small
Processors processors
packaging materials
Milk collection
Milk collectors Packaging suppliers
Damane local & imported
Milk aggreggation
Fresh milk COOP Dairy farms Individual Own
Farms Farmers consumption
Powder
Milk
Importers
& Distrib.
Packaging
Material
$0.66/L
165,000 Tons per year
Ayran: $0.85Labne: $6 to $7White Cheeses: Halloum: $11.3, Akkawi: $10 , Double Creme: $8, Shanklish:$10.67
$0.73/L
Prices are i USD and Per Kg
Ayran: $2.0-$2.67Labne: $6 .67 to $7.67White Cheeses: Halloum: $11.3, Akkawi: $12.67 , Double Creme: $9.3,3 Shanklish:$12.3
Ayran: $0.63Labne: $3.55 to $4.56White Cheeses: Halloum: $8.3, Akkawi: $8 , Double Creme: $2.84, Shanklish:$9.38

PROCESSED FOODS VALUE CHAIN ASSESSMENT REPORT 30
Labneh and Ayran
These products are both made from yoghurt as the base ingredient. Yoghurt is produced by the lactic
culture fermentation and coagulation of milk. The inoculate is usually a mixture of bacillus bulgaricus and
streptococcus thermophiles. The main production steps are as follows:
Raw milk is pasteurized for 5 minutes at 980 C.
The milk is then cooled at 450 C and inoculated with a lactic culture and incubated for
several hours until the milk becomes more acidic and coagulates.
The coagulate is then immediately cooled down to 40 C in order to solidify the texture,
essentially forming yoghurt
In the set yogurt, the inoculated milk is transferred to small recipients and incubated for
several hours, then refrigerated.
To make Ayran, yoghurt is diluted with water and salt is then added.
Labneh is produced from stirred yoghurt which has been strained in a white cloth and
concentrated 3.5 times. The cloth straining takes place in a cold room and for at least eight to 10
hours. Labneh processing is mostly done on an industrial scale, yet is also replicated in home and
artisanal production units. Salt is added and the product is well mixed until it becomes smooth
and creamy.
White Cheeses
Processing steps for white cheeses are as follows:
Raw milk is received cold, tested for quality, and heated mildly up to maximum 670 C.
The milk then is stored in a cheese vat and exposed to an enzymatic fermentation by adding the
enzyme rennet and calcium and kept at 370 C.
The coagulate is then filtered and the serum obtained, called whey, is utilized in the production of
double crème.
The filtered coagulate is pressed, molded, or even boiled depending on the type of cheese to be
produced.
The cheese is later either immediately wrapped in plastic or stored in a brine solution in special
tins at cold temperature for later repacking or sales as a wholesale item.
In general, the gross margins on milk products are low (15 to 30 percent depending on the products) after
subtracting the cost of raw milk, cost of production, cost of distribution, and cold storage. Apart from the
need to optimize milk production costs at the farm level costs must be saved during distribution and
throughout the cold chain.
3.4 MARKETS
Domestic Market

PROCESSED FOODS VALUE CHAIN ASSESSMENT REPORT 31
The estimated consumption of some categories of dairy products in Lebanon in 2008 and 2009 according
to a study by IMES/Consulting in Dubai is as follows:
TABLE 6: ESTIMATED CONSUMPTION OF DAIRY PRODUCTS IN LEBANON 2008-2009
Item Approx. Volume in Metric
tons(2008)
Retail Value(2008)
(US$ Millions)
Forecasts 2013
(US$ Millions)
Liquid milk 8,500 14 19
Ayran 3,900 5 22
Yogurt 13,500 19 17
Labneh 6,200 (21,000 LME*) 24 25
Cream 2,000 (13,000LME) 9 15
Dairy desserts 50 0.3 300
Butter 4500(95000LME) 40 114
Retail Milk powder 9600(77000LME) 68 87
Source: Imes consulting/Dubai. *LME=Liquid Milk Equivalent
Annual growth in volume of about 2.5 to 3.5 percent per annum is projected for all the different items
mentioned starting from about 550,000 tons of milk consumed. The FAO estimated per capita annual
consumption of milk to be about 106 liters (2009), those figures include imported as well as locally
produced milk, while consumption of fresh milk according to the IMES study is estimated at 18 liters per
capita. The UHT milk market which was mainly produced in Lebanon by Liban Lait in carton packs was
discontinued and replaced by a subcontracting agreement in France, and subsequently from Egypt, which
benefits from the Arab Trade agreement. The major dairy products marketed domestically are the
following:
TABLE 7: MAJOR DOMESTIC DAIRY PRODUCTS
Type of package Sizes Top 5 Brands Source

PROCESSED FOODS VALUE CHAIN ASSESSMENT REPORT 32
Product
Liquid milk UHT Aseptic carton 1 liter, 150ML,200M, 250ML
Liban lait, Dairy Day, Taanayel, UNO
Imported Egypt.
Liquid milk (Pasteurized)Short
PET Bottle 1 liter, 250ml Liban Lait, DairyDay, Solight, Taanayel, Khoury
local
Ayran (short shelf life) Pet bottle 250ml Dairy Day, Taanayel, Local
Plain Yoghurt Plastic pots, Pail 450g, 500g, 1kg, 2kg
Liban Lait, DairyDay, Taanayel, Khoury, Baroud
Local
Fruit flavored yoghurt Plastic cups Taanayel; Elle et Vire; Danone.
Local and imported (France).
Labneh Thermoformed tubs, pails
400g,500g,1kg,2kg,5kg
Liban Lait, DairyDay, Taanayel, Khoury, Jdita
Local
Dairy desserts Plastic cups Taanayel; Danone local
White cheeses (Halloumi, Akkawi, Double crème, light white)
Plastic vacuum wrap
Liban Lait, DairyDay, Taanayel, Khoury, Jdita,
Local; imported (Cyprus, Syria).
Butter Alu wrap 200g,400g Imported-Belgium, Denmark.
Ayran: The consumption of ayran in the local market has been relatively steady the past five years. The
usual pack for ayran is the 250/300ml PET bottle stored at refrigerated temperatures. Even though both
Liban lait and PAMPA commercialized the sterilized versions of the product, both are now no longer
participating in the market for various reasons.
Labneh: sold in retail packages, but also in five kg bulk packaging for over the counter sales and for
HoReCa.
White Cheese: White cheeses are sold in the retail market as well as to bakeries and dessert shops. A large
percentage of akkawi cheese is sold to bakeries and oriental dessert shops and to make cheese
“Mankoushe” and it is also sold to oriental desserts shops to make “cheese kenafe,” a Lebanese dessert.
Most of the white cheeses are made from cow’s milk except for a small quantity used to produce goat
cheese or to add with halloumi.
Export Market
Major export markets for Lebanese dairy products are still closed due to SPS reasons. The Ministry of
Agriculture (MoA) is not technically ready to facilitate global trade by putting Lebanon on the list of
approved suppliers.
The dairy export market is still in its primitive stages due to the nature of the product and the hurdles
imposed by the importing countries on animal based products. Exports to Europe, U.S., and Australia are
practically nil, except for small quantities of certain specific items such as labneh preserved in oil and
shanklish (traditional cheese). Exports to GCC countries, Egypt, and Iraq exist at low levels, although
with promising potential for expansion considering the high level of appreciation for such products in the
Gulf and the high quality of Lebanese products relative to other regional suppliers.

PROCESSED FOODS VALUE CHAIN ASSESSMENT REPORT 33
The main items exported are white cheese (including shanklish), ayran, labneh in fresh pack, and labneh
preserved in oil. All products except labneh preserved in oil require refrigerated storage and
transportation. The overall quantities exported in 2011 did not exceed 1,300 tons most of which are
cheese products and ayran. The first five importing countries are Kuwait, KSA, Jordan, Iraq, and the U.S.
In 2012, Iraq became the number one importing country for ayran, with imports estimated between 1,000
and 1,500 tons.
3.5 OPPORTUNITIES AND CONSTRAINTS
Dairy production in Lebanon is still dependent on the import of powdered milk. Historically the cost of
milk powder was always cheaper than fresh milk as it has often been subsidized in its country of origin. In
addition most of Lebanese dairy farms were destroyed during the civil war, and were not rebuilt
adequately before the late nineties when investors started to take interest in developing fresh milk
factories again. In 2012 alone about 22,000 tons of milk powder (both full fat and low fat) were imported
from various countries in Europe; this is equivalent to about 167,000 tons of Liquid Milk Equivalent
(LME) (22,000 x7.6 liters). About 50 percent was for retail sales and the rest was utilized in industry.
Raw milk production in Lebanon was estimated to be around 165,000 tons in 2011. Those figures might
not be very accurate but they do indicate that Lebanon imports milk and milk products at least as much as
the country’s production in terms of liquid milk equivalent (LME).
Given the importance of milk powder and the unpromising prospects for increased raw milk production,
opportunities in the dairy sector are the strongest for products that can be successfully made with milk
powder inputs—which is the case for ayran, labneh, and white cheeses. Specific opportunities for these
products are as follows:
1) Increase exports of the three targeted products to Syria, Iraq, and GCC markets.
2) Replace imports of white cheese in the domestic market.
3) Introduce new types of processed white cheeses that are not currently produced in Lebanon, such
as feta cheese that has high local and regional demand.
4) Improve the efficiency of the many cooperatives and small and microenterprise processors of
white cheese, labneh, and ayran.
These opportunities could be achieved through a joint effort with milk producers, dairy processors, and
strong distributors in the destination markets. The support and input of the public sector is also required.
All three products have a strong potential for export. Labneh in particular is experiencing some success as
an export product.
Major constraints that stand in the way of the realization of these opportunities include:
A lack of good quality raw milk There is currently an insufficient, though increasing number of
state-of-the art dairy farms capable of supplying consistent quality milk.
An absence of required food safety systems among processors Many dairy processors do not
apply mandatory HACCP or even GMP requirements. This is particularly the case for smaller
processors and cooperatives. These problems are compounded by the poor quality of raw milk

PROCESSED FOODS VALUE CHAIN ASSESSMENT REPORT 34
inputs as most processors work with raw milk that has a high load of microorganisms. This
situation is very detrimental for the shelf life of products such as cheese and labneh.
Processors have difficulty acquiring skilled food safety educated staff at the level of supervisors
and operators. There is a general lack of trained dairy processing technicians in Lebanon.
5. READY-TO-EAT MEALS
4.1 PRODUCT DEFINITION
There are several types of prepared meals produced in Lebanon, they include:
Industrialized long shelf life meals. These are usually canned or frozen although recently vacuum
packed products have appeared. The main types of product being produced are: (1) canned middle
eastern products (fava beans, muddammas, hummus with tahini, and babaghanouge); (2) frozen items
such as “kebbe” and frozen pastries stuffed with vegetables or minced meat; and (3) vacuum packed
chilled traditional Lebanese meals consisting of prepared dishes, with or without meat, sterilized
under a vacuum and stored in chilled conditions. These products are microwaveable. Canned Middle
Eastern products have a shelf life that can last for up to two years. Frozen kebbe and pastries can be
stored up to one year with proper cold chain management. Vacuum packed traditional Lebanese
meals can also be stored up to one year.
Short shelf life minimally processed meals. These types of products include fresh hummus and
babaghanouge usually packed in plastic cups or trays, as well as other dips such as guacamole and
fresh-cut salads or potatoes chilled and packed in plastic trays or bags. The shelf life for all these
types of products is generally from 21 to 45 days with temperature maintained at 40 C.
Very short shelf life dishes for quick consumption. These are produced by the food service industry
and contain a diversified range of products such as traditional Lebanese hot dishes, sandwiches, and
other catering-type meals. These products have the highest added value and are mainly sold in the
domestic market and catering for airlines. Those items are not included in the analysis presented
below.
4.2 ACTORS
Given the wide variety of products in all the different ready-to-eat meal value chain segments, we have
chosen to concentrate on the babaghanouge segment as a good general example and on fresh cut salads as
a minimally processed food item. The main actors in the Babaghannouge value chain are described
below; the fresh cut segment follows.
Eggplant growers: These are farmers or agricultural contractors who own land or rent land and grow
various vegetable products including eggplant. They provide fresh produce directly from the field, can
guarantee quantities on a regular basis, and can improve quality or even variety of eggplant according to
the processors needs.

PROCESSED FOODS VALUE CHAIN ASSESSMENT REPORT 35
Wholesale markets: These are critical focal points for all agricultural products, especially the highly
perishable ones. Sometimes babaghanouge processors will buy product in wholesale markets in order to
reduce their purchase prices relative to direct contracts to small farmers.
Semi-processors: These are growers or damans who are usually established near the farms and whose
main role is to process agricultural products to processors’ specifications. Their competitive advantage is
that they buy material on site and utilize relatively cheap rural labor for processing. In the case of
eggplants the processing operation involves roasting, peeling, and freezing the product.
Tahina suppliers: These are local tahini production factories which are numerous in Lebanon. They sell
tahini in bulk containers.
Medium and large size processors: These are canners having a medium or large capacity utilizing
complete canning facilities to prepare and can babaghanouge.
Distributors /brand owners/exporters: These include brand owners having their own distribution
system. They sell both locally and abroad.
Distributors/wholesalers: This category of actors includes large product distributors/importers that often
are organized in companies that belong to processors or are subcontracted by them. They also include
independent distribution and logistics companies that access a large number of retail outlets in Lebanon.

PROCESSED FOODS VALUE CHAIN ASSESSMENT REPORT 36
FIGURE 10: BABAGHANOUGE VALUE CHAIN MAP
The main actors in the Fresh cut chain are as follows:
Fresh vegetable growers: These are farmers or agricultural contractors who own land or rent land and
grow various vegetable products including lettuce, onions, potatoes, cabbage. They provide fresh produce
directly from the field, and can guarantee quantities on a regular basis. They should be able to guarantee
quality, but only in the specific crop they specialize in.
Market local market
Supermarkets groceries Exports
GCC EU usa Australia
wholesalers Distributors
canned exporters
Distributors Babaghanouge Brand owners
canned
Baba
Processors small /medium size
babaghannouge
Semi packaging
Packaging materials Processors suppliers
Roasted tin cans
semi-processed frozen glass jars
eggplant
Salt&Citric
Ingredients importers
Fresh produce Eggplant wholesale Tahina
Growers Market suppliers
us$0.21/can
3.4 RM0.3 RM
1.3/370g FP1.08/370g FP
0.91/370g FP
$1.2/kg RM
Prices are in US$/Kg
RM=raw mat;FP=Finsihed prod

PROCESSED FOODS VALUE CHAIN ASSESSMENT REPORT 37
Wholesale markets or whole sale market agents: These are critical focal points for all agricultural
products, especially the highly perishable ones. They remain the favorite suppliers to fresh cut processors
due the fact that they are able to deliver various crops at the same time and in small and medium
quantities.
Small and medium processors: These are actors that transform the raw material into fresh cut salads;
pack them and assure their continuous storage in cold conditions. They either buy product day by day or
store it for a few days only, in view of the constraints of their business.
Processors /Distributors: These are processors having their own refrigerated vans, which carry the goods
on a daily basis directly from the factory stores to the cold stores of the foods service chain.
FIGURE 11: FRESH CUT SALADS VALUE CHAIN MAP
local market Exports
markets Direct salesFood service Supemarkets GCC
groceries
distribution Refrigerated
storage
processing Processors
Packaging
Refrigerated suppliers
pre-processing storage PE Bags
PP trays
vegetable whoelsale market
growers market
i ceberg lettuce iceberg lettuce
potatoes potatoes
cabbage cabbage
fresh Produce onions onions
garl ic garl ic
Ini tiation phase
Prices are in US$/Kg
RM=raw mat;FP=Finsihed prod
1.62RM
2.05FP
1.82RM
0.19
2.5FP

4.3 PRODUCTION AND PROCESSING TECHNOLOGY
Industrialized long shelf life products:
Canned ready to eat meals require relatively mechanized and automated systems in order to meet both
safety and cost requirements. Therefore such products are produced mostly by medium and large sized
canning facilities. Some other types of long-shelf life ready to eat meals require more intensive labor
inputs. These types of products are usually produced in small factories and in rural agricultural coops for
women. These products include stuffed grape leaves, zucchini or makdous.
The raw material ingredients are either procured locally or, in the case of meals produced with dried
legumes (hummus and fava beans), are imported. The process for babaghanouge is described in more
detail below.
Babaghanouge is made up of the following ingredients: Raw eggplant or frozen and roasted eggplant,
tahini, salt, lemon juice, and citric acid. The production steps include:
Roasting and peeling of the eggplants;
Mixing eggplants with tahini, salt, and lemon according to specific formulations;
Filling the mix into cans or jars;
Closing the container hermetically;
Sterilization of the sealed cans;
Labeling and boxing of the sterile cans; and
Storage at ambient temperature.
Short shelf life products with minimal processing
Production lines for minimally processed food products are mainly large kitchens. However, they should
be designed as sophisticated units with highly efficient air filtration, temperature controls, as well as cold
storage to maximize shelf life. Short shelf life processing is a relatively new technology in Lebanon. The
associated high cost of production is compensated by a higher added value on the shelf. The source of the
raw materials is usually both local and imported when it comes to dips such as hummus tahini, while it
can be completely sourced from local materials for such products as fresh cut salads.
In the case of fresh cut salads or vegetables, the processing equipment can vary from semi-automatic
equipment to higher capacity automated lines. In Lebanon there are one or two automated lines such as
the one at Fresco in the north. The process consists of:
Sorting of the fresh vegetables;
Thorough washing;
Cutting of the vegetables into pieces or slices depending on the final product;
Dipping in cold chlorinated water to reduce temperature and microbial load;

PROCESSED FOODS VALUE CHAIN ASSESSMENT REPORT 39
Removal of the excess surface water by centrifugal force;
Filling of the dewatered vegetables in plastic bags or trays, while removing a large part of the air;
and
Storing the packed fresh vegetables in a cold store at a maximum temperature of 40 C.
The technology of production is highly dependent on the factory hygiene, conditioned climate, and the
cold chain.
4.4 MARKETS
Domestic Market
Industrial long shelf life ready to eat meals
The domestic market is quite developed for canned food items such as the Middle Eastern food
specialties. Canned hummus with tahini, fava beans muddammas, and babaghanouge are among the
leading products. The potential for growth of such items is in the development of new products such as
stuffed vine leaves and soups. The competition in this part of the market is coming from minimally
processed or over the counter items that have a lower shelf life and are more expensive, but have a
fresher taste. Thus the potential to expand existing canned Middle Eastern specialties is fairly limited.
On the other hand frozen food products such as pastries and kebbe have rapidly expanding market
potential with little competition.. However, it has a limited product array and is missing key leading
products such as traditional Lebanese pastries. This segment has important growth potential as Lebanon is
an important poultry producer. The local brands do not have much competition from imports as the range
of products is related to Lebanese tastes, though there is a need to improve the presentation and marketing
of such products.
Industrial short shelf life products
Lebanon has a strong HoReCa industry which is the main buyer of these types of products. Local caterers
prize thee products since they need the flexibility of offering and distributing any type of meal on short
notice and in a relatively short time. The market trends show that there is room for increased sales of
products such as hummus tahini or babaghanouge, garlic paste, and fresh cut salads.. This of course is
only a very small share of the fresh market for hummus tahini if we consider foods service and over the
counter sales.
Export Market
Exports of canned ready to eat meals started in the 1930s. These exporters were first to introduce hummus
in the U.S., Canadian, and other markets. However, even though Lebanese producers are pioneers in
exporting Middle Eastern canned products they have failed to keep up with new developments in the
overseas markets for these products. The U.S. market today has a fresh hummus market estimated at

PROCESSED FOODS VALUE CHAIN ASSESSMENT REPORT 40
$300 million which has practically eradicated canned hummus. The same situation is taking place in
Europe, yet at a slower pace. Foul Muddammas is still a highly prized item in the GCC markets which are
the largest consumers, but these markets have been dominated by local factories such as California
Gardens, a UAE owned company and others. Their production costs are considerably lower than that of
Lebanese processors.
Nonetheless, Lebanese ready to eat meal exports have a high potential for growth if processors are able to
deliver the right products. Their chance for success is promising since Lebanese cuisine is highly
appreciated regionally and recognized globally due to Lebanon’s status as a tourism destination and
opening of gourmet quality Lebanese restaurants in various international cities such as Paris, London,
New York, Sydney, Dusseldorf, Washington, and Chicago as well as in Gulf cities such as Dubai, Jeddah,
and Riyadh.
In addition to ethnic food distributors, Lebanese restaurants in foreign countries constitute a significant
venue for sales of Lebanese products. Foreign consumers appreciate Lebanese products, though are not
able to simulate them at home because Lebanese industrial products, initially intended for the diaspora, do
not always constitute a final ready to eat product similar to a restaurant without further processing at
home. Another important point which was clearly witnessed in the U.S. markets is related to the
importance of customizing products to suit the taste of local consumers, other than the diaspora. Two big
successes, hummus tahini and labneh (or Greek yoghurt), have succeeded in the U.S. market because they
were modified to suit mainstream consumers’ tastes.
Furthermore the introduction of Lebanese stuffed pastries and kebbe along with other Lebanese food
items which are gaining ground in Lebanon should be envisaged as they are already starting to be
marketed abroad, especially in the GCC markets. The market size is still small; however it has large
growth potential. There is an issue in terms of meat in meals since they are subject to the tougher
regulations on animal origin products, even outside of the U.S. and EU. Fresh cut salads are still a purely
local market product, but with good development and marketing skills, it can easily penetrate the GCC
markets and possibly other neighboring markets.
4.5 OPPORTUNITIES AND CONSTRAINTS
Lebanese ready to eat meals have the potential to catalyze the future development and upgrading of
processed food exports. This is due to several factors: chief among these is the fact that they have a
higher added value than pure commodity products which means that Lebanon as a high-cost raw product
producer has less of a handicap. Lebanese food products have started to be well known in world markets,
at least in major international cities due to the presence of Lebanese restaurants, and the diaspora.
Lebanon can provide a diversity of such products, some of which are complicated to produce and require
intensive labor.
The opportunities can be summarized as follows:
Widen the range of ready to eat products being sold into Iraq and the GCC countries. These markets are
growing rapidly and Lebanon is well placed to serve them if ready to eat processing companies would
reorient their focus away from the lower value canned Middle Eastern products to other higher value

PROCESSED FOODS VALUE CHAIN ASSESSMENT REPORT 41
products such as shorter shelf life items and frozen pastries where demand is growing at a much faster
rate.
Expand ready to eat exports to the EU, U.S., and Australia with a similar widening of product offerings
away from traditional canned products and through the upgrading of Lebanese processors in terms of
quality and food safety.
The constraints to realizing these opportunities are:
1) The absence of a common Lebanese export market strategy directed towards the different
markets whether the traditional Arab markets or the western markets.
2) Significant lack of information on the internal dynamics of the various markets, and a
frequent absence of good market links.
3) Absence of range of ready to eat food products on which a robust marketing strategy could
be built, as well as compliance with recent food safety and traceability standards.
4) Further compliance of food companies producing ready to eat meals to international
standards to facilitate export procedures.
5) Lebanon as a country is still denied the possibility to export animal origin products to a large
number of western countries, thus eliminating the possibility of exporting certain RTE
products.

PROCESSED FOODS VALUE CHAIN ASSESSMENT REPORT 42
6. BUSINESS ENVIRONMENT FACTORS AFFECTING THE PROCESSED FOODS VALUE CHAIN
REPRESENTATIVE ORGANIZATIONS IN THE PROCESSED FOODS SECTOR
There are two main organizations that play a representative role for actors in the processed food sector:
the Syndicate of Lebanese Food Industrialists (SLFI) and the Chamber of Commerce and Industry, and to
a lesser extent, the Association of Lebanese Industrialists (ALI). The interventions of SFLI and the
Chambers are described below.
1.1 SYNDICATE OF LEBANESE FOOD INDUSTRIALISTS (SLFI)
Founded in 1995, the Syndicate represents over 150 food manufacturers, and 85 percent of all major food
exporters. The SLFI supports its members in their business endeavors, organizes Lebanese national
pavilions in international food fairs, and advocates for its stakeholder’s interests with concerned
authorities. SLFI has recently been emphasizing assistance to help the industry increase its exports
through more innovative marketing. It encourages members and the food industry in general to develop
marketing strategies and campaigns to reach new markets and expand their businesses. Cooperation
among actors within the value chain has been difficult and presents a major challenge for SLFI. Business
owners are independent and the benefits of collaborating horizontally and vertically within the value
chain are not apparent to them. As a result, instead of improving cooperation, the Syndicate is mainly
focused on lobbying the government for support and policy reform to assist enterprises. The only material
assistance provided by SLFI is co-financing for food pavilions. SLFI receives the funding from IDAL to
cover part of the exhibitioner’s cost, and in turn any company that wants to exhibit in the Lebanese
Pavilion would have to go through SLFI.
1.2 CHAMBER OF COMMERCE AND INDUSTRY (CCI)
The Chambers of Commerce of Industry and Agriculture which is headquartered in Beirut with branches
in Zahle, Saida, and Tripoli, is a non-profit private organization that has the exclusive rights to the
provision of services to business enterprises, namely issuing certificates of origin and authentication of
invoices and commercial documents. This authority provides the Chamber with significant responsibility
since all Lebanese processors who export must receive approval from them. The CCIA advocates the
development and promotion of agricultural activity by providing market information at the local and
international level, organizes participation in international fairs, promotes Lebanese products, and
provides technical assistance to agro-producers and exporters. The CCIA has also established with the
support of USAID three regional “Pilot Plants”, in Zahle, Saida, and Tripoli that aim to help small and
micro-processors develop new products. USAID also funded analytical laboratories in the regional
chambers that perform required lab testing for processed foods.
7. REGULATORY ENVIRONMENT FOR FOOD SAFETY
Responsibilities for food safety regulations for processed foods are shared by several bodies in Lebanon.
These are described below.

PROCESSED FOODS VALUE CHAIN ASSESSMENT REPORT 43
2.1 MINISTRY OF AGRICULTURE
Through its sectorial strategy, the Ministry has worked on enhancing linkages between agricultural and
agro-food activities, and has included the development of agro-food industries in its support scheme. The
MoA has made a concerted effort to push for better product traceability in the processed food sector. In
particular, the MoA has set up a contract farming program to subsidize agricultural production for
processing if the processor enters into a formal agreement with the producer. In 2010, The MOA and the
Ministry of Industry issued a law (950/1) requiring the registration of all food factories with a sanitary
number, and the implementation of technical control on different aspects of production, and meeting
HACCP and GMP requirements. To qualify for the sanitary number, processors are required to pass an
audit by the MoA. The sanitary number allows food factories to market their products locally and to
export them internationally. Realizing that many, if not most, factories would shut down if the law was
strictly enforced immediately, the MoA established a grace period that varies based on the extent of
necessary upgrades
The new law has had a positive impact on the industry as evident by improvements made by several
factories. One factory visited by LIVCD when the law was initially introduced was given a warning to
upgrade or shut down due to the severity of the finding, and when recently visited, the same factory has
undergone major structural improvements to meet GMP requirements as imposed by the MoA.
2.2 MINISTRY OF INDUSTRY The Ministry of Industry is responsible for maintaining quality standards and promoting better production
practices. Its Industrial Research Institute (IRI) conducts product testing and issues quality certifications
The Ministry supports the Euro-Lebanese Centre for Industrial Modernization program (ELCIM)
providing technical support for manufacturers on issues of production, finance, and marketing.
2.3 MINISTRY OF ECONOMY AND TRADE The Ministry of Economy and Trade hosts the European funded Qualeb program whose mission is to
provide extensive support and advice to strengthen quality management capabilities and infrastructure in
Lebanon. Qualeb seeks to align Lebanese practices to match EU practices in the fields of standardization,
testing, certification and inspection, accreditation technical regulations and conformity assessment, and
market surveillance.
2.4 THE LEBANESE STANDARDS INSTITUTION (LIBNOR)
LIBNOR is a public organization affiliated with the Ministry of Industry that was established in 1962.
The organization creates, disseminates, and amends Lebanese standards and is the only responsible party
that can validate the Lebanese Conformity Mark (NL Mark). LIBNOR provides standards for all
products within the agro-food, chemical, construction, mechanical, electro technical and
electromechanical sectors. In addition, standards include measurements, conventions, methods of
analysis and testing, codes of practice for technical work, and technical rules and codes for buildings.2
LIBNOR recently activated a seal of quality for products abiding by the set of mandatory standards they
release.
2 LIBNOR website http://www.libnor.org/AboutLIBNOR/LIBNORinBrief/tabid/55/Default.aspx

PROCESSED FOODS VALUE CHAIN ASSESSMENT REPORT 44
8. SPECIFIC GOVERNMENT AND DONOR PROJECTS OF RELEVANCE TO PROCESSED FOODS
USAID / Action for Sustainable Agro-Industry in Lebanon (ASAIL)
The Action for Sustainable Agro-Industry in Lebanon (ASAIL) program expanded economic
opportunities for SMEs, cooperatives, and producers in the small ruminant dairy and niche Lebanese
products value chains. Implemented from November 20, 2005 to February 28, 2008 by ACDI/VOCA, in
coordination with local partner Vitech Consulting, this two year and five month, $6.9 million project was
funded by USAID. ASAIL provided extensive technical assistance, marketing, business development,
and access to finance facilitation, and was committed to working closely with enterprising producers,
processors, and other stakeholders.
USAID / Lebanon Business Linkages Initiative (LBLI)
ACDI/VOCA also implemented the Lebanon Business Linkages Initiative (LBLI), a $7.5 million project
funded by USAID for over three years based on two practical private sector concepts that improved
livelihoods of small farmers and boosted the competitiveness of Lebanese agro-food processors. LBLI
addressed economic growth and poverty reduction in Lebanon by working directly with the business
sector facilitating technical assistance, and providing guidance on marketing and access to finance. It
focused on strengthening the support framework in two Lebanese industries: agribusiness (primarily high-
value foods) and tourism.
Euro-Lebanese Centre for Industrial Modernization (ELCIM)
ELCIM was initiated in 2001 by the Lebanese Government in order to improve the performance of
Lebanese manufacturing enterprises. Based on the encouraging results of the first phase (2001-2004), a
second phase started in August 2005 aimed at establishing ELCIM as a business support organization,
which continuously advises and assists manufacturers in improving their performance on both national
and international markets and in facilitating access to long-term financial resources.
ELCIM was co-funded by the European Union (EU), and was part of the EU co-financed Integrated SME
Support Program (ISSP), helping Small and Medium Enterprises (SMEs) in Lebanon by providing a
combination of legislative, business development and financing support. Hosted at the Industrial Research
Institute (IRI) which already offers a wide range of business services, ELCIM became a permanent center
providing continuing assistance, business advice, and specialized services to manufacturing SMEs. The
range of activities currently covered is focused on special training, technical assistance to SMEs, assisting
the SME support center at the chambers, hosting a food advisory service with three universities and three
pilot plants, hosting the LEBANON SOFTSHORE ICT cluster, consultancy for ISO standards, GMP,
and HACCP.
Agro-Food Technical Institute in Qab Elias
PROCESSED FOODS VALUE CHAIN ASSESSMENT REPORT 45
The Agro-Food Industries Vocational School located in Qab Elias is an innovative institution established
as a joint venture between the Lebanese Ministry of Higher Education, the Directorate General of
Vocational and Technical Education, and the SLFI, with funding and support from the EU. The
educational programs merge theory and practice in accordance with European standards, and make use of
a curriculum that covers all aspects of industrial food production in line with the latest industrial
innovations. Graduates from the Qab Elias vocational schools are typically hired by food processing
companies, however better links can be created between the school and the industry.
9. ACCESS TO FINANCE
Credit sources to the processed food sector in Lebanon take mainly the form of loans in addition to
leasing in the case of financing of equipment. The Lebanese government has given the private sector little
support to help them access the financial market. The two main supportive instruments available in
Lebanon are: (1) a specific subsidy for interest payments made by qualifying enterprises and (2) the
Kafalat loan guarantee program. The interest subsidy is provided through the Banque du Liban for loans
granted by commercial banks to SMEs in the following sectors: industrial, agricultural, tourism,
handicrafts, high technology and programming. The loan is used to finance a new project or expand an
existing one. The loan amount varies between LBP 50 million to 15 billion with a maximum duration of
seven years and a grace period maximum of two years. By applying for an interest rate subsidy, the
interest rate is reduced by seven percent on loans up to LBP 5 billion and by 5 percent on the part ranging
from LBP 5 billion up to 15 billion.
Kafalat is a Lebanese financial company with a public concern that assists small and medium sized
enterprises (SMEs) to access commercial bank funding. It guarantees up to 75 percent of the loan amount,
based on business plans or feasibility studies that show the viability of the proposed business activity. It
also guarantees up to 90 percent of the loan amount for startups. Kafalat targets SMEs and innovative
startups that belong to one of the following economic sectors: industry, agriculture, tourism, traditional
crafts, and high technology. Since Kafalat does not stipulate a minimum loan amount, the scheme could
be accessible to clients whose needs are in the range of micro finance. A characteristic of the program
suited to the needs of small businesses is the low reliance on collateral.
10. FOOD PROCESSING COOPERATIVES
There are around 100 cooperatives involved in food processing activities. These include cooperatives
open only to women and mixed gender cooperatives. These cooperatives employ a total of nearly 1,000
women and are distributed across all Lebanese rural areas. Food processing cooperatives tend to be small
with only 10 percent having more than 20 members. They are active mainly in producing traditional
Lebanese foods including jams, syrups, pickles, food preserved in oil, molasses, labneh, dry food, and
herb products. Cooperatives differ in their structure and operation. Some cooperatives have an advanced
set-up and apply advanced technology in production while others have more rudimentary facilities. The
majority of cooperatives have received various levels of funding from local and international donor
organizations, with the most prominent donors being USAID and UNDP. Assistance has been centered on
the provision of equipment and infrastructure as well as capacity building. Trainings have mainly focused
on the following areas: food processing, small business management, quality control procedures and

PROCESSED FOODS VALUE CHAIN ASSESSMENT REPORT 46
market linkages. USAID has mainly provided assistance to cooperatives in the north, while the UNDP
work was concentrated in the South. Additionally, USAID programs have equipped the Chambers of
Commerce in all Lebanese areas with the equipment necessary for quality control checks and testing of
food products. This has allowed cooperatives to better meet quality standards in both local and
international markets. Most cooperatives suffer from a number of serious problems in the areas of
marketing and sales and production standards. Potential for linking cooperatives with industrial firms as
providers of semi-processed goods or of raw product is a possible approach which has not been explored
and may show some promise. For in-depth analysis of processed foods cooperatives, please see Annex B.
11. UPGRADING STRATEGIES FOR PROCESSED FOODS The detailed discussions of the four profiled products discussed above reveals that there are some
important constraints that are common to all processed foods. These include problems due to the lack of
professionalism in marketing, a shortage of technically qualified employees and supervisors, minimal
adherence to food safety standards, inadequate capacity on the part of SLFI, and problems in local raw
material supply. In addition there are a number of more specific constraints that apply to each of the four
profiled products. In the section below, we address first the common constraints with a proposed
upgrading strategy that would apply generally to multiple products in the processed foods sector. Then
we address some specific upgrading measures for each of the four products discussed in detail in the
second part of this study.
GENERAL PROCESSED FOODS UPGRADING ACTIVITIES
There are five key axes of the processed foods upgrading strategy. Each of these is detailed below:
Axis one: Provide needed market intelligence and help processors enter new markets and expand new
ones. Processors clearly need detailed market studies to retool their product strategies in order to take
advantage of local and export market trends. They need guidance on relevant standards in target markets,
prices, competitor strengths and weaknesses, distribution channels, costs of entry, and consumer
preferences. LIVCD can work with marketing consultants to provide the needed studies, possibly in
conjunction with SLFI, to provide information on potential target markets, gap analyses between market
requirements, and Lebanese processor capacity in order to help processors develop realistic marketing and
promotional strategies. A final step in this process would be to link Lebanese processors with foreign
importers, brokers, and or distributors and help them develop needed promotional materials.
Axis two: Develop SLFI to be a fully functional business association capable of providing needed
services to members. Through a grant, help transform SLFI into a sustainable association that can lead
the food processing sector and improve its competitiveness by providing the following services to its
members: (a) help them to gather market intelligence (see Axis One above); (b) collect and maintain a
database with important regulatory and technical requirements in local and export markets, including
packaging and labeling requirements and information on allowable additives. Such a database was been
created with assistance from a prior USAID project, however the database that was housed with CCIA
was not maintained. (c) Promote Lebanese cuisine in local and export markets; and (d) Improve the
performance of the Qab Elias vocational school which is co-managed by SLFI, to improve the quality of
its graduates so they can address the needs of the industry.

PROCESSED FOODS VALUE CHAIN ASSESSMENT REPORT 47
Axis three: Help Lebanese food processors to improve efficiency and meet international food safety and
labeling standards. Collaborate with local entities such as ELCIM and the “SME Support Centers” in the
Chambers of Commerce to provide training and technical assistance on Lean Manufacturing aimed at
improving the efficiency of factories, reducing costs, and improving safety and quality. Other areas
where training should be provided include food safety systems such as HACCP and ISO 22000. Another
set of activities could be targeted at working with LIBNOR and SLFI to create and promote a food quality
seal—perhaps even helping to implement the existing LIBNOR quality seal program that has not yet been
put into action. Finally, LIVCD can provide tailored technical assistance to individual processors to
improve their capabilities in product and process development in order to optimize product quality,
reduce costly formulations, improve food safety, and develop needed food packaging solutions. This will
also entail coordinating with LibanPack to improve product labeling and packaging to meet market
expectations.
Axis four: Increase participation of farmers, small firms, and cooperatives in the processed foods value
chain. LIVCD can work to help processors improve their supply chain by developing outsourcing
agreements with farmers, smaller private firms, and cooperatives to supply raw and semi-processed
product. This will be done through the stimulation of vertical linkages with written contracts specifying
quality parameters and through the facilitating of financing in support of these agreements. Farmers can
be supported to introduce new varieties that are suitable for processing and with technical assistance to
improve production practices and post-harvest handling to minimize losses and improve quality. LIVCD
will also collaborate with local NGOs such as Namlieh and Atayeb Al Reef to extend the market reach of
food processing cooperatives.
Axis five: Promote new investments in processed food supply chains with appropriate partners. LIVCD
will first perform a survey of all processing equipment and facilities available in rural areas that have
been donated or purchased by donor-supported projects, especially USAID-funded projects, and create a
plan to maximize their utilization. Depending on the results of this survey, the project will consider using
its public-private partnership (PPP) mechanism to co-invest in rural areas in needed processing equipment
that would be used to provide private partners with product that they require. Possible investments would
include: (a) bulk freezing facilities to be used for seasonal fruits such as apricots, strawberries, figs, and
cherries to be used in jam; (b) fruit drying facilities; and (c) fresh cut vegetable production units in
various agricultural regions.
PRODUCT-SPECIFIC UPGRADING STRATEGIES
2.1 JAMS
The following upgrading activities apply only to jams:
1- Support processors in developing low calorie jams as well as jams with other natural sweeteners.
2- Create forward contracts between farmers and processors to insure adequate supply of suitable fruits
required for jam processing.
3- Help jam processors identify an alternative filler fruit to low cost jams when apples are expensive.
4- Help processors upgrade their jam production technologies to produce better quality jams that can
compete with high-end European products.

PROCESSED FOODS VALUE CHAIN ASSESSMENT REPORT 48
2.1 PICKLES
Elements of an upgrading strategy specific to pickles include the following points:
Axis One: Support local fermented cucumber processors by improving quality while keeping cost levels
down with more vertical integration and the development of a modern fermentation process. This would
entail support for contract farming agreements between local processors and growers for cucumbers and
support to processors on bulk tank fermentation.
Axis Two: Provide technical support to local processors and exporters in marketing improved fermented
product in the local market and abroad in order to increase market share of Lebanese pickles. The first
step would be a market study in Lebanon and the GCC in order to establish an estimate of the pickled
cucumber market size, and determine an actual baseline and potential increases within the coming three
years. Next, support will be provided to processors in the development of their label and brand image.
Finally, LIVCD can help with actual market linkages and access in GCC, North American, and EU
markets.
2.2 DAIRY PRODUCTS
Dairy upgrading would need to include the following key points:
Axis one: Identify the most promising eligible target markets and the local market segments for specific
dairy items. LIVCD can conduct needed market research and analysis in target markets such as UAE,
KSA, Iraq, Jordan, Kuwait, as well as the Lebanese market. This work will identify which of the markets
are significant importers of dairy products, specifically cheese and labneh products, their market trends,
the existing products on the market and the brands behind them, the prevailing distribution channels, the
selling prices, and applicable regulatory and religious conditions. This work will be used to select
specific market links and distribution channels most suitable for the relevant types of dairy products.
LIVCD can also help to educate consumers in GCC on the difference between Turkish labneh which
includes additives as opposed to additive-free Lebanese labneh.
Axis Two: Help a number of dairy farms to meet GLOBALG.A.P. standards. LIVCD will identify a list
of dairy farms that are active in the supply of exporting dairy processors and perform a quick assessment
of their compliance with GLOBALG.A.P. requirements. This will be used to establish an action plan that
will outline needed remedial actions to ensure that the committed farms are in compliance.
Axis Three: Develop a program to support HACCP and ISO 22000 implementation in small and medium
dairy processors. This will entail a quick assessment to establish a list of dairy processors who might be
eligible for implementation of a food safety program. LIVCD will then organize and implement a food
safety implementation program covering HACCP and ISO22000 with pre-assessment audits to
implementing companies prior to their applications for certification.
2.3 READY-TO-EAT MEALS
The LIVCD ready-to-eat meals upgrading plan will include the following axes:
Axis 1: Help Lebanese processors to overcome market access hurdles in regional markets. This action can
be completed by collaborating with processors, exporters and food distributors in the destination markets.
It will build upon on the reputation of Lebanese food products, as well as the potential development of a

PROCESSED FOODS VALUE CHAIN ASSESSMENT REPORT 49
range of food products capable of gaining market share in the Arab markets. Specific elements of this
axis include:
Market survey and analysis in the destination markets (UAE, KSA, and Iraq) to identify potential
products that can be provided by Lebanese processors with data on market size, trends,
competitive products, distribution channels, market links, cost of entry, price range, and technical
requirements;
Identification of potential Lebanese processors who can supply the identified market
opportunities with an assessment of their marketing strategies and technical gaps;
Product development work with local processors in order to establish a range of ready to eat
products to facilitate market penetration, create logistical synergy, and establish a unique selling
propositions compared to competitive products existing in the market;
Support for a selected number of processors in attending regional exhibitions to facilitate
promotion of the new range of ready to eat products.
Axis Two: Build a market presence in western markets using Lebanese diaspora as a leverage point.
LIVCD will collect market data on potential ready to eat meal products in the Middle Eastern or
Mediterranean food segments in the destination countries through desk research and contacts with actual
distributors of Lebanese products in those countries. This will be augmented with the use of local experts
in specialty markets. Next LIVCD will work with several processors in the selection and development of
a range of food products having potential in those markets and in helping them to devise a market entry
strategy. Selected processors will be supported in attending regional exhibitions with a specific target to
promote the newly developed range of ready to eat products.
Axis Three: Promote compliance with food safety standards. LIVCD will provide consultancy and
possibly support for the auditing of food companies hoping to export to allow them to supply
international markets. LIVCD will also help public sector organizations, NGOs and other local
organizations in fulfilling the minimal requirements for Lebanon to adhere to the list of approved exports
of some or all animal origin products.
Axis Four: Promote collaboration between industrial entities and cooperatives for the production of ready
to eat food products. In collaboration with local processors and based on market research, LIVCD will
select the specific ready to eat products that appear to be unfit for industrial scale production due to the
need of intensive labor or because of limited quantity. We will then visit and select a number of rural
cooperatives that can, and are willing to, produce these items. These cooperatives will then be linked
with processors and exporters. LIVCD will provide continued technical support to the cooperatives in the
areas of product development, food safety and quality assurance, production and quality assurance, and
marketing.
Axis Five: Accompany SLFI and ready to eat processors in the elaboration of a global ready to eat
marketing strategy. This will be an important promotional tool for use in GCC and Western countries
that will leverage the favorable market image of Lebanese cuisine. LIVCD will work with an ad-hoc
working group including processors, food experts, exporters, and LIVCD staff to identify approaches for
promoting ready to eat food outside of Lebanon. Two strategy documents will be prepared, one for
regional markets and another for Western markets. These will be used to develop action plans that will
help to mobilize support from other possible sources of funding—including SLFI members themselves.

PROCESSED FOODS VALUE CHAIN ASSESSMENT REPORT 50
ANNEX A: CLASSIFICATION METHODOLOGY
Two broad systems exist that can be used to classify processed foods. The International Standard
Industrial Classification of All Economic Activities (ISIC) consists of a coherent and consistent
classification structure of economic activities developed by the United Nations. It is most commonly used
in national accounts. The Harmonized Commodity Description and Coding System (HS) provides a
similar classification that was developed by the World Customs Organization mainly to categorize
products for international trade. LIVCD was faced with a problem since it did not have access to ISIC
data on output at the four digit level from the national accounts and HS data at the four digit level on
imports and exports from the TRADEMAP international data base. The analysis used in this report which
combined both these data sources meant that the team had to complete its own classifying mapping
exercises in which the four digit HS codes for processed foods were all attributed to a specific four digit
ISIC code category, thereby permitting a unified analysis. The key used for this exercise is given below
for the highest ranked ISIC codes of the phase one selection process.

PROCESSED FOODS VALUE CHAIN ASSESSMENT REPORT 51
ANNEX B: FOOD PROCESSING COOPERATIVES
Women’s food processing cooperatives - Mapping & analysis
Following is a preliminary study that aims at evaluating the actual condition of women food
processing cooperatives across rural areas and identifying the challenges that these working
women currently face as well as possible opportunities and areas of improvement.
1. Overview
- There are around 100 cooperatives involved in food processing activities; these include
both women only as well as mixed gender cooperatives.

PROCESSED FOODS VALUE CHAIN ASSESSMENT REPORT 52
- These cooperatives employ a total of nearly 1,000 women and are distributed across all
Lebanese rural areas (For a detailed list of these cooperatives, refer to Annex I of the
report).
FIGURE 12: GEOGRAPHIC DISTRIBUTION OF ACTIVE PROCESSED FOODS COOPERATIVES IN LEBANON
- Coops are mainly composed of 12 members on average, while only 10 percent include more than
20 members.
- The foods produced by these cooperatives are mostly traditional Lebanese foods ‘Mouneh’ and
include mainly: jams, syrups, pickles, food preserved in oil, molasses, labneh, dry food, and herb
products. (For a full list of foods produced refer to Annex II of the report).
- Cooperatives differ in their structure and operation. Some cooperatives have an advanced set-up
and apply technology in their production while others have more rudimentary production
facilities.
- The majority of cooperatives have received various levels of funding from local and international
donor organizations; with the most prominent donors being USAID and UNDP. Aid has been
centered on the provision of equipment and infrastructure as well as capacity building. Trainings
have mainly focused on the following areas: food processing, small business management, quality
control procedures and market linkages. Additionally, USAID programs have equipped the
chambers of commerce in all Lebanese areas with the equipment necessary for quality control
checks and testing of food products. This has allowed coops to better meet quality standards in
both local and international markets.
2. Challenges
In addition to the common challenges mentioned in the first section of this report that are faced by types
of cooperatives in Lebanon, there are additional challenges which are specific to food processing
cooperatives:
Bekaa, 31
Mount Lebanon, 6
North, 20
South, 8
Nabatieh, 22

PROCESSED FOODS VALUE CHAIN ASSESSMENT REPORT 53
- High cost of agricultural inputs due to dependence on the local agricultural sector | There is a
much closer link between food processing cooperatives and the agricultural sector than with the
big food processing enterprises in the country which might at times depend on imported raw
material. Cooperatives typically process fruits and vegetables that are indigenous to their area.
This therefore renders food processing cooperatives dependent on the local agricultural sector. In
its turn, the agricultural sector in Lebanon suffers from high labor costs and from the state of the
infrastructure (transport, irrigation) which raises costs even higher. Imported fruits and vegetables
are cheaper than locally produced ones, and even though they are not for the most part better in
quality; they are suitable for food processing. This gives an advantage to food industrial
companies that typically buy in bulk and have easy access to wholesale markets where imported
produce is sold. Since coops typically rely on Fruits and Vegetables produced in their villages or
surrounding villages that tend to be higher in cost; this along with other factors such as economy
of scale in processing, puts coops at a cost disadvantage relative to industrial processors or
foreign processors.
- Volatile Sales | The primary limiting factor in the cooperatives’ production volume is not
production capacity but assured sales.
- Access to Finance | Capital is a secondary limiting factor: due to limited availability of capital to
finance the purchase of raw materials, cooperatives tend to produce as close to demand levels as
possible. Therefore, had overall sales reached their targeted levels, it is thought that production
volumes and efficiencies would have expanded to meet demand.
3. Production process
Pursuant to an assessment of their operations, Food Processing cooperatives can be classified into three
categories relative to their stage of development: Unacceptable, Acceptable or Advanced. This
categorization depends on their manufacturing practices, facilities and personnel know how.

PROCESSED FOODS VALUE CHAIN ASSESSMENT REPORT 54
Stage Common Characteristics Areas of Improvement U
na
cce
pta
ble
Members produce individually in their houses
Coop either doesn’t have a centre and proper equipment or the location is not suitable for food production. (E.g. Members might use a room in the house of one of cooperative members for production)
Poor knowledge and understanding of good manufacturing and hygiene practices
Low experience in administrative or managerial matters such as accounting, marketing, bookkeeping and sales… Very poor information technology knowledge
Inconsistency in the quality and physical appearance of the product
Provide Training and capacity building to develop members’ technical and managerial skills including food processing, costing, accounting and bookkeeping…
Develop the products technical specifications in order to cater to the minimum required local standards while maintaining and preserving their traditional aspect
Provide rehabilitation assistance to improve the production centre/location and provide basic infrastructure to attain minimal food safety standards
Provide the minimal required tools and equipment to improve production and adhere by food safety standards
Assist in improving products in terms of appearance especially with regard to the product itself (colour and consistency for instance), its container and its label.
Accep
table
Cooperative owns an equipped production centre or location with acceptable production and hygiene conditions. women members are trained on food processing and management but might need refresher training
Production quality is acceptable but requires a more scientific, clean, and hygienic production process
Maintain the building’s infrastructure.
Maintain and repair tools and equipment
Provide specialized tools equipment and vehicles to improve production and adherence to food safety standards
Assist in uplifting products in terms of packaging and display
Train women on adapting GMP GHP and HACCP standards to improve production
Ad
va
nce
d
Coop owns a well-designed and equipped production centre
Women highly trained and produce premium products.
This group might benefit from a recognizable quality seal to strengthen its brand image and reflect quality and product consistency
Additional training should be provided to secure and maintain compliance standards especially that new additional requirements recently imposed by the EU and US which should be adopted and implemented.
Purchase of specialized equipment and vehicles
Further improvement of the Brand Name and Packaging of Products
4. Finances and member benefits
Not all cooperatives provide a monthly salary for their workers. However, in the cases were the coop
actually provides remuneration, the average monthly wage per worker amounts to approximately USD
110 (based on an approximation of annual income exclusively for cooperatives which pay their workers);
some cooperatives workers earn over $150 per month. Although this figure may seem low, in rural areas
it is usually enough for women to help them cover school tuitions in public schools, monthly heating bills,
and the purchase of basic food items. This therefore greatly contributes to the empowerment and financial
autonomy of women in their households.
TABLE 8: RELATIVE CONTRIBUTION OF WOMEN’S INCOME TO HOUSEHOLD INCOME IN RURAL AREAS
Monthly remuneration
Impact on household conditions Use of income
USD 75/ month Small contribution to household income Doctor and Dentist fees
Basic furniture and carpets

PROCESSED FOODS VALUE CHAIN ASSESSMENT REPORT 55
USD 100/ month Medium contribution to household income Children’s school and bus transportation fees & clothing
USD 150/ month
& above
Significant contribution to household
income
Women considered as breadwinners in their households & now cover most utility costs, medical bills, and food items.
Source: YMCA
It is to be noted that coop members are in fact entitled to a distribution of surplus earnings in proportion
with the number of shares they own in the coop. Most commonly however, this distribution of earnings
has not taken place, but rather members have been treated in the same manner as workers and are often
compensated for their work by the hour or on a monthly or seasonal basis.
Despite the irregularity of personal income generated from coop work, some women opt to continue their
work within the coop for a variety of reasons:
- They believe that although they may not earn income on the short run, their work will eventually
be profitable on the long run
- They have a feeling of ownership and responsibility towards their business and are therefore
willing to work without immediate compensation.
- They feel a sense of pride and earn a social role within their communities due to their work
- Work in the cooperatives widens their scope from being limited to raising their children and
doing household chores. It gives them an opportunity of being productive outside their house and
having a higher sense of worth.
In regards to financial reporting; the majority of the coops have proper documents for financial and
accounting transactions such as invoices, receipts and payment orders. However, 45% of the coops do not
have or maintain a current register book of transactions (income and expenses). This register is the
official cooperative document required yearly by the Cooperative directorate at the Ministry of
Agriculture. Several coop members explain that there is no need to maintain such official documentation
since there is no real daily financial activity.
5. Market access & linkages
At the local level, cooperatives sell their products through the following points of sale:
- Directly from the centre or coop
- Through social networks in their respective villages, in Beirut, and sometimes abroad
- Local shops belonging to families of members
- Small shops throughout region
- Supermarkets in regional urban centres
- Exhibitions
- Local hotels, restaurants, and country clubs
- Local wedding centres
- Cafeterias in local private schools
- Community dinners
Some distribute through other channels like Fair Trade (Terroirs du Liban) Rural Delights Cooperative
(Atayeb Al Rif), Namlieh (CRTDA), Caritas (Intajouna) and Mafco. Other coops also create distribution

PROCESSED FOODS VALUE CHAIN ASSESSMENT REPORT 56
channels through friends and relatives abroad, like Canada (as is the case with Ain Al Arish Cooperative),
USA, EU and Gulf countries.
Most cooperatives sell their products to the markets through the following means:
- Under the brand name of the cooperative or under private label.
- By bulk
- By setting up small catering services
- Through cooperation with agro food enterprises in the processing of special products (stuffing
grape leaves for conservation as a ready meal)
Recommendations
- Following ways to benchmark the product and monitor the market, adoption of sound marketing
standards and necessary certifications to cater to export needs, sales requirements and market
demands;
- Develop new products;
- Reduce of cost through more efficient processing and better management of the supply chain;
- Focus on high added-value products that industrial companies cannot compete with
- Improve quality and meet food safety standards, without getting certification of compliance if it is
not needed.
- Secure manufacturing contracts with processors for items that are labor intensive that processors
avoid
- Improve label design in order to improve the product presentation and better meet international
labeling requirements ;
- Improve handling customer relations.
Key success factors - Ten essentials for successful women food processing cooperatives
The following factors are common characteristics that lead to high-performing and high capacity
cooperatives:
1| The cooperative has sufficient working capital to purchase bulk raw materials;
2| The cooperative has more than one cycle of production per year, regardless of the local agricultural
seasons;
3| The cooperative has several years of production and operational/management experience;
4| The cooperative has a strong leader. She is both a manager and a social leader
5| The cooperative’s members have received training (institutional and technical training);
6| The cooperative’s members are outgoing and mobile and therefore able to make contacts and
cultivate linkages outside of their immediate area of operations and relations;
7| The cooperative is fully independent;
8| The cooperative sells related services, such as event or institutional catering and fee-based processing
of local farmers’ produce, services in which they have a comparative advantage due to ownership of
the production center and advanced equipment;

PROCESSED FOODS VALUE CHAIN ASSESSMENT REPORT 57
9| The cooperative has the financial and technical support of the municipality as well as strong support
from the community as a whole;
10| The cooperative actively solicits and develops support from a range of sources, including
municipalities, government representatives, community-based and religious-based organizations,
NGOs, foundations, etc.;
Recommendations and future actions
The mapping exercise above, together with the account on current challenges, allow us to identify areas of
improvement within the work of Lebanese coops.
Below are the main areas whereby the LIVCD project can assist Lebanese Coops and help boost their
performance:
- Nurturing this natural proclivity to food processing and adding value through improved scientific
practices in quality standards, processing, marketing, branding, and information and
communication technology.
- Promoting partnerships through the active participation by women producers, farmers,
community leaders and local governments (municipalities). Encouraging local actors to provide
financial and in- kind contributions and moral support to the program.
- Mobilizing local partners, coops, women groups and farmers, and strategic alliances to provide
value-added.
- Creating linkages between cooperatives and the market; locally and abroad to ensure that the
products meet consumer demands in terms of quantity and quality.
- Creating linkages between the cooperatives and industrial food processors with the objective of
having cooperatives reach a supply agreement with processors.
- Increasing supply of locally procured fruits and vegetables through linkages to farmers and
improving farmers’ output.
- Creating links between the municipalities and the local women cooperatives and groups to
encourage local governments to be more actively engaged and economically involved in the
development of their respective communities.
- Building on the successes and lessons learned from previous projects to design complementary
activities and avoid duplication of work.
References and useful documents on Lebanese cooperatives:
(8002التعاونّية في لبنان )دليل الجمعّيات -
- Directory of cooperatives in Lebanon (2008)
- Rural Women Producers and Cooperatives in Conflicts Settings in the Arab States; Simel Esim
and Mansour Omeira , International Labour Organization, Regional Office for the Arab States,
Lebanon
- Stimulating Markets and Rural Transformation Program (SMART) USAID-YMCA Lebanon
(2005)
The cooperative law of 1964 (amended in 1972)

PROCESSED FOODS VALUE CHAIN ASSESSMENT REPORT 58
The law defines cooperatives as non-profit organizations whose objective is to improve the
socioeconomic conditions of its members through cooperation between them toward a common objective.
No more than one cooperative with the same purpose can be established in the same village, if its
population is less than 20,000. A cooperative should be composed of at least ten people.
A cooperative is governed by an executive board (مجلس ادارة). The Ministry of Agriculture is responsible
for registering, assisting, and monitoring all cooperatives in Lebanon, through a Cooperatives Department
within the Ministry. The registration process entails that the cooperative submits an application to the
Cooperative Department. This should include the name and signature of members, the name of the
cooperative, its objectives, regional and sectorial scope, in addition to the profile of its founding members
and the number and value of its shares.
The Cooperative Department should come back with its decision within a period not exceeding two
months after the submission of the application. Upon approval, at least 2/3 of the signatories on that
application officially meet to ensure payment for shares, and vote for the board of directors (3-7
members) and the audit committee (3 members). Cooperatives are exempt from taxation including
municipal taxation (including electricity, water, construction license etc.), fees (including fees for
publishing in official bulletins, conducting lab exams in governmental institutions), indirect taxation
(cooperatives are exempt from 50 percent of fees to export products outside) and direct taxation (income
tax on profit of cooperative, tax on transfer of grants, tax on real estate owned by the cooperative). The
National Union for Cooperative Credit is mandated by law to regulate disbursement of credit to
cooperatives (It ceased to exist in the 90s). A citizen cannot be a member of two cooperatives with the
same objective.
Source: National Federation of Cooperatives (through ILO Office Beirut)
TABLE 9: FOOD PROCESSING COOPERATIVES IN LEBANON (WOMEN & MIXED)
1 Ain Atta عين اللوز-الجمعية التعاونية اإلنتاجية في عين عطا
2 Ayha تعاونية عيحا للمنتوجات القروية
3 Al Ileik-Baalbeck الجمعية التعاونية اللبنانية الحرفية والتصنيع الزراعي والحرفي في العالق وجوارها"أصالةالريف"م.م
4 Baalbek الجمعية التعاونية إلنتاج المواد الغذائية في مدينة بعلبك والجوار م.م
5 Bednayel الجمعية التعاونية اإلنتاجية "زادت الخيرات" في بدنايلم.م
6 Chmesttar الجمعية التعاونية لتقطير ماء وزيوت الورد في شمسطارم.م
7 Deir el Ahmar جنى -الجمعية التعاونية لتصنيع المنتجات الزراعية في دير األحمر
األيادي
8 El Ain صحتين" -جمعية تعاونية الشابات الريفيات"
9 Fakiha البقاع -الفاكهة "طيبات"الجمعية التعاونية اإلنمائية
10 Fourzol الجمعية التعاونية اإلنتاجية للمرأة الريفية
11 Ham الجمعية التعاونية اإلنتاجية لبلدة حام وجوارها

PROCESSED FOODS VALUE CHAIN ASSESSMENT REPORT 59
12 Hermel الجمعية التعاونية"الروايي"لتصنيع وتسويق اإلنتاج المحلي في قرى قضاء الهرمل م.م
13 Hermel للمواد الغذائية"األمل"م.مالجمعية التعاونية اإلنتاجية
14 Hermel الجمعة التعاونية إلنتاج الصناعات الغذائية"السنديان"م.م
15 Hermel الجمعية التعاونية اإلنتاجية في الهرمل"جبالنا"م.م
16 Hermel )الجمعية التعاونية اإلنتاجية في الهرمل )حي العسري
17 Hosh Al Oumara-Zahleh للتصنيع الغذائي في حوش األمراء "خيرات الجمعية التعاونية السهل"م.م
18 Irsal المونة الريفية" في عرسالم.مالجمعية التعاونية"
19 Jdita جديتا -الجمعية التعاونية اإلنتاجية عين الوردة
20 Kawkaba –Rachaya الجمعية التعاونية إلنماء القطاع الزراعي في كوكبا وجوارهل
21 Khirbet Kanafar السنديانة"خربة قنافار -الجمعية التعاونية الحرفية"
22 Ksarnaba الجمعية التعاونية اإلنتاجية في قصرنبا "خيرات البقاع" م.م
23 Mansourah الجمعية التعاونية الزراعية لتصنيع اإلنتاج وتصريفه في المنصورة وجوارها "زوادة البيدر" م.م
24 Mhaydseh التعاونية اإلنتاجية "نجمة الصبح" في المحيدثةم.ملجمعية ا
25 Moualka-Zahleh الجمعية التعاونية اإلنتاجية في المعلقة وجوارها"أميرةالطبيعة"م.م
26 Rchaya Al Wadi الجمعية التعاونية النسائية للتصنيع الزراعي "وادي التيم"م.م
27 RasBaalbeck-Jabbouleh الجمعية التعاونية للتنمية وتصنيع اإلنتاج الزراعي"سهولنا"م.م في البقاع الشمالي
28 Riyak الجمعية التعاونية لإلنتاج والتنمية "الريف"م.م
29 Tarayya-Baalbeck الجمعية التعاونية للتصنيع الغذائي والحرف "المواسم" م.م
30 Wadi el Arayesh وادي العرايش -الجمعية التعاونية لتصنيع اإلنتاج الزراعي وتعليبه
31 Zahleh الجمعية التعاونية لتصنيع المنتجات الزراعية وتسويقها "شغل البيت"م.م
Bekaa
32 Baskinta الجمعية التعازنية النسائية لتصنيع اإلنتاج الزراعي واألشغال اليدوية في بسنتا
33 Bater جنى البساتين"الجمعية التعاونية الزراعية اإلنتاجية"
34 Kartaba مزايا" -الجمعية التعاونية الزراعية اإلنتاجية في قرطبا"
35 Kfardebian األطايب"الجمعية التعاونية لسيدات كفردبيان"

PROCESSED FOODS VALUE CHAIN ASSESSMENT REPORT 60
36 Lehfed "الجمعية التعاونية اإلنتاجية الزراعية لسيدات لحفد "حفد الخضراء
37 Mayrouba مواسمنا"ميروبا -الجمعية التعاونية الزراعية اإلنتاجية"
Mount Lebanon
38 AinYaaccoub عكار -الجمعية التعاونية الزراعية التصنيعية للسيدات في عين يعقوب م.م
39 Akkar Al Atika الجمعية التعاونية لتصنبع المنتجات الزراعية في عكار العتيقة م.م
40 Amayyer village-Wadi
Khaled
وادي -الجمعية التعاونية للتنمية الريفية والتصنيع الزراعي في العماير عكار م.م-خالد
41 Andaket الجمعية التعاونية عندقيت للتنمية والتصنيعAndaket Pro – عكار م.م
42 Assia الجمعية التعاونية آسيا للنباتات العطرية م.م
43 Bebnine الجمعية التعاونية الزراعية اإلنتاجية التصنيعية لسيدات ببنين وجوارها م.م
44 Beit el Fakess الجمعية التعاونية لإلنماء الريفي في الضنيهم.م
45 BeitShelala الجمعية التعاونية لتصنيع اإلنتاج الزراعي
"الشالل"كفرحلدا -والحيواني في بساتين العصي
46 Bhanine-Minieh المنية م.م-الجمعية التعاونية اإلنتاجية للسيدات في بلدة بحنين
47 Fneydek الجمعية التعاونية لتصنيع اإلنتاج الزراعي في فنيدق
48 Hazouk الجمعية التعاونية النسائية لتصنيع اإلنتاج الزراعي في حيزوق ظ عكار م.م
49 Hilane-Zghorta للسيدات في حيالن ظ زغرتا م.مالجمعية التعاونية اإلنتاجية
50 Jdeydet el Qayteh الجمعية العاونية الزراعي لسيدات جديدة القيطع
51 MachtaHamoud الجمعية التعاونية اإلنتاجية النسائية في مشتى حمود ظ عكار م.م
52 Mechmech الجمعية التعاونية النسائية لتطوير وتصنيع المنتجات الزراعية في عكار م.ممشمش
53 Rahbeh الجمعية التعاونّية النسائّية اإلنتاجّية في رحبة عكار م.م
54 Tannourine "الجمعية التعاونية لتصنيع المنتجات الزراعية في تنورين" المحمية
55 Tekrit األرض الطّيبة"الجمعية التعاونية الزراعية في تكريت"
56 Wdi Al Jamous عكار م.م -الجمعية التعاونية اإلنتاجية للسيدات في وادي الجاموس
57 Zghorta الجمعية التعاونية التصنيعية لسيدات زغرتا
North

PROCESSED FOODS VALUE CHAIN ASSESSMENT REPORT 61
58 BorjRahal الجمعية التعاونية النسائية للتنمية والتصنيع الزراعي في برج رحال والجوار م.م
59 Chehabiyeh الجمعيةالتعاونيةلإلنتاجوالتصنيعالزراعّيفيالشهابية
60 DeirQanoun el Naher الجمعية التعاونية إلنتاج وتصنيع المواد الغذائيةفي دير قانون النهر"
"جدتي
61 Deir Qanoun Ras el Ain الجمعية التعاونية للتصنيع واإلنتاج الزراعي في دير قانون رأس العين
”مواسم الضيعة“
62 Dhaira الجمعية التعاونية لإلنتاج والتصنيع الزراعي في الضهيرة
63 Halloussiyeh الجمعيةالتعاونيةالزراعّيةفيالحلوسّية
64 HaretSaida الجمعيةالتعاونيةلتصنيعوتسويقالمنتجاتالزراعيةفيحارةصيدا
65 Yarine الجمعية التعاونية لإلنتاج والتصنيع الزراعي في يارينم.م
South
66 Adshit الجمعيةالتعاونيةالزراعّيةاإلنتاجّيةفيعدشيت
67 AinEbel الجمعية التعاونية الزراعية لإلنتاج والتصنيع الغذائي في عين إبل
68 Aita Al Chaab الجمعية التعاونية الزراعية لتطوير قدرات المرأة في اإلنتاج والتسويق في بنت جبيل
69 Aitaroun الجمعّيةالتعاونّيةلإلنتاجوالتسويقالزراعّيوالحرفيفيعيترون
70 Arabsalim زوادة "الجمعية التعاونية لإلنتاج والتصنيع الزراعي في عربصاليم "الضيعة
71 Arabsalim فيعربصاليم العامة التعاونيةالزراعّية
72 Aramta عرمتى"الجمعية التعاونية للتصنيع الزراعي في عرمتىم.م "خيرات
73 Arnoun منتجات المرأة "أرنون -الجمعية التعاونية النسائية للتنمية الريفية "الريفية
74 BintJbeil الجمعّية الحرفّيةللخياطةوالتطريزوالحياكة
)تّم تعديل نظامها األساسي لتصبح إنتاجية أيضاً(
75 Chakra قلعة دبى"الجمعية التعاونية اإلنتناجية للتصنيع الزراعي في شقرا"
76 Debel الجمعية التعاونية اإلنتاجية في دبل
77 Ebel el Saki غلّة "الجمعية التعاونية اإلنمائية للتصنيع الغذائي في ابل السقي "المواسم
78 Kfarkila
الجمعيةالتعاونيةللتنميةالزراعيةوالثروةالحيوانيةفيكفركال

PROCESSED FOODS VALUE CHAIN ASSESSMENT REPORT 62
79 Hariss الجمعية التعاونية للغذاء الريفي في حاريص
80 Hasbaya الجمعية التعاونية التصنيعية الزراعية والحرفية لسيدات حاصبيا م.م
81 Jba’a الجمعية التعاونية للتصنيع الغذائي والزراعي والحرفي في جباع
82 Kfarsyr مرج النبعة -تعاونية اإلنتاج والتصنيع الزراعي في كفرصير
83 Khelwat مجموعة إتاجية تابعة لجمعية نور
84 Ksaybeh ريفيات"القصيبة -الجمعية التعاونية لتصنيع المنتجات الزراعية"
85 Mayfadun الجمعّيةالتعاونّيةإلنتاجوتسويقخيراتالريفاللبنانيفيميفدون
86 Mays Al J abal الجمعية التعاونية لإلنتاج والتصنيع الزراعي في ميس لجبل م.م
87 Yohmor الجمعيةالتعاونيةالزراعّيةفييحمروجوارها
Nabatieh
88 Rural Delight الجمعية التعاونية إلنتاج وتصنيع وتصريف المواد الغذائية "أطايب الريف" م.م
TABLE 10: LIST OF PRODUCTS BY REGIONS AND COOPS OF SPECIALTY
List Of Products Region of Specialty Coop of Specialty
DRY GOODS
Cracked Wheat/Coarse Brown Bekaa-Nabatieh Hariss
Cracked Wheat/Fine Brown Bekaa-Nabatieh Hariss
Freekeh Nabatieh-South Hariss-BintJbeil
Salty Grilled Wheat Bekaa Mouhaydseh
Kishk/Cow Milk Bekaa Deir Al Ahmar
Kishk/Goat Milk Bekaa Aita al foukkar
Pine Kernels Mount Lebanon-South Aramta
Vine Leaves (in vacuum) Bekaa Fouzol
DISTILLED WATERS
Mint water All over lebanon
Orange Blossom Water South-North(Coast)
Rose Water Bekaa-Mount Lebanon
Rosemary water All over lebanon
Sage Water South-North

PROCESSED FOODS VALUE CHAIN ASSESSMENT REPORT 63
Thyme water South-North-Mount Lebanon
DRIED FRUIT
Apple Bites North-Mount Lebanon Kfardebian
Prune Roll-ups Mount Lebanon Kfardebian
Raisins Bekaa Deir Al AhmarAita
al foukkar
Sweetened Orange Peel South-North Bater
COOKED FOOD
Artichoke In Brine Bekaa Forzol
Green Beans In Brine Bekaa
Green Beans/Okra Preserved In Tomato
Sauce Bekaa
Lebanese Mousakaa (ready to eat)
Pickled Eggplant with Spicy Filling
(Makdous) Bekaa
Spicy Green Beans (ready to eat) All over lebanon
Stuffed Vine Leaves (ready to eat) All over lebanon
Vine Leaves In Brine Bekaa Forzol
HERBS
Aniseed Bekaa
Basil All over lebanon
Camomile Mount Lebanon
Flavouring Mix Nabatieh-South BintJbeil
Hyssop Mount Lebanon
Laurel Leaves Nabatieh-South
Lebanese Tisane Nabatieh-South-Mount
Lebanon
Mint All over lebanon
Oregano Nabatieh-South
Rosemary All over lebanon
Sage All over lebanon>500m
Sumac All over lebanon
Zaatar Mix (Oregano, Sumac, Sesame) Nabatieh-South Haiss
HONEY
Honey / Mountain Nabatieh-South-North-Mount
Lebanon
Honey / Oak Nabatieh-South-North-Mount
Lebanon

PROCESSED FOODS VALUE CHAIN ASSESSMENT REPORT 64
Honey / Spring Nabatieh-South-North-Mount
Lebanon
JAMS
Apple Jam Mount Lebanon-North
Apricot Jam Bekaa Deir Al Ahmar
Cherry Jam Bekaa
Dried Fig Jam Bekaa-Nabatieh-Exported Deir Al Ahmar
Fresh Fig Jam Bekaa-Nabatieh
Grated Pumpkin Jam Bekaa-South
Mulberry Jam Mount Lebanon-Bekaa Deir Al Ahmar
Orange Blossom Jam South-North(Coast)
Peach Jam Mount Lebanon-North
Pear Jam Mount Lebanon-North
Prune Jam Mount Lebanon
Quince Jam Mount Lebanon-North
Quince Jelly Mount Lebanon-North
Raspberry Jam Bekaa KhorbetAnnafar
Rose Petal Jam Bekaa-Mount Lebanon
Strawberry Jam All over Lebanon
DAIRY PRODUCTS
Labneh from Goat milk in Olive Oil Bekaa Aita al foukkar
Green Kishk In Olive Oil Bekaa Aita al foukkar
Shanklish from Goat Milk in Olive Oil North BeitChlala
MOLASSES
Carob Molasses South AinEbel
Grape Molasses Bekaa
Pomegranate Molasses North Tekrit-Hayzouk
Whipped Grape Molasses Bekaa
OLIVE OIL
Extra virgin Olive Oil North-South-Nabatieh
OLIVES
Green Olives Filled with Almonds in Oil North
Green Olives Filled with Labneh in Oil North
Green Olives Filled with Red Pepper in Oil North
Green Olives Preserved in Brine North-South-Nabatieh

PROCESSED FOODS VALUE CHAIN ASSESSMENT REPORT 65
Green Olives Preserved in oil and lemon
juice North-South-Nabatieh
Green Olives with Thyme in Oil North
PICKLES
Mixed Pickles Bekaa
Pickled Cucumber Bekaa
Pickled Eggplant Bekaa
Pickled Green Tomato Bekaa
Pickled Wild Cucumber Bekaa
PRESERVES
Apricot Halves in Light Syrup Bekaa
Bitter Orange Peel Cooked and Preserved in
Syrup South-North(Coast) Ksaybeh
Dates Filled with Roasted Almonds Cooked
and Preserved in Syrup South -Exported
Fruits(Cocktail)in Light Syrup Mount Lebanon
Peach Halves in Light Syrup Mount Lebanon-North Kfardebian
Pear Halves in Light Syrup Mount Lebanon-North
Pumpkin Pieces Cooked and Preserved in
Syrup 400g Bekaa-South
Whole Apples Filled with Roasted Almonds
preserved in Syrup 400g Mount Lebanon-North Kfardebian
Whole Eggplants Filled with Roasted
Almonds Preserved in Syrup 400g Bekaa
Whole Figs Cooked and Preserved in Syrup
400g Bekaa-Nabatieh Jditta
Whole Mulberry preserved in mulberry juice Mount Lebanon-North Beit Al Fakess
SAUCES/PASTES
Hot Sauce North-Nabatieh Hariss-BintJbeil
Mild Sauce North-Nabatieh Hariss-BintJbeil
Sun-Dried Tomato Bekaa Irsal
Tomato Paste Mount Lebanon-Bekaa-
Coast(Green House)
Tomato Sauce with Spices Mount Lebanon-Bekaa-
Coast(Green House)
SOAP
Laurel Soap (1Piece ~100g) Nabatieh
Olive Oil Soap (1Piece ~160g) Nabatieh-South-North
SYRUPS
Apricot Syrup Bekaa
Bitter Orange Syrup South-North(Coast)

PROCESSED FOODS VALUE CHAIN ASSESSMENT REPORT 66
Citrus Syrup South-North(Coast)
Mulberry Syrup Mount Lebanon-Bekaa
Rose Syrup Bekaa-Mount Lebanon
VINEGAR
Apple Vinegar Mount Lebanon-North Kfardebian
Concentrated Sour Grape Bekaa-Mount Lebanon Fourzol-Kfardebian
Grape Vinegar Bekaa
COOKIES/BISCUITS
Biscuits cooked with Carob Molasses South AinEbel
Salty Sesame Biscuits South Deir Qanon Ras Al
Ain
Sweet Aniseed Cookies South-Nabatieh Deir Qanon Ras Al
Ain-Arab Salim
Thyme Biscuits South-Nabatieh
* Cooperatives selected based on three major criteria:
o Active Cooperative
o with regular production
o Hygienic location
o Fully equipped
o Range of products (more than 10)

PROCESSED FOODS VALUE CHAIN ASSESSMENT REPORT 67
ANNEX C: LIST OF DONORS & NGO’S THAT SUPPORTED COOPERATIVES ACROSS ALL LEBANESE RURAL AREAS
ACDI/VOCA
ACS - Al-Shouf Cedar Society
ADR - Association for the Development of Rural Capacities
AEC - Arc En Ciel
AEP - Professional Mutual Aid Association
AFDC - Association for Forest Development & Conservation
Agence Espagnole de Cooperation Internationale et de development (AECID)
Agence Francaise de Developpement AFD
AL-MAJMOUA - Lebanese Association for Development
AMEL - Amel Association International
AMIDEAST - America-Mideast Educational &Training Services Inc.
AMWAJ - "AMWAJ" of the Environment
ANERA - American Near East Refugee Aid
Australian Agency for International Development AusAID
C/L - Caritas Lebanon
Canadian International Development Agency CIDA
CD - Cooperation for Development
Centre Technologie ForestalDeCatalunya(CTFC)
Council for Development and Reconstruction (CDR)
CRS - Catholic Relief Services
CRTD.A - Collective for Research & Training on Development - Action
DPNA - Development for People and Nature Assoc.
DRC - Danish Refugee Council
Embassies (Amercan-Italian-Mexican-Austalian-Japanese-German…)
European Union
FES - Friedrich - Ebert - Stiftung
FF - Fares Foundation
HF - Hariri Foundation
ISF - Imam Al-Sadr Foundation
JBDA - Jihad Al Binaa Foundation for Development
LDN - Lebanese Development Network
MECC - Middle East Council of Churches
MECTAT - Middle East Centre for the Transfer of Appropriate Technology
MF - Makhzoumi Foundation
Middle East Partttnership Initiative (MEPI )
MSL - Mouvement Social Libanais

PROCESSED FOODS VALUE CHAIN ASSESSMENT REPORT 68
PM - Pontifical Mission
RMF - Rene Moawad Foundation
SC/ - Save the Children Federation
SF - Safadi Foundation
Sherri Blair Foundation
Swedish International Development Cooperation Agency SIDA
Swiss Agency for Development and Co-operation SDC
United Nations :IFAD-UNDP-FAO-UNIFIL-UNV
USAID
World Bank
WRF - World Rehabilitation Fund, Inc.
WVL - World Vision Lebanon
YMCA - Young Men's Christian Association
ANNEX D: TOP 12 COOPERATIVES WITH THE MOST POTENTIAL AND READINESS FOR DEVELOPMENT
# Location Type Official Name of Cooperative in Arabic
1 Deir el Ahmar Women
coop
-الجمعية التعاونية لتصنيع المنتجات الزراعية في دير األحمر جنى األيادي
2 Fourzol Women
coop الجمعية التعاونية اإلنتاجية للمرأة الريفية
3 Mhaydseh Mixed
coop
وادي -الجمعية التعاونية لتصنيع اإلنتاج الزراعي وتعليبه العرايش
4 Aita Al Fokhar Women
coop الجمعية التعاونية لتصنيع المنتجات الزراعية -عين العريش
في عيتا الفخار
Bekaa Total 4
5 Bater Women
coop الجمعية التعاونية الزراعية اإلنتاجية -جنى البساتين
6 Kfardebian Women
coop الجمعية التعاونية لسيدات كفردبيان-األطايب
7 Lehfed Women
coop الجمعية التعاونية اإلنتاجية الزراعية لسيدات -لحفد الخضراء
لحفد
Mount Lebanon Total 3
8 Beit Shelala Women
coop الجمعية التعاونية لتصنيع اإلنتاج الزراعي
بساتين العصي والحيواني في "الشالل"كفرحلدا -
North Total 1
9 Deir Qanoun Ras el
Ain coop
الجمعية التعاونية للتصنيع واإلنتاج الزراعي -مواسم الضيعة في دير قانون رأس العين مواسم الضيعة
South Total 1

PROCESSED FOODS VALUE CHAIN ASSESSMENT REPORT 69
10 Arabsalim coop الجمعية التعاونية لإلنتاج والتصنيع الزراعي في
"زوادة الضيعة"عربصاليم
11 Hariss coop "الجمعية التعاونية للغذاء الريفي في حاريص"العماد
12 Kfarsyr coop مرج النبعة -تعاونية اإلنتاج والتصنيع الزراعي في كفرصير
Nabatiyeh Total 3
Total 12
ANNEX E: ANALYSIS OF OTHER PROCESSED FOODS
CHOCOLATE PRODUCTS
Chocolate products belong to ISIC class 1040.
Product Definition
It is the generic name for the homogenous products complying with the descriptions below. It is obtained
by an adequate manufacturing process from cocoa materials which may be combined with milk products,
sugars and/or sweeteners, and other additives
Chocolate (in some regions also named bittersweet chocolate, semi-sweet chocolate, dark chocolate or
“chocolat fondant”) shall contain, on a dry matter basis, not less than 35 percent total cocoa solids, of
which not less than 18 percent shall be cocoa butter and not less than 14 percent fat-free cocoa solids.
Sweet Chocolate shall contain, on a dry matter basis, not less than 30 percent total cocoa solids, of which
at least18 percent shall be cocoa butter and at least 12 percent fat-free cocoa solids.
Couverture Chocolate shall contain, on a dry matter basis, not less than 35 percent total cocoa solids of
which not less than 31 percent shall be cocoa butter and not less than 2.5 percent of fat-free cocoa solids.
Milk Chocolate shall contain, on a dry matter basis, not less than 25 percent cocoa solids (including a
minimum of2.5 percent fat-free cocoa solids) and a specified minimum of milk solids between 12 percent
and 14percent percent (including a minimum of milk fat between 2.5 percent and 3.5 percent). The
minimum content for milk solids and milk fat shall be applied by the authority having jurisdiction in
accordance with applicable legislation. "Milk solids" refers to the addition of milk ingredients in their
natural proportions, except that milk fat may be added, or removed.
“Gianduja” (or one of the derivatives of the word “Gianduja”) Chocolate is the product obtained, firstly,
from chocolate having a minimum total dry cocoa solids content of 32 percent, including a minimum dry
non-fat cocoa solids content of 8 percent, and, secondly, from finely ground hazelnuts such that the
product contains not less than 20 percent and not more than 40 percent of hazelnuts.
Chocolate types;
Filled Chocolate is a product covered by a coating of one or more of the Chocolates defined above, the
center of which is clearly distinct, through its composition, from the external coating. Filled Chocolate

PROCESSED FOODS VALUE CHAIN ASSESSMENT REPORT 70
does not include Flour Confectionery, Pastry, Biscuit or Ice Cream products. The chocolate part of the
coating must make up at least 25 percent of the total weight of the product concerned
A Chocolate or Praline designates the product in a single mouthful size, where the amount of the
chocolate component shall not be less than 25 percent of the total weight of the product. The product shall
consist of either filled chocolate or a single or combination of the chocolates
Compound chocolate Compound Chocolate also known as chocolate coating is a cocoa product
containing vegetable fats in the place of cocoa butter. The vegetable fats commonly used are often “hard”
fats or fats semi-solid at room temperature, such as coconut oil and palm kernel oil. One of the chief
benefits of compound chocolate is that it can deliver cocoa flavor at a greatly reduced cost, due to the fact
that vegetable fats are less expensive that cocoa butter. In most countries however compound chocolate
cannot be labeled as chocolate but rather chocolate flavored or chocolate like.
Chocolate is a large and important industrial sector in Lebanon mainly composed of small and medium
enterprises; the chocolate confectionary relies on the import of chocolate butter, cacao, cocoa butter, and
cocoa mass, just as most chocolate industries in the world rely on the import of cocoa bean ingredients.
The Lebanese industry is skilled in this segment and is specialized in both high commercial quality
praline chocolate rather than industrial mass production chocolate bars. There are over 9 medium sized
factories registered in the Association of Lebanese industrialists (ALI) and several others smaller
establishments and “traiteurs” who produce premium quality products. Some industrial establishments
have grown large and opened franchises in Lebanon and the region (about 140 in 35 countries).
Actors
Small and medium processors.
Suppliers of cocoa powder, cocoa butter, vegetable fats,
Markets
Suppliers for dried fruits, almonds, nuts.
Local distributors; wholesalers; processors/distributors/exporters.
Production and processing technology
The chocolate processing industry in Lebanon is composed of very small low investment producers
(almost artisanal) and medium sized industries relatively mechanized where a higher investment is
required; some of the medium size producers have established a vertically integrated set-up which
includes the production of marketing related accessories such as packaging ,silverware, outlets and so on.
There are basically two levels of production; those who start from prefabricated tablets, modify them and
remold the chocolate, and those who start form basic chocolate ingredients such as cocoa powder, cocoa
liquor and cocoa butter. The second type represents larger entities and more diversified producers.
The fabrication of chocolate starts with a mixing operation, fine grinding, conching, tempering and
molding. All these operations require a precise monitoring of temperatures as well as a high level of
hygiene.
The quality of the final product shall depend on the quality of ingredients used (which are imported), the
level of the equipment used (and this varies from factory to factory) and last but not least on the skills of
the producers and operators.

PROCESSED FOODS VALUE CHAIN ASSESSMENT REPORT 71
The added value on the final product shall depend on whether it I has a certain USP; this USP can be in its
presentation, or in its decoration or in its packaging or in its assortment and so on. This is where the skill
of the producer intervenes. History has shown, at least in the Lebanese market, that Lebanese producers
cannot compete in chocolate products with mass production tablets where strong international players
exist.
Compound chocolate on the other hand is gaining ground through the production of chocolate coatings
for cereal bars, ice cream and biscuits.
MARKETS
Domestic Market
The domestic market is highly served by local production in spite of the fact that Lebanon imports about
4300MT.
Export Market:
In 2011 Lebanon exported about 2,500 MT of certain types of chocolate products having a declared sales
value of about $18 Million. The growth of exports between 2008 and 2011 on chocolate items of all types
varied between 50 percent and 300 percent. Despite this, the industry is challenged by its high costs of
production, especially labor and energy costs. The major export destinations are GCC countries. (KSA,
Kuwait, Qatar, and Jordan).
Tariff Number
Decription
2011 Imp
Value (USD 000)
2008 Imp
Value (USD 000)
percent increase by value
(base 2008)
2011 Exp
Value (USD 000)
2008 Exp
Value (USD 000)
percent increase by value (base
2008)
1806 Sub sector: Cocoa and Chocolate products
63,651 49,127
30 percent
34959 19196
82 percent
18.06.10.00 Cocoa Powder (Containing Added Sugar or Other Sweetening Matter)
336 328 2 percent 5,259 1,094 381 percent
18.06.20.00 Other preparations in blocks, slabs or bars weighing more than 2 kg or in liquid, paste, powder, granular or other bulk form in containers or immediate packings, of a content exceeding 2 kg
8,603 6,523 32 percent 1,327 304 337 percent
18.06.31.00 Food Preparations Containing Cocoa (In Block, Slab, Bar Form; Filled)
23,654 23,303 2 percent 9,389 6,287 49 percent
18.06.32.00 Food Preparations 9,700 4,574 112 percent 427 98 336 percent

PROCESSED FOODS VALUE CHAIN ASSESSMENT REPORT 72
Containing Cocoa (In Block, Slab, Bar Form; Not Filled)
18.06.90.00 Other 21,358 14,398 48 percent 18,557 11,413 63 percent
The export market for chocolate is limited to a specific type of chocolate segment - high value boxed
chocolate. The market has been growing for the past 3 to 4 years at a fast pace. Quantities almost tripled
between 2009 and 2011 reaching about 6,000 MT. The importing countries are regional and Gulf
countries such as Jordan, KSA, Qatar, and Syria.
The importance of the chocolate industry in exports is that it is a steadily growing industry meaning that it
is appreciated by consumers and that it fits the image of Lebanese Cuisine. Some Lebanese chocolate
products and brands such as “Patchi”, ”Ethel”, ”Chantilly”, and others are promising candidates for
franchising, both in the Lebanese market and in neighboring countries and the GCC.
Having said this, and considering that Chocolate products require controlled climate shipments and are
usually shipped by air, there could be synergy with high end ready meals or other types of
confectionaries.
LIVCD STRATEGY
Upgrade processors to comply with international food safety standards.
Establish linkages with other agro-industry sectors; mainly fruit and nut processors.
Include chocolate products in the overall export marketing strategy for the Lebanese food products.
Provide access to regional markets such as GCC, Iraq, Egypt possibly North African markets.
TAHINA
Belonging to ISIC codes no. 1079 and 1040 respectively.
Product Definition
Tahini (Tehina) is a light yellow liquid obtained from the peeling, roasting and grinding of sesame seed. It
should contain a minimum of 45 percent fat and a moisture content not exceeding 1.5 percent.
Tahini is widely used in Lebanese cuisine; it is manufactured by over 20 local factories registered in the
Association of Lebanese industrialists and a dozen small ones located in various regions of Lebanon.
Tahini is produced for the local market and for export. Production size is very roughly estimated between
10,000 to 12,000MT annually.
Actors
Small and medium sized processors: These are tahini mills with a production capacity ranking form
500kg a day to 10Mt tons per day. They are usually family businesses except for a couple of factories
which belong to local corporations.

PROCESSED FOODS VALUE CHAIN ASSESSMENT REPORT 73
Sesame seed importers: These are commodity traders buying sesame in large lots mainly from Sudan
other African countries such as Ethiopia and from India. They import sesame seeds for tahini producers
but also for bakeries.
Wholesalers and distributors; producers/distributors/Exporters
MARKETS
Domestic Market
Tahini produced locally is sold to three market segments:
Retail, where it is sold in plastic packs of 500g and 1000g;
HoReCa, where it is sold to restaurants of caterers or even hotels, in buckets or tins of 18kg each; and
Industry where it is sold in drums of 200kgs or sometimes in stainless steel reservoirs. As a matter of fact,
ninety percent of the canning industry has installed its own Tahini production units. The total quantities
produced can be roughly estimated at 6 or 7 thousand tons annually having a market value of about USD
13,000,000 which can vary depending on the price of the sesame seed. 65 percent of tahini is consumed
locally and 35 percent is exported.
Imports of tahini are practically nil as Lebanese quality is superior to t ahini produced outside Lebanon.
Tahini factories are distributed in all regions of Lebanon. The major concerns for the local consumer are:
possible addition of coloring agent such as titanium dioxide as a whitening agent; and 2) the presence of
pathogenic bacteria such as Salmonella. Both issues are prohibited by law and are being monitored by the
relevant authorities.
Export Market:
Tahina is an important product for export, about 35 percent of quantities produced are exported. Some
companies export 70 percent of their production and others 30 percent; while small outfits tend to sell
only to the local market. Lebanese tahini is relatively expensive if compared to tahini produced elsewhere
but is exported to all continents, and specifically to the ethnic markets in the USA, EU, Australia and the
GCC.
Exports are packaged in includes 908g as well as 454g plastic pot packaging, as well as 18 kg buckets.
The buckets are used by caterers as well as re-packers in the USA and Canada. Despite the fact that tahini
mills exist in the US and in many Gulf countries, they are not capable of matching the characteristics of
the Lebanese tahini in terms of taste, color and consistency.
Even though Tahini is produced in regional countries such as Turkey, Syria, Jordan, Egypt and Palestine,
and some Gulf countries, Lebanon has a unique position in the sense that it is largest producer of stone
ground tahini and the largest exporter; the quality of tahina in terms of texture, color and taste is superior
in Lebanon as most industries utilize best quality sesame seed.
PRODUCTION
Lebanese Tahina is highly recognized regionally because of its high quality which is attained by the
traditional processing manner of stone grinding; There is in Lebanon over 20 factories with a capacity
exceeding 6000 MT of Tahina annually; 95 percent of the Tahina producers in Lebanon utilize stone
grinding as a method for production while 5 percent depend only on mechanized systems. Stone grinding
is a slow process and requires regular and extensive maintenance of the stones; as a result several

PROCESSED FOODS VALUE CHAIN ASSESSMENT REPORT 74
factories in Lebanon have shifted to a more mechanized grinding which produces a less premium quality
in terms of color and taste.;
30-40 percent of the companies combine stone and mechanical grinding. Since Tahina after production is
stored under non-controlled conditions which could reach35oC to 45
oC, and since it is typically consumed
fresh from the jars without further heating, and since it is not vacuum packed or by itself is not acidic
product, Tahini has to be free from any pathogenic bacteria upon packaging. Tahini production is a
sensitive but a relatively safe production system, however the raw sesame itself need to be treated with
attention otherwise the risk of contamination shall increase significantly. Adhering to international food
safety standards during production is also critical to avoid contamination of the finished product. The fact
that Lebanese Tahini has had incidents where salmonella was detected has reduced the quantities for
export, especially to the USA. Since then however, the Syndicate of Lebanese Industrialists (SLFI) along
with the Lebanese government have taken steps to insure the safety of Lebanese Tahini.
HALAWA OR HALAWA TEHENIA
‘Halwa tehenia” designates a heat-processed food product made of Tahina, natural sugars and other
ingredients. Its texture is consistent or crumbly (Fibrous Halawa) .Halawa should not contain less than 25
percent fat coming from tahina and has a moisture content not exceeding 2.5 percent.
ACTORS
Tahina and halawa small and medium sized processors: These are at ninety eight percent tahini producers
who also produce halawa.
Sugar importers and Importers of soapwort extract: A substance extracted from the bark, leaves or roots
of soapwort (Saponaria officinalis). It is either called soapwort or saponin.
Wholesalers and distributors; producers/distributors/Exporters.
MARKETS
Domestic markets
Lebanon consumes large quantities of halawa. It is considered as the sweet of low income brackets of the
population. The quantities of halawa produced is equivalent to about 15-20 percent of the tahini market
.Its market value exceeds $4,000,000 and is sold in many variants; plain; with pistachios; with chocolate
and with almonds. The local market share varies between 65 and 70 percent. Halawa is still packed in
traditional round PE boxes of 1000g and 500g sizes. Recently some producers have replaced the round
shaped plastic boxes with thermoformed trays.
Export markets
Halawa and its variants constitute an important export product to several countries on all continents where
the Lebanese diaspora is present (about35 percent of total production). Those countries include the GCC,
North America, EU, Australia and South America. Halawa is produced and consumed all over the eastern
Mediterranean region from Egypt to Turkey and Greece. Lebanese Halawa exported in spite of it being
produced in numerous countries.
PRODUCTION
Halawa production depends on imported raw materials. It requires sesame seed from which tahini is
produced and sugar which constitutes 50 percent of the Halawa ingredients. Halawa production in

PROCESSED FOODS VALUE CHAIN ASSESSMENT REPORT 75
Lebanon is labor intensive, as it depends on primitive and low capacity equipment and the skills of the
“Mouallem” or the halawa maker. The production steps are as follows:
1- Cooking and aerating the sugar until it becomes a white liquid.
2- Mixing sugar with Tahini and layering it until it becomes a thick mass.
3- Filling and weighing the halawa boxes manually one by one while melding the halwa slightly
prior to filling.
4- Closing and sealing the boxes.
In countries such as Egypt, Turkey and Greece more mechanization has been introduced to the
manufacture of halawa which renders it more cost effective and a bit less labour intensive. However
according to Lebanese quality standards, mechanization does not meet the halawa original texture and
taste.
LIVCD STRATEGY FOR TAHINA AND HALAWA.
The main constraint of the Tahina industry is its dependence on sesame from Sudan. The price of the
commodity determines the final price of Tahina. Another constraint is the difficulty of achieving hygienic
conditions using a grinding stone. Yet many Lebanese companies were able overcome this challenge by
improving and tightening production controls. The LIVCD input should focus on the following:
Upgrade processors to comply with international food safety standards.
Include tahina and halawa in the overall export marketing strategy for Lebanese food products.
Provide access to regional markets such as GCC, Iraq, Egypt and possibly North African markets
GROUND COFFEE
It belongs to ISISC rev 4 Class 1079
PRODUCT DEFINITION
Ground Coffee: are roasted coffee beans (individual or blended) which have been prepared for brewing by
being crushed or ground. When hot water is passed through the ground coffee, it extracts compounds
within the coffee beans, resulting in a brewed cup of coffee. There are a number of different ways to
process coffee for brewing, and it is important to match grinding method to brewing method to ensure that
coffee comes out with good flavor and high quality. Lebanese coffee is the Turkish coffee type which
leaves grounds at the bottom of the cup or coffee pot after preparation. Different roasts and beans yield
very different flavors. When preparing ground coffee, people can blend beans from different locations if
they want to create a customized flavor.
In Lebanon the major source for coffee is Brazil and sometimes other Latin American countries. The
main varieties are Arabica and Robusta.
About 10 medium-sized ground roasted coffee producers exist and are doing well. Many factories are at
present equipped with modern equipment and testing laboratories. Lebanese ground coffee is mainly a
domestic market product.

PROCESSED FOODS VALUE CHAIN ASSESSMENT REPORT 76
Actors
Medium and large processors. These are companies importing coffee beans from various
countries directly or through local traders, roasting it, grinding it, packing and marketing it under
several brands.
MARKETS
Domestic markets
The average consumption of coffee per capita in Lebanon was estimated in 2008 at 4.8 kg annually for a
toal of 20,000MT. World production is about 8 million tons and the average consumption per capita
worldwide is 1.3 kg. The marketing of coffee in Lebanon has a long history; modern packaging
techniques have been adopted as well as modern labeling and designs have been utilized. The largest
segment by far is the Turkish coffee type, but recently several producers have tried to introduce espresso
type product with special coffee machines.
Export markets
Exporting coffee is a relatively new business in Lebanon. Recently exports have taken place to countries
such as GCC and Jordan, and to ethnic markets in Canada and the US. The trend is an increasing one
.Various types of coffee and coffee based products are exported and reached 2,200MT in 2011 for a
value of $16 million Coffee is mainly packaged in vacuum flexible packaging bags or bags injected with
gas to reduce the oxygen and Co2 effect on the quality of the product.
Lebanese type coffee has been successfully exported to eastern European countries and is quite popular
with the Lebanese diaspora in GCC countries, Jordan, Syria as well as western markets such as the USA.
Production
Coffee production is a big business if we are to consider both local and export markets. It developed from
a semi-automatic roaster and grinder to fully automatic continuous roasting lines. All producers start
from imported coffee beans. At the beginning Lebanese producers used cheap quality Brazilian beans
(type Robusta) but at present successful producers are blending different types of beans to improve taste
(Arabica). The major coffee bean supplier is Brazil but a lot is imported from Colombia.
A lot effort has been applied to packaging of ground coffee into flexible vacuum bags or modified
atmosphere products.
Some coffee factories have moved into espresso technology and have also invested heavily into
developing coffee dispensers not only for espresso but also for Lebanese type coffee.
A second effort is being done in the marketing of coffee through the development of sophisticated design
bags as well as dispenser coffee machines.
LIVCD Strategy
Considering the relative success the sector has as well as its ability to promote Lebanese exports
the strategy of LIVCD shall be to include Lebanese coffee in the overall export marketing
strategy the Lebanese food products.

PROCESSED FOODS VALUE CHAIN ASSESSMENT REPORT 77
SPICES AND HERBS
Spices and herbs belong to ISISC rev 4 Class 1079
PRODUCT DEFINITION
Spices and herbs are the aromatic parts of the leaves, flowers or other parts of plants used to impart an
aroma or taste to foods.
There are about 7 major industries in Lebanon processing and packing herbs, spices and spice mixes.
Most of them are known brands which are sold both locally and abroad.
Except for a small quantity of thyme, sage and chamomile most of the dried herbs are imported for
domestic use or even re-packed for exports. Both domestic and export markets are large.
ACTORS
Growers/collectors/dryers of specific local herbs: These are either collectors and dryers of specific wild
herbs found in Lebanon such as thyme and sage or cultivators of non-wild thyme, oregano, mint,
coriander, basil and mouloukhieh leaves, and others.
Small and medium processors; These buy raw spices from local or international suppliers, clean, sort
,grind, and pack it in a manner to preserve its flavor and microbial quality. In many cases spices are
formulated into spice mixes having a specific culinary function such as ‘kebbe Spice”,”Chicken
spice”,and so on.
Importers of raw spices: These are commodity importers and resellers of various raw spices in large and
small quantities. They supply spices from countries and regions such as Egypt, India, Sri Lanka , China,
Turkey, South America, among others.
Wholesalers; local Distributors; local Producers/distributors/exporters.
MARKETS
Domestic markets
Lebanon imports about $10,000,000 worth of different types of herbs and spices; mainly single whole
ingredients which are then fumigated and ground. The spices are processed and packed in individual
consumer units varying between 50g and 200g.The cheaper ones are usually packed in transparent plastic
sachets of 50g each. Recently a marketing upgrade of certain brands introduced the labeled glass vials
similar to European products such as “Ducros” and “McCormick”. Large sizes have also been introduced
for food service companies.
The success stories of certain brands are in the preparation of mixes on which they could add higher
margins. Interesting examples are tabboule mix, kebbe mix, roasted chicken mix, and chawarma mix.
Estimated consumption of spices and herbs in Lebanon is 3,650 tons/year at a value of $18.25 Million.
Export Markets
The export market for spices is significant. In 2011 it amounted to about 700MT per year at a value of
about $2.3 million. Exports were traded to GCC countries, Canada, Germany, USA, Australia and some
African countries.

PROCESSED FOODS VALUE CHAIN ASSESSMENT REPORT 78
The leverage of the Lebanese spice industry is in the mixes and regionally recognized Lebanese cuisine. It
constitutes about 70 percent of exports. Most of the mixes correspond to Lebanese kitchen recipes; hence
spices are actually an integrated part of the food product mix exported under the Lebanese cuisine
umbrella, and which is highly sought after by Lebanese and Arabs living abroad and to Arab countries
that appreciate Lebanese cuisine.
PRODUCTION
A major constraint in the grinding and packing of spices is their contamination from the source. With the
present safety conditions imposed in many of the importing countries the industry is faced with the
challenge for finding a way to reduce contamination without altering the spice quality. Few of the major
spice producers have automated lines. They rely on semi-automatic equipment. The lines consist of basic
blenders and weighers for hand filling. Recently some companies have significantly upgraded the hygiene
as well as the mixing and packing capacity of their lines. Brands such as Gardenia and Second House
Products have obtained ISO22000 on their spice production unit
The processing of spices does not require significant investment. It is mainly related to the skills of the
producer, the flexibility of the packer to establish a diversified range, the taste of the spices and on
hygiene.
Considering that Lebanese producers do not grow their own spices, the issue of microbial loads in the
spice is becoming a hurdle for exports to developed countries. Countries such as Turkey have resolved the
issue by establishing expensive spice sterilizing units.
LIVCD Strategy
The fact that Lebanese producers have managed to dominate the local market as well as penetrate some
difficult foreign markets, even though Lebanon is not a spice producer, is due to: 1) The flexibility of
Lebanese producers to establish a large range requiring outsourcing and knowledge of various types and
origin of spices; 2) the fact that Lebanon has a well-established and internationally appreciated cuisine;
and 3) the Lebanese abroad who welcome the taste of their original spice mixes. The strategy shall focus
on:
Upgrade processors to comply with international food safety standards.
Include Lebanese spice mixes in the overall export marketing strategy for the Lebanese food
products.
Support a PPP venture for the sterilization of raw spices.
ROASTED NUTS
Belonging to ISIC Rev.4 Class 1030
PRODUCT DEFINITION
Roasted nuts are various types of nuts that have undergone roasting using indirect heat at high
temperatures with or without salting in various manners to preserve them by reducing their moisture
content and enhancing their flavor. It covers almonds, pistachios, pumpkin seeds, hazelnuts, walnuts,
peanuts, cashew, and so on.

PROCESSED FOODS VALUE CHAIN ASSESSMENT REPORT 79
ACTORS
Small and medium nut processors; These are small and medium sized roasters located all over Lebanon
that buy from local traders process them.
Additional actors of the nut value chain include: traders of nut products, wholesalers, local distributors,
Processors, distributors, and exporters.
MARKETS
Domestic markets
Lebanon is one of the largest consumers of edible nuts in the Mediterranean region. Estimated
consumption as per 2009 FAO statistics is equivalent to 67 MT of tree nuts, 63 percent of which are
imported. Roasted nuts constitute a large portion of the consumed nuts. Roasted nuts in Lebanon are
mainly sold at roasters or supermarkets with special counters. A large percentage is now being sold pre-
packed in supermarkets.
There are about a dozen roasteries in Lebanon with a good branding image.
Export markets
Lebanon exports about 10,000MT of roasted nut annually having a value of about $47 Million. Most of it
is mixed nuts as Lebanon is quite famous for such items. Importing countries are EU countries, GCC
countries, Iraq, USA, and some African countries.
PRODUCTION
Only recently some roasters have introduced automation in their roasting operations; have modified the
traditional roasting systems which are labor intensive and of low productivity and replaced them with the
hot air type of roasting. Lebanon produces thousands of tons of roasted nuts that are packed in two ways:
1) Bulk pack to be re-sold at outlets; and 2) Flexible PE aluminum film bags having a tight hermetic seal
and gas injection to avoid oxidation and moisture.
LIVCD STRATEGY
Roasted nuts exist everywhere, but the Lebanese are specialized in this business and are producing tasty
products. The main constraint is the nuts are mainly imported. None the less, Lebanon achieves a high
level of added value from the roasting and packing of nuts LIVCD strategy should focus on the following:
Support in the upgrade of the food safety system in the roasters.
Support the development of new packaging ideas or concepts for the sector without altering the
range and quality.
Create linkages between nuts growers and roasters. Support growers in the optimization of their
post-harvest techniques. Introduce roasted nuts within the overall export strategy designated by FIS.
QUICK FROZEN VEGETABLES
Belong to the ISISC Rev 4 class 1030
PRODUCT DEFINITION
Quick frozen vegetables are the prepared from fresh, clean, sound, whole, sometimes immature
vegetable been washed, sufficiently blanched to ensure adequate stability of color and flavor during

PROCESSED FOODS VALUE CHAIN ASSESSMENT REPORT 80
normal marketing cycles and which conform to the characteristics of the relevant vegetable species. The
product is subject to a freezing process in appropriate equipment carried out in such a way that the range
of temperature of maximum crystallization is passed quickly. The quick freezing process shall not be
regarded as complete unless and until the product temperature has reached -18°C (0°F) at the thermal
center after thermal stabilization. The recognized practice of repacking quick frozen products under
controlled conditions is permitted.
Quick frozen vegetables are rapidly growing as a food segment and in some areas replacing canned
vegetables, such as green peas, artichoke, okra, and in the green leaves segments (such as mouloukhia ,
spinach and coriander.
Quick freezing in Lebanon is still at an early stage with almost no apparent known factory except in the
field of frozen French fries ). The main reason is the unavailability of consistent quality fresh vegetables
suitable for freezing and significant imports.
ACTORS
Growers of fresh vegetables; Wholesale market; importers in the case of potatoes; small and medium
sized processors.
MARKETS
Domestic market
At present 98 percent of the frozen vegetables are imported from countries such as Egypt, France,
Belgium, USA, and Eastern Europe. Imports in 2011 were about 3000MT with a value of about $5
million. Local consumption is growing. In many cases consumers prefer them to canned vegetables and
sometimes even fresh vegetables such in the case of pre-fried potatoes or cut carrots, and the frozen pre-
fries potatoes.
Export Market
The top 5 importing countries for frozen vegetables in 2011 are Iraq (48 percent), UAE (26 percent),
Jordan (11 percent), KSA (6 percent) and Kuwait (3 percent). The trend is stable. There was a big
increase in 2009 then a decrease in 2012. Though the total value of exports increased slightly. A portion
of consists of imports that are re-exported under a Lebanese brand. This applies to frozen peas, okra, and
artichokes. The products are sold to local distribution companies or Lebanese distribution companies
located in the targeted export market.
PRODUCTION
One item that is successfully produced in Lebanon is frozen cut potatoes in the form of pre-cooked
French Fries and potato wedges. This constitutes an important import replacement to compete with
international brands. It has also gained ground through the establishment of international fast food chains
such as McDonald’s, Burger King, Hardees, and others. The processing technology used is advanced and
produces a good quality product assuming that the good quality raw materials are available.
Processors still count on imported Egyptian potatoes to meet their cost expectations and remain
competitive, especially that frozen frites require a special type of potato to obtain good results. These

PROCESSED FOODS VALUE CHAIN ASSESSMENT REPORT 81
processors also utilize locally grown potatoes when the agricultural calendar does not permit imports and
when the right quality is available.
Other processors are small and rely on batch freezing; they supply a small segment of the market and the
majority freezes vegetables, such as frozen roasted eggplant for the industry. Frozen roasted eggplant is
used for canning of roasted eggplant and Babaghanouge.
LIVCD STRATEGY
The added value on quick frozen products is significant and the domestic market as well export markets
exist. However it is difficult to replace imports due to 3 main reasons:
Most locally grown varieties of peas and artichokes are not suitable for freezing.
High cost of IQF freezing which is closely linked to economies of scale.
Cost of production and processing is more expensive than that in competing countries.
Freezing, which is required for long storage, consumes lots of expensive energy.
None the less, Lebanon a producer of fruits and vegetables and consumers those items in quick frozen
form. Quick freezing if it succeeds can provide a support to the fruit and vegetable value chains. The
LIVCD strategy will :
Support linkages between growers and processors in those products that are consumed in large
amounts locally and where local production for the fresh market is active.
Support PPP agreements on a vertically integrated quick frozen unit for fruits and vegetables to
replace imports in both frozen and canned products and possibly target some export markets.
FRUIT JUICES FROM FRESH FRUIT
PRODUCT DEFINITION
Juices are products produced from the extraction of various fruits such as strawberry, orange apple,
grapefruit, and tropical fruits, and not from concentrate.
Fruit juices can be produced from 100 percent fresh fruit or can be made from fruit concentrate. The
Lebanese juice market is highly dominated by the “made from concentrate” juices or nectars. There is
however a strong niche for fresh juices that is mostly limited to the local market due to its relatively short
shelf life, the need for chilled storage and its relatively high cost. Smoothies based on fresh fruits is a new
trend and is associated with HORECA businesses. The range of smoothies usually focuses on citrus
products and apples. Other types are becoming more common such as strawberries, bananas, and
avocadoes.
ACTORS
Small and medium sized processors; responsible for the purchase and processing of fruits such as citrus
fruits, apple, red berries, and so on.
Fresh fruit growers; Local distributors; processors/distributors/exporters.
PROCESSED FOODS VALUE CHAIN ASSESSMENT REPORT 82
MARKETS
Domestic market
Fresh juices are processed by a few numbers of processors, utilizing relatively low capacity machinery.
The major processor is the“Balkis” brand followed by several small producers. The market is confined to
chilled plastic bottles and pasteurized 1 liter Tetrapack cartons stored in a refrigerator.
Export markets
Still not well developed as a result of a short shelf life.
PRODUCTION
The largest constraint to producing juice locally, is the lack of consistent availability of fruits throughout
the year at prices that make it more competitive for local processers to compete with imported
concentrates. Balkis, which is the only fresh citrus juice processor, has its own orchard that supplies it
with juice-grade citrus. In addition, the company buys from other orchards depending on availability.
During peak season when prices are low, Balkis purchases large volumes and stores them as fresh or as
frozen juice. This however adds cost which further reduces competitiveness.
LIVCD STRATEGY
The immediate potential for the processed fresh fruit business is in the food service segment, with a
potential for industrial production if fresh fruit cultivation becomes industry oriented where the right
varieties are planted and at large enough volumes. The most likely candidates are apples and citrus. The
marketing of such products shall be limited to nearby The proposed strategy of LIVCD is:
Establish linkages between fruit growers and fruit juice from fresh product.
Introduce the fresh fruit juices within the export marketing strategy for Lebanese food products.
Provide technical support for the extension of shelf life of juices from fresh juice.
Support in the development of high added value products such as fruit smoothies.
GRAPE WINE
Belonging to the ISIC REV 4 Class
PRODUCT DEFINITION
The product obtained exclusively from the total or partial alcoholic fermentation of fresh grapes, whether
or not crushed. There are different varieties of grape wine. The wine industry in Lebanon is flourishing.
The Bekaa valley with its moderate and relatively dry climate and its sunny skies is an ideal area for the
cultivation of wine grape varieties. However wine grapes are cultivated in other areas in the north, south
and Jbeil. There are 18 major wine producers operating in different parts of Lebanon out a total of 40
wineries with at least four or five producers with international outreach. In 1991 there were only 4
wineries operating in Lebanon. Lebanese wines have an important potential locally and in export
countries because of its quality. In view of the high costs of production, Lebanese wine producers have
kept away from the low value table wine market and focused mainly on high quality wines. The wine
industry is also important for Lebanon’s touristic development as well as Lebanon’s image as a country
with high quality agricultural products.

PROCESSED FOODS VALUE CHAIN ASSESSMENT REPORT 83
ACTORS
Small and medium sized wine producers: There are of two types. Those who buy their grapes from the
market or from growers and those that have their own vineyards. The latter constitute the majority and are
usually the ones leading the market.
Grape growers: Most of the growers dealing with wine processors work on a contract basis to deliver the
right quantity and quality.
Bottle producers/importers: Most wine bottles are imported except for certain brands that are able to order
large quantities from the local producer.
Cork importers: supply cork to wine industry.
Other actors include: Local distributors, producers, distributors, and exporters.
MARKETS
Domestic markets
According to the Union Vinicole Du Liban (UVL), Lebanon produces over 7 million bottles of wine from
grapes planted over an area of 2,000 Hectares. 50 percent of the market is dominated by two major
brands; however other brands are also gaining ground. Local producers estimate the consumption of wine
to be around 1.2 liters per capita or about 4 million bottles with local wines constituting about 80 percent.
EXPORT MARKETS
Lebanese wine is well appreciated in export markets; it is mainly limited to good quality wine and its
quantities represent about 30 percent to 40 percent of local production, a good achievement considering
that several of the wine markets targeted are themselves very large wine producers. Quantities exported in
2011 reached 2,000,000 liters with a value of to about $12 Million. The major importing countries are the
UK (24 percent), France (17 percent), USA(6 percent), Canada(5 percent) and UAE (5 percent). Such
new markets as Russia and Eastern European countries are being tested by Lebanese producers.
PRODUCTION
Lebanon is the largest wine producer in the region. It is well acknowledged by wine specialists that the
climate of the Lebanese Bekaa Valley is suitable for wine grapes. Many wineries have succeeded in
creating a vertically integrated business with vineyards and wine cellars as well as distribution companies
locally and abroad. Lebanon does not have any indigenous red grapes but rather cultivates international
varieties such as Cinsault, Grenache, Carignan, Cabernet Sauvignon, Syrah, and Merlot. White grapes are
indigenous such as Obeide and Marwah.
Most of the famous wineries rely on foreign (French) wine professional to manage their production.
LIVCD STRATEGY
Lebanese wines are a success story in terms of exports; they provide a good image of Lebanese food and
beverage production and have good market access in the west. Associating Lebanese food products with
Lebanese wine can contribute to the upgrade of Lebanese food in specific markets. Hence LIVCD
strategy will include Lebanese Wine products in the overall export marketing strategy for the Lebanese
food products.

PROCESSED FOODS VALUE CHAIN ASSESSMENT REPORT 84