usaf tps l-23 super blanik aerodynamic … bladder edwards air force base december 2005 air force...
TRANSCRIPT

HAVE BLADDER Edwards Air Force Base Air Force Flight Test Center December 2005
AFFTC-TIM-05-08
USAF TPS L-23 Super Blanik Aerodynamic Determination, Evaluation, and Reporting
Program (HAVE BLADDER)
AVIV YAM-SHAHOR, Maj, IAF SCOTT CAIN, Maj, USAF Project Pilot Project Pilot ERIC SMITH, Maj, USAF MICHELE WOODCOCK, Capt, USAF Project Pilot Project Flight Test Navigator VINCENT DABROWSKI, Capt, USAF BENJAMIN WILSON, 2Lt, USAF Project Manager/Flight Test Engineer Support Engineer
DECEMBER 2005
FINAL TECHNICAL INFORMATION MEMORANDUM
Approved for public release; distribution is unlimited.
AFFTC
AIR FORCE FLIGHT TEST CENTER EDWARDS AIR FORCE BASE, CALIFORNIA
AIR FORCE MATERIAL COMMAND UNITED STATES AIR FORCE


Form Approved REPORT DOCUMENTATION PAGE OMB No. 0704-0188
Public reporting burden for this collection of information is estimated to average 1 hour per response, including the time for reviewing instructions, searching existing data sources, gathering and maintaining the data needed, and completing and reviewing this collection of information. Send comments regarding this burden estimate or any other aspect of this collection of information, including suggestions for reducing this burden to Department of Defense, Washington Headquarters Services, Directorate for Information Operations and Reports (0704-0188), 1215 Jefferson Davis Highway, Suite 1204, Arlington, VA 22202-4302. Respondents should be aware that notwithstanding any other provision of law, no person shall be subject to any penalty for failing to comply with a collection of information if it does not display a currently valid OMB control number. PLEASE DO NOT RETURN YOUR FORM TO THE ABOVE ADDRESS.
3. DATES COVERED (From – To)1. REPORT DATE 2. REPORT TYPEFinal Technical Information Memorandum 4-19 October 2005
4. TITLE AND SUBTITLE 5a. CONTRACT NUMBER USAF TPS L-23 Super Blanik Aerodynamic Determination, Evaluation, and Reporting Program (HAVE BLADDER)
5b. GRANT NUMBER
5c. PROGRAM ELEMENT NUMBER
5d. PROJECT NUMBER
5e. TASK NUMBER
6. AUTHOR(S) Dabrowski, Vincent, Captain, USAF Yam-Shahor, Aviv, Major, IAF Cain, Scott, Major, USAF Smith, Eric, Major, USAF Woodcock, Michele, Captain, USAF Wilson, Benjamin, 2nd Lieutenant, USAF 5f. WORK UNIT NUMBER
8. PERFORMING ORGANIZATION REPORT NUMBER
7. PERFORMING ORGANIZATION NAME(S) AND ADDRESS(ES) Air Force Flight Test Center 412th Test Wing USAF Test Pilot School
220 South Wolfe Ave Edwards AFB CA 93524-6485
AFFTC-TIM-05-08
9. SPONSORING / MONITORING AGENCY NAME(S) AND ADDRESS(ES) 10. SPONSOR/MONITOR’S ACRONYM(S) 11. SPONSOR/MONITOR’S REPORT NUMBER(S)
USAF TPS 220 S. Wolfe Ave Edwards AFB, CA 93523
12. DISTRIBUTION / AVAILABILITY STATEMENT Approved for public release; distribution is unlimited. 13. SUPPLEMENTARY NOTESCA: Air Force Flight Test Center Edwards AFB CA CC: 012100 14. ABSTRACTThe HAVE BLADDER TMP was conducted at the request of the USAF TPS as part of a NASA investigation into the viability of UAV endurance enhancement through the extraction of energy from atmospheric wind gradients. Forty-three test sorties were performed from 4-19 October 2005 under Job Order Number (JON) MC05C4000. The five-member HAVE BLADDER test team from TPS Class 05A performed the testing at Edwards AFB. Testing occurred at North Base in an altitude block up to 10,000 ft pressure altitude. Flight testing gathered stability derivative data at three different angle of attacks (AoAs). Rap and doublet time histories were recorded in-flight for parameter identification post-flight.
15. SUBJECT TERMSHAVE BLADDER, Dynamic Soaring, L-23 Super Blanik, Moments of Inertia, Stability Derivatives, System Identification, Flight Testing, Parameter Identification, Atmospheric Wind Gradients, Atmospheric Energy Extraction
16. SECURITY CLASSIFICATION OF: Unclassified
17. LIMITATION 18. NUMBER OF PAGES
19a. NAME OF RESPONSIBLE PERSON Mark A. Stucky, Lt Col, USAFOF ABSTRACT19b. TELEPHONE NUMBER (include area code) SAME AS
REPORT a. REPORT
Unclassified b. ABSTRACT c. THIS PAGE
661-277-2125 Unclassified Unclassified
Standard Form 298 (Rev. 8-98) Prescribed by ANSI Std. 239.18

HAVE BLADDER Edwards Air Force Base December 2005 Air Force Flight Test Center
This page intentionally left blank.
HAVE BLADDER Edwards Air Force Base December 2005 Air Force Flight Test Center
PREFACE
The HAVE BLADDER Test Management Project (TMP) was conducted by the USAF Test Pilot School as part of a NASA study of UAV endurance enhancement using dynamic soaring maneuvers. HAVE BLADDER determined L-23 Super Blanik stability derivates that will be used in follow-on efforts to define dynamic soaring maneuvers and required atmospheric conditions. The HAVE BLADDER test team would like to recognize Mr. James Murray and Mr. Russ Franz, NASA DFRC, for their invaluable assistance with aircraft instrumentation and data collection and analysis.
iii

HAVE BLADDER Edwards Air Force Base December 2005 Air Force Flight Test Center
This page intentionally left blank
iv
HAVE BLADDER Edwards Air Force Base December 2005 Air Force Flight Test Center
EXECUTIVE SUMMARY
This test report presents the results of the HAVE BLADDER project. The objective was to measure the stability derivatives of the TPS-owned L-23 Super Blanik glider. The HAVE BLADDER Test Management Project (TMP) was conducted at the request of the USAF TPS as part of a NASA investigation into the viability of UAV endurance enhancement through the extraction of energy from atmospheric wind gradients. Forty-three sorties were performed from 4-19 October 2005 under Job Order Number (JON) MC05C4000. The five-member HAVE BLADDER test team from TPS Class 05A performed the testing at Edwards AFB. Additional personnel directly supported the flight tests by serving as tow pilots and glider instructor pilots. Testing occurred at North Base in an altitude block up to 10,000 ft pressure altitude. Takeoffs and landings occurred on the northern lakebed area and the North Base Runway. Test instrumentation included an onboard Inertial Measurement Unit (IMU) which recorded aircraft position, velocity, acceleration, and orientation. The IMU also served as a data acquisition system for a glider-mounted temperature sensor and a precise Pitot-static system. The recorded data was used for post-flight data analysis and documentation. NASA personnel and Browne’s Air Service performed the L-23 Super Blanik modifications and data system installations required for the HAVE BLADDER project. Flight testing gathered stability derivative data at three different angles of attack (AoAs). Rap and doublet time histories were recorded in-flight for parameter identification post-flight. Analysis of the flight test data yielded the desired stability derivatives. The results were documented so that follow-on NASA-sponsored efforts can define optimal dynamic soaring maneuvers, the required atmospheric conditions for dynamic soaring, and the atmospheric sensors and airframe capabilities required to execute atmospheric energy extraction.
v
HAVE BLADDER Edwards Air Force Base December 2005 Air Force Flight Test Center
Table of Contents PREFACE...................................................................................................................................... iii EXECUTIVE SUMMARY ............................................................................................................ v Table of Contents........................................................................................................................... vi List of Tables ................................................................................................................................ vii INTRODUCTION .......................................................................................................................... 1
Background................................................................................................................................. 1 Program Chronology................................................................................................................... 1 Test Item Description.................................................................................................................. 1 Test Objectives............................................................................................................................ 3 Limitations .................................................................................................................................. 3
TEST AND EVALUATION .......................................................................................................... 5 General........................................................................................................................................ 5 Test Procedures........................................................................................................................... 5
RESULTS AND ANALYSES........................................................................................................ 7 CONCLUSIONS AND RECOMMENDATIONS ......................................................................... 9 REFERENCES ............................................................................................................................... 1 APPENDIX A: Lessons Learned............................................................................................... A-1 APPENDIX B: Supplemental Data Plots .................................................................................. B-1 APPENDIX C: Moments of Inertia ........................................................................................... C-1 APPENDIX D: Instrumentation ................................................................................................. D-1 APPENDIX E: Sample GetData ASCII II..................................................................................E-1
vi

HAVE BLADDER Edwards Air Force Base December 2005 Air Force Flight Test Center
List of Tables Table 1: Stability Derivatives ......................................................................................................... 3 Table 2: Moments of Inertia .......................................................................................................... 7 Table 3: Response Weights............................................................................................................ 7 Table 4: Stability Derivatives ........................................................................................................ 8 Table 5: Stability Derivatives ........................................................................................................ 9
vii

HAVE BLADDER Edwards Air Force Base December 2005 Air Force Flight Test Center
This page intentionally left blank.
viii

HAVE BLADDER Edwards Air Force Base December 2005 Air Force Flight Test Center
INTRODUCTION
Background
Previous investigations of dynamic soaring proposed using wind gradients (non-uniformities) in the atmosphere to stay aloft for extended periods. Unlike static soaring, which involved gliders seeking lift from rising air, dynamic soaring proposes a mechanism to extract energy from any moving air mass.
Two well-documented examples of dynamic soaring exist. First, the albatross has been observed to fly many miles over the surface of the ocean without flapping its wings. The maneuver used by the albatross can be summarized as repeated inclined s-turns along a direction of travel perpendicular to the wind. Secondly, pilots of radio control gliders have demonstrated sustained flight at airspeeds more than five times the atmospheric wind speed. The radio control glider dynamic soaring maneuver is described as repeated inclined oval maneuvers traversing the wind boundary on the lee side of a ridge. For future test programs to optimize the flight path for dynamic soaring with a full-sized glider, the flight characteristics of the sailplane must be fully understood. The SENIOR IDS (reference 1) program established lift and drag data. The HAVE BLADDER program built on these data to produce a number of stability derivatives.
Program Chronology Testing was conducted at Edwards AFB, California from 4-19 October 2005. A total of 43 test sorties were flown, totaling 18.2 flight hours.
Test Item Description
The L-23 Super Blanik was designed and manufactured by LET Aeronautical Works in the Czech Republic. The two-place tandem cockpit L-23 Super Blanik was an all metal structure. The rudder, elevator, and ailerons were fabric covered. The shoulder-mounted wings had five degrees of forward sweep, three degrees of dihedral, and an aspect ratio of 13.7. The T-tail was fitted with a conventional elevator and pitch trim tab for pitch control. The L-23 Super Blanik landing gear featured a partially exposed retractable landing gear and a tail gear with a wheel and shock absorber. With the landing gear and air brake retracted, the manufacturer’s specified glide ratio was 28:1 at approximately 48 KIAS. Extending the wing mounted air brakes decreased the glide ratio to approximately 8:1 at 38 KIAS. Extending the landing gear had no appreciable effect on glide ratio. These numbers are somewhat optimistic, as they did not include the data acquisition modifications.
1

HAVE BLADDER Edwards Air Force Base December 2005 Air Force Flight Test Center
The conventional three-axis flight control system was non-powered and fully reversible. Both cockpits were equipped with a center-mounted control stick and rudder pedals which actuated control surfaces with a combination of control push rods and cables. The air brakes were controlled by levers from either cockpit. The airspeed envelope ranged from 36 to 133 KIAS. Maneuvering airspeed was 81 KIAS. Load factor limits were -2.5 to +5.3 g at full gross weight (1124 lbs with two occupants). The aircraft was modified by Browne’s Air Service in Tehachapi, CA with a data acquisition system (DAS) consisting of a five-hole Pitot-static probe, control surface potentiometers, an outside air temperature (OAT) probe and an inertial measurement unit (IMU). The DAS was totally independent of the production air data system used for normal operations. The test Pitot probe was installed at the nose of the airplane. It had a hemispherical tip in which five holes were drilled. The center hole measured total pressure while the offset holes measured differential pressures proportional to angle of attack and angle of sideslip. In conjunction with a static-pressure port, these sensing ports also provided altitude and airspeed signals. The IMU was installed in the baggage compartment behind the rear cockpit. The unit was a GS-111m produced and modified by Athena Technologies, Inc. It incorporated the sensor suite necessary to provide a full attitude, navigation, and air data solution for use in vehicle flight-state measurement. The unit was equipped with accelerometers, angular rate sensors, and magnetometers in three axes, an internal GPS receiver, and air data sensors. A real-time, multi-state Kalman filter was used to integrate the different sensors. The nominal operating frequency of the system was 50 Hz. Control surface deflections were sensed by 5 KOhm string potentiometers attached to the rudder, elevator, both ailerons and the elevator trim tab cable. Analog potentiometer signals were converted to digital signals that were sent to and stored within the GS-111m DAS. These measurements were converted to actual angular control surface deflections. A 500 Ohm resistive thermocouple device (RTD) probe was mounted in the right side window of the rear cockpit. This probe was connected to an Ultra SlimPak® RTD input, field configurable isolator, set for a -50 degrees C to +50 degrees C temperature range. The unit was factory calibrated. This calibration was checked by the HAVE BLADDER test team using a thermocouple during flight test. Output from this probe was sent to and recorded within the GS-111m DAS for post flight analysis of true airspeed.
2

HAVE BLADDER Edwards Air Force Base December 2005 Air Force Flight Test Center
Test Objectives The test objectives were to determine the L-23 Super Blanik stability derivatives listed in table 1 at 40, 70 and 100 KIAS:
Table 1: Stability Derivatives
0mC Pitch Moment Coefficient at zero AOA, elevator and pitch rate (ND) rlC δ Local Roll Moment Coefficient slope with
rudder deflection (per deg)
αmC Local Pitch Moment Coefficient slope with AOA (per deg) 0lC Roll Moment Coefficient at zero beta,
rudder, aileron, roll and yaw rates (ND)
mqC Local Pitch Moment Coefficient slope with
tVcq
2 (per rad) βnC Local Yaw Moment Coefficient slope with
beta (per deg)
Local Yaw Moment Coefficient slope with
tVpb2
(per rad) emC δ Local Pitch Moment Coefficient slope with elevator deflection (per deg) npC
Local Yaw Moment Coefficient slope with
tVrb2
(per rad) ayC δ Side Force Coefficient due to Aileron Deflection (/rad) nrC
ryC δ Side Force Coefficient due to Rudder Deflection (/rad) anC δ
Local Yaw Moment Coefficient slope with aileron deflection (per deg)
lpC Local Roll Moment Coefficient slope with
tVpb2
(per rad) rnC δLocal Yaw Moment Coefficient slope with rudder deflection (per deg)
Local Roll Moment Coefficient slope with
tVrb2
(per rad) Yaw moment Coefficient at zero beta, rudder, aileron, roll and yaw rates (ND) lrC 0nC
Local Roll Moment Coefficient slope with aileron deflection (per deg) alC δ
Limitations None.
3

HAVE BLADDER Edwards Air Force Base December 2005 Air Force Flight Test Center
This page intentionally left blank.
4
HAVE BLADDER Edwards Air Force Base December 2005 Air Force Flight Test Center
TEST AND EVALUATION
General
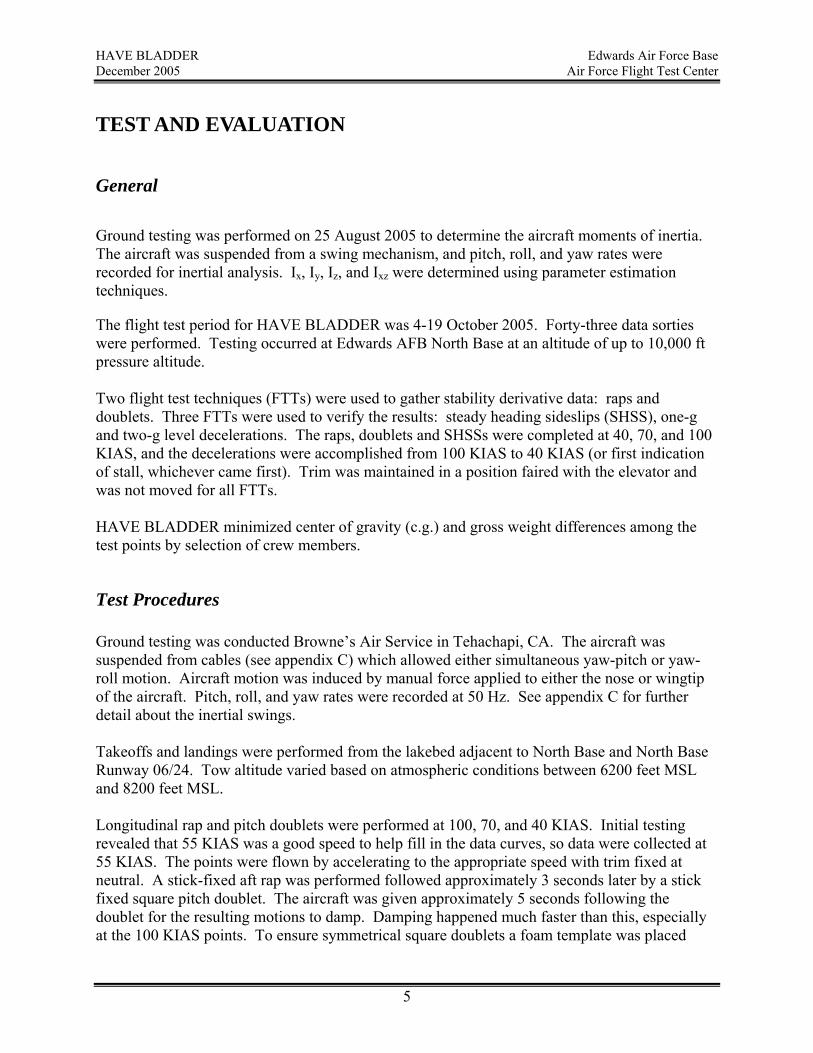
Ground testing was performed on 25 August 2005 to determine the aircraft moments of inertia. The aircraft was suspended from a swing mechanism, and pitch, roll, and yaw rates were recorded for inertial analysis. Ix, Iy, Iz, and Ixz were determined using parameter estimation techniques.
The flight test period for HAVE BLADDER was 4-19 October 2005. Forty-three data sorties were performed. Testing occurred at Edwards AFB North Base at an altitude of up to 10,000 ft pressure altitude. Two flight test techniques (FTTs) were used to gather stability derivative data: raps and doublets. Three FTTs were used to verify the results: steady heading sideslips (SHSS), one-g and two-g level decelerations. The raps, doublets and SHSSs were completed at 40, 70, and 100 KIAS, and the decelerations were accomplished from 100 KIAS to 40 KIAS (or first indication of stall, whichever came first). Trim was maintained in a position faired with the elevator and was not moved for all FTTs. HAVE BLADDER minimized center of gravity (c.g.) and gross weight differences among the test points by selection of crew members.
Test Procedures Ground testing was conducted Browne’s Air Service in Tehachapi, CA. The aircraft was suspended from cables (see appendix C) which allowed either simultaneous yaw-pitch or yaw-roll motion. Aircraft motion was induced by manual force applied to either the nose or wingtip of the aircraft. Pitch, roll, and yaw rates were recorded at 50 Hz. See appendix C for further detail about the inertial swings. Takeoffs and landings were performed from the lakebed adjacent to North Base and North Base Runway 06/24. Tow altitude varied based on atmospheric conditions between 6200 feet MSL and 8200 feet MSL. Longitudinal rap and pitch doublets were performed at 100, 70, and 40 KIAS. Initial testing revealed that 55 KIAS was a good speed to help fill in the data curves, so data were collected at 55 KIAS. The points were flown by accelerating to the appropriate speed with trim fixed at neutral. A stick-fixed aft rap was performed followed approximately 3 seconds later by a stick fixed square pitch doublet. The aircraft was given approximately 5 seconds following the doublet for the resulting motions to damp. Damping happened much faster than this, especially at the 100 KIAS points. To ensure symmetrical square doublets a foam template was placed
5

HAVE BLADDER Edwards Air Force Base December 2005 Air Force Flight Test Center
over the control stick and on top of the pilot’s legs. This template had reference marks along the pitch axis of the control stick. The following approximate stick deflections were used for the doublets at the following speeds. At 100 KIAS a 1.0 inch rap was followed by a +/- 0.5 inch doublet. At 70 KIAS a 1.5 inch rap was followed by a +/- 1.0 inch doublet. At 40 KIAS a 2.0 inch rap was followed by a +/- 2.0 inch doublet. Lateral directional rap and doublets were performed at 100, 70, and 40 KIAS. As with the longitudinal points, data were also collected at 55 KIAS. The points were flown by accelerating to the appropriate speed with elevator trim fixed at neutral. A rudder rap was performed followed approximately 1 second later by an aileron rap in the opposite direction. Approximately 3 seconds after the aileron rap, a rudder doublet was performed followed 2 seconds later by a stick fixed roll doublet. The aircraft was given approximately 5 seconds for the resulting motions to damp. To ensure symmetrical aileron doublets, the foam template was placed laterally over the control stick and on top of the pilot’s legs. The following stick deflections were used for the roll doublets at the following speeds. At 100 KIAS a 1.0 inch rap was followed by a +/- 0.5 inch doublet. At 70 KIAS a 1.5 inch rap was followed by a +/- 1.0 inch doublet. At 40 KIAS a 2.0 inch rap was followed by a +/- 2.0 inch doublet. The rudder raps and rudder doublets were performed at approximately the same deflections but no measuring device was used. In addition to the raps and doublets, SHSSs, and deceleration maneuvers were performed. The SHSSs were flown at 40, 70 and 100 KIAS. Sideslip values of 4 degrees or more were achieved at these airspeeds. The Blanik’s production airspeed indicator became extremely inaccurate at beta values more than about 2 degrees. For this, the pilot would hold the airplane at the appropriate speed (trim fixed at neutral), note the pitch angle of the pitot boom with respect to the horizon and fly the maneuver using outside references. One-g decelerations were flown by accelerating the aircraft to approximately 110 KIAS then leveling off, holding a constant altitude and decelerating through 40 KIAS. Two-g decelerations were flown by accelerating to 110 KIAS rolling to approximately 60 degrees of bank while pulling the nose slightly above the horizon. The aircraft was decelerated under a 2g load factor. It was noted that if the pilot did not use aileron opposite the turn and top rudder that the Blanik would stabilize in a 2g, 55 KIAS spiral and would not continue to slow down. By forcing the nose to stay above the horizon in the manner stated above, a 2g load factor could be maintained until stall warning, which occurred at approximately 42 KIAS.
6

HAVE BLADDER Edwards Air Force Base December 2005 Air Force Flight Test Center
RESULTS AND ANALYSES The moments of inertia as measured in the ground test are presented in table 2.
Table 2: Moments of Inertia
2080 sl-ft2Ix1010 sl-ft2Iy2700 sl-ft2Iz190 sl-ft2Ixz
A discussion of moments of inertia data analysis is included in appendix C. The data recorded by the data acquisition (DAS) system was downloaded to a laptop PC and converted into MATLAB® files using a utility supplied by Athena. A MATLAB® program was written by the test team to convert to units required by the parameter identification (PID) software and to convert the measured voltages of the deflection potentiometers to surface positions. The maneuvers were identified using plots of control surfaces and the required time histories were converted to NASA GetData ASCII II format using MATLAB® code from Calspan Corporation (see appendix E for a sample data format). (A sample MATLAB® plot can be found in appendix B). The PCPID (reference 2) software used for estimating the stability derivatives was a shell application that provides some graphical user interface around NASA Dryden Unix based PID software (pEst). The PID software used the imported time histories above, plus a set of constants (inertias, measurements, weights, and c.g.). By going through a series of iterations of comparing computed (simulated) maneuvers to the recorded time histories, the PID software estimated the required set of derivatives (longitudinal or lateral-directional). The results are presented together with the total cost (error) and the contributing cost of each derivative. The PID software contained weight settings for each derivative. The weights were used to balance the costs of the estimated derivatives. Once a set of weights was determined by running several data points, the weights were held constant for all the data reduction process and final results. The response weights are presented in table 3.
Table 3: Response Weights
Alpha 2 2
Beta100
ay30
an2 p2 q4 r
theta 12 phi 15
7
HAVE BLADDER Edwards Air Force Base December 2005 Air Force Flight Test Center
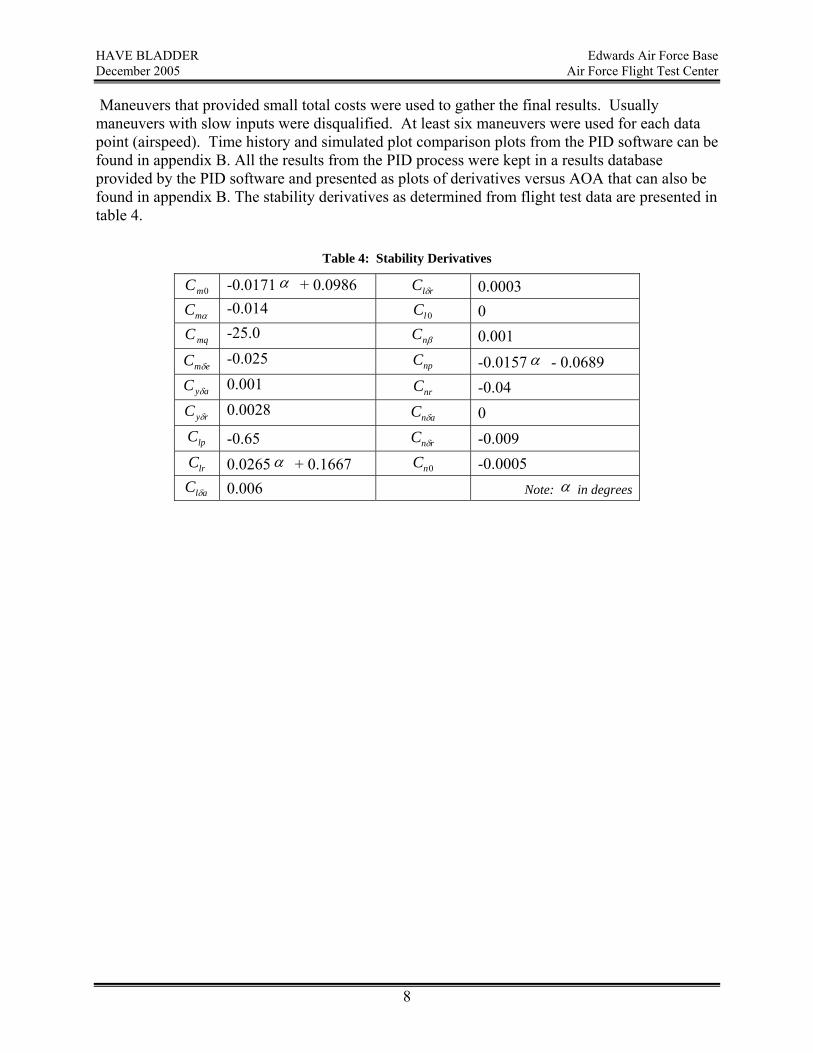
Maneuvers that provided small total costs were used to gather the final results. Usually maneuvers with slow inputs were disqualified. At least six maneuvers were used for each data point (airspeed). Time history and simulated plot comparison plots from the PID software can be found in appendix B. All the results from the PID process were kept in a results database provided by the PID software and presented as plots of derivatives versus AOA that can also be found in appendix B. The stability derivatives as determined from flight test data are presented in table 4.
Table 4: Stability Derivatives
0mC -0.0171 α + 0.0986 rlC δ 0.0003
αmC -0.014 0lC 0
mqC -25.0 βnC 0.001
emC δ -0.025 npC -0.0157 α - 0.0689
ayC δ 0.001 nrC -0.04
ryC δ 0.0028 anC δ 0
lpC -0.65 rnC δ -0.009
lrC 0nC 0.0265 α + 0.1667 -0.0005
alC δ 0.006 Note: α in degrees
8

HAVE BLADDER Edwards Air Force Base December 2005 Air Force Flight Test Center
CONCLUSIONS AND RECOMMENDATIONS Project HAVE BLADDER was tasked with determining the moments of inertia and the stability derivatives for the L-23 Super Blanik as part of a continuing dynamic soaring investigation. By flying 43 flights to collect data and using parameter identification data analysis tools, the following stability derivatives were determined (table 5).
Table 5: Stability Derivatives
0mC -0.0171 α + 0.0986 rlC δ 0.0003
αmC -0.014 0lC 0
mqC -25.0 βnC 0.001
emC δ -0.025 npC -0.0157 α - 0.0689
ayC δ 0.001 nrC -0.04
ryC δ 0.0028 anC δ 0
lpC -0.65 rnC δ -0.009
lrC 0nC 0.0265 α + 0.1667 -0.0005
alC δ 0.006 Note: α in degrees
9

HAVE BLADDER Edwards Air Force Base December 2005 Air Force Flight Test Center
This page intentionally left blank.
10

HAVE BLADDER Edwards Air Force Base December 2005 Air Force Flight Test Center
REFERENCES
1. Borror, Sean, Major, USAF, USAF TPS L-23 Super Blanik Drag Polar and Preliminary Investigation of Dynamic Soaring, USAF TPS-TIM-04-04, Air Force Flight Test Center, Edwards AFB, California, September 2004.
2. Mattingly, Patrick S., PCPID Shell written for Air Force Flight Test Center, SE/TA
subcontract 06-93A024-40, Quartic Engineering, Inc.
3. de Jong, R.C., Determination of Aircraft Moments and Products of Inertia, A New Method, Delft University of Technology, Department of Aerospace Engineering, April, 1985.
1

HAVE BLADDER Edwards Air Force Base December 2005 Air Force Flight Test Center
This page intentionally left blank.
2

HAVE BLADDER Edwards Air Force Base December 2005 Air Force Flight Test Center
APPENDIX A: Lessons Learned Facilities The use of the hangar at North Base was instrumental in the effective completion of the HAVE BLADDER test missions. Because the hangar was right off the lakebed, operations could be conducted quickly and efficiently in the North Base Remote Operations Area, and in a manner that did not disrupt normal Edwards flying operations. Data Logging For the first three test days, data logging was initiated within the DAS using a laptop computer loaded with Athena’s GS211GUI interface software connected to the DAS via an RS-232 cable. This resulted in aircraft parameters being logged while the glider was on tow because the test team had no way to turn data logging on and off during flight. During modifications to the DAS, the data stream was changed resulting in incompatibility with the previously programmed COMPAQ iPAQ pocket PC used for in-flight DAS inputs. This resulted in data files much larger than required or desired. Download time was 15 minutes per sortie. By the fourth test day, the iPAQ had been reprogrammed and was functionally checked. This allowed for smaller data files, less download time, and thus three times more productive testing. Installation Error During initial data reduction efforts, abnormalities in alpha and beta measurements were noted. In particular, there seemed to be a high correlation between the two values. During the DAS calibration sortie, this correlation was not noticed as alpha and beta were examined independently and seemed to be of the proper sense and magnitude for the particular calibration test maneuvers. Upon inspection of the DAS inputs, the alpha and beta pneumatic sources were found to be reversed. Although the tubes were color coded, they were improperly connected. Configuration of DAS wiring and installation should be independently confirmed by a test team member not involved in the installation process. Lag in Pneumatics Project SENIOR IDS suspected there were significant time lags in the alpha measurements on the L-23 Super Blanik. Since this measurement came from a pneumatic system, Mr. James Murray speculated pneumatic lag was the cause. Mr. Murray measured the pneumatic lag by applying step inputs to the alpha and beta ports. The response was modeled as a first-order time constant of 32 milliseconds. This corresponded to a 70 millisecond rise time from 10-90% of the step response. This lag was considered inconsequential to data reduction efforts. Data analysis proved this to be the case for stability derivative determination with PCPID. The lag could be seen by comparing recorded time histories to PCPID simulations, and it did not appear to effect the software’s ability to calculate the stability derivatives.
A-1

HAVE BLADDER Edwards Air Force Base December 2005 Air Force Flight Test Center
This page intentionally left blank.

HAVE BLADDER Edwards Air Force Base December 2005 Air Force Flight Test Center
APPENDIX B: Supplemental data plots
Figure B-1: MATLAB Lateral Directional Time History
155 160 165 170 175 180 185 190 195 200
-10
0
10
LatDir Rap Dublet, controls position
AileronsRudder
155 160 165 170 175 180 185 190 1956080
100120
Aiespeed
Aierspeed (f/s)
155 160 165 170 175 180 185 190 195-10
0
10LatDir Rap Dublet, Beta
Bet
a(de
g)
155 160 165 170 175 180 185 190 195
-10
0
10
20LatDir Rap Dublet, Yaw Rate
run time sec
Yaw
Rat
e
155 160 165 170 175 180 185 190 195-10
0
10
20LatDir Rap Dublet, Roll Rate
run time sec
Rol
l Rat
e
155 160 165 170 175 180 185 190 195 200
-40
-20
0
20
LatDir Rap Dublet, Roll
run time sec
Rol
l(deg
)
Data Basis: Flight Test Dates: 18-19 NOV 2005 Test A/C: Blanik L-23 DAS: GS-111
B-1

HAVE BLADDER Edwards Air Force Base December 2005 Air Force Flight Test Center
Figure B-2: PID Lat-Dir sample time history comparison plots
Figure B-3: PID Longitudinal time history comparison plots
Data Basis: Flight Test Dates: 18-19 NOV 2005 Test A/C: Blanik L-23 DAS: GS-111 PID: PCPID Ver 2.4
B-2
HAVE BLADDER Edwards Air Force Base December 2005 Air Force Flight Test Center
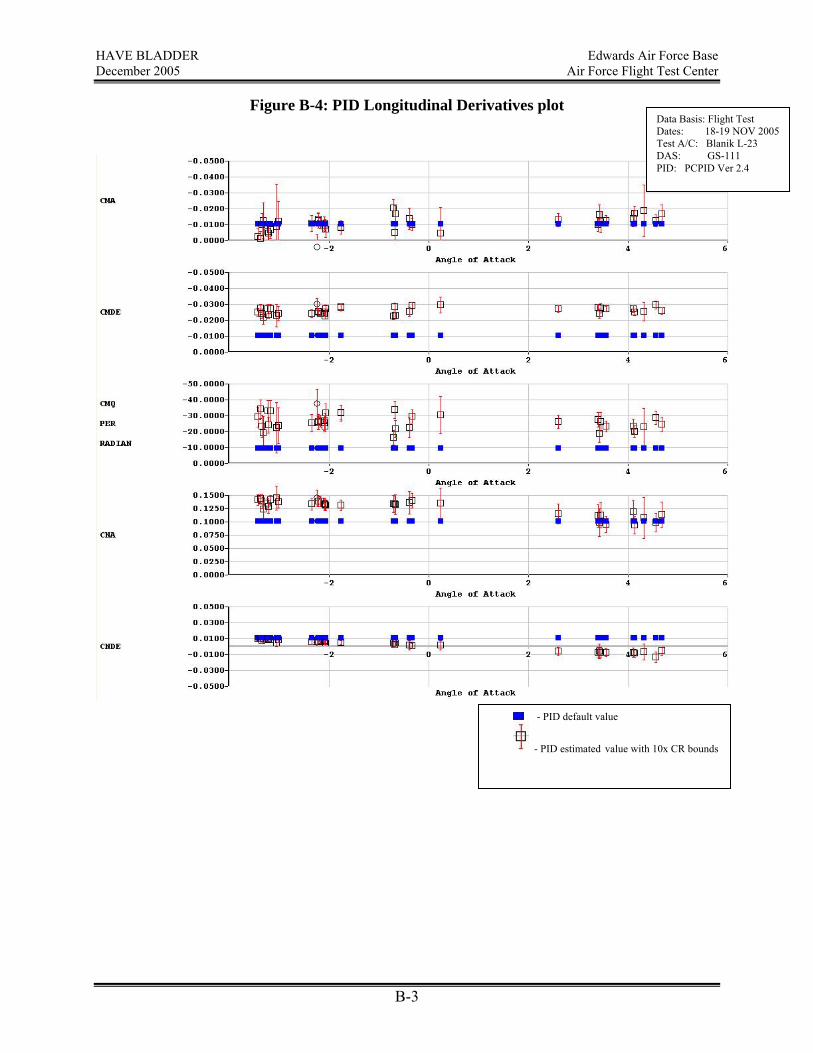
Figure B-4: PID Longitudinal Derivatives plot
- PID default value
- PID estimated value with 10x CR bounds
Data Basis: Flight Test Dates: 18-19 NOV 2005 Test A/C: Blanik L-23 DAS: GS-111 PID: PCPID Ver 2.4
B-3

HAVE BLADDER Edwards Air Force Base December 2005 Air Force Flight Test Center
Figure B-5: PID Lateral Directional Derivatives plot
- PID default value
- PID estimated value with 10x CR bounds
Data Basis: Flight Test Dates: 18-19 NOV 2005 Test A/C: Blanik L-23 DAS: GS-111 PID: PCPID Ver 2.4
B-4
HAVE BLADDER Edwards Air Force Base December 2005 Air Force Flight Test Center
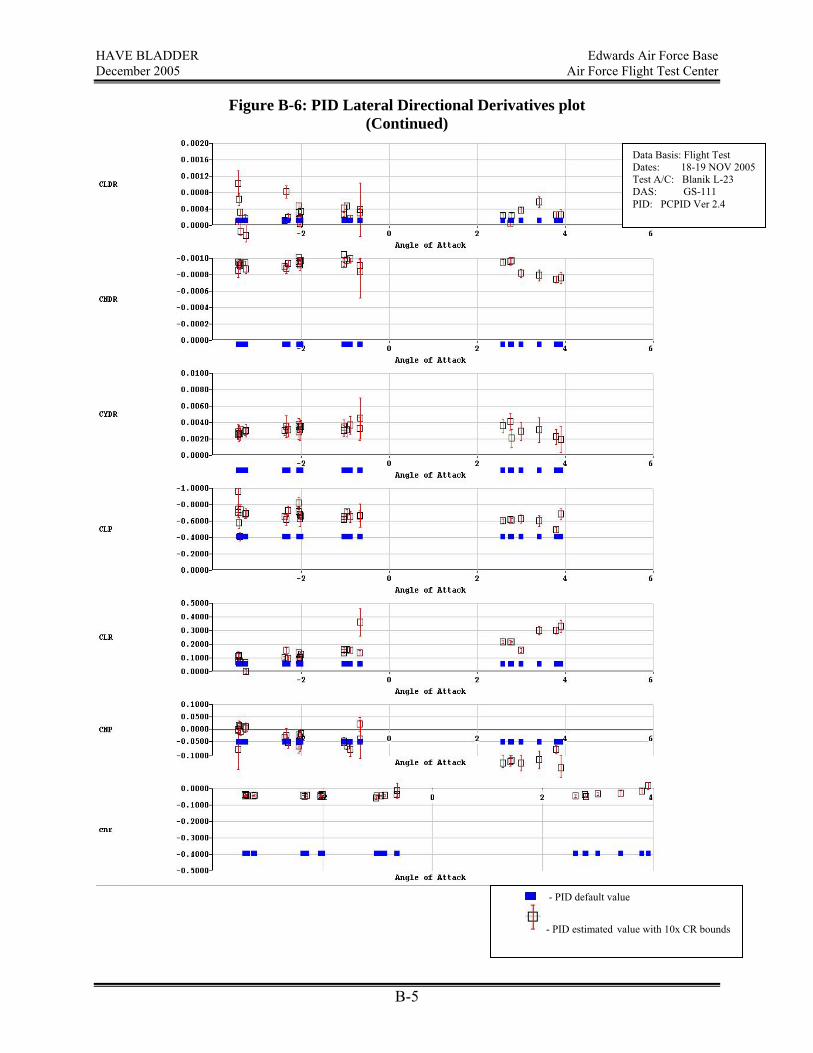
Figure B-6: PID Lateral Directional Derivatives plot (Continued)
- PID default value
- PID estimated value with 10x CR bounds
Data Basis: Flight Test Dates: 18-19 NOV 2005 Test A/C: Blanik L-23 DAS: GS-111 PID: PCPID Ver 2.4
B-5

HAVE BLADDER Edwards Air Force Base December 2005 Air Force Flight Test Center
This page intentionally left blank.
B-6

HAVE BLADDER Edwards Air Force Base December 2005 Air Force Flight Test Center
APPENDIX C: Moments of Inertia The aircraft was suspended from cables as shown in figure C-1. A mounting bracket was attached to the airframe, and the aircraft was suspended through the bracket by four ¼ inch steel cables. Two cables were disconnected at-a-time depending on the swing motion desired. In figure C-1, the forward and rear cables are connected allowing roll-yaw motions.
Figure C-1: Inertia Swing
Pitch, roll, and yaw rates were recorded for both the yaw-roll and yaw-pitch swing configurations, as shown in figures C-2 and C-3. A parameter estimation technique developed by R. C. de Jong (reference 3) was implemented in MATLAB® by Mr. James Murray at NASA Dryden for data reduction. DeJong derived a mathematical model for a suspension construction in which the aircraft oscillates around different axes simultaneously. Using this model, the actual aircraft and swing properties, and the time histories, the inertias were estimated. The moments of inertia found using four yaw-roll and four yaw-pitch time histories are shown in table C-1 (with average error bounds).
C-1

HAVE BLADDER Edwards Air Force Base December 2005 Air Force Flight Test Center
Figure C-2: Sample Yaw-Roll Time History
-0.03
-0.02
-0.01
0
0.01
0.02
0.03
0.04
880 885 890 895 900 905 910 915 920 925 930
Time (s)
Rat
e (r
ad/s
)
Yaw RateRoll Rate
Figure C-3: Sample Yaw-Pitch Time History
-0.08
-0.06
-0.04
-0.02
0
0.02
0.04
0.06
0.08
4665 4670 4675 4680 4685 4690 4695 4700 4705 4710
Time (s)
Rate
(rad
/s)
Yaw RatePitch Rate
Table C-1: L-23 Super Blanik Moments of Inertia
2080 sl-ft2 ± 40 Ix1010 sl-ft2 ± 20 Iy2700 sl-ft2 ± 40 Iz190 sl-ft2 ± 20 Ixz
The vertical center of gravity (c.g.) was based on a static experiment during which a known mass was attached to the wingtip. Vertical c.g. was calculated from the resulting roll angle and moment balance. Vertical c.g. position was 1.988 feet below the bottom of the suspension frame. This vertical c.g. measurement was fixed for the dynamic (inertia swing) analysis.
C-2

HAVE BLADDER Edwards Air Force Base December 2005 Air Force Flight Test Center
The c.g. and moments of inertia of the suspension frame and associated attachment hardware were estimated, and the mass and inertia contributions of the suspension cables were ignored. The contributions of these items were analytically subtracted from the measured c.g. and inertia values to yield final results. The corrections were less than 10 slug-ft2 in all cases, which was considered negligible given the average error of the estimated total inertias.
C-3

HAVE BLADDER Edwards Air Force Base December 2005 Air Force Flight Test Center
This page intentionally left blank.

HAVE BLADDER Edwards Air Force Base December 2005 Air Force Flight Test Center
APPENDIX D: Instrumentation
TABLE OF CONTENTS SENSORS D-2 Guidestar GS-111m D-2 Air Data Probe D-2 Resistive Temperature Detector D-2 Surface Position Transducers D-3 GS-111m Interface D-4 Laptop PC Interface D-4 Handheld Pocket PC D-4 Point-to-Point Protocol Terminal D-4 Data Acquisition D-4 Graphical User Interface D-5 Initiating the GUI D-5 GUI Main Page D-5 Pull Down Menus D-5 Pushbuttons D-6 Data Download D-6 Modifying Internal Settings D-7 Data File Extraction D-7 Contact List D-7
D-1

HAVE BLADDER Edwards Air Force Base December 2005 Air Force Flight Test Center
SENSORS The instrumentation system installed on the Blanik consisted of an Inertial Measurement Unit (IMU), an air data probe, control surface position transducers, analog-to-digital converter and a temperature probe. Interface control documents and user manuals for these commercially available products are available on the attached data CD. The IMU and analog to digital converter were mounted on an adjustable plate and aligned with the centerline of the aircraft. The centerline was defined by the rib running along the top surface of the aft fuselage. The plate was then tilted to align it with the aircraft fuselage reference line. The fuselage reference line was defined by two marks on the side of the glider at the forward and aft ends. The plate was tilted left and right to align with the leading edge of the wing. Finally, a laser sight was used to align the air data probe with the fuselage reference line and center it along the aircraft centerline. All angular measurements were therefore referenced to a body axis coordinate system whose x-axis was aligned with the fuselage reference line and a y-axis aligned with the wing leading edge at the root. GUIDESTAR GS-111M
An Athena Controls Guidestar 111m (GS-111m) inertial measurement unit (IMU) served as the central component in the instrumentation system. The GS-111m utilized accelerometers, angular rate sensors, GPS, and a magnetometer to compute a full inertial attitude solution. Pitot-Static pressures from a nose-mounted 5-hole probe were measured by the GS-111m to determine airspeed, altitude, angle-of-attack (AOA), and angle-of-sideslip (AOS). Pressure transducers on the TPS GS-111m had a dynamic range of ±26,221.9 Pa for AOA and AOS, and 16,596 Pa for airspeed. Total air temperature was measured by a resistive temperature detector (RTD) mounted under the right wing. The RTD voltage was sampled by a 14 bit analog-to-digital input on the GS-111m. Data were sampled and written to a 32 Mbyte onboard memory chip for post-flight download. The GS-111m updated its navigation solution at 50 Hz. The data sampling rate was software selectable with currently available rates of either 25 Hz or 50 Hz. The program began using a sample rate of 25 Hz, but due to data analysis requirements, switched to 50 Hz early during execution. The GS-111m was modified to accept a digital signal from an analog-to-digital converter that was wired to the position transducers. This hardware modification consisted of a circuit board housed in a generic black box that could be mounted anywhere in the proximity of the GS-111m and connected to the GS-111m using an RS-232 serial cable. The interface control document can be obtained from Athena Controls. A full description of the GS-111m can be obtained by contacting Athena Controls.
AIR DATA PROBE An air data probe purchased from Computer Instruments Corporation was used to measure static pressure, total pressure, AOA, and AOS. The initial design called for a constant 0.75” outer diameter probe. This was modified by increasing the diameter of the aft end up to 1.25” to provide sufficient wall thickness for attachment to the boom. The AOA and AOS measurements are made using a pressure differential, total pressure, and a scale factor as described in the Serial Interface Specification. The probe has a scale factor of 4.526366 1/rad. RESISTIVE TEMPERATURE DETECTOR The RTD purchased from Computer Instruments Corporation was used to measure total temperature. The platinum RTD had a nominal resistance of 500Ω and a scale factor of 0.00385 ohms/ohm/°C. The RTD was powered by an Action Instruments Ultra Slimpak G418-0001. A
D-2
HAVE BLADDER Edwards Air Force Base December 2005 Air Force Flight Test Center
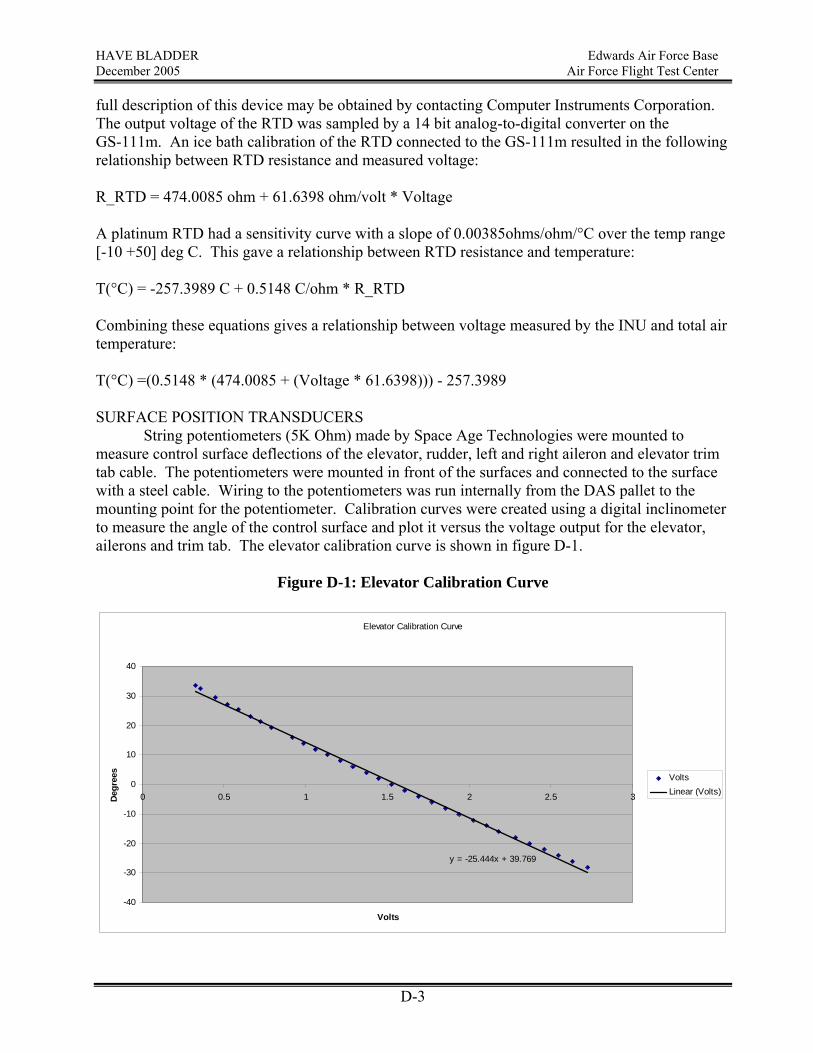
full description of this device may be obtained by contacting Computer Instruments Corporation. The output voltage of the RTD was sampled by a 14 bit analog-to-digital converter on the GS-111m. An ice bath calibration of the RTD connected to the GS-111m resulted in the following relationship between RTD resistance and measured voltage: R_RTD = 474.0085 ohm + 61.6398 ohm/volt * Voltage A platinum RTD had a sensitivity curve with a slope of 0.00385ohms/ohm/°C over the temp range [-10 +50] deg C. This gave a relationship between RTD resistance and temperature: T(°C) = -257.3989 C + 0.5148 C/ohm * R_RTD Combining these equations gives a relationship between voltage measured by the INU and total air temperature: T(°C) =(0.5148 * (474.0085 + (Voltage * 61.6398))) - 257.3989 SURFACE POSITION TRANSDUCERS String potentiometers (5K Ohm) made by Space Age Technologies were mounted to measure control surface deflections of the elevator, rudder, left and right aileron and elevator trim tab cable. The potentiometers were mounted in front of the surfaces and connected to the surface with a steel cable. Wiring to the potentiometers was run internally from the DAS pallet to the mounting point for the potentiometer. Calibration curves were created using a digital inclinometer to measure the angle of the control surface and plot it versus the voltage output for the elevator, ailerons and trim tab. The elevator calibration curve is shown in figure D-1.
Figure D-1: Elevator Calibration Curve
Elevator Calibration Curve
y = -25.444x + 39.769
-40
-30
-20
-10
0
10
20
30
40
0 0.5 1 1.5 2 2.5 3
Volts
Degr
ees
VoltsLinear (Volts)
D-3

HAVE BLADDER Edwards Air Force Base December 2005 Air Force Flight Test Center
Calibration of the rudder was accomplished by finding the center of rotation on the top of the rudder. A protractor was then placed above this point and deflection angles were read using the seam of the rudder that described the left-right plane of symmetry. All control surface calibration curves were linear and can be found on the data CD in the “Control surface calibration.xls” file. GS-111M INTERFACE Interface to the GS-111m was made via five serial ports accessible through 51 pin connectors. Each serial port was configured for RS-232 communication at 115.2 kbit/s. The slow data rate was chosen primarily to ensure reliable communication with the Compaq iPAQ handheld computer used for cockpit data display. Operationally, only ports 1-3 were used. LAPTOP PC INTERFACE Serial port 1 was used to interface with a laptop PC for INU initialization. After applying power to the INU, an Athena Graphical User Interface (GUI) was used to set internal INU parameters and switch the INU into the Air Mode. After initialization, the laptop was disconnected prior to flight. HANDHELD POCKET PC Serial port 2 was used to communicate with a Compaq iPAQ PDA. The PDA displayed flight parameters in the cockpit and had the capability to start and stop data logging. The PDA was connected to the GS-111m using a custom cable terminated with a standard DB9 connector. POINT-TO-POINT PROTOCOL TERMINAL Serial port 3 was configured for a point-to-point protocol (PPP) connection to a PC. The port speed was set by Athena Controls to be 115.2 kbit/s. The port was used to download test data to a laptop using WS-FTP 6.0 software. The slow communication speed resulted in fairly long download times averaging 1min/Mbyte. The PPP connection was also used to upload software updates for functions such as changing the onboard memory sampling rate. DATA ACQUISITION The list of parameters written to memory was software programmable, but required support from Athena to perform. Reconfiguring the GS-111m was accomplished with a simple spreadsheet based program which produces a configuration file that must be downloaded to the unit. Initially, a 25 Hz recording rate was used, this was later changed to 50 Hz using a file sent to TPS by Athena. A list of recorded parameters is given in the USAF addendum to the Serial Interface Specification. Data logged by the Guidestar was saved in time and date tagged files using the convention: INSmmmddhhmmssyyyy. The TPS customized data stream occupied frame 4 as listed in the serial interface spec addendum and took 128 bytes. At 50 Hz, data frame 4 consumed 3.125 kbytes/sec. In addition to frame 4, the following frames were stored to onboard memory: Frame 2 at 1Hz = 173 bytes/sec Frame 3 at 10Hz = 740 bytes/sec Frame 8 at 50Hz = 1650 bytes/sec
D-4

HAVE BLADDER Edwards Air Force Base December 2005 Air Force Flight Test Center
This resulted in a storage time of approximately 45 minutes at a 50 Hz sample rate. GRAPHICAL USER INTERFACE Athena provided a beta version of their GUI to initialize the GS-111m. The GUI could be started anytime, before or after applying power to the GS-111m. Serial port 1 could be disconnected and reconnected at any time without disrupting INU function. The GUI was used operationally to initialize the GS-111m and place it in the Air Mode. The serial port was then disconnected prior to flight. As described below, the GUI could be used to initiate on-board data logging. This method was used early in the program, but later replaced by starting data logging via the PDA just prior to release from tow. This resulted in much smaller file sizes and a resulting decrease in download time. INITIATING THE GUI After attaching the serial cable and applying power to the INU, the GUI was started by double-clicking on the program shortcut, selecting the appropriate communications port (normally Comm 1), selecting the baud rate (115200), checking the box to “Check for compression,” then clicking OK. GRAPHICAL USER INTERFACE MAIN PAGE A screen shot of the main page is shown in figure D-2 below with a description of each window and button.
Figure D-2: GS-111m Graphical User Interface
PULL DOWN MENUS Datalogging -- Used to control real-time data logging to an attached PC. Start – Started data logging to PC Stop – Stopped data logging to PC
Options – Allowed user to enter a filename that data was logged to on a connected PC and allowed the entry of a downsample divisor to reduce the effective sampling rate (only for data logging to a PC).
D-5

HAVE BLADDER Edwards Air Force Base December 2005 Air Force Flight Test Center
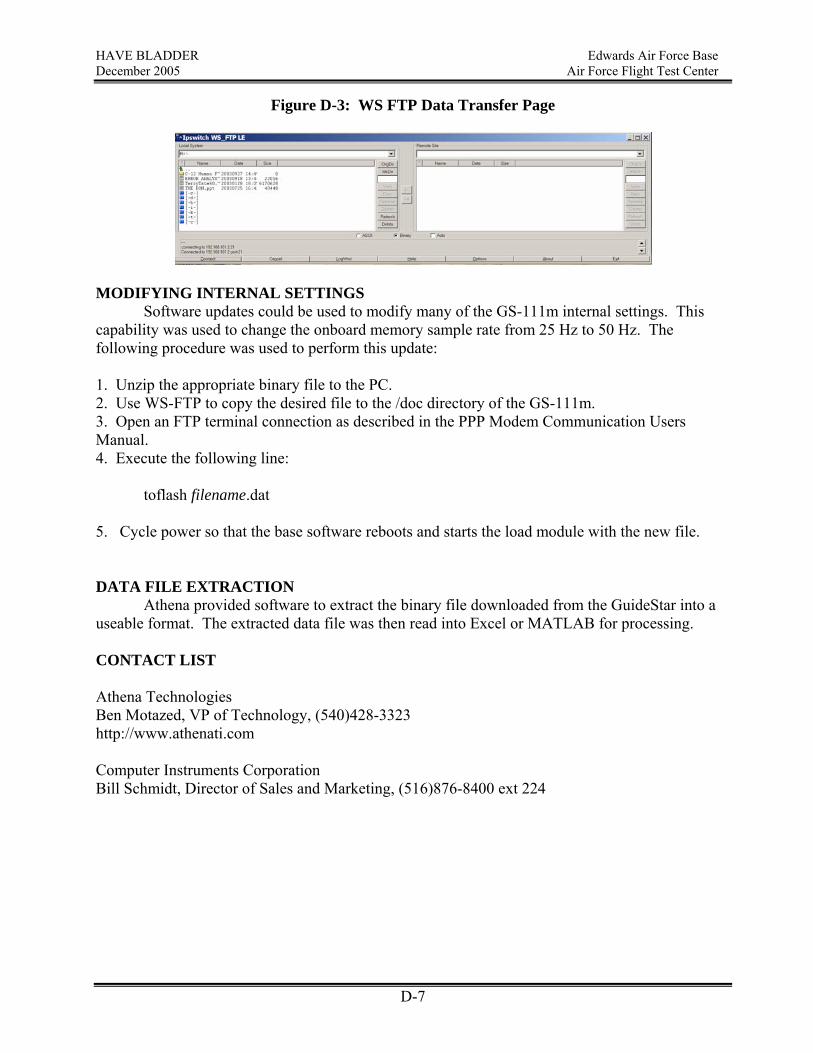
Packet Configuration Menu -- The INS GUI Packet Configuration option allowed the user to configure the GuideStar to stop sending acknowledgement packets in response to Kollsman and GPS Ant/Mnt/Box configuration packets from the GUI. By default these acknowledgements are enabled (indicated by the check marks next to these items in the pull down menu). The GUI will not display the Kollsman and GPS Ant/Mnt/Box configuration updates entered by the user if the acknowledgement packets were disabled. Query Menu -- Allowed the user to query the GuideStar for the menu item selected by the user. For example, the user could query the GuideStar for the Kollsman by selecting the Kollsman item in this menu. PUSHBUTTONS Set Position -- Could be used to override GPS sensed position. Set True Heading – Overrode heading sensed by magnetometer. Set Wind -- Manually entered wind direction and magnitude. Set Kollsman -- Entered the desired altimeter setting in Pascals (standard is 101353). Toggle Mag -- Used to manually enter magnetic field measurements. GPS -- Disabled GPS input when depressed. Air Mode Cmd -- Switched to Air Mode when depressed. Current mode displayed in adjacent window. Log, Inc and Clear -- The Log button started real-time data logging to a PC through the serial port. The Inc button allows the user to insert events into the PC data logging (using Data Logging pull down menu). The Inc button incremented the event number (displayed next to the Clear button). The INS GUI inserted this event number in the PC log file at the time the Inc button was pressed. The Clear button reset the event number back to 0. This feature was not implemented in the GuideStar on-board data logging. Set Box Config -- Pushing this button brought up a second window where GPS antenna offset, mount code, and air data probe constant could be set. Query Mag HI/SI -- This button was used to display the hard and soft iron magnetometer offsets calculated by the GS-111m. DATA DOWNLOAD Data were downloaded using a PPP modem connection to serial port 3 and the WS-FTP software. Instructions for data download are available from Athena Controls. Figure D-3 shows the window used to transfer data from the GS-111m to a connected PC. The target should be selected in the window on the left and the data type must be set to “Binary.” File transfer was accomplished by selecting the correct file on the right (not shown) and pressing the left arrow button. After data were transferred successfully, the delete button was used to clear the GS-111m memory for future tests.
D-6
HAVE BLADDER Edwards Air Force Base December 2005 Air Force Flight Test Center
Figure D-3: WS FTP Data Transfer Page
MODIFYING INTERNAL SETTINGS Software updates could be used to modify many of the GS-111m internal settings. This capability was used to change the onboard memory sample rate from 25 Hz to 50 Hz. The following procedure was used to perform this update: 1. Unzip the appropriate binary file to the PC. 2. Use WS-FTP to copy the desired file to the /doc directory of the GS-111m. 3. Open an FTP terminal connection as described in the PPP Modem Communication Users Manual. 4. Execute the following line: toflash filename.dat 5. Cycle power so that the base software reboots and starts the load module with the new file.
DATA FILE EXTRACTION Athena provided software to extract the binary file downloaded from the GuideStar into a useable format. The extracted data file was then read into Excel or MATLAB for processing. CONTACT LIST Athena Technologies Ben Motazed, VP of Technology, (540)428-3323 http://www.athenati.com Computer Instruments Corporation Bill Schmidt, Director of Sales and Marketing, (516)876-8400 ext 224
D-7

HAVE BLADDER Edwards Air Force Base December 2005 Air Force Flight Test Center
This page intentionally left blank.
HAVE BLADDER Edwards Air Force Base December 2005 Air Force Flight Test Center
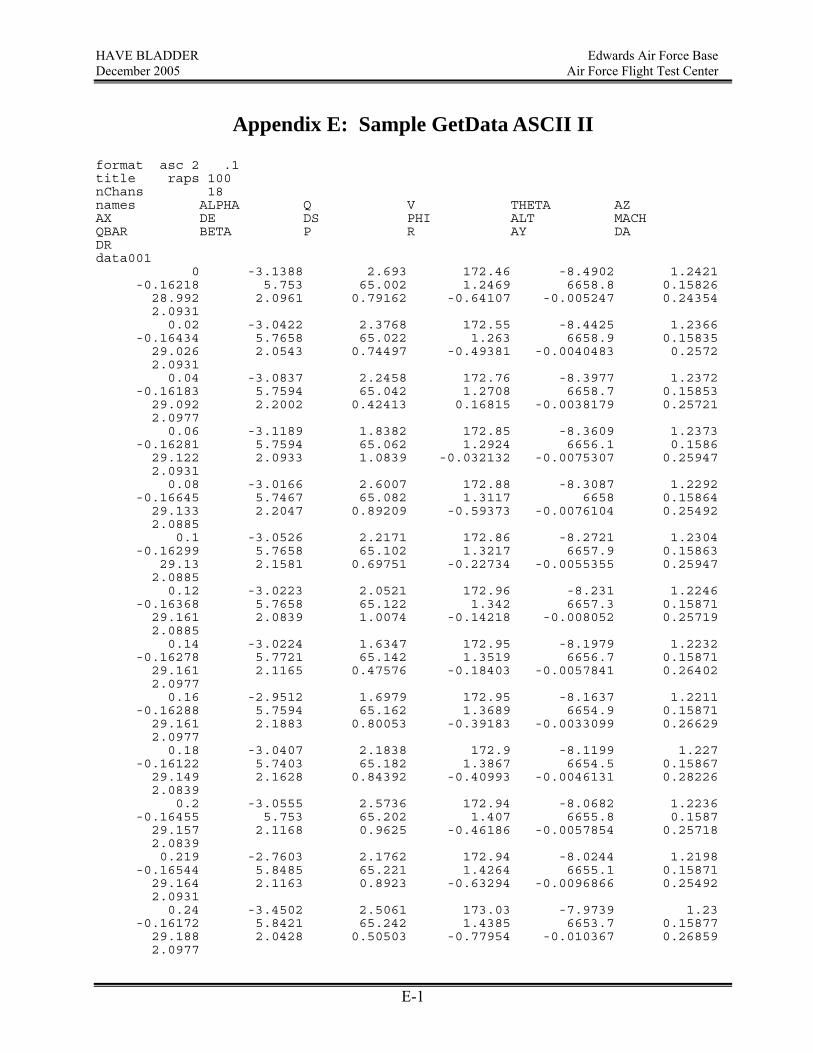
Appendix E: Sample GetData ASCII II format asc 2 .1 title raps 100 nChans 18 names ALPHA Q V THETA AZ AX DE DS PHI ALT MACH QBAR BETA P R AY DA DR data001 0 -3.1388 2.693 172.46 -8.4902 1.2421 -0.16218 5.753 65.002 1.2469 6658.8 0.15826 28.992 2.0961 0.79162 -0.64107 -0.005247 0.24354 2.0931 0.02 -3.0422 2.3768 172.55 -8.4425 1.2366 -0.16434 5.7658 65.022 1.263 6658.9 0.15835 29.026 2.0543 0.74497 -0.49381 -0.0040483 0.2572 2.0931 0.04 -3.0837 2.2458 172.76 -8.3977 1.2372 -0.16183 5.7594 65.042 1.2708 6658.7 0.15853 29.092 2.2002 0.42413 0.16815 -0.0038179 0.25721 2.0977 0.06 -3.1189 1.8382 172.85 -8.3609 1.2373 -0.16281 5.7594 65.062 1.2924 6656.1 0.1586 29.122 2.0933 1.0839 -0.032132 -0.0075307 0.25947 2.0931 0.08 -3.0166 2.6007 172.88 -8.3087 1.2292 -0.16645 5.7467 65.082 1.3117 6658 0.15864 29.133 2.2047 0.89209 -0.59373 -0.0076104 0.25492 2.0885 0.1 -3.0526 2.2171 172.86 -8.2721 1.2304 -0.16299 5.7658 65.102 1.3217 6657.9 0.15863 29.13 2.1581 0.69751 -0.22734 -0.0055355 0.25947 2.0885 0.12 -3.0223 2.0521 172.96 -8.231 1.2246 -0.16368 5.7658 65.122 1.342 6657.3 0.15871 29.161 2.0839 1.0074 -0.14218 -0.008052 0.25719 2.0885 0.14 -3.0224 1.6347 172.95 -8.1979 1.2232 -0.16278 5.7721 65.142 1.3519 6656.7 0.15871 29.161 2.1165 0.47576 -0.18403 -0.0057841 0.26402 2.0977 0.16 -2.9512 1.6979 172.95 -8.1637 1.2211 -0.16288 5.7594 65.162 1.3689 6654.9 0.15871 29.161 2.1883 0.80053 -0.39183 -0.0033099 0.26629 2.0977 0.18 -3.0407 2.1838 172.9 -8.1199 1.227 -0.16122 5.7403 65.182 1.3867 6654.5 0.15867 29.149 2.1628 0.84392 -0.40993 -0.0046131 0.28226 2.0839 0.2 -3.0555 2.5736 172.94 -8.0682 1.2236 -0.16455 5.753 65.202 1.407 6655.8 0.1587 29.157 2.1168 0.9625 -0.46186 -0.0057854 0.25718 2.0839 0.219 -2.7603 2.1762 172.94 -8.0244 1.2198 -0.16544 5.8485 65.221 1.4264 6655.1 0.15871 29.164 2.1163 0.8923 -0.63294 -0.0096866 0.25492 2.0931 0.24 -3.4502 2.5061 173.03 -7.9739 1.23 -0.16172 5.8421 65.242 1.4385 6653.7 0.15877 29.188 2.0428 0.50503 -0.77954 -0.010367 0.26859 2.0977
E-1

HAVE BLADDER Edwards Air Force Base December 2005 Air Force Flight Test Center
0.259 -3.026 2.365 173.08 -7.9263 1.2333 -0.16453 5.8612 65.261 1.4475 6653.1 0.15882 29.207 2.0816 0.35813 -0.7633 -0.010866 0.2663 2.0977 0.28 -3.0087 2.5276 173.17 -7.8756 1.2339 -0.16434 5.8485 65.282 1.451 6652.7 0.15891 29.238 2.0525 0.14869 -0.24895 -0.0061431 0.26631 2.0885 0.299 -3.0796 2.3619 173.18 -7.8282 1.2378 -0.16452 5.8739 65.301 1.4561 6655.2 0.15891 29.238 2.0459 0.21044 -0.41178 -0.008398 0.25263 2.107 0.32 -3.0369 2.1772 173.15 -7.7926 1.2375 -0.16432 5.8548 65.322 1.4576 6651.3 0.15887 29.226 2.125 0.24785 -0.58125 -0.0092604 0.26858 2.0885 0.339 -3.1474 2.3575 173.1 -7.7454 1.2291 -0.16496 5.893 65.341 1.4687 6651.5 0.15884 29.215 2.1451 0.54173 -0.17395 -0.0091505 0.29813 2.1116 0.36 -3.0781 1.9977 173.21 -7.7047 1.2219 -0.1643 5.8421 65.362 1.4736 6651.4 0.15894 29.253 2.2074 0.21585 -0.29538 -0.009003 0.30052 2.0885 0.379 -3.2106 1.7207 173.15 -7.6701 1.2159 -0.16572 5.8421 65.381 1.4679 6651.4 0.15889 29.234 2.1438 -0.31682 -0.2909 -0.0044859 0.26858 2.0977 0.4 -3.2033 1.7091 173.19 -7.6356 1.209 -0.16263 5.8676 65.402 1.4629 6650.8 0.15893 29.248 2.0843 -0.32401 -0.63584 -0.00099874 0.2845 2.1023 0.419 -3.1174 2.2664 173.14 -7.59 1.2006 -0.16248 5.8739 65.421 1.469 6651.8 0.15888 29.229 2.0795 0.23617 -0.58459 -0.00020577 0.27766 2.0931 0.44 -3.1891 2.045 173 -7.5489 1.1942 -0.16348 5.8866 65.442 1.4728 6649.1 0.15875 29.184 2.0431 0.13375 -0.51709 -0.0058047 0.28223 2.0931 0.46 -3.2479 2.1141 172.88 -7.5064 1.1888 -0.16337 5.8739 65.462 1.4792 6648.5 0.15863 29.141 2.0267 0.27736 -0.38893 -0.011381 0.27765 2.1254
E-2
HAVE BLADDER Edwards Air Force Base December 2005 Air Force Flight Test Center
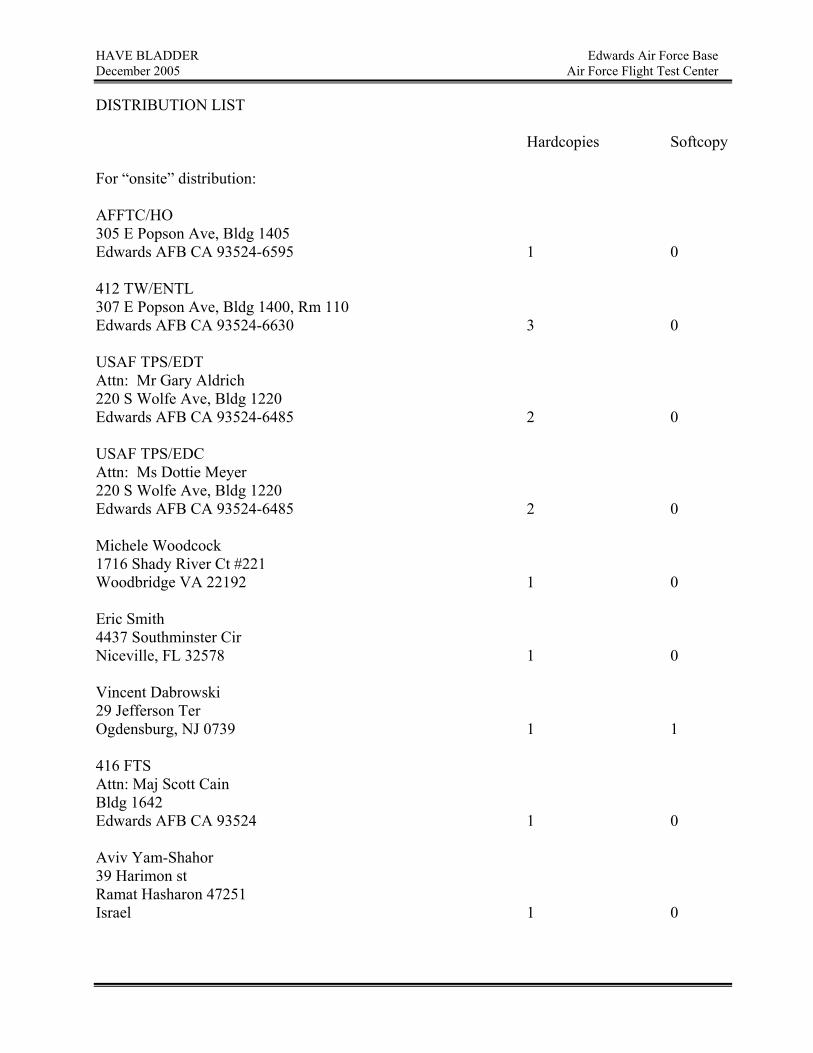
DISTRIBUTION LIST Hardcopies Softcopy For “onsite” distribution: AFFTC/HO 305 E Popson Ave, Bldg 1405 Edwards AFB CA 93524-6595 1 0 412 TW/ENTL 307 E Popson Ave, Bldg 1400, Rm 110 Edwards AFB CA 93524-6630 3 0 USAF TPS/EDT Attn: Mr Gary Aldrich 220 S Wolfe Ave, Bldg 1220 Edwards AFB CA 93524-6485 2 0 USAF TPS/EDC Attn: Ms Dottie Meyer 220 S Wolfe Ave, Bldg 1220 Edwards AFB CA 93524-6485 2 0 Michele Woodcock 1716 Shady River Ct #221 Woodbridge VA 22192 1 0 Eric Smith 4437 Southminster Cir Niceville, FL 32578 1 0 Vincent Dabrowski 29 Jefferson Ter Ogdensburg, NJ 0739 1 1 416 FTS Attn: Maj Scott Cain Bldg 1642 Edwards AFB CA 93524 1 0 Aviv Yam-Shahor 39 Harimon st Ramat Hasharon 47251 Israel 1 0

HAVE BLADDER Edwards Air Force Base December 2005 Air Force Flight Test Center
412 TW/ENFA Attn: Mr Fred Webster 30 N Wolfe Ave, Bldg 1609 Edwards AFB CA 93524-1167 1 0 For “offsite” distribution: Defense Technical Information Center (DTIC) 8725 John J. Kingman Rd, Ste 0944 ATTN: Willis Smith (DTIC-OCA) Fort Belvoir, VA 22060-6218 1 0