usa coden: jasrhb journal of applied science and … · (1937-1940) and meulaboh, aceh (1940). on...
TRANSCRIPT

www.scientiaresearchlibrary.com tAvailable online a
Scientia Research Library ISSN 2348-0416 USA CODEN: JASRHB
Journal of Applied Science And Research, 2014, 2 (1):11-29 )http://www.scientiaresearchlibrary.com/arhcive.php(
An Eye-Bird View of Facing Scarcity of Gold Mining in Indonesia
Ukar W. Soelistijo1 , Binarko Santoso2, Triswan Suseno3
1University of Islam Bandung (UNISBA),Institute of Technology Bandung (ITB),R and D Centre for
Mineral and Coal Technology,Bandung 2R and D Centre for Mineral and Coal Technology, Bandung 3R and D Centre for Mineral and Coal Technology, Bandung
ABSTRACT It is realized that based on the life time of extraction of the existing gold deposits in Indonesia, gold production faces scarcity or does not exceed within the next thirty years from now or seventy years after the COW production started in the early of 1970s, it is recommended that the new continuing activity of exploration should be reinvented with the new climate of investment policy including fiscal regime and the right supportive regulation should be enforced. Modification or improvement of the related regulations to the mining activity such as the laws or regulations of forestry, environmental protection, tax, regional autonomy, and labor should also necessarily be carried out. Toward creating this condition, the new policy regime should be reintroduced with the spirit of creating new incentives. Geologically, the prospective exploratory area could be carried out in volcanic arc, epithermal zone, ‘ring of fire’ and even in gold-
bearing sedimentary rocks.
Key words: Indonesia, gold mining, scarcity
INTRODUCTION
Geology Geologically, areas where gold and silver mineralization process occurs are usually concentrated in the area stretching from the northern to the southern Sumatera, and then continued on to the island of Java. Besides gold and silver, in some area platinum is also discovered in addition to the sulphide minerals such as copper, lead and zinc. Ore deposits are found in the earth crusts as the results of epithermal and hydrothermal activities affected by the andesite volcanic activity during the Middle and Upper Tertiary period. Furthermore, the mineralization process is also affected by the andesitic, liparitic, and granitic rock intrusions, and also due to the metasomatic contacts with the shale and slate of the Paleozoic period. The gold mineralizations in Western Kalimantan are different, and addition to gold and silver, other sulphidic minerals are also discovered. The area belongs to the so called basement complex with intrusive bodies of various ages from the Pre-Upper Triassic to Post-Paleogene, and various
Ukar W. Soelistijo1 et al J. of Appl. Sci.& Res., 2014, 2(1):11-29
compositions ranging from granitic to andesitic. Gold mineralization in North Sulawesi actually has been known long ago, and it has been exploited to some extent although it has never really been known. An Australian company, PT Tropic Endeavor Indonesia which signed the contract of work on 10 July 1970, recently discovered some veins in the Wohudu Breccia within the copper, lead and zinc rich volcanic rocks in the Gorontalo region. Besides the primary gold, gold is also discovered as the by-product of primary copper deposits. In addition, the placer gold deposits are discovered in some other areas. Gold deposits are also found at Gosowong in Halmahera island. Then it was also known as porphiry deposit associated with copper and silver in the belt of Jaya Wijaya mountain range in Papua which is currently exploited by PT Freeport Indonesia Company. The newest big gold deposit as associated mineral copper was recently found out in Sumbawa island and then in 1999 was initially mined by PT Newmont Nusa Tenggara. (Sunarya, 1989; Erickson, 1992). Statistical reserves of gold deposits in Indonesia per 2001 can be seen in Table 1 (Anonymous (a) up to Anonymous (p)), and the map of gold deposits and occurences in their Indonesian geological setting in Figures 1 and 2 (Anonymous (a) up to Anonymous (p)) .
History
The island of Sumatera is also known as the island of gold in which it has been long mined by the people. The same situation occurred in West Kalimantan where Chinese have been involved in the businesses since a long time ago. Modern mining technique was started in the Lebong Donok, Bengkulu in 1989. Then it was followed in other area as Simau (1910), Lebong Simpang (1921), Tambang Sawah (1923), Salida (1914), Gunung Arum (1935), and Muara Sipongi (1936). These mines are of primary gold deposits. Most of those mining activities were conducted in Logas, Riau (1937-1940) and Meulaboh, Aceh (1940). On the other hand, in Kalimantan and Sulawesi there were no significant gold mines, but only small gold mining business and individual enterprises. Entering 1940, the Cikotok gold mine was opened.
In order to process the gold ore in Indonesia, in 1937 PT Breackensieck built the smelter and refinery plant for gold and silver. Some of the working gold mines at the time nearing the outbreak of Worl War II, were then acquired and run by the Japanese. During the independence war, the Indonesian government managed to continue the operation of the last mines such as in Cikotok and Lebong Tandai. In West Java, the gold mine Pongkor owned by PT Aneka Tambang about twenty years ago.
Many other new gold mines were in operation within the last three or four decades, among others are PT Kelian Equatorial Mining in East Kalimantan, PT Newmont Minahasa Raya in North Sulawesi and PT Freeport Indonesia Company in Papua. The newest gold mine is PT Newmont Nusa Tenggara in Sumbawa for another 10 years to come.
MATERIALS AND METHODS
In principle, evaluation on the scarcity of the gold mining is the life time of the mining activity which is obtained as the result of the reserves divided by the annual rate of extraction. Systematically, it is evaluated based on theory of exhaustion ,i.e., the Hotelling’s rule and Hamiltonian rule (Vogely, 1976; Howe, 1979), then it is related to the resource contribution to GNP (Soelistijo, 2003,2012, 2013).
Hotelling’s rule : S = ∫π (x, t) e-vt - λ(∫x dx - R); x = ∫ R (t) dt. Hamiltonian rule : H = f (S, R, t) + λ q (S, R, t); GNP = g (L,R,t) = h(S,R,t) e-rt δf where λ = δR = marginal user cost or scarcity rent; P(price)= mc + λ; mc = marginal cost ;

Ukar W. Soelistijo1 et al J. of Appl. Sci.& Res., 2014, 2(1):11-29
S = stock effects (reserves);
R = resource commodity production (production rate);
t = time;
GNP = gross national product;
L = labor or capital input factors.
Since continuing the production over time needs to increase the reserves, then the substantial increase of production input factors such as capital, labor and others are systematically required.
RESULT AND DISCUSSION
Results
The national gold production consisting of PT Aneka Tambang and the Contract of Work companies can be seen in Table 2. Mostly of the “old mines” are terminated in 1990s and early of 2000s due to facing their gold deposit reserves.
Activities of PT Aneka Tambang
PT Aneka Tambang as the State-owned Company operates gold mines in Cikotok and Pongkor. Both are located in West Java. The gold mining authorization area held by PT Aneka Tambang in West Java is around 29,138.3 hectares, of which 27,148 hectares is for exploration and 1,990.3 hectares is for exploitation.
The Cikotok Gold Mining Unit
The gold mine operated by the Cikotok Gold Mining Unit is located in the Lebak Regency, South Banten, in Banten Province. Gold was found in South Banten after an exploration was conducted there just before 1930s. The rock is in the form of Old Andesite which has been drophulitized. The Old Andesite Formation was aged between the Upper Miocene until the Lower Miocene. Veins of this rock contain sulphide minerals which is rich of gold, silver, lead, zinc and others. Before the World War II, mining activity was conducted by Mijnbouw Maatschappij Zuid Bantam. After the end of war, this company was sold to Perusahaan Pembangunan Pertambangan NV(the Mining Development Enterprise NV) which was formed by Bank Industri Negara (the State Bank of Industry). Rehabilitation efforts were started in 1954, and the first production was released in 1957.
Table 1
The depleted reserves and resources of gold deposits in Indonesia, 2001
NO.
CRITERIA/ COMPANY
Ore reserves
Resources
Au Ag Cu
1 2
A. Papua island:
PT FIC
ntan KalimaB.island:
PT KEM (East Kalimantan)
1,090,000,000 t*)
(Papua 4,041,169,000)**) (3,769 t gold metal)
77,900,000 t *)
1.18 g/t
(1,286.200 t) (308,500,000 t)**) (293 t gold metal)
1.97 g/t
(153.463 t)
na
3.78 g/t
(4,120.200 t)
na
11.7 g/t
(12,753,000 t)
na

Ukar W. Soelistijo1 et al J. of Appl. Sci.& Res., 2014, 2(1):11-29
3 4 5 6
7
8
9 10
11
12
13
14
15
16
PT PLM
PT AMP
PT MMM
- PT IMK (Central Kalimantan)
PT Ensbury Kalteng Mining
(Central Kalimantan)
C. Sulawesi Island: PT NMR
(North Sulawesi)
PT BTM
D. Java Island: PT ANTAM (West Java)
ara E. Nusa Tengg
Islands: PT NNT
(West Nusa Tenggara)
F.Sumatera and : **other islands
North Sumatera
Lampung
North Sulawesi
Gorontalo
North Maluku
na
(terminated in 1997) 12,762,181 m3 (terminated in 1998)
41,000,000 m3 (terminated in 1997)
8,262,000 t 1,489,000 (6 t gold metal) (terminated in 2001)
na
7,755,000 t (terminated in 2006)
2,600,000 t (terminated in 1999)
5,398,900 t 27 t (planned to terminate in 2015)
930,700,000 t
107 t
15 t
69 t
132 t
90 t
0.275 mg/m3
(3.509 t)
0.142 mg/m3 (5.822 t)
4.19 g/t (34.617 t)
na
5.6 g/t (43.428 t)
24.49 g/t (63.774 t)
12.15 g/t (65.596 t)
0.38 g/t
(353.666 t)
na
na
na
94.30 g/t (779,106 t)
na
7.30 g/t
22.49 g/t (58,474 t)
130.90 g/t (706,716 t)
na
na
na
na
na
na
na
na
na
0.52 g/t (48,396.4 t)
Source s: *) Departemen Pertambangan dan Energi (1999, 2000, 2001. **) Directorate General of Coal and Mineral resources (2011). Legend: - PT FIC: Freeport Indonesia Company, PT KEM: Kelian Equatorial Mining, PT PLM: Prima Lirang Mining, PT AMP: Ampalit Mas Perdana, PT MMM: Monterado Mas Mining, PT IMK: Indo Muro Kencana, PT NMR: Newmont

Ukar W. Soelistijo1 et al J. of Appl. Sci.& Res., 2014, 2(1):11-29
Minahasa Raya, PT BTM: Barisan Tropical Mining, PT ANTAM Tbk:Aneka Tambang Tbk, PT NNT: Newmont Nusa Tenggara,
- na : data not available - 2001: Σ Au: 1,651.092 t, Σ Ag: 6,018.166 t, Σ Cu: 12,753,000 t
Figure 1. Areas of gold deposit in Indonesia
Figure 2. Further detail locations of gold deposits in Indonesia

11
The Pongkor Gold Mining Unit
The Pongkor gold mining area, with the permitted mining exploitation area 893-West Java of around 4,058 hectares, is located in around 54 kilometers west of Bogor.
The exploitation was pioneered by the geological team of PT Aneka Tambang where mineralization was found at around Gunung Pongkor area in 1988, and this effort was followed by a more detailed and integrated exploration activity at the Cikotok mining authorization area (KP), and also in the other ten KPs in West Java.
The exploration revealed that the probable geological reserves were predicted to be around 6,021,614 million tons of ore with gold content of about 103.23 tons, and silver at 990.65 tons in the three major veins, namely Cigua, Kubang Cicau and Ciurug.
Table 2
The output of PT Aneka Tambang’s and Gresik refinery of precious metals (kg)
Source of concentrates Year Gold Silver
PT Aneka Tambang
1990 135
2,113
1991 107 2,006
1992 79 1,372
1993 178 1,529
1994 1,156 13,660
1995 1,812 17,283
1996 1,855 14,946
1997 2,113 15,745
1998 1,858 13,352
1999 3,227 22,370
2000 2001 2006 2009 2011
4,210 3,957 2,780 2, 627 2,667
28,587 27,492 23,876 22,589
n.a
Contract of Work Companies 1990 1,624.1 3,700.2
1991 3,183.8 14,389.2
1992 17,199.5 33,448.9
1993 16,490.2 28,316.7
1994 16,119.8 41,634.0
1995 18,981.0 166,503.0
1996 1997 1998 1999 2000 2001 2006 2009 2011
1990 1991 1992
26,651.0 28,495.4 31,115.9 31,903.1 119,784 162,134 141,687 126,217 72,090
1,759.1 3,290.8 17,278.5
148,924.0 155,200.6 172,130.3 127,743.5 226,856.0 320,840.0 304,427.0 305,205.0
n.a
5,813.2 16,395.2 34,820.9

Ukar W. Soelistijo1 et al J. of Appl. Sci.& Res., 2014, 2(1):11-29 ______________________________________________________________________________
12
1993 1994 1995 1996 1997 1998 1999 2000 2001 2006 2009 2011
16,668.2 17,275.8 20,793.0 28,506.7 30,608.4 32,973.9 35,130.1 123,994 166,091 144,467 128,844 74,757
29,845.7 55,294.0 183,786.0 163,870.0 170,945.6 185,662.3 150,113.5 111,340.4 348,332.0 328,303 327,794
n.a
Total
Source: Departemen/Kementerian Pertambangan dan Energi (1999, 2000, 2001),Directorate of Mineral and Coal Enterprises (2002), Directorate General of Coal and Mineral Resources, (2011).
Mining activity was started at the end of 1992 with the first blast to make the main haulage
level with the opening dimension of 3.33 meters.
The mining technique used at Pongkor is cut and fill technique, which is similar to the Cikotok mine. The extraction process of the Pongkor gold ore adopts the standard cyanidation process, namely the process of CIL (carbon in leach) is then followed by eluation process, and one being the special characteristics is the use of electrowinning to recover gold and silver, instead of the Meril Crowe’s Zinc cementation. The result, dore bullion, is then further processed at the processing and refinery unit in Jakarta.
Production
The year of 1994 was as a transition period in which PT Aneka Tambang expanded its gold mining areas to Pongkor new gold mine. In 1994, the total of gold and silver ore mined from the five gold mines (Cirotan, Gunung Sopal, Ciputer, Cipicung and Hatemi) was 4,518 tons, which below the 1993 figure of 5,636 tons. Despite receiving supply from the Pongkor mine which totaled 4,938 tons, the production of gold was only 21.08%, and silver was 24.63% from the target. Since the first semester of 1994, gold mining activity at Pongkor produced some 98,028 tons of wasted rock which contained 1,124 kgs of gold and 13,069 kgs of silver (Table 3). Then this production increased up to 4,040 kgs of gold and 27,416 kgs of silver in 1999/2000, so that PT Aneka Tambang produced gold and silver from both Cikotok and Pongkor amounted to 122.3 kgs of gold and 2,081.9 kgs of silver in 1990; 1,174.6 kgs of gold and 13,846.4 kgs of silver in 1994, then 2,536 kgs of gold and 17,977.9 kgs of silver in 2001.
Table 3
Gold and silver production of PT Aneka Tambang (1990-2011)
Year
Ore Mined (tonne) Gold Production (kg) Silver Production (kg)
Cikotok Pongkor Cikotok Pongkor Cikotok Pongkor
1990
56,950
-
133.417
-
2,157.628
-
1991 45,985 - 102.064 - 2,002.959 - 1992 21,257 - 75.398 - 1,202.054 - 1993 19,782 *) - 190.535 - 1,661.462 - 1994 9,456 *) 98,028 53.137 1,123.627 823.715 13,069.032 1995 323 - - 1,805.743 - 17,139.706 1996 1997 1998
- 12,058 44,960
165,337 232,204 183,005
- 108.444 282.000
1,674.329 2,004.636
1.569
- 394.855 1.140
13,509.398 15,350.210
12.392

Ukar W. Soelistijo1 et al J. of Appl. Sci.& Res., 2014, 2(1):11-29 ______________________________________________________________________________
13
1999 2000 2001 2006 2007 2008 2009 2010 2011
35,504 - - - - - - - -
286,287 n.a n.a n.a n.a n.a n.a n.a n.a
271.007 - - - - - - - -
2,956.190 4,210.000 3,957.000 2,873.000 2,791,000 2,834,000 2,627,000 2,780,000 2,667.000
1,306.009 - - - - - - - -
21,063.916 28,587.000 27,492.000 23,876.000 24,125.000 25,349.000 22,859.000 18,529.000
n.a
*) Including ore supplied from Pongkor Source: Departemen/Kementerian Pertambangan dan Energi (1999, 2000, 2001) Directorate of Mineral and Coal Enterprises (2011)
Extraction activities of the contract of work (COW) companies in gold and silver.
Until the end of December 1994, only five companies which have been in operation under COW agreement on general mining have started producing gold and the associated minerals. Then, the six companies were PT Monterado Mas Mining, PT Lusang Mining, PT Ampalit Mas Perdana, PT Prima Lirang Mining, PT Newmont Minahasa Raya and PT Kelian Equatorial Mining, even though PT Monterado Mas Mining, PT Lusang Mining, PT Prima Lirang were also terminated in the year of 1996, 1995 and 1998 respectively.
Then in the year of 2000 up to the present there are only four COW gold mining companies, i.e., PT Kelian Equatorial Mining, PT Newmont Minahasa Raya, PT Newmont Nusa Tenggara, and PT Nusa Halmahera. The COW copper mining company which also produces gold is PT Freeport Indonesia Company.
All of those COW gold mining companies, except PT Freeport and PT Newmont Nusa Tenggara, have produced dore bullion which have to be purified at the precious metal unit of PT Aneka Tambang in Jakarta.
PT Kelian Equatorial Mining
On January 1, 1992, to PT Kelian Equatorial Mining, a permit was granted to start commercial production activities in the COW area for the mining of gold, situated in the Regency of Kutai, East Kalimantan Province.
The COW area which is still maintained covers an area of 18,335 hectares and which include a mining area, the infrastructure and other means (plants, offices, housing, store houses, and roads leading to the mines), as well as the unexplored area in the Sungai Mangerang region, which covers an area of 4,000 hectares.
The method of mining which should be applied is the open pit mine, while the separation of the gold and silver from the ore should be done by cyanidation process. The absorption of the gold and silver should be done by using activated carbon, or by the so-called “carbon in pulp leaching” process. The settled down layer should further be smelted to separate the quicksilver content and to be furtherprocessed into bullions.
To build the gold mine, PT Kelian Equatorial Mining had invested the sum of US$ 601,625,000. The production of ore and bullion from 1992 to 2001 is seen in Table 4.
Dore bullion which has been produced is not allowed to be exported directly because according to the stipulations in the COW agreement that it should first be purified within the country itself. The production of gold and silver in 1992 was of about 14,536 kgs and 5,333 kgs of silver down to 14,100 kgs of gold and 10,502 kgs of silver in 2001.

Ukar W. Soelistijo1 et al J. of Appl. Sci.& Res., 2014, 2(1):11-29 ______________________________________________________________________________
14
PT Newmont Nusa Tenggara
The Batu Hijau gold and copper mine on Sumbawa island was currently financed at a total cost of US$ 1.9 billion and started production in 1999. The project company, PT Newmont Nusa Tenggara, is owned by Newmont Indonesia (45%) and Sumitomo Corp. (35% through its subsidiary Nusa Tenggara Mining Corp). Indonesia party accounts for the remaining of 20%. The financing structure is expected to consist of a US$ 1 billion senior loan package with export credit agency participation and US$ 888 million of subordinated debt and equity. The production of gold started in 1999 was 9,947.56 kgs in the copper concentrate containing 236,005 tonnes of copper and 37,797 kgs of silver. Then it increased production of gold of 13,918 kgs, 46,179 kgs of silver and 679,746 tonnes of copper in 2001.
Table 4
Ore and dore bullion production of PT Kelian Equatorial Mining (1992-2000)
1992 1993 1994 1995 1996 1997 1998 1999 2000
2001
Total ore mined (ton)
946,416
10,468,060
8,617,998
7,618,587
7,413,049
8,236,153
7,992,540
4,729,875
+) +)
Average gold
content (grs/ton)
1.63
1.74
1.79
1.65
1.52
0.75
1.90
1.73
+)
+)
Total processe
d ore (ton)
6,198,631
6,569,671
6,743,227
6,578,660
6,807,941
7,352,939
7,782,044
7,672,927
+)
+)
Dore bullion
obtained (kg)
30,052
26,943
21,723
21,679
27,520
26,407
28,600
25,426
21,586
25,495
Gold content in dore
(kg)
14,536
14,424 11,465
11,473
14,098
15,051
14,228 13,704
10,516 14,100
Silver content in dore
(kg)
5,333
12,281
9,948
9,760
11,138
10,424
13,494
10,730
10,145
10,502
Side product quick-silver (kg)
405
148
37
124
17.8
12.9
120
10
+)
+)
+) Data not available Source: Departemen/Kementerian Pertambangan dan Energi (1999, 2000, 2001)
Directorate of Mineral and Coal Enterprises (2002)
PT Newmont Minahasa Raya

Ukar W. Soelistijo1 et al J. of Appl. Sci.& Res., 2014, 2(1):11-29 ______________________________________________________________________________
15
This company was under the COW of Generation IV located in North Sulawesi Province with the area of 26,805 hectares. The production stage started in 1996. The production in 1999 was 1,135,807 tonnes of ore containing 10,702 kgs of gold. It inceased to 11,394 kgs of gold in 2000 but then declining to 8,318 kgs in 2001.
PT Nusa Halmahera
The new gold mine owned by PT Nusa Halmahera started production in 2000 of 7,802.0 kgs of gold and of 4,687.9 kgs of silver and 6,505.9 kgs of gold and 7,514.6 kgs of silver in 2001.
PT Freeport Indonesia Corporation (PT FIC)
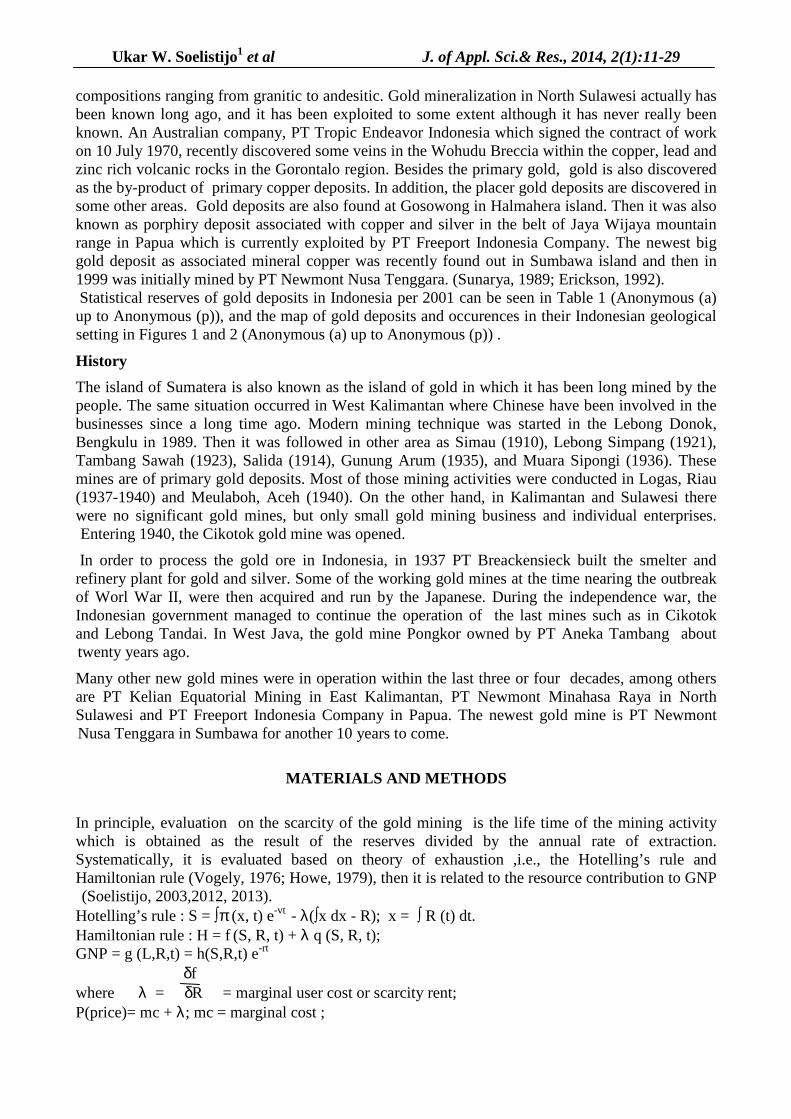
PT FIC has one of the world’s largest and most exciting mineral exploration programs, located in Papua. PT FIC exploration activities are positioned along the ring of fire where the Indonesia-Australian and Pacific plates collide, making it one of the highest potential mineralization zones in the world. PT FIC includes COW A, an area of ten thousand hectares surrounding the mining activities of Grassberg, and COW B currently approximately 1.3 million hectares across Papua’s mountains. A sister company PT Irja Eastern Minerals covers a further 700,000 hectares in Papua and is operated by Freeport’s Exploration Team. Reserves total over 2 billion tones of ore which contains, (i) wolrd’s single gold reserves over 55 million ounces (1,721.39 tones of Au), and (ii) world’s third largest copper reserve over 20 million ounces (or 625.96 tones). Production of gold, silver and copper exploited by the company can be seen in Table 5.
The other terminated gold mines
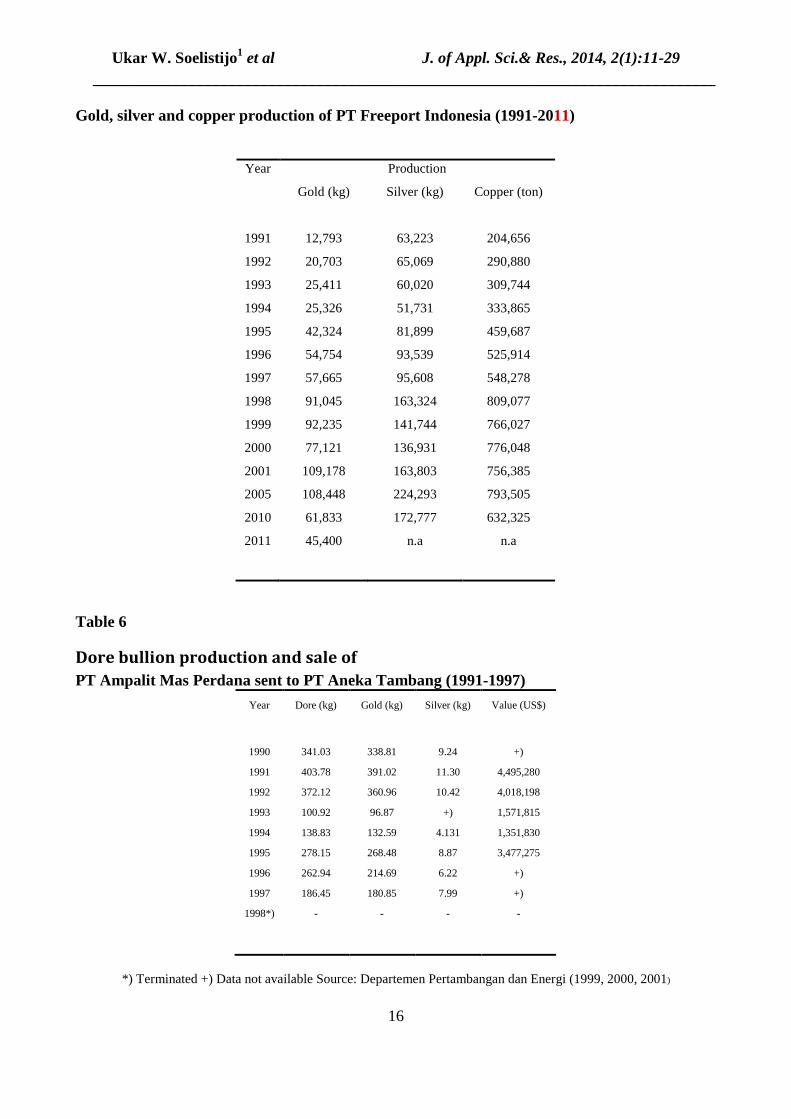
a. PT Ampalit Mas Perdana, terminated in 1998 Alluvial gold or reserves in the COW area of PT Ampalit Mas Perdana which can economically be mined by using dredgers, is thought to have exhausted at the end of 1994. The same is true with the terrace reserves which contains alluvial gold ore deposit which can be mined by using squirt guns, was exhausted in June 1994, and terminated in 1998, which produced 262.9 kgs of dore bullion containing 214.7 kgs of gold and 6.2 kgs of silver, then produced the last dore bullion of 186.4 kgs in 1997 (Table 6).
b. PT Lusang Mining, terminated in 1995 The gold mine of PT Lusang Mining which is located at Lebong Tandai in the Province of Bengkulu in Southern Sumatera, had in persuance of the Ministerial Decree of Mines and Energy Number 748.K/2013/M.PE/86, on April 1 1986 officially started production.
The highest amount of production made since that time was 8,370.07 kgs dore bullion containing 900 kgs of gold and 4,900 kgs of silver. Since 1990, however, the production of the company continued to decline due to decreasing deposit of gold and silver to be mined.
In 1994, the last amount of ore from the mines was 84,423 tonnes which are processed to be 5,388.9 kgs of dore bullion containing gold and silver of 363.5 kgs and 1,625.9 kgs respectively. The price paid for those two metals was US$ 7,714,744. Unfortunately then the mines were terminated in 1995 because of several technical problems.
The statistic of the PT Lusang Mining‘s production and sales of gold and silver until the end of 1994, then terminated in 1995, can be seen on Table 7.
Table 5
Ukar W. Soelistijo1 et al J. of Appl. Sci.& Res., 2014, 2(1):11-29 ______________________________________________________________________________
16
Gold, silver and copper production of PT Freeport Indonesia (1991-2011)
Year Production
Gold (kg) Silver (kg) Copper (ton)
1991
1992
1993
1994
1995
1996
1997
1998
1999
2000
2001
2005
2010
2011
12,793
20,703
25,411
25,326
42,324
54,754
57,665
91,045
92,235
77,121
109,178
108,448
61,833
45,400
63,223
65,069
60,020
51,731
81,899
93,539
95,608
163,324
141,744
136,931
163,803
224,293
172,777
n.a
204,656
290,880
309,744
333,865
459,687
525,914
548,278
809,077
766,027
776,048
756,385
793,505
632,325
n.a
Table 6
Dore bullion production and sale of
PT Ampalit Mas Perdana sent to PT Aneka Tambang (1991-1997)
Year Dore (kg) Gold (kg) Silver (kg) Value (US$)
1990 1991 1992 1993 1994 1995 1996 1997
1998*)
341.03 403.78 372.12 100.92 138.83 278.15 262.94 186.45
-
338.81 391.02 360.96 96.87 132.59 268.48 214.69 180.85
-
9.24 11.30 10.42
+) 4.131 8.87 6.22 7.99
-
+)
4,495,280 4,018,198 1,571,815 1,351,830 3,477,275
+) +) -
*) Terminated +) Data not available Source: Departemen Pertambangan dan Energi (1999, 2000, 2001)

Ukar W. Soelistijo1 et al J. of Appl. Sci.& Res., 2014, 2(1):11-29 ______________________________________________________________________________
17
Table 7
Production and sale of gold by PT Lusang Mining (1990-1994)
Year Ore (ton) Bullion (ton) Bullion (kg) Gold (kg) Silver (kg) Value (US$)
1990 1991 1992 1993 1994
1995*)
-
99,844.50 67,839.00 63,142.00 84,423.00
-
-
7,713.50 5,185.93 4,807.47 9,260.39
-
-
7,746.0 6,172.0 4,925.4 5,389.0
-
906.32 685.2 430.5 425.0 363.0
-
3,816.87 3,273.4 1,734.4 1,872.0 1,625.0
-
-
9,197,527 5,027,400 4,978,041 7,714,744
-
*) terminated Source: Departemen Pertambangan dan Energi (1999, 2000, 2001)
c. PT Monterado Mas Mining, terminated in 1997
PT Monterado Mas Mining had received a permit from the Indonesian government to start as of August 1, 1989 with commercial production of its alluvial gold mine. The permit was valid for apart of the area under COW agreement and was 8,383.87 hectares, located in the Monterado region in the West Kalimantan Province, as stated in the Decree of the Directorate General for Mining Number 825.K/29/DDJP/1989. The other part of COW area has still to be explored in detail.
In 1992 the majority share of PT Monterado Mas Mining was transferred to Advocate Resource PTE Ltd, a Singaporean company, and the other parts have been submitted to PT Puncak Cyclop Minerals and PT Prima Searco as minority shareholders. Thus, the composition of the shareholding of PT Monterado Mas Mining was as follows: Advocate Resource PTE Ltd (Singapore) 57.77%, PT Puncak Cyclop Minerals (Indonesia) 38.46%, and PT Prima Searco (Indonesia) 5.77%.
The transfer of shares have been agreed upon by the Coordinating Agency for Capital Investment (BKPM) pursuant to its letter Number 138/III/PMA/1993.
The entire production of PT Monterado Mas Mining in the form of dore bullion is purified and sold through the Unit Logam Mulia, a shareholder of PT Aneka Tambang. The statistics concerning the sale of dore bullion of PT Monterado Mas Mining to PT Aneka Tambang on Table 8. The last production of dore bullion in 1996 of about 29.8 kgs containing 25.1 kgs of gold and 3.6 kgs of silver.
Table 8
Dore bullion production and sale of
PT Monterado Mas Mining sent to PT Aneka Tambang (1990-1996)
Year Dore (kg) Gold (kg) Silver (kg) Value (US$)

Ukar W. Soelistijo1 et al J. of Appl. Sci.& Res., 2014, 2(1):11-29 ______________________________________________________________________________
18
1990 1991 1992 1993 1994 1995 1996
1997*)
290.83 47.905 85.212 306.271 261.390 280.000 29.80
-
286.89 40.001 69.865 249.610 218.100 236.390 25.14
-
10.17 6.802 15.367 44.409 32.820 33.960 3.57
-
+)
552,000 764,000
2,590,452 2,720,603 2,609,590
+) -
*) Terminated +) Data not available Source: Departemen Pertambangan dan Energi (1999, 2000, 2001)
PT Prima Lirang Mining, terminated in 1997
PT Prima Lirang Mining had during its exploration stage discovered a gold deposit which associated with barite in part of its COW area in Wetar island in Southwest Maluku, in the Lerokis region which 4,801 hectares large. A feasibility study and a study of analysis concerning the impact analysis on the environment (AMDAL) revealed that the place is technically and economically feasible to have priority for mining.
By the Decree of the Directorate General of Mining, number 368.K/29/DDJP/1991, to PT Prima Lirang Mining was given a permit to start commercial production activities in the above-mentioned area.
Because the gold ore deposit in that area is associated with barite, PT Prima Lirang Mining is besides building a plant to process dore bullion out of gold ore, the company is also owning a plant to process barite powder.
However, in 1994 the barite powder plant was shut because it was discovered to be uneconomic as its marketing and quality below standard.
In 1994, mining activities were conducted in the Kelian Kuning region, while in the other COW regions exploration activities were still continuing. In the first four years of its operation, the production is on Table 9. The production was started in 1991 of 13,317 kgs of dore bullion containing 1,908.7 kgs of gold and 10,983.5 kgs of silver, and the last production in 1997 of dore bullion of 7,369.6 kgs containing 617.5 kgs of gold and 6,157.4 kgs of silver.
Table 9
Dore bullion production of PT Prima Lirang Mining ( 1991-1997)
Year Dore bullion (kg) Gold (kg) Silver (kg) Barite (kg) Mercury (kg)
1991 1992 1993 1994 1995 1996
13,317 20,446 18,873 33,619 63,654 45,998
1,908.71 2,107.61 1,514.75 1,811.41 2,781.75 3,253.37
10,983.45 16,901.33 14,114.81 28,994.23 61,479.42 38,709.39
6,119 18,086 21,248 6,803 6,806
+)
+) +) +)
1,366 1,452 14,090

Ukar W. Soelistijo1 et al J. of Appl. Sci.& Res., 2014, 2(1):11-29 ______________________________________________________________________________
19
1997 1998*)
7,369 -
617.51 -
6,157.47 -
+) -
+) -
*) Terminated +) Data not available Source: Departemen Pertambangan dan Energi (1999, 2000, 2001)
PT Indo Muro Kencana, terminated in 2001
PT Indo Muro Kencana was terminated in 2001. The production of gold started in 1995 was 4,374.61 kgs of gold and 104,914 kgs of silver and reached 5,452.29 kgs in 1999, but then down to 3,002.05 kgs of gold in 2000 (Table 10).
Table 10
Dore bullion production of PT Indo Muro Kencana (1995-2001)
Year Dore bullion (kg) Gold (kg) Silver (kg)
1995 1996 1997 1998 1999 2000
2001*)
116,062 97,946 133,861 70,093 89,618 40,297
+)
4,375 5,362 5,538 2,938 5,452 3,002 3,792
104,914 91,769 129,197 65,216 84,168 37,295 80,630
*) terminated +) data not available Source: Sources: Departemen Pertambangan dan Energi (1999, 2000, 2001) Directorate of Mineral and Coal Enterprises (2002)
PT Barisan Tropical Mining, terminated in 1999.
The very short life time of PT Barisan Tropical Mining of 3 years only produced dore bullion of 13,839 kgs in 1997 containing 1,669.2 kgs of gold and 12,165.7 kgs of silver, and then 33,476.9 kgs dore bullion containing 2,061.7 kgs of gold and 29,389.7 kgs of silver in 1999.
g. Other small gold minings operated in production that could be neglected due to their irregular and sporadic activities.
Production of Gold and Scarcity of Gold Deposit in Indonesia
Statistical production of gold in Indonesia per 2010 is shown on Table 11. Based on the current reserves (Table 1) and production of gold in Indonesia, scarcity of gold deposits in Indonesia is measured by its life time of the mines ( Figure 3) can be resulted as follows:
a. PT Antam Tbk (West Java):
- reserves 65.596 tonnes of gold, production 1.9 tonnes/year, life time 34.5 years.
- updated reserves 27 tonnes of gold, production 2.6 tonnes/year, life time around 10 years up to 2015.

Ukar W. Soelistijo1 et al J. of Appl. Sci.& Res., 2014, 2(1):11-29 ______________________________________________________________________________
20
b. PT FIC (Papua):
- reserves 1,286.2 tonnes of gold, production 57.67 tonnes/year, life time 22.3 years (the first COW: 1971-2001; the second COW: 2001-2020).
- updated reserves 2,664,932,000 tonnes of ore (31 December 2008, Freeport McMoran Copper and Gold, 2011), 2,372 tonnes of gold, production 75 tonnes/year, life time around 30 years (the expected third COW: 2021-2041).
c. PT NNT (West Nusa Tenggara):
- reserves 353.666 tonnes of gold, production 15 tonnes/year, life time 23.5 years (COW: 1999-2022).
d. PT KEM : reserves 153.463 tonnes of gold, production 14.5 tonnes/year, life time 10.5 years.
e. PT BTM: reserves 63.774 tons of gold, production 1.6 tons/year, life time 3.65 years (terminated in 1999).
f. PT NMR: reserves 43.428 tons of gold, production 6.3 tons/year, life time 6.9 years (terminated in 2005).
g. PT IMK: reserves 34.617 tons of gold, production 5.3 tons/year, life time 6.5 years (terminated in 2001).
h. PT AMP: reserves 3.509 tons of gold, production 0.23 tons/year, life time 15.2 years (terminated in 1998).
i. PT MMM: reserves 5.822 tons of gold, production (terminated in 1997).
In principle, in the case of identified gold reserves it can be forwarded based on a competitive market where marginal user cost equals with the price of marginal in situ resources.
Analysis
Demand and suppply curve of gold
The demand for gold consisted of export and domestic sale. The imported gold is less than 3% of the production. The increasing demand should be met be the increasing supply that mainly coming from domestic production (Tables 11 and 12). It is shown on Figure 3 and Table 11 that the increasing average annual growth rate of domestic sale of around 52.5% and export of about 5.3% within the last decade should be anticipated by the supply of production of around 2.5%, facing the continuing depleting present reserves of gold deposit over time.

Ukar W. Soelistijo1 et al J. of Appl. Sci.& Res., 2014, 2(1):11-29 ______________________________________________________________________________
21
Figure 3. Scarcity curve of gold extraction in Indonesia
Outlook By considering that Indonesia archipelago located in the ring of fire within the Pacific geological region, it s necessarily required to do grass root exploration to increase the level of upstream added value from the stage of unknown gold resource potential into known resources, then from the known resources into the level of proved reserves and then finally the mineable ones. The known resources of gold are about 3.49 tonnes of ore or around 4,220 tonnes of gold metal. It is consisted of primary gold of 1.8 billion tonnes ore or 4,112 tonnes of gold metal and placer gold of 1.6 billion tonnes ore or 108 tonnes of gold metal or 51.6 % of primary gold ore and 48.4 % of placer gold one or 97.4 % of primary gold metal and 2.6 % of placer gold metal (Table 13).
Primary gold resources are located in Sumatera (Provinces of Nanggroe Aceh Darussalam, North Sumatera, West Sumatera, Riau, Bengkulu, South Sumatera and Lampung), Java (West, Central and East Java), Kalimantan (West, East, Central and South Kalimantan), Nusa Tenggara, Sulawesi, Papua and Maluku (Anonymous (g), 2011). The six biggest primary gold resources are mostly located in Gorontalo Province in Sulawesi, Papua, East Kaimantan, Central Kalimantan, North Maluku, East Java, and the six biggest placer gold resources are mostly located in Papua, West Kalimantan, Riau, Central Kalimantan, Gorontalo Sulawesi that has resources of greater than 100 million tonnes of gold ore respectively. (see Table 13).
Then it could be figured out into demand and supply curve as shown on Figure 4. The base line shows the figure, it is expected that the minimum amount of gold supply could be mined by the method of “people, traditional or artisanal mining”.
In general, there would be a transition period from the current era of gold mining based on the current or present gold reserves to the future era of gold minig based on the resources of gold at present , where it needs doing detail or comprehensive exploration to transfer the present resources into the future resrves beyond the years of 2040s-2050s (Figure 4). At the other sides, the resources

Ukar W. Soelistijo1 et al J. of Appl. Sci.& Res., 2014, 2(1):11-29 ______________________________________________________________________________
22
and reserves of placer gold ore could be used as “buffer stock of gold” at the level of 40-50 tonnes of gold produced per annum over time especially for domestic demand.
In general, there would be a transition period from the current era of gold mining based on the current or present gold reserves to the future era of gold minig based on the resources of gold at present , where it needs doing detail or comprehensive exploration to transfer the present resources into te future resrves beyond the years of 2040s-2050s (Figure 4). At the other sides, the resources and reserves of placer gold ore could be used as “buffer stock of gold” at the level of 10-50 tonnes of gold produced per annum over time especially for domestic demand.
Based on the 1995 input-ouput transaction table which has been updated into 1998, the contribution of the gold sector in the GDP about 0.084% or 37.41% of the gold total revenue (output). The contribution of the general mining sector of about 3.07% to the total GDP. In 2008
I-O Table, the general mining sector contribution increased up to 4.56% and gold up to 0.75%.
It is approximately figured out that in 2000 the contribution of the general mining to the GDP is about 3.34%., increasing up to 6.76% in 2011. If the contribution of the gold sector is around 0.75%, then gold is still expected to have an increasing role of contribution to the GDP, due to the availability of gold deposit in Indonesia based on the geological potentiality.
The very promising international price trend of gold, it is expected that the serious effort of doing grass root exploration of gold deposit in Indonesia (Figure 5) still would be able to strongly support the Indonesian economy in the coming years. In the curves, it looks likely that the trend of the international oil price followed by the trend of gold international price, however, at one side when the price of oil a little bit decilining, the price of gold is still consistently increasing. At the other sides it looks likely that the production (P) , domestic sale (DS) and export (X) are also still increasing with the regression equations of P (tonnes) = -14008 + 7.061 t (year) (R2= 0.578), DS (tonnes) = -9634 + 4.682 t (R2= 0.459) and X (tonnes) = -5322 + 2.669 t (R2= 0.470) respectively (Figure 6).
Table 11. The existing gold mines in Indonesia: Total production, domestic sale and export,1995-2010
No
Province / Island Year ( Tonnes )
Company 1990 1995 2000 2001 2002 2003 2004 2005 2006 2007 2008 2009 2010
1 Papua
PT. FI / 1972* 12.79 22.52 50.72
109.17
97.84
99.68 48.56
108.44
108.45
57.26
82.68
94.58 61.83
2
West Nusa Tenggara
PT. NNT − 0.362 10.19
* 16.06 15.3
1 18.6
8 22.35 22.76 22.76 13.9
2 17.5
0 17.4
0 22.93
3
North Maluku
PT. NHM / 2000*
− − 7.42* 8.84 3.40 0.47 5.88 6.06 8.52 11.66
12.95
11.56
13.97
4
Java (West)
PT. ANTAM
0.1 1994
* 1.80 4.12 4.26 4.09 4.49 3.95 2.91 2.8 2.79 2.83 2.62 2.78
5
Sulawesi PT. NMR /
1996* − − 6.63 11.12 5.16 3.34 2.16 T − − − − −
PT. Avocet BM − − n.a n.a n.a n.a n.a 1.47* 1.51 2.35 1.34 1.49 1.48
6 Kalimantan

Ukar W. Soelistijo1 et al J. of Appl. Sci.& Res., 2014, 2(1):11-29 ______________________________________________________________________________
23
PT. KEM − n.a 8.67 14.09 16.7
7 14.5
8 10.19 1.327 T − − − −
PT. IMK − 8.37 5.36 3.79 n.a n.a n.a 0.31 0.3 1.26 1.42 1.16 1.27
PT. Ensbury
KTM / 2010*
− 18.90 − n.a n.a n.a n.a n.a n.a n.a n.a n.a 0.003
PTGC / 2005* − − − n.a n.a n.a n.a 0.01 0.036
0.017
0.014 n.a n.a
7
Sumatera
PT. NM Lampung − − − n.a n.a n.a n.a n.a n.a n.a n.a n.a 0.267
*
Others 3.00
Total Production ( Tonnes of
Gold) 15.89 63.26 123.9 162.6
142.2
141.0 92.9 143.2 144.4
87.29
118.7
128.8 104.5
Annual Change ( % )
20.7 31.2 -12.5 -0.8 -34.1 54.1 0.8 -39.5 36 8.5 -18.9
% Average / Year 2.5
Total Export ( Tonnes of Gold)
13.94 52.84 91.93 122.9 103.5
112.1
88.7 141.2 84.5 83.1 56.8 104.1
81.2
Annual Change ( % ) 79.8 33.7 -15.8 8.3 -20.9 59.2 -40.2 -1.7 -31.6 83.3 -22
% Average / Year
5.3
Total Domestic Sale (Tonnes of
Gold) 14.99 5.44 17.15 30 24.4 17.7 10.34 55.7 18.1 41.7 20.3 33.2 22
Annual Change ( % ) 134.7 74.9 -18.7 -27.5 -41.6 438.7 -67.5 130.
4 -51.3 63.5 -33.7
% Average / Year
52.7
Legend: * Year of starting production. T = terminated. - The existing gold mining: PT FI= PT Freeport Indonesia ; PT NNT= PT Newmont Tenggara; PT NHM= PT North Halmahera Mining; PT ANTAM= PT Aneka Tambang that owns Ciktotok gold mining in West Java operated by 1940 and re-operated in 1961-1994, then Pongkor gold mining operates in 1994-2015; PT NMR= PT Newmont Minahasa Raya; PT Avocet BM= PT Avocet Boolang Mongondow; PT KEM= PT Kelian Equator Mining; PT IMK= PT Indomuro Kencana; PT Ensbury KTM = PT Ensbury Kalteng Mining; PT GK = PT Galuh Cempaka; PT NM= PT Natarang Mining. - Other terminated gold mining compnies: PT Lusang Mining, Bengkulu, Sumatera (T 1995); PT Ampalit Mas Perdana, Kalimantan (T 1997); PT Prima Lirang Mining, Maluku (T 1998); PT Indo Muro Kencana, Central Kalimantan (T 2002); PTBarisan Tropical Mining, South Sumatera (1997-1998) (T 2000).
Table 12
Production of gold in Indonesia
No.
Year
Tonnes
Production Domestic sale
Export
Other than PT FIC PT FIC *) Total

Ukar W. Soelistijo1 et al J. of Appl. Sci.& Res., 2014, 2(1):11-29 ______________________________________________________________________________
24
1 2 3 4 5 6 7 8 9 10 11 12 13 14 15
1992 1993 1994 1995 1996 1997 1998 1999 2000 2001 2007 2008 2009 2010 2011
17.58033 16.68622 17.28396 20.33700 28.51605 30.60837 91.23100 34.94900 46.87300 56.91300 32.014 70.807 34.258 42.717 29.357
20.70318 25.41076 25.32085 42.47460 54.75400 57.66355 91.04500 92.23500 77.12100 109.17800
57.628 82.682 94.586 61.833 45.400
38.28351 42.09698 42.60481 62.81160 83.26700 88.27192 182.27600 127.18400 123.99400 166.09100
89.642 118.765 128.844 104.550 74.757
2.15
5.44 2.14 1.90 2.34 15.15 17.15 30.00 40.7 20.3 33.2 22.0 22.4
37.91
52.84 71.82 82.60 108.48 105.33 91.93 122.9 83.1 56.8 104.1 81.2 78.6
Sources: Departemen Pertambangan dan Energi (1999, 2000, 2001) Directorate of Mineral and Coal Enterprises (2002) Directorate General of Coal and Mineral Resources (2011).
*) Cu concentrate is smelted overseas, since 1997 37.5% of the concentrate product (of around 750,000 tonnes/annum) smelted domestically.
1997 gold production by companies: 2001 gold production by companies: 2011 gold production by companies : (tonnes) - PT Antam Tbk. 1.9350365 - PT Antam Tbk. 3.957 - PT FI, 45.400 - PT Ampalit Mas Perdana 0.2307445 - PT Kelian Equatorial Mining 14.1 - PT Avocet Bolang M., 1.321 - PT Kelian Equatorial Mining 14.5248429 - PT Indo Muro Kencana Mining 3.792 - PT Indomuro Kencana,0,750 - PT Prima Lirang Mining 0.6353429 - PT Newmont Minahasa Raya 10.155 - PT Ensbury Kalteng Mining, 0.045 - PT Indo Muro Kencana Mining 5.3011222- PT Newmont Nusa Tenggara 16.064 - PT Newmont NT, 8.890 - PT Estara Melawai Mining 0.0103811 - PT Nusa Halmahera Mineral 8.845 - PT Nusa Halmahera Minerals, 13.449 - PT Karya Bukit Utama 0.0039140 - PT Freeport Indonesia Corporation 109.178 - PT Aneka Tambang, 2.667 - PT Newmont Minahasa Raya 6.3014333 - PT Natarang Mining,1.234 - PT Burry B Mungkin 0.0016000 - PT Permas 0.0004550 - PT Barisan Tropical Mining 1.6020036 - KUD Mandiri Panca Usaha 0.00029130 - PT Freeport Indonesia Corporation 57.66355 -
- Table 13. The known resources of gold deposits in Indonesia
Primary gold resources Placer gold resources
Location Ore
(thousand tonnes)
Gold metal (Au)
(tonnes)
Location Ore
(thousand tonnes)
Gold metal (Au)
(tonnes)
1.Gorontalo 402,100 185 1. Papua 509,640 12
2.Papua 308,500 293 2. Weat Kalimantan 452,724 59
3.East Kalimantan 300,000 690 3. Riau 233,666 n.a
4.Central Kalimantan
279,028 1,196 4. Central Kalimantan
170,944 24
5.North Maluku 173,394 169 5. Gorontalo 143,703 n.a
6.East Java 144,010 852 6. North Maluku 8,111 n.a
7. Others (17 locations/provinces):
North and West Sumatera, Jambi, Bengkulu, South
Sumatera, Lampung, Banten,
224,519 727 7.Other locations/provinces):
West Sumatera, Jambi, Lampunbg,
East Java, East kalimantan. South Kalimantan, North
139,869 13

Ukar W. Soelistijo1 et al J. of Appl. Sci.& Res., 2014, 2(1):11-29 ______________________________________________________________________________
25
West and Central Java, West and East
Nusa Tenggara, Central sulawesi,
and Maluku)
Sumatera, South Sumatera)
Total 1,831,551 4,112 1,658,657 108
Source: Directorate General of Coal and Mineral Resources, 2011.
Figure 4. Transition of current gold supply curve to future gold supply one
Based on the 1995 input-ouput transaction table which has been updated into 1998, the contribution of the gold sector in the GDP about 0.084% or 37.41% of the gold total revenue (output). The contribution of the general mining sector of about 3.07% to the total GDP. In 2005 I-O Table, the general mining sector contribution increased up to 4.56% and gold up to 0.75%.
It is approximately figured out that in 2000 the contribution of the general mining to the GDP is about 3.34%., increasing up to 6.76% in 2011. If the contribution of the gold sector is around 0.75%, then gold is still expected to have an increasing role of contribution to the GDP, due to the availability of gold deposit in Indonesia based on the geological potentiality.
The very promising international price trend of gold, it is expected that the serious effort of doing grass root exploration of gold deposit in Indonesia (Figure 5) still would be able to strongly support the Indonesian economy in the coming years. In the curves, it looks likely that the trend of the international oil price followed by the trend of gold international price, however, at one side when the price of oil a little bit decilining, the price of gold is still consistently increasing. At the other sides it looks likely that the production (P) , domestic sale (DS) and export (X) are also still increasing with the equations of P (tonnes) = -14008 + 7.061 t (year) (R2= 0.578), DS (tonnes) = -9634 + 4.682 t (R2= 0.459) and X (tonnes) = -5322 + 2.669 t (R2= 0.470) respectively (Figure 6).

Ukar W. Soelistijo1 et al J. of Appl. Sci.& Res., 2014, 2(1):11-29 ______________________________________________________________________________
26
Figure 6. Linear regression of gold production, domestic sale and export in Indonesia, 1994-2012
Figure 5. Yearly basket price of gold , 1998-2013
However, if we might have a look in the period of 2000-2012, it is shown that the curves of gold production and export would tend to decrease that have downward sloping with the equations of regression of P = 10653 – 5.2516 t (R2= 0.4761) and X = 6439.8 - 3.1635 t (R2= 0.2991). At the other side, it looks likely that the domestic sale curve shows the gently positive upward sloping or tends to increase with the regression equation of DS = -296.86 + 0.1608 t (R2= 0.0027) (Figure 7). The exposition of the curves shows that Indonesia is facing the declining production of gold due to the declining the quality of reserves, so that she should decrease the export if the domestic sale should be increased to gain higher added value besides creating employment through supporting the downsteam gold manufacturing industry such as jewelry and so on.

Ukar W. Soelistijo1 et al J. of Appl. Sci.& Res., 2014, 2(1):11-29 ______________________________________________________________________________
27
Figure 7. Linear regression of gold production, domestic sale and export curves in Indonesia, 2000-2012
CONCLUSION
Based on the predicted life time of extraction of the existing known gold deposits in Indonesia, gold production does not exceed within the next thirty years or seventy years after the COW production started in the early of 1970’s. It is recommended that the new activity of exploration should be reinvented with the new climate of investment policy including fiscal regime and the right supportive regulation should be enforced. Modification or improvement of the related regulations to the mining activity such as the laws or regulations of forestry, environmental protection, regional autonomy, tax and labor should also be carried out.
Toward creating this condition the new policy regime should be reintroduced with the spirit of creating new incentives. Area of the prospective exploration is suggested in volcanic arc, epithermal zone, ‘ring of fire’ (where two or more plates collide like in Papua, Maluku and Sulawesi) and even in gold-bearing sedimentary rocks like in West Kalimantan.
It is strongly recommended that the GOI ought to allocate certain amount of revenue coming from gold or mineral in general to do comprehensive systematic exploration over time to assure the resources and reserves of gold and mineral as a whole due to the very promising location of Indonesia in the ring of fire within the Pacific region. Then, mineral resource endowment in this country is still promising to support the national economic growth based on the concept of pro-growth, pro-environment and pro-poor as long as Indonesia has very large amount of population as the biggest four in the world, where mineral resource endowment is also still able to have role to
support econmic growth besides eleviating poverty in the country from now and on.

Ukar W. Soelistijo1 et al J. of Appl. Sci.& Res., 2014, 2(1):11-29 ______________________________________________________________________________
28
REFERENCE
[1] Anonymous (a). Buku Tahunan Pertambangan dan Energi - Mining and Energy Yearbook of Indonesia, 1998, Departemen Pertambangan dan Energi, Republik Indonesia, 1999
[2] Anonymous (b). Buku Tahunan Pertambangan dan Energi - Mining and Energy Yearbook of Indonesia, 1999, Departemen Pertambangan dan Energi, Republik Indonesia, 2000.
[3] Anonymous (c). Buku Tahunan Pertambangan dan Energi - Mining and Energy Yearbook of Indonesia, 2001, Departemen Pertambangan dan Energi, Republik Indonesia, 2001.
[4] Anonymous (d). Buku Tahunan Pertambangan dan Energi - Mining and Energy Yearbook of Indonesia, 2011. Departemen Pertambangan dan Energi, Republik Indonesia, 2011
[5] Anonymous (e). Contract of Work Between the Government of Indonesia and PT Freeport Indonesia Company, 1967.
[6] Anonymous (f). Contract of Work Between the Government of Indonesia and PT Freeport Indonesia Company, 1991.
[7] Anonymous (g). Indonesia Mineral and Coal Statistics 2011. Directorate of Mineral and Coal Program Supervision. Directorate Generate of Mineral and Coal, Ministry of Energy and Mineral resources, Republic of Indonesia, 2011.
[8] Anonymous (h). Indonesian Mineral Development Digest. The Indonesian Mining Association and the Department of Mining and Energy, 1st Edition, 1988.
[9] Anonymous (i). Mencari Paradigma Baru Pengelolaan Sumber Daya Mineral Indonesi., Temu Profesi Tahunan VIII, PERHAPI, 1999.
[10] Anonymous (j). Menumbuh kembangkan Industri Pertambangan Dalam Pelaksanaan Otonomi Daerah, Temu Profesi Tahunan IX dan Kongres IV PERHAPI, Jakarta, 2000.
[11] Anonymous (k). PT Newmont Nusa Tenggara Dalam Pembangunan Daerah Nusa Tenggara Barat. PT Newmont Nusa Tenggara, 1997.
[12] Anonymous (l). The Indonesian Mineral and Coal Statistic. Directorate of Mineral and Coal Enterprises, 2002.
[13] Anonymous (lm). Teknologi Pertambangan di Indonesia. Pusat Penelitian dan Pengembangan Teknologi Mineral, 1995.
[14] Anonymous (n). The Indonesian Mining Industry - Its Present and Future. Proceedings of the First Indonesian Mining Symposium, Jakarta, the Indonesian Mining Association, 1977.
[15] Anonymous (o). The 1995 Mining Indonesia Conference. Indonesian Mining Association (IMA), 1995.
[16] Anonymous (p). The 1997 Mining Indonesia Conference. Indonesian Mining Association, 1997.
[17] A.J. Erickson, R.A. Metz, D.E. Ranta, (Editors). Applied Mining Geology - General Studies Problems of Sampling and Grade Control Ore Reserve Estimation, Society for Mining, metallurgy, and Exploration, Inc. (SME), Littleton, Colorado, 1992.
[18] C.H. Howe. Natural Resource Economics - Issues, Analysis, and Policy, John Wiley & Sons, New York, 1979.

Ukar W. Soelistijo1 et al J. of Appl. Sci.& Res., 2014, 2(1):11-29 ______________________________________________________________________________
29
[19] Mc Moran Copper and Gold. Gambaran Umum PT Freeport Indonesia, 2011. Seminar at UNISBA Bandung, 2011.
[20] U.W. Soelistijo, T. Suseno, I. Suherman, Mujib, C. Nas. Ekonomi Regional dan Model Penerapannya: Pengembangan Sumber Daya Mineral dan Energi Dalam Rangka Otonomi Daerah di Indonesia. Pusat Penelitian dan Pengembangan Teknologi Mineral dan Batubara, Departemen Energi dan Sum,ber Daya Mineral, 2003.
[21] U.W. Soelistijo. Prospect of Potential Nickel Added Value Development in Indonesia. Earth Science. Science Publishing Group, USA.Vol. 2, No. 6, 2013, pp. 129-138. doi: 10.11648/j.earth.20130206.13, 2013.
[22] U.W. Soelistijo. The Influence of Geopolitics and Strategical Factors upon the Development of Natural and Human Resources in Indonesia. Social Sciences. Science Publishing Group, USA. Vol. 2, No. 6, 2013, pp. 200-211. doi: 10.11648/j.ss.20130206.15, 2013.
[23] U.W. Soelistijo. Political Economy of Resources and Its Development: The Case of Indonesia. American Journal of Business,Economics and Management. Vol. 1, No. 1, 2013, pp. 16-24, 2013. [24] U.W.Soelistijo. Control of Illegal Mining (PETI) in Indonesia: Policy and Program. Indonesian Mining Journal, ISSN 0854-9931, Volume 14 Number 1, February 2011, R&D Centre for Mineral and Coal Technology, tekMIRA), 2011.
[25] U.W. Soelistijo. Several evaluation and analytical indicators of regional autonomy implementation impacts in Indonesia: Energy and Mineral Resource Sector Development. Indonesian Mining Journal, ISSN 0854-9931, Volume 15 Number 2, June 2012, R&D Centre for Mineral and Coal Technology, tekMIRA), 2012.
[26] U.W. Soelistijo. Beberapa Indikator Nilai Tambah Ekonomi Indonesia: Sektor Energi dan Sumber Daya Mineral (Several Indicators of the Indonesia Economy Added Value: Energy and Mineral Resource Sector). Jurnal Teknologi Mineral dan Batubara, ISSN 1979-6560, Vol. 9 No. 1, January 2013, Puslitbang Teknologi Mineral dan Batubara), 2013.
[27] Y. Sunarya. Overview of Gold Exploration and Exploitation in Indonesia, Geologi Indonesia - Journal of the Indonesian Association of Geologist, Vol. 12, No. 1, 1989.
[28] Vogely, W.A (editor). Economics of the Mineral Industries, 3rd Edition, the Seely Mudd Series, AIME, Inc., New York, 1976.