u.s. to ofmore important to future combat aircraft because efficient supersonic flight will require...
TRANSCRIPT

STATUS OF THE VALIDATION OF HIGH-ANGLE-OF-ATTACK NOSE-DOWN PITCH CONTROL MARGIN DESIGN GUIDELINES
Marilyn E. Ogburn* and John V. Foster** NASA Langley Research Center
Hampton, VA
I Joseph W. Pahlet and R. Joe Wilson
NASA Ames-Dryden Flight Research Facility Edwards, CA
James B. Lackey Naval Air Warfare Center Aircraft Division
Patuxent River, MD
ABSTRACT
This paper presents a summary of results obtained to date in an ongoing cooperative research program between NASA and the U.S. Navy to develop design criteria for high-angle-of-attack nose- down pitch control for combat aircraft. A fundamental design consideration for aircraft incorporating relaxed static stability in pitch is the level of stability which achieves a proper balance between high- speed performance considerations and low-speed requirements for maneuvering at high angles of attack. A comprehensive data base of piloted simulation results was generated for parametric variations of critical parameters affecting nose-down control capability. The results showed a strong correlation of pilot rating to the short-term pitch response for nose-down commands applied at high- angle-of-attack conditions. Using these data, candidate design guidelines and flight demonstration requirements were defined. Full- scale flight testing to validate the research methodology and proposed guidelines is in progress, some preliminary results of which are reviewed.
INTRODUCTION
Projected scenarios for future air combat indicate the need for highly agile aircraft that can operate effectively over a greatly expanded maneuvering envelope. As a result, significant activities are currently underway to develop technologies that are key to providing this enhanced capability. A broad NASA research program which was conceived to address advanced technology opportunities for high-performance aircraft is the
High-Angle-of-Attack Technology Program (HATP). The HATP is a fighter technology development and validation program which is focusing on providing flight-validated methods and concepts essential for the design of fighters possessing unprecedented high-angle-of-attack maneuverability and controllability. The program uses the unique expertise and facilities of NASA's leading aeronautics research centers, including the Langley, Ames, and Lewis Centers. The research approach being taken is a balanced one involving closely-integrated wind- tunnel experiments, computational aerodynamics, piloted simulation, and flight tests of an F-18 research testbed airplane known as the High-Angle-of-Attack Research Vehicle (HARV). This vehicle has been modified to make it capable of testing advanced controls, including multi-axis thrust-vectoring and advanced aerodynamic controls. Reference 1 contains a more complete description of this program.
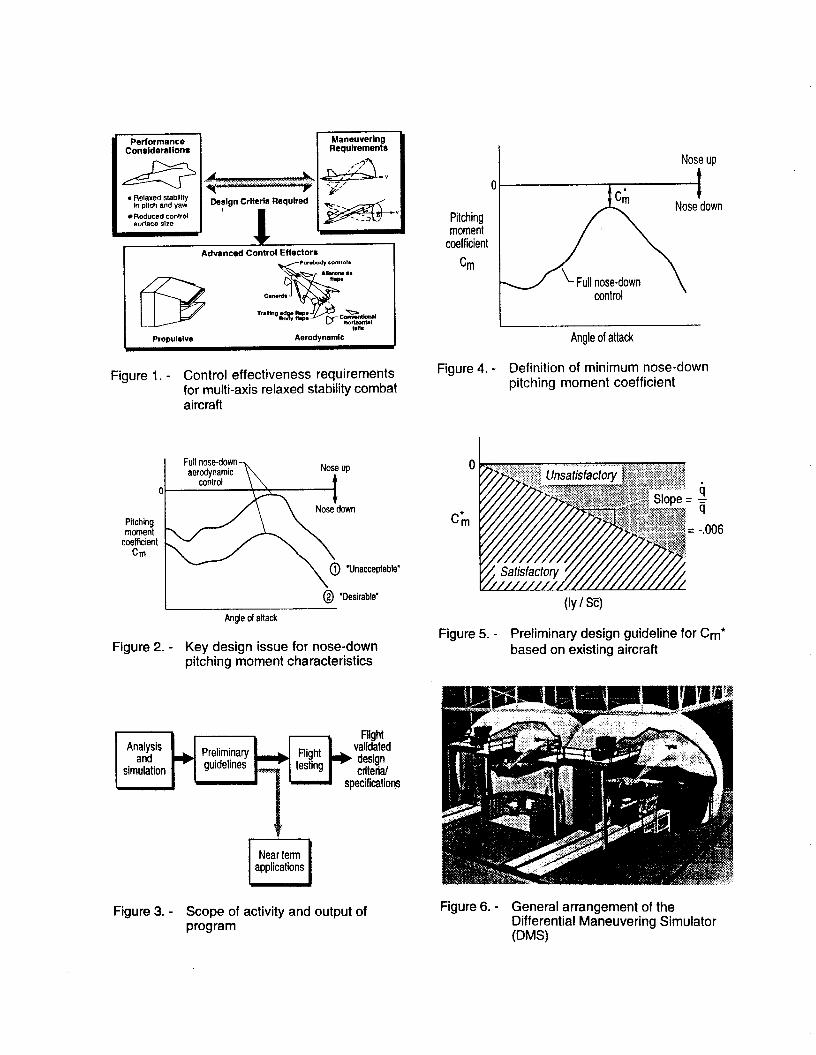
One of the goals of the HATP is to identify maneuvering requirements for advanced fighters and the corresponding design criteria to aid in making critical design tradeoffs. A well-defined set of criteria exists and has been used for the design of combat aircraft for performance considerations, as shown in figure 1. These criteria address the use of concepts such as relaxed stability in pitch and yaw and reduced control surface size to enhance performance characteristics. However, detailed, validated design criteria to define minimum maneuvering requirements, particularly for flight at low speeds and high angles of attack, do not currently exist. These criteria are needed for all maneuvering axes to aid in making the critical design tradeoffs between performance and maneuvering requirements, which often result in conflicting design characteristics. The
*AIAA Associate Fellow "Senior AlAA Member tAfAA Member
https://ntrs.nasa.gov/search.jsp?R=20040121214 2020-03-29T08:42:43+00:00Z

use of advanced propulsive and aerodynamic control effectors will aid in achieving the control moments to meet enhanced maneuvering requirements: however, these control concepts cannot be utilized most effectively for making design tradeoffs until design criteria for maneuvering are determined.
As part of the HATP, NASA and the US. Navy are conducting a joint research program to develop high-angle-of-attack control margin requirements for air combat maneuvering. The first element addressed in this research is nose-down pitch control at high angles of attack. The concept of relaxed static stability (RSS) in pitch has been incorporated in a number of current high-performance aircraft for the enhancement of subsonic maneuvering performance. With the growing emphasis on supersonic operations, RSS is expected to be even more important to future combat aircraft because efficient supersonic flight will require balancing the aircraft for near neutral stability at these conditions. This design approach, however, will generally result in a very unstable aircraft at subsonic conditions due to the large shift in aerodynamic center with Mach number. These high levels of instability can present extremely demanding stability and control problems at high angles of attack, such as susceptibility to pitch departures and deep stall trim from which recovery may be difficult.
avoided if sufficient nose-down moment can be generated at any angle of attack. Thus a key design parameter for RSS high-performance aircraft is the pitching moment available with the application of full- nose-down control, as illustrated in figure 2. The key design issue is the level of nose-down pitching moment required for tactical maneuvering and for safety of flight. Although the level of Cm is important throughout the angle-of-attack range, it is particularly crucial at the point where the magnitude is a minimum, which is sometimes referred to as the "pinch point". Guidelines are needed to help the designer determine that, for a particular airplane, the Cm characteristics illustrated by curve 1 are unacceptable whereas curve 2 is desirable. Determining the design goal for nose-down control capability for a given configuration can involve a crucial design trade. An overly stringent requirement may result in excessive weight and supersonic performance penalties, whereas one which is too lax could lead to low-speed high-angle-of-attack controllability problems and degraded maneuvering capability.
The problems associated with RSS designs are
Unfortunately, no validated, generally accepted design guidelines have been available for determining the proper level of nose-down pitch control capability for a given configuration. Establishment of such guidelines requires a systematic series .of ground-based experimental and analytical studies followed by full-scale flight test and validation. To initiate this process, a joint research
program between NASA and the U.S. Navy was developed and implemented in the fall of 1989. This program is often referred to by the acronym HANG (High-Angle-of-attack Nose-down Guidelines). A study team was formed consisting of NASA Langley researchers and engineers from several Navy technical organizations. Figure 3 shows the overall outline of the activity. The first step involved analysis and a simulation study which were used to develop a set of preliminary guidelines for immediate use. Flight testing for validation of these guidelines is in progress. The final output of this work will be a set of flight-validated design criteria and specifications for flight test demonstration that these criteria have been met. This paper presents a summary of this program, with emphasis on the overall research approach used and some of the results obtained to date.
- C
Cm
Cm*
h
b
9
q - 4 - 9s
S
s1, s2
t
v
VS
a
a*
Aa*
NOMENCLATURE
wing mean aerodynamic chord, ft
static pitching moment coefficient
minimum nose-down pitching moment coefficient at any a
altitude, ft
moment of inertia in pitch, slug-ft2
pitch rate, deg/sec
pitch acceleration, rad/sec2
dynamic pressure, Ibf/ft2
dynamic pressure at the stall, Ibf/ft2
wing reference area, ft2
slope of Cm vs. a curve for a below and above A d , respectively, per deg
time from initiation of recovery controls, sec
free-stream velocity, Wsec
stall speed, ft/sec
angle of attack, deg
maximum a at which Cm* occurs, deg
range of angle of attack over which Cm* occurs, deg
2

Y
01 ($
R
Subscripts:
i
max
rec
velocity vector pitch angle from horizontal, deg
pitch and roll angles, deg
roll rate about the velocity vector, deglsec
I
initial value
maximum value
value at time of recovery to a < 10"
DEVELOPMENT OF PRELIMINARY GUIDELINES
Studv Amroach and Test Methodoloay
The subject program is composed of two major phases. The first phase, which has been completed, involved the development of proposed guidelines using piloted simulation while the second phase, which is currently in progress, will refine and validate these guidelines via full-scale flight testing and additional simulation. In the first phase, candidate guidelines were defined by examining existing government and industry criteria. These guidelines were then evaluated and refined in a systematic piloted simulation study using the Langley Differential Maneuvering Simulator (DMS). In this study the key parameters affecting nose-down pitch capability were systematically varied. A test methodology involving specific assessment techniques was developed and used for this application. This approach was necessary to ensure that the guidelines derived from this work would be based on a comprehensive set of data that accurately quantified the relative merits of a wide range of nose-down response capability. It was also important that the results be expressed in a form which could be related easily to a guideline format which could be applied directly to the aircraft designer's needs. The factors that made up the overall test methodology included the simulation capabilities, the parametric variations, the experiment maneuvers, the rating approach, and the appropriate figures of merit for the nose-down response. The following sections will briefly summarize the activities and resulting output in these areas. Additional information about the methodology used in the simulation study and the results that were obtained can be found in references 2 through 4.
Existina Guidelines. - The first step in the study approach was to review the available literature on existing guidelines. The importance of high- angle-of-attack nose-down pitch control capability for RSS fighter designs has been recognized since the advent of the first generation of relaxed stability
3
aircraft such as the YF-16 (see reference 5). Since that time a number of design guidelines for nose- down pitch control have been proposed, and a significant data base has accumulated from simulation and flight test experience. A literature survey was conducted to gather information on past studies in which pitch control margin and control power criteria were developed or proposed. It became evident that very little work has been done in this area and that the design guidelines that are available are not based on comprehensive, systematically derived data. References 6 through 12 describe studies that have been conducted and reported, and the results of some of these studies are summarized in reference 13.
NASA Preliminary Guideline. - As a preliminary step in developing a systematic test approach and a comprehensive set of guidelines, an analysis was made of the high-angle-of-attack nose-down control capability of existing high-performance RSS aircraft. This analysis was first published and is described in more detail in reference 13. Using the substantial data bases for high-angle-of-attack flight that have been developed over the years for these aircraft, a preliminary indication of nose-down control requirements for future RSS aircraft was developed. The minimum nose-down pitching moment coefficient value, designated Cm* (see figure 4), is a key parameter for the definition of required nose- down pitching moment because the determination of the smallest value that is acceptable for pitch recovery is important for making critical configuration design tradeoffs.
Because Cm can be related to a first-order definition of pitch acceleration by using the aircraft inertia and geometry information, these characteristics were examined for some existing aircraft and correlated with the known high-angle-of- attack nose-down capabilities of these aircraft. The results obtained by plotting what were considered to be minimally satisfactory values of Cm* are summarized in figure 5 and define a candidate design guideline based only on the airplane mass and geometry characteristics. The designer, knowing the pitch inertia and wing geometry of the aircraft, can use the plot in the figure to determine the value of Cm* that is needed to produce a "satisfactory" nose-down response. It should be noted, however, that this guideline was obtained from a limited analysis of existing RSS aircraft. A number of factors influence the required level of high-angle-of-attack nose-down pitch control capability. These factors are only indirectly reflected in the above analysis. As a result, this analysis should only be used as a rough preliminary guideline for determining high-angle-of-attack nose-down pitch control requirements.

By expressing this guideline as a pitch angular acceleration requirement at V = VS, it can be compared with other guidelines. Using a typical value of =as of 40 Ibf/ft2, the required nose-down angular acceleration capability for satisfactory response would be:
-q > 0.24 rad/hec2 at V = VS
A comparison of this value with the other existing guidelines is discussed in a later section. The viability of the existing guidelines was assessed in the subject simulation study. Although this guideline for satisfactory response is useful and easy to apply, it was felt that a more comprehensive criterion that applies to more than just one point on the Cm curve is needed. As a result, a systematic parametric study using piloted simulation was conducted as the first step in developing such a design guide.
F-18 DMS Simulation. - The simulation math model used as the basis for the parametric study was an existing model of the F-l8A. This full-envelope model includes a comprehensive set of aerodynamic data, engine thrust characteristics, and a representation of a production version of the flight control system. A vital capability for this study was the flexibility provided in the software for programming parametric variations of key aerodynamic characteristics, as will be discussed in the next section.
The Langley Differential Maneuvering Simulator (DMS) is a twin-dome fixed-base simulator with many state-of-the-art features which enhance its utility as a tool for air combat research and high- angle-of-attack flight dynamics studies (see figure 6). These features include a visual scene produced by a computer-generated imaging system, programmable displays and force-feel systems, and artificial "g" cues. Reference 14 contains a detailed description of the DMS.
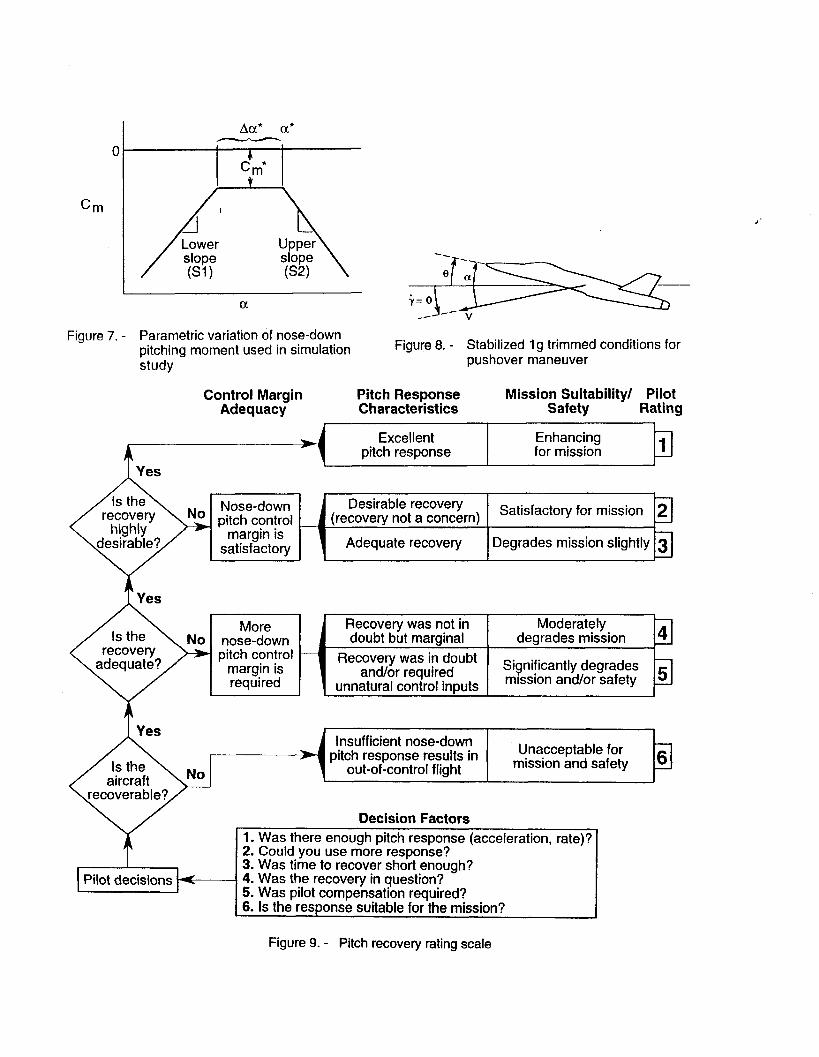
Parametric Variations. - A key element of the simulation study involved variations of critical parameters affecting nose-down control capability and response. Those parameters which were chosen to characterize the static nose-down pitching moment characteristics are illustrated in figure 7 and include: (1) the minimum value of Cm, Cm*, (2) the angle-of-attack range over which Cm* occurs, Aa*, and (3) the slopes of the pitching moment curve for angles of attack below and above Aa*, S1 and S2. These parameters were varied individually and systematically for the evaluation. The range of variations for the four characteristics that were evaluated were based on the Cm characteristics of current aircraft and projected future designs. On this basis, the value of Cm' was varied from 0 to -0.337,
a* was held at a = 50", Aa* was varied from 0" to 30", S1 from O/deg to O.OOG/deg, and S2 from O/deg to - 0.022/deg.
ExDeriment Maneuvers. - Much consideration was given to the selection of appropriate evaluation maneuvers which would be simple to execute and analyze, and yet relevant to the determination of nose-down control capability. Four fundamental types of maneuvers were performed in the DMS for the piloted evaluation, all of which were of some utility in the guideline development process. All of the maneuvers performed were open-loop in the sense that no capture of specific recovery conditions was required. The recovery was considered to be complete as soon as the angle of attack decreased to below 10".
The primary maneuver used in the evaluation was a pushover from 1 g stabilized trimmed wings- level flight at high angles of attack to the recovery angle of attack, and will be referred to as the primary evaluation maneuver. For this purpose 1 g stabilized trim is defined as that condition at which there are no net forces or moments acting on the airplane such
that q = dr. = r = h = 0. Figure 8 depicts this flight condition. The flight path angle (y) will be less than zero (descending flight) at angles of attack where there is insufficient thrust to maintain level flight. These maneuver conditions are ideal for directly assessing the nose-down control moment available over an angle-of-attack range from an initial high angle of attack down to the recovery angle of attack. Performing the maneuver at these conditions minimizes the thrust and performance effects. A nose-down command applied at initial conditions at which the pitch attitude or the flight path angle is
changing (6 or? f 0) results in changes in angle of attack that are not due solely to the nose-down moment generated by the application of nose-down controls. In addition, the complexity of the motions and the pilot technique is greater so there is less repeatability and the analysis of the motions is less straightforward. Although the pushover maneuver was found to be the most relevant to the determination of nose-down control capability, other maneuvers were performed and found to have some utility in the evaluation. These maneuvers included pushovers with initial nose-up pitch rate (called "pull/pushes") and recoveries from zoom climb and rolling conditions, and are described in references 3 and 4.
Pitch Recovery Ratina Sca Ig. - The pilots' ratings and supporting commentary were critical data elements in this study. The pitch recovery rating scale, shown in figure 9, was developed to quantify specifically the pilot's qualitative assessment of control margin adequacy, pitch response characteristics, and mission suitability or safety.
4

Much time and thought were applied to the development of this scale, with valuable contributions made by pilots and outside flying qualities specialists. During the preliminary simulation evaluation several versions of the scale were evaluated and refined to arrive at the final one, which was used successfully in the primary evaluations. At first glance the scale is similar to the Cooper-Harper rating scale in that it follows a decision tree format that requires the pilot to answer a series of two-way choice questions leading to a final rating (see reference 15). As is the case for the Cooper-Harper scale, there is a dependence on the precise definition of the terms used. On the other hand, the pitch recovery rating scale differs significantly from Cooper-Harper in that there is no dependence on task performance or workload. Consequently, using the scale required the evaluation pilot to relate the suitability of the observed characteristics to mission requirements or acceptability based on an observation of an open- loop response. To assist the evaluation pilot in establishing the proper mind-set, a set of six decision factors was presented, as shown in the figure. From the decision factors the evaluation pilot entered the rating scale and assigned one of the eight ratings shown, which ranged from 1 to 6. Some minor refinements were later made to this scale to aid in its use, and these will be described in the section on flight test validation of the design guidelines.
Fiaures of Merit. - An important issue regarding the use of the rating scale as well as the analysis of the simulation results for the development of design criteria was the need to establish figures of merit to be used in evaluating the various recovery characteristics. A large number of potential figures of merit were considered. They can best be compared by characterizing them according to the strength of their relationship to pitch control power and the time scale relative to initiation of the nose-down recovery command. Figure 10 shows this overall relationship for a number of potential figures of merit for nose- down control capability. Clearly, in the absence of significant angular rates, pitch acceleration (q) bears a strong relationship to pitch control power because it is directly proportional to static pitching moment coefficient (Cm). The longer time-scale parameters shown on the right end of the plot have a much weaker association with control power and are more closely associated with airplane performance effects such as thrust and drag. Therefore, those figures of merit on the left side of the scale would be expected to be the more critical ones for nose-down control design considerations, although the others could also be useful as supplemental or check parameters.
Use of Pilots and Data Collection. - A primary group of six pilots participated in the simulation study. The group consisted of four Navy pilots, one Air Force pilot, and one NASA research pilot, most of whom have extensive flight testing background. A thorough pre-briefing was presented to each pilot regarding the background and purpose of the program, the simulator characteristics, and the maneuvering techniques and assessment methods to be used. The pitch recovery rating scale previously described was used to quantitatively document the pilot's opinion of the pitch response, and a set of suggested additional response characteristics was provided to be commented on qualitatively as desired. The pilots usually performed each maneuver for a given initial condition and Cm variation at least three times before assigning a rating and expressing comments. After each simulation session a written summary was obtained from the pilot as further documentation of his evaluation. For the primary evaluation, approximately 750 test points were flown during 19 simulator sessions or about 55 test hours.
Simulation Results
The overall results of the piloted simulation study were derived from the analysis of the aircraft motions and pilot quantitative ratings using the pitch recovery rating scale previously described as well as their qualitative comments. Parametric variations of the nose-down pitching moment capability were evaluated in the performance of the primary evaluation maneuver. Although many different figures of merit were considered and analyzed, only the most critical results that influenced the proposed design guidelines, based on statistical correlations of pitch recovery ratings with response characteristics, are presented herein. Additional maneuvers were flown following the primary evaluation to validate the conclusions of the initial quantitative analysis by verifying that the pilot ratings could in fact be predicted for a wide variety of pitching moment characteristics. The amount of data collected was statistically significant, as will be shown. The results obtained from the performance of maneuvers other than the pushover are summarized in references 3 and 4.
A large number of primary evaluation (pushover) maneuvers were performed in the evaluation of 25 separate parametric variations of the static Cm characteristics. The initial conditions for this maneuver were h = 15,000 ft and a = 30°, 40°, 50" (a*), or 55" (maximum trim angle of attack). The thrust level used was that required for stabilized l g trim at these conditions, and the throttle remained constant throughout the maneuver. The recovery technique used in all cases was to apply full forward stick and maintain it until the angle of attack was below 10". at which point the maneuver was
5

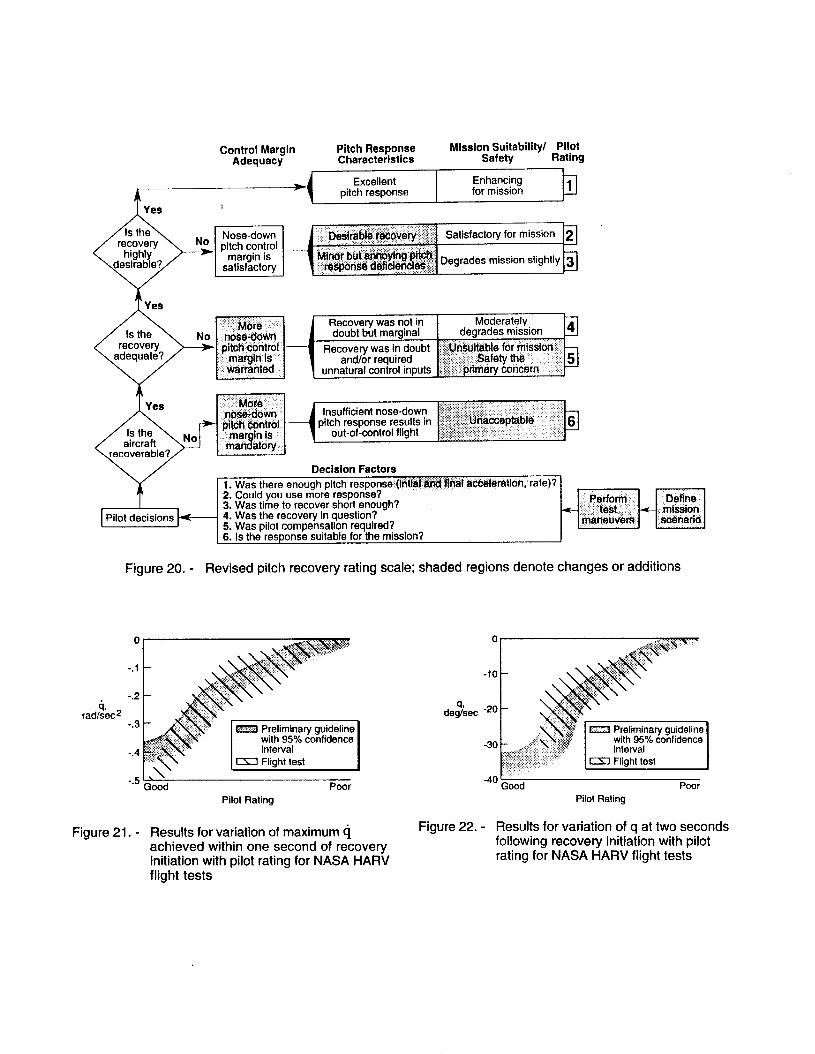
considered to be complete. Figures 11 and 12 present summary results from these maneuvers for two figures of merit, the maximum q obtained within one second and q at two seconds following the initiation of the nose-down command. Evidence of the statistical significance of the data is indicated by the upper and lower boundaries of the shaded region, which represent the 95-percent confidence interval about the mean values.
Based on the pilot comments and the figure- of-merit considerations discussed previously, a wide variety of potential figures of merit which could be used to translate the results of the simulation evaluation into design criteria were explored. The result of the pilots' initial experience with the primary evaluation maneuver was that not one but several figures of merit are considered by a pilot during a recovery from high angles of attack, with a different parameter being examined at discrete time increments. In their qualitative comments concerning their assessment of the pitch recovery response, the pilots typically stated that they were primarily looking for two types of response: (1) an immediate nose-down response following the pilot input, and (2) a corresponding buildup of motion over the first part of the recovery. These pilot comments suggested that the primary figures of merit should be initial pitch acceleration (q), as an immediate indication of control moment capability, and the pitch rate achieved within a short time. The time to recover was a secondary consideration and only became a concern for recoveries from ai = a* = 50" after at least five seconds had passed without a completed recovery to a < 10". The pilots felt that it was desirable that the response be "predictable" such that there was a nearly constant pitch rate buildup (q ) with time throughout the maneuver and in particular that a q reversal (4 > 0) would not be desirable. In addition, the pilot opinion of the response was generally found to be independent of the initial q or 8 for the maneuver.
The maximum pitch acceleration obtained within one second of the initiation of the forward stick command correlated more closely with pilot rating than the maximum q within any other time interval. (Multiples of 0.5 second were analyzed.) The results for the maximum q within the first second versus pilot rating for the primary evaluation maneuvers are shown in figure 11. The strong correlation between this short-term response and pilot rating is very clear. Intervals of 0.5 second were also analyzed to determine the best statistical correlation between pitch rate and pilot rating, which was found to be for t = 2 sec. Figure 12 shows these results for the same maneuvers represented in figure 11. The overall trend is very similar to that for the results for q within the first second. In addition, the pitch rate
results correlate well with the pitch acceleration results in that the mean pitch rate value at each pilot rating is approximately equal to the maximum q in the first second integrated over a little less than two seconds. These simulation results were used to develop a preliminary set of design guidelines which are currently being evaluated in flight tests.
ComDarison of results with other studies
The results derived from the simulation study indicate desirable levels of pitch acceleration of about -.3 rad/sec2. This value compares well with the NASA preliminary guideline described in an earlier section (and in reference 13) and with the results of another study described in reference 6. A comparison of the results from these studies is shown in figure 13, which includes the NASA preliminary guideline (Nguyen) and unpublished information based on experience with the F-5 (Skow).
ComDarison of results with results usina simulations of other aircraft
To obtain additional validation of the simulation study results, existing simulations of four aircraft other than the F-18 were flown by pilots who had participated in the original study. The evaluation maneuvers used in the original study, particularly the primary pushover evaluation maneuvers, were performed and rated, and the results for one of these aircraft simulations are shown in figures 14 and 15. These results were obtained using the DMS, which had been used for the original study, with a math model of the X-29, which also is an RSS airplane. The center of gravity location was varied over a wide range to obtain the variation of pitch response and pilot ratings shown, and two pilots flew these maneuvers. As the figures show, the results correlated very closely with the preliminary guideline values at each pilot rating for the two primary figures of merit. Additional evaluations, the results of which also agreed well with the DMS study, were conducted using the DMS F-18 simulation without the parametric variations of Cm and the Navy's Manned Flight Simulator (MFS) facility simulations of the X-31 and F-14. A limited study which examined motion effects was also conducted using the Wright Research Development Center LAMARS facility F-15 S/MTD simulation. A description of these evaluations is included in reference 4.
FLIGHT VALIDATION OF RESULTS
Wiectives and Aporoach
Full-scale flight validation of the preliminary guidelines derived from the results of the simulation study is undetway to validate and refine as necessary the research test methodology used in the
6

development of the guidelines and the numerical guideline values. The approach being taken is to conduct a two-phase flight program. Phase I, a very limited study which was done primarily to validate the test methodology using a Navy F-18 and the NASA HARV, has been completed. The second phase, which is currently in progress, is a much more detailed study to validate ,the guideline values, using the H A W with thrust-vectoring controls to provide a wide range of nose-down pitch response. All of the Navy and NASA pilots who have participated in the flight tests were thoroughly briefed on the objectives and background of the program. They also practiced the evaluation maneuvers and became familiar with the use of the pitch recovery rating scale in the Langley DMS, using the parametric variations as had been done in the simulation study. The Navy flight tests performed as part of the phase one study, though very limited, were more detailed than the HARV tests, which were done as part of the envelope expansion of the airplane; therefore, these Navy tests are described as an example to illustrate the overall results of the phase I study.
Phase I Naw F-18 Fliaht Tests
As part of phase I of the flight tests to validate the methodology used to derive the design guidelines, flight tests of a Navy F-I8 were conducted at the Naval Air Warfare Center Aircraft Division (NAWC AD) at Patuxent River in the Fall of 1991. The test F/A-l8A airplane shown in the photograph of figure 16 was used. Two Navy test pilots performed and rated 32 pushover maneuvers by applying full forward stick inputs from l g stabilized trim conditions at high angles of attack during six flights. The center of gravity was varied from .22% to .265C, starting with the most forward positions and then moving aft, using a fuel-transfer center-of- gravity control system. The maneuvers were initiated at a = 40" or 50" and 8 = 15" at altitudes between 35,000 ft and 40,000 ft. An angle-of-attack buildup process was used such that the maneuvers were initially performed, but not rated, at lower angles of attack. Prior to the flights, the maneuvers were also flown in the NAWC AD MFS F-18 simulator at the actual flight test conditions. A more complete description of these flight tests is contained in references 16 and 17.
Overall, the flight program was very successful in achieving its primary objective which was the verification of the fundamental simulation methodology and evaluation of the key figures of merit for nose-down pitch response. The suitability of the pushover as the primary evaluation maneuver was confirmed, and the overall utility of the rating scale was verified. These initial flight results, which were very limited, indicated that the short-term pitch response was the primary factor that determined the pilots' opinions of the recoveries.
There are several noteworthy phenomena encountered in these flight tests which may have influenced some of the pilot ratings but provided valuable information which was taken into account in defining the methodology being used for the HARV in phase II of the flight test validation. It was found that for many of the pushover maneuvers, the pitch response was different from the relatively constant and linear pitch acceleration response used in the simulation study. The differences were due in part to aerodynamic control nonlinearities that are peculiar to the F-18 (e.g. nonlinear stabilitor control power variation at high angles of attack). In addition, only limited variation in the overall response (i.e. magnitude of pitch acceleration and rate) was achieved for the particular range of center-of-gravity location tested because the control laws were designed to attempt to provide invariant response. As a result, all of the recoveries were fairly rapid such that safety of flight was not a concern, so the evaluation was based almost entirely on tactical considerations. Within this context, the additional visual and motion cues experienced in flight made the pilots more sensitive to and more critical of nonlinear response to their nose-down commands and therefore for these cases they tended to give lower ratings in flight than in the simulator. To minimize these phenomena in the phase II flight tests of the HARV, the thrust vectoring capability is being used to provide a much wider range of the magnitude (to achieve the full range of pilot ratings) and character of nose-down pitch response, as will be discussed in the next section.
A final lesson from these flight tests was learned from the workload required to stabilize the airplane at the specified initial conditions of 1 g stabilized trim at high angles of attack. For these Navy flights, a specific target pitch attitude angle of 15" was used, to match the primary value used in the simulation study. In the simulation study, the initial conditions for the maneuvers, including the required throttle settings, were calculated and pre-set by the
' computer so that the pilot only needed to perform the maneuver itself. The method used in the Navy flight tests required that the pilot vary the thrust to stabilize at the pitch attitude of 15". During the flights, it was found that establishing the required test conditions for angle of attack and pitch attitude using this method was very difficult because the pilot had to "close the loop" on trim airspeed with the throttles to stabilize the flight path angle. The pilot workload required to accomplish this task had a tendency to distract the pilot's attention from the initial portion of the pushover and may have affected the pilot ratings. For the phase II flight tests the initial condition specification was adjusted to minimize this workload.
As a very limited, preliminary check of the guidelines developed in the simulation study, the
7

results from flight for the maneuvers with the most linear pitch acceleration response were compared with the preliminary guidelines derived from simulation data shown earlier (see figures 11 and 12). These results are shown in figures 17 and 18 for the limited range of responses and pilot ratings obtained for these particular maneuvers. Figure 17 shows that there was fairly good correlation between the aircraft response and the pilot ratings for the 4 max in one second metric. Similarly, the correlation for the pitch rate at two seconds metric was also fairly good, as shown in figure 18. It should be noted that this flight data base is very small so that no conclusions can be drawn based on this data alone. Definitive refinement and validation of the guidelines will be accomplished in the second phase of the flight test program which is currently in progress.
Phase II NASA HARV Fliaht Tests
As was stated previously, the objective of phase II of the flight test study is to validate the design guideline values that were derived from the simulation study. To accomplish this objective as well as other objectives of the HATP, flight experiments of the NASA F-18 HARV are currently being conducted at the NASA Ames-Dryden Flight Research Facility. The HARV, shown in figure 19, is uniquely suited for this flight investigation because of the wide range of nose-down pitch response available through the use of its thrust-vectoring system combined with the normal aerodynamic tail control. This vehicle is a pre-production F/A-18 aircraft on loan to NASA from the U.S. Navy and was previously used during the full-scale development flight testing, primarily for high-angle-of-attack and spin evaluations. The HARV is a flying testbed which has been extensively modified to allow it to be used as a technology demonstrator and validation tool to conduct flight tests of advanced controls. A thrust- vectoring vane system, designed and built by the McDonnell Aircraft Company, has been installed in place of the divergent nozzles. A research flight control system has been integrated into the basic F/A-18 flight control system for research testing. The vehicle can, in effect, be used as a variable stability airplane by taking advantage of the capability to vary parametrically and systematically control law features within this research flight control system. By varying the nose-down pitch command limit and control surface rate limit values, the pitch response magnitude and shaping can be specified. In this manner, pitch acceleration responses that vary over a much wider range of magnitude than those of phase I of the flight tests can be provided. A more complete description of the HARV and the research flight control system is contained in reference 18.
Using the HARV simulation model, appropriate sets of values for the nose-down pitch command and rate limits were defined for use in performing the
flight maneuvers. A total of eight sets of these values were programmed in the research flight control system, any one of which can be engaged by the pilot's selection in the cockpit of an OBES (on-board excitation system) setting prior to each maneuver performed. The pitch command limit values ranged from the full nose-down (default) value to -5" and the rate limit values from the maximum rate to as low as 1.6 deg/sec. A specific code number was designated for each OBES setting, for which the pilot did not know the corresponding control law values. The use of codes minimized the possibility that the pilot had pre- conceived expectations of the pitch responses and there was no particular ordering of the maneuvers with respect to the level of response. These tests were therefore more "blind" than those performed in phase I of the flight tests.
A first set of maneuvers, including pushovers from 1 g stabilized trim conditions at high angles of attack, has been completed. In November 1992 a few pushover maneuvers were performed by one of the Navy pilots who had participated in the phase I Navy flight tests. This test is described in detail in reference 19. In December 1992 and January 1993 a NASA research pilot performed 25 pushovers during several flights. The center-of-gravity location was nearly constant during these maneuvers. The initial conditions were as follows: (1) ai = 30" - 65"; (2) throttle setting = idle, military, or maximum power; and (3) hi = 20,000 ft or 27,000 ft. As was explained in the previous section on the phase I flight tests, the pilot workload involved in setting up the required initial conditions for these maneuvers if the pitch attitude rather than the throttle setting is specified is relatively high. Specifying the throttle setting instead for the phase I I tests has resulted in a lower pilot workload, particularly when the simulation math model is used to predict the pitch attitude value for l g trim and this value is used as a guide by the pilot.
As was mentioned previously, for use in phase I I of the flight tests some refinements were made to the pitch recovery rating scale that was used in the development of the preliminary design guidelines. These changes were relatively minor and were made primarily to minimize difficulties encountered at times in its use by clarifying specific wording that was considered to be ambiguous or by adding additional information. Changes that were more significant than these were considered, some of which are described in reference 17; however, each was considered to be disadvantageous in some way. The refinements that were made are not considered to be extensive enough to affect the study results to date. The rating scale in its current form, which is still subject to change, is shown in figure 20. The shaded regions represent those sections that were reworded or added in the refinement process.
8

As was the case for the phase one flight test results, the HARV tests to date have validated the simulation study methodology and the initial results have indicated that the short-term response is the primary basis for the pilot's opinion of the recovery. Figures 21 and 22 show the results for the pushover maneuvers performed to date on the HARV and a comparison with the simulation results. The range of nose-down pitch response obtained in these tests was much wider than that for the phase one Navy tests, due to the response variation afforded by the use of the thrust-vectoring system. In addition, there were many more maneuvers for which the initial pitch response was fairly linear and therefore comparable to that of the simulation study. The flight data for maneuvers other than the pushovers that have been performed to date are currently being analyzed. These maneuvers include zoom climb recoveries and nose-up captures of specified high angles-of- attack. Additional flight tests using the HARV are planned, including more pushovers and pull/pushes, recoveries from rolls, and pushovers with the added closed-loop task of capturing a low angle of attack within specified criteria.
Some useful information was obtained from the pilot comments and flight data regarding the effect of motion cues in flight, which were not available in the simulation study. Two motion characteristics were experienced in some of the pushover maneuvers which are noteworthy, although they did not directly affect the evaluation of the preliminary design guidelines obtained from the simulation study. The first characteristic was that in some maneuvers some discomfort was felt that the nose of the airplane might "tuck under" through the vertical before the airplane could be completely recovered, although this never occurred. This feeling was experienced only in maneuvers with good nose-down response which were initiated at relatively low pitch attitudes and/or high initial angles of attack. The second motion characteristic related to the desired response shaping following the initial response. For the better, more tactically usable responses, a rapid increase in pitch rate to a constant high value (Le. a pitch rate command system) was preferred over a continuously increasing pitch rate for the entire recovery (i.e. a pitch acceleration command system). For the poorer responses, however, in which the initial response was low, a continued pitch rate increase was considered to be more appropriate, to give the pilot increasing confidence that the aircraft would recover.
SUMMARY OF DESIGN METHODOLOGY AND FLIGHT DEMONSTRATION REQUIREMENTS
Desian Methodoloay
performance levels in recoveries from high-angle-of- attack conditions. In order to ensure that the required pitch response is achieved in a new configuration, guidelines are required for designing the proper Cm characteristics early in the design process. These guidelines must be easy to use and yet comprehensive enough to account for all major aerodynamic and kinematic conditions encountered in maneuvering flight. The designer must have a high level of confidence that using the design guidelines will result in the required performance when the pitch response is ultimately demonstrated in flight. It was previously discussed that, based on the simulation study results, the required pitch response can be characterized by figures of merit which describe the initial response.
Using the preliminary guideline values derived from the simulation study results, a methodology for designing the Cm versus angle-of-attack curve is being developed. A methodology is being developed to determine design requirements based on the consideration of various maneuvers and motions which involve the significant figures of merit. This methodology will be useful for determining the minimum value of Cm required at the pinch point (Cm*) and the shape of the static pitching moment curve, based on the appropriate aircraft characteristics. The development and refinement of the design methodology will continue as the flight and simulation activities to validate the simulation study results are conducted.
Fliaht Demonstration Reauirements
A set of candidate flight test maneuvers was developed in this study to demonstrate pitch control capability and determine whether an airplane meets the design pitch response requirements. The maneuvers are being performed in ongoing full-scale flight tests, as was previously described, to verify their utility for this purpose. The maneuvers are closely related to the evaluation maneuvers used in the simulation study to allow the fundamental understanding of the flight dynamics gained from simulation to be applied to flight test and assure that the design methodology is reflected in the maneuver requirements. Piloted simulation has been very useful for the development of these maneuvers. The specific test techniques and flight conditions have been developed in the simulator in order to determine optimum piloting techniques and the most efficient methods for acquiring the demonstration data. Specific test conditions which are difficult to achieve or assess have been identified prior to flight test. Also, operational constraints on the maneuvers have been evaluated and alternative demonstration requirements developed when required.
From the manned simulation tests, a generalized pitch response was identified for several
9

The candidate flight demonstration maneuvers being evaluated in flight are the same four types of maneuvers that were used in the simulation study. The primary evaluation maneuver, as was previously stated, is the pushover from 1 g wings-level conditions. In addition, pull/push maneuvers, recoveries from zoom clivbs, and pushovers during rolls are specified. Successful demonstration of meeting the design criteria includes achieving threshold values of pitch acceleration and pitch rate within the specified time periods. Techniques for achieving 1 g stabilized conditions at high angles of attack have been evaluated, including initial conditions, stabilization criteria, and the impact of engine operating limitations. The primary purpose of the pull/push and zoom climb maneuvers are to demonstrate acceptable recoveries from angles of attack beyond the maximum trim capability. An understanding of the flight mechanics associated with these maneuvers was achieved in simulation. The demonstration of pushovers from rolling conditions evaluates the level of nose-down control power in the presence of inertial coupling effects. These roll and pitch maneuvers can be very complex and difficult to evaluate; piloted simulation was invaluable in their development. In summary, piloted simulation was used to develop maneuvers to safely and efficiently demonstrate compliance with the proposed nose-down pitch control design requirements. These simulation-derived maneuvers are being evaluated in flight using the HARV.
CONCLUDING REMARKS
The first phase of a cooperative NASNNavy research program to define the design requirements for high-angle-of-attack nose-down pitch control for combat aircraft has been completed. A specific testing and analysis methodology for parametric variations of nose-down control, experiment maneuvers, and pilot ratings was developed and used. Extensive simulation results were obtained, which were used to define the key nose-down characteristics required. Two figures of merit relating to the short-term pitch response were determined to best represent these requirements: (1) the pitch acceleration achieved within one second following initiation of the nose-down command and (2) the pitch rate at two seconds after the command. The numerical results of this simulation study compare well with the results of previous studies and the results using simulations of other aircraft. A proposed set of design guidelines was derived from these results and a methodology is being developed to use these guidelines to define the shape of the static pitching moment curve.
Much work remains to be done to reach the final goal of a complete set of fully-validated design criteria and specifications for demonstrating in flight that the criteria have been met; however, it is
planned that this goal will be realized by the end of 1995. Follow-on activities involving primarily a full- scale flight validation program and additional simulation studies are in progress. The overall objectives of these activities are to: (1) validate and refine the research methodology used in the first phase by determining the suitability of the evaluation maneuvers and the pitch recovery rating scale and (2) verify the simulation results and identify any necessary refinements to the design guidelines which were developed in the first phase. The fundamental simulation study methodology has been validated by the flight tests performed to date and additional simulation evaluations; however, some minor refinements to the rating scale were incorporated to aid in its use. The results of these flight tests have indicated that the pilots' opinions of the recoveries are based primarily on the short-term pitch response. Analysis of existing flight and simulation data will continue. Plans for simulation include the evaluation of: (1) additional open-loop maneuvers, (2) closed-loop maneuvering and one- vs.-one air combat, (3) additional inertia coupling effects, and (4) various existing fighter aircraft versus the proposed guidelines.
The primary flight test activity, an in-depth program using the NASA High Alpha Research Vehicle (HARV) which is currently in progress to validate the design guideline values, will be completed. This airplane has the capability of vectoring the thrust in pitch and yaw such that parametric variations of pitch and roll/yaw capability are being performed in flight similar to the manner that they were done in the simulation study. A systematic parametric variation of nose-down response being made and a large number and variety of maneuvers including the pushover maneuver are being performed, rated, and analyzed. The utility of these maneuvers for flight demonstration that the design criteria have been met is being evaluated. Additional options for full-scale flight validation are also being investigated. In addition, a complementary effort is underway to ' develop similar design guidelines for the roll/yaw axes.
ACKNOWLEDGMENTS
The authors would like to thank those engineers and pilots who have been involved in this study for their important contributions to the development of the test methodology, the generation of the simulation data base, the performance of the flight tests, and the analysis of the results. The engineers are Luat Nguyen of NASA Langley; Keith Wichman and James Cooper of NASA Ames-Dryden; J. Thomas Lawrence, Robert Hanley, Marjorie Draper-Donley, and Dennis Rude of the Naval Air Systems Command; and William McNamara, Christopher Clark, Kevin Breneman, M. Steven Hynes, and Craig Wood of the
10

Naval Air Warfare Center Aircraft Division. The pilots are Michael Phillips and Philip Brown of NASA Langley; Edward Schneider and William Dana of NASA Ames-Dryden; and Christopher Hadfield (Maj., CAF), Lt. David Prater, Lt. Robert Niewoehner, Capt. R. Robert Trombadore, Lt. Cdr. David Kennedy, and Maj. Terrence Wilcutt of the Naval Air Warfare Center Aircraft Division. I
REFERENCES
1.
2.
3.
4.
5.
6.
7.
8.
Gilbert, William P.; Nguyen, Luat T.; and Gera, Joseph: Control Research in the NASA High-Alpha Technology Program. AGARD CP-465, October 1989.
Ogburn, Marilyn E.; Foster, John V.; and Hoffler, Keith D.: Application of Piloted Simulation to High-Angle-of-Attack Flight- Dynamics Research for Fighter Aircraft. AGARD Symposium on Piloted Simulation Effectiveness, Brussels, Belgium, October 14-17, 1991. AGARD-CP-513, Paper No. 29.
Ogburn, Marilyn E.; et. at.: High-Angle-of- Attack Nose-Down Pitch Control Requirements for Relaxed Static Stability Combat Aircraft. NASA High-Angle-of-Attack Technology Conference, NASA Langley Research Center, Hampton, VA, October 30-November 1, 1990. NASA CP-3149, 1992, Part 2, Paper No. 24.
McNamara, W. G.; et. al.: Navy High Angle of Attack Pitch Control Margin Requirements for Class IV Aircraft. NAVAIRWARCENACDIV Technical Memorandum 91 -1 67 SA, June 25, 1992.
Gilbert, William P.; Nguyen, Luat T.; and Van Gunst, Roger W.: Simulator Study of the Effectiveness of an Automatic Control System Designed to Improve the High-Angle-of-Attack Characteristics of a Fighter Airplane. NASA TN D-8176, May 1976.
Schuler, John M.; and Dahl, Mark A.: Proposed Revisions to MIL-F-878% Related to Flight Safety of Augmented Aircraft. AFWAL-TR-82- 3014, April 1982.
Anonymous: MIL-STD-1797A: Military Standard, Flying Qualities of Piloted Aircraft. December 1988.
Urie, David M.: L-1011 Active Controls, Design Philosophy and Experience. AGARD CP-260, September 1978.
9. Sudderth, R.; et. al.: Development of Longitudinal Handling Qualities Criteria for Large Advanced Supersonic Aircraft. NASA CR-137635, March 1975.
10. Wedekind, G.; and Mangold, P.: Integration of Aerodynamic, Performance, and Stability and Control Requirements into the Design Process of Modern Unstable Fighter Aircraft Configurations. AGARD LS-153, June 1987.
11. Mello, John; and Agnew, James: MCAIR Design Philosophy for Fighter Aircraft Departure and Spin Resistance. SAE Technical Paper 791 081, December 1979.
12. Kehrer, William T.: Flight Control and Configuration Design Considerations for Highly Maneuverable Aircraft. AGARD CP-262, 1979.
13. Nguyen, Luat T.; and Foster, John V.: Development of a Preliminary High-Angle-of- Attack Nose-Down Pitch Control Requirement for High-Performance Aircraft. NASA TM-101684, February 1990.
14. Ashworth, B. R.; and Kahlbaum, William M., Jr.: Description and Performance of the Langley Differential Maneuvering Simulator. NASA TN D-7304, June 1973.
15. Cooper, George E.; and Harper, Robert P., Jr.: The Use of Pilot Rating in the Evaluation of Aircraft Handling Qualities. NASA TN D-5153, 1969.
16. Lackey, James B.; and Hadfield, Christopher A. Capt., CAF): Pitch Control Margin at High Angle of Attack - Quantitative Requirements (Flight Test Correlation with Simulation Predictions). AlAA Flight Test Conference, Hilton Head, SC, August 24-26, 1992. AlAA Paper No. 92-4107.
17. Lackey, James B.; et. at.: Flight Test Validation of Navy High-Angle-of-Attack Pitch Control Margin Requirements for Class IV Aircraft. NAVAIRWARCENACDIV Technical Memorandum 92-2 SA, July 27, 1992.
18. Pahle, Joseph W.; et. al.: Research Flight- Control System Development for the F-18 High Alpha Research Vehicle. NASA TM 104232, April 1991.
19. Lackey, James B.; and Prater, David L. (Lt., USN): Limited Navy Flying Qualities and Performance Evaluation of the NASA F/A-18 HARV. NAWC-AD Technical Memorandum 93-1 1 5A. To be published.
11
Performance Considerations I
~
Maneuvering Requirements
Reduced control
Advanced Control Effectors I
WI.
ProDulrive Aerodynamic I
Pitching moment
coefficient
Cm
Nose up
n
Angle of attack
Figure 1. - Control effectiveness requirements for multi-axis relaxed stability combat aircraft
Figure 4. - Definition of minimum nose-down pitching moment coefficient
Nose up Full nose-down aerodynamic
@ 'Unacceptable'
@ 'Desirable' I Angle of attack
Figure 2. - Key design issue for nose-down pitching moment characteristics
Flight validated design guidelines and
simulation . specifications
- - Fliaht
Near term applications
Figure 3. - Scope of activity and output of program
(I y I sg
Figure 5. - Preliminary design guideline for Cm* based on existing aircraft
Figure 6. - General arrangement of the Differential Maneuvering Simulator (DMS)
0
Crn
(S2) \ I
a I I
V #-- -- Figure 7. - Parametric variation of nose-down
pitching moment used in simulation study
Figure 8. - Stabilized 1 g trimmed conditions for pushover maneuver
Control Margin Pitch Response Mission Suitability/ Pilot Adequacy Characteristics Safety Rating
> Enhancing iJ Excellent pitch response for mission
- Adequate recovery Degrades mission slightly 3
-
More nose-down pitch control
margin is required
I ..
Recovery was not in doubt but marginal degrades mission
was in doubt 7 unnatural control inmts Significantly degrades mission and/or safety and/or required
Unacceptabl- I-- Insufficient nose-down pitch response results in
out-of-control flight missio, . Is the \ No I / n:rrrro4+
recoverable? \allb'al'/-
Y Decision Factors 1. Was there enough pitch response (acceleration, rate)? 2. Could you use more response? 3. Was time to recover short enough? 4. Was the recovery in question? 5. Was pilot compensation required? 6. Is the response suitable for the mission?
Figure 9. - Pitch recovery rating scale

Strong I .4 Skow I I -
control power
Weak Shorf - Time scale - Long
Figure 10. - Candidate figures of merit
.3
.2 radlsec 2
.I
-. 1 c -.2
-.3 4,
rad/sec*
-.4 E-
Good Poor Pilot Rating
-.5
Figure 11. - Variation of maximum q achieved within one second of recovery initiation with pilot rating, including 95-percent confidence interval
0
-10
-20
-30
-40 Good Poor Pilot Rating
Figure 12. - Variation of q at two seconds following recovery initiation with pilot rating, including 95-percent confidence interval
0
Figure 13. - Approximate comparison of existing guidelines
0
-.l
-.2
-.3 6
radsec 2
-.4 a X-29 simulation
Good Poor -.5 I
Pilot Rating
Figure 14. -
0
-10
de&ec -20
-30
-40
Figure 15. -
Results for variation of maximum q achieved within one second of recovery initiation with pilot rating using simulation of X-29
I interval 1 x-29 simulation
iood Poor Pilot Rating
Results for variation of q at two seconds following recovery initiation with pilot rating using simulation of X-29

Pilot Rating Figure 16. - Navy F/A-l8A test airplane
Figure 18. - Results for variation of q at two seconds following recovery initiation with pilot rating for Navy flight tests
4, radlsecz
0
-. 1
-.2
-.3
-.4
Poor Pilot Rating
Figure 17. - Results for variation of maximum q achieved within one second of recovery initiation with pilot rating for Navy flight tests
Figure 19. - NASA F-18 HARV
Control Margin Pitch Response Mission Suitability/ Pilot Adequacy Characteristics Safety Rating
1
> Excellent Enhancing pitch response for mission
Yes I
Nose-down
margin is satisfactory
Degrades mission slightly
Is the Recovery was not in Moderately doubt but marginal 1 degrades mission
aircraft recoverable?
Decision Factors
I Pilot decisions
Revised pitch recovery rating scale; shaded regions denote changes or additions Figure 20. -
0
-.l
-.2
-.3
-.4
Poor -5 ' ' ' Good
Figure 21. -
q, deglsec
I interval "* 1 I33 Flight test
-40 kood Poor Pilot Rating Pilot Rating
Figure 22. - Results for variation of q at two seconds following recovery initiation with pilot rating for NASA HARV flight tests
Results for variation of maximum achieved within one second of recovery initiation with pilot rating for NASA HARV flight tests