u.s. summary: 2000 issued july 2002 - · pdf file · 2002-07-26issued july 2002...
TRANSCRIPT

Issued July 2002
C2KPROF/00-US
U.S. Summary: 2000
U.S. Department of CommerceEconomics and Statistics AdministrationU.S. CENSUS BUREAU
Census 2000 Profile
For more information aboutCensus 2000 and Census 2000data products: • Visit the Census Bureau's Internet site at http://www.census.gov or call our Customer Services Center at 301-763-INFO (4636) for custom prints of all Census 2000 Profiles. • Visit your local library. Many major university and public libraries participate in the Federal Depository Library Program and receive copies of Census Bureau reports and CD-ROMs.
• Call or visit 1 of 1,800 state and local planning groups, libraries, chambers of commerce, and others that participate in a Census Bureau data center program. For a complete list see: http://www.census.gov/clo.
• Call or visit a Census Bureau Regional Office. For the address and phone number of the regional office near you, visit: http://www.census.gov/field/www/.

Table DP-1. Profile of General Demographic Characteristics: 2000Geographic Area: United States
[For information on confidentiality protection, nonsampling error, and definitions, see text]
Subject Number Percent
Total population. . . . . . . . . . . . . . . . . . . . . . . . . . 281,421,906 100.0
SEX AND AGEMale . . . . . . . . . . . . . . . . . . . . . . . . . . . . . . . . . . . . . . . . 138,053,563 49.1Female. . . . . . . . . . . . . . . . . . . . . . . . . . . . . . . . . . . . . . 143,368,343 50.9
Under 5 years . . . . . . . . . . . . . . . . . . . . . . . . . . . . . . . 19,175,798 6.85 to 9 years . . . . . . . . . . . . . . . . . . . . . . . . . . . . . . . . . 20,549,505 7.310 to 14 years . . . . . . . . . . . . . . . . . . . . . . . . . . . . . . . 20,528,072 7.315 to 19 years . . . . . . . . . . . . . . . . . . . . . . . . . . . . . . . 20,219,890 7.220 to 24 years . . . . . . . . . . . . . . . . . . . . . . . . . . . . . . . 18,964,001 6.725 to 34 years . . . . . . . . . . . . . . . . . . . . . . . . . . . . . . . 39,891,724 14.235 to 44 years . . . . . . . . . . . . . . . . . . . . . . . . . . . . . . . 45,148,527 16.045 to 54 years . . . . . . . . . . . . . . . . . . . . . . . . . . . . . . . 37,677,952 13.455 to 59 years . . . . . . . . . . . . . . . . . . . . . . . . . . . . . . . 13,469,237 4.860 to 64 years . . . . . . . . . . . . . . . . . . . . . . . . . . . . . . . 10,805,447 3.865 to 74 years . . . . . . . . . . . . . . . . . . . . . . . . . . . . . . . 18,390,986 6.575 to 84 years . . . . . . . . . . . . . . . . . . . . . . . . . . . . . . . 12,361,180 4.485 years and over . . . . . . . . . . . . . . . . . . . . . . . . . . . . 4,239,587 1.5
Median age (years) . . . . . . . . . . . . . . . . . . . . . . . . . . . 35.3 (X)
18 years and over . . . . . . . . . . . . . . . . . . . . . . . . . . . . 209,128,094 74.3Male . . . . . . . . . . . . . . . . . . . . . . . . . . . . . . . . . . . . . . 100,994,367 35.9Female. . . . . . . . . . . . . . . . . . . . . . . . . . . . . . . . . . . . 108,133,727 38.4
21 years and over . . . . . . . . . . . . . . . . . . . . . . . . . . . . 196,899,193 70.062 years and over . . . . . . . . . . . . . . . . . . . . . . . . . . . . 41,256,029 14.765 years and over . . . . . . . . . . . . . . . . . . . . . . . . . . . . 34,991,753 12.4
Male . . . . . . . . . . . . . . . . . . . . . . . . . . . . . . . . . . . . . . 14,409,625 5.1Female. . . . . . . . . . . . . . . . . . . . . . . . . . . . . . . . . . . . 20,582,128 7.3
RACEOne race . . . . . . . . . . . . . . . . . . . . . . . . . . . . . . . . . . . . 274,595,678 97.6
White . . . . . . . . . . . . . . . . . . . . . . . . . . . . . . . . . . . . . 211,460,626 75.1Black or African American . . . . . . . . . . . . . . . . . . . 34,658,190 12.3American Indian and Alaska Native . . . . . . . . . . . 2,475,956 0.9Asian . . . . . . . . . . . . . . . . . . . . . . . . . . . . . . . . . . . . . 10,242,998 3.6
Asian Indian . . . . . . . . . . . . . . . . . . . . . . . . . . . . . 1,678,765 0.6Chinese . . . . . . . . . . . . . . . . . . . . . . . . . . . . . . . . . 2,432,585 0.9Filipino . . . . . . . . . . . . . . . . . . . . . . . . . . . . . . . . . . 1,850,314 0.7Japanese. . . . . . . . . . . . . . . . . . . . . . . . . . . . . . . . 796,700 0.3Korean . . . . . . . . . . . . . . . . . . . . . . . . . . . . . . . . . . 1,076,872 0.4Vietnamese. . . . . . . . . . . . . . . . . . . . . . . . . . . . . . 1,122,528 0.4Other Asian 1 . . . . . . . . . . . . . . . . . . . . . . . . . . . . 1,285,234 0.5
Native Hawaiian and Other Pacific Islander. . . . 398,835 0.1Native Hawaiian. . . . . . . . . . . . . . . . . . . . . . . . . . 140,652 -Guamanian or Chamorro . . . . . . . . . . . . . . . . . . 58,240 -Samoan. . . . . . . . . . . . . . . . . . . . . . . . . . . . . . . . . 91,029 -Other Pacific Islander 2 . . . . . . . . . . . . . . . . . . . 108,914 -
Some other race . . . . . . . . . . . . . . . . . . . . . . . . . . . 15,359,073 5.5Two or more races . . . . . . . . . . . . . . . . . . . . . . . . . . . 6,826,228 2.4
Race alone or in combination with oneor more other races: 3
White . . . . . . . . . . . . . . . . . . . . . . . . . . . . . . . . . . . . . . . 216,930,975 77.1Black or African American . . . . . . . . . . . . . . . . . . . . . 36,419,434 12.9American Indian and Alaska Native . . . . . . . . . . . . . 4,119,301 1.5Asian . . . . . . . . . . . . . . . . . . . . . . . . . . . . . . . . . . . . . . . 11,898,828 4.2Native Hawaiian and Other Pacific Islander. . . . . . 874,414 0.3Some other race . . . . . . . . . . . . . . . . . . . . . . . . . . . . . 18,521,486 6.6
Subject Number Percent
HISPANIC OR LATINO AND RACETotal population. . . . . . . . . . . . . . . . . . . . . . . . . . 281,421,906 100.0
Hispanic or Latino (of any race) . . . . . . . . . . . . . . . . 35,305,818 12.5Mexican . . . . . . . . . . . . . . . . . . . . . . . . . . . . . . . . . . . 20,640,711 7.3Puerto Rican. . . . . . . . . . . . . . . . . . . . . . . . . . . . . . . 3,406,178 1.2Cuban . . . . . . . . . . . . . . . . . . . . . . . . . . . . . . . . . . . . 1,241,685 0.4Other Hispanic or Latino . . . . . . . . . . . . . . . . . . . . 10,017,244 3.6
Not Hispanic or Latino . . . . . . . . . . . . . . . . . . . . . . . . 246,116,088 87.5White alone. . . . . . . . . . . . . . . . . . . . . . . . . . . . . . . . 194,552,774 69.1
RELATIONSHIPTotal population. . . . . . . . . . . . . . . . . . . . . . . . . . 281,421,906 100.0
In households. . . . . . . . . . . . . . . . . . . . . . . . . . . . . . . . 273,643,273 97.2Householder . . . . . . . . . . . . . . . . . . . . . . . . . . . . . . . 105,480,101 37.5Spouse . . . . . . . . . . . . . . . . . . . . . . . . . . . . . . . . . . . 54,493,232 19.4Child. . . . . . . . . . . . . . . . . . . . . . . . . . . . . . . . . . . . . . 83,393,392 29.6
Own child under 18 years . . . . . . . . . . . . . . . . 64,494,637 22.9Other relatives . . . . . . . . . . . . . . . . . . . . . . . . . . . . . 15,684,318 5.6
Under 18 years . . . . . . . . . . . . . . . . . . . . . . . . . 6,042,435 2.1Nonrelatives . . . . . . . . . . . . . . . . . . . . . . . . . . . . . . . 14,592,230 5.2
Unmarried partner . . . . . . . . . . . . . . . . . . . . . . . 5,475,768 1.9In group quarters . . . . . . . . . . . . . . . . . . . . . . . . . . . . . 7,778,633 2.8
Institutionalized population. . . . . . . . . . . . . . . . . . . 4,059,039 1.4Noninstitutionalized population . . . . . . . . . . . . . . . 3,719,594 1.3
HOUSEHOLD BY TYPETotal households. . . . . . . . . . . . . . . . . . . . . . . . . 105,480,101 100.0
Family households (families). . . . . . . . . . . . . . . . . . . 71,787,347 68.1With own children under 18 years . . . . . . . . . . 34,588,368 32.8
Married-couple family . . . . . . . . . . . . . . . . . . . . . . . 54,493,232 51.7With own children under 18 years . . . . . . . . . . 24,835,505 23.5
Female householder, no husband present . . . . . 12,900,103 12.2With own children under 18 years . . . . . . . . . . 7,561,874 7.2
Nonfamily households . . . . . . . . . . . . . . . . . . . . . . . . 33,692,754 31.9Householder living alone . . . . . . . . . . . . . . . . . . . . 27,230,075 25.8
Householder 65 years and over . . . . . . . . . . . . 9,722,857 9.2
Households with individuals under 18 years . . . . . 38,022,115 36.0Households with individuals 65 years and over . . 24,672,708 23.4
Average household size. . . . . . . . . . . . . . . . . . . . . . . 2.59 (X)Average family size. . . . . . . . . . . . . . . . . . . . . . . . . . . 3.14 (X)
HOUSING OCCUPANCYTotal housing units. . . . . . . . . . . . . . . . . . . . . . . 115,904,641 100.0
Occupied housing units . . . . . . . . . . . . . . . . . . . . . . . 105,480,101 91.0Vacant housing units. . . . . . . . . . . . . . . . . . . . . . . . . . 10,424,540 9.0
For seasonal, recreational, oroccasional use . . . . . . . . . . . . . . . . . . . . . . . . . . . . 3,578,718 3.1
Homeowner vacancy rate (percent). . . . . . . . . . . . . 1.7 (X)Rental vacancy rate (percent). . . . . . . . . . . . . . . . . . 6.8 (X)
HOUSING TENUREOccupied housing units . . . . . . . . . . . . . . . . . . 105,480,101 100.0
Owner-occupied housing units . . . . . . . . . . . . . . . . . 69,815,753 66.2Renter-occupied housing units . . . . . . . . . . . . . . . . . 35,664,348 33.8
Average household size of owner-occupied units. 2.69 (X)Average household size of renter-occupied units . 2.40 (X)
- Represents zero or rounds to zero. (X) Not applicable.1 Other Asian alone, or two or more Asian categories.2 Other Pacific Islander alone, or two or more Native Hawaiian and Other Pacific Islander categories.3 In combination with one or more of the other races listed. The six numbers may add to more than the total population and the six percentages
may add to more than 100 percent because individuals may report more than one race.
Source: U.S. Census Bureau, Census 2000.
U.S. Census Bureau, Census 2000
2

Table DP-2. Profile of Selected Social Characteristics: 2000Geographic area: United States
[Data based on a sample. For information on confidentiality protection, sampling error, nonsampling error, and definitions, see text]
Subject Number Percent
SCHOOL ENROLLMENTPopulation 3 years and overenrolled in school . . . . . . . . . . . . . . . . . . . . 76,632,927 100.0
Nursery school, preschool . . . . . . . . . . . . . . . . . . . . . 4,957,582 6.5Kindergarten . . . . . . . . . . . . . . . . . . . . . . . . . . . . . . . . . 4,157,491 5.4Elementary school (grades 1-8) . . . . . . . . . . . . . . . . 33,653,641 43.9High school (grades 9-12) . . . . . . . . . . . . . . . . . . . . . 16,380,951 21.4College or graduate school . . . . . . . . . . . . . . . . . . . . 17,483,262 22.8
EDUCATIONAL ATTAINMENTPopulation 25 years and over . . . . . . . . . . 182,211,639 100.0
Less than 9th grade . . . . . . . . . . . . . . . . . . . . . . . . . . 13,755,477 7.59th to 12th grade, no diploma. . . . . . . . . . . . . . . . . . 21,960,148 12.1High school graduate (includes equivalency). . . . . 52,168,981 28.6Some college, no degree. . . . . . . . . . . . . . . . . . . . . . 38,351,595 21.0Associate degree. . . . . . . . . . . . . . . . . . . . . . . . . . . . . 11,512,833 6.3Bachelor’s degree . . . . . . . . . . . . . . . . . . . . . . . . . . . . 28,317,792 15.5Graduate or professional degree . . . . . . . . . . . . . . . 16,144,813 8.9
Percent high school graduate or higher . . . . . . . . . 80.4 (X)Percent bachelor’s degree or higher . . . . . . . . . . . . 24.4 (X)
MARITAL STATUSPopulation 15 years and over . . . . . . . . . . 221,148,671 100.0
Never married . . . . . . . . . . . . . . . . . . . . . . . . . . . . . . . 59,913,370 27.1Now married, except separated . . . . . . . . . . . . . . . . 120,231,273 54.4Separated . . . . . . . . . . . . . . . . . . . . . . . . . . . . . . . . . . . 4,769,220 2.2Widowed . . . . . . . . . . . . . . . . . . . . . . . . . . . . . . . . . . . . 14,674,500 6.6
Female. . . . . . . . . . . . . . . . . . . . . . . . . . . . . . . . . . . . 11,975,325 5.4Divorced . . . . . . . . . . . . . . . . . . . . . . . . . . . . . . . . . . . . 21,560,308 9.7
Female. . . . . . . . . . . . . . . . . . . . . . . . . . . . . . . . . . . . 12,305,294 5.6
GRANDPARENTS AS CAREGIVERSGrandparent living in household withone or more own grandchildren under18 years . . . . . . . . . . . . . . . . . . . . . . . . . . . . . 5,771,671 100.0
Grandparent responsible for grandchildren . . . . . . 2,426,730 42.0
VETERAN STATUSCivilian population 18 years and over . . 208,130,352 100.0
Civilian veterans . . . . . . . . . . . . . . . . . . . . . . . . . . . . . 26,403,703 12.7
DISABILITY STATUS OF THE CIVILIANNONINSTITUTIONALIZED POPULATION
Population 5 to 20 years . . . . . . . . . . . . . . . 64,689,357 100.0With a disability . . . . . . . . . . . . . . . . . . . . . . . . . . . . . . 5,214,334 8.1
Population 21 to 64 years. . . . . . . . . . . . . . 159,131,544 100.0With a disability . . . . . . . . . . . . . . . . . . . . . . . . . . . . . . 30,553,796 19.2
Percent employed . . . . . . . . . . . . . . . . . . . . . . . . . . 56.6 (X)No disability . . . . . . . . . . . . . . . . . . . . . . . . . . . . . . . . . 128,577,748 80.8
Percent employed . . . . . . . . . . . . . . . . . . . . . . . . . . 77.2 (X)
Population 65 years and over . . . . . . . . . . 33,346,626 100.0With a disability . . . . . . . . . . . . . . . . . . . . . . . . . . . . . . 13,978,118 41.9
RESIDENCE IN 1995Population 5 years and over . . . . . . . . . . . 262,375,152 100.0
Same house in 1995. . . . . . . . . . . . . . . . . . . . . . . . . . 142,027,478 54.1Different house in the U.S. in 1995 . . . . . . . . . . . . . 112,851,828 43.0
Same county . . . . . . . . . . . . . . . . . . . . . . . . . . . . . . 65,435,013 24.9Different county . . . . . . . . . . . . . . . . . . . . . . . . . . . . 47,416,815 18.1
Same state . . . . . . . . . . . . . . . . . . . . . . . . . . . . . . 25,327,355 9.7Different state. . . . . . . . . . . . . . . . . . . . . . . . . . . . 22,089,460 8.4
Elsewhere in 1995. . . . . . . . . . . . . . . . . . . . . . . . . . . . 7,495,846 2.9
Subject Number Percent
NATIVITY AND PLACE OF BIRTHTotal population. . . . . . . . . . . . . . . . . . . . . . . . . . 281,421,906 100.0
Native. . . . . . . . . . . . . . . . . . . . . . . . . . . . . . . . . . . . . . . 250,314,017 88.9Born in United States . . . . . . . . . . . . . . . . . . . . . . . 246,786,466 87.7
State of residence . . . . . . . . . . . . . . . . . . . . . . . . 168,729,388 60.0Different state. . . . . . . . . . . . . . . . . . . . . . . . . . . . 78,057,078 27.7
Born outside United States . . . . . . . . . . . . . . . . . . 3,527,551 1.3Foreign born . . . . . . . . . . . . . . . . . . . . . . . . . . . . . . . . . 31,107,889 11.1
Entered 1990 to March 2000 . . . . . . . . . . . . . . 13,178,276 4.7Naturalized citizen . . . . . . . . . . . . . . . . . . . . . . . . . . 12,542,626 4.5Not a citizen . . . . . . . . . . . . . . . . . . . . . . . . . . . . . . . 18,565,263 6.6
REGION OF BIRTH OF FOREIGN BORNTotal (excluding born at sea). . . . . . . . . . . . . . 31,107,573 100.0
Europe . . . . . . . . . . . . . . . . . . . . . . . . . . . . . . . . . . . . . . 4,915,557 15.8Asia . . . . . . . . . . . . . . . . . . . . . . . . . . . . . . . . . . . . . . . . 8,226,254 26.4Africa . . . . . . . . . . . . . . . . . . . . . . . . . . . . . . . . . . . . . . . 881,300 2.8Oceania . . . . . . . . . . . . . . . . . . . . . . . . . . . . . . . . . . . . . 168,046 0.5Latin America . . . . . . . . . . . . . . . . . . . . . . . . . . . . . . . . 16,086,974 51.7Northern America. . . . . . . . . . . . . . . . . . . . . . . . . . . . . 829,442 2.7
LANGUAGE SPOKEN AT HOMEPopulation 5 years and over . . . . . . . . . . . . . . 262,375,152 100.0
English only . . . . . . . . . . . . . . . . . . . . . . . . . . . . . . . . . 215,423,557 82.1Language other than English . . . . . . . . . . . . . . . . . . 46,951,595 17.9
Speak English less than ″very well″ . . . . . . . . 21,320,407 8.1Spanish . . . . . . . . . . . . . . . . . . . . . . . . . . . . . . . . . . . 28,101,052 10.7
Speak English less than ″very well″ . . . . . . . . 13,751,256 5.2Other Indo-European languages . . . . . . . . . . . . . 10,017,989 3.8
Speak English less than ″very well″ . . . . . . . . 3,390,301 1.3Asian and Pacific Island languages . . . . . . . . . . . 6,960,065 2.7
Speak English less than ″very well″ . . . . . . . . 3,590,024 1.4
ANCESTRY (single or multiple)Total population. . . . . . . . . . . . . . . . . . . . . . . . . . 281,421,906 100.0Total ancestries reported . . . . . . . . . . . . . . . . . . . 287,304,886 102.1
Arab . . . . . . . . . . . . . . . . . . . . . . . . . . . . . . . . . . . . . . . . 1,202,871 0.4Czech1. . . . . . . . . . . . . . . . . . . . . . . . . . . . . . . . . . . . . . 1,703,930 0.6Danish . . . . . . . . . . . . . . . . . . . . . . . . . . . . . . . . . . . . . . 1,430,897 0.5Dutch . . . . . . . . . . . . . . . . . . . . . . . . . . . . . . . . . . . . . . . 4,542,494 1.6English. . . . . . . . . . . . . . . . . . . . . . . . . . . . . . . . . . . . . . 24,515,138 8.7French (except Basque)1 . . . . . . . . . . . . . . . . . . . . . . 8,325,509 3.0French Canadian1 . . . . . . . . . . . . . . . . . . . . . . . . . . . . 2,435,098 0.9German . . . . . . . . . . . . . . . . . . . . . . . . . . . . . . . . . . . . . 42,885,162 15.2Greek . . . . . . . . . . . . . . . . . . . . . . . . . . . . . . . . . . . . . . . 1,153,307 0.4Hungarian . . . . . . . . . . . . . . . . . . . . . . . . . . . . . . . . . . . 1,398,724 0.5Irish1. . . . . . . . . . . . . . . . . . . . . . . . . . . . . . . . . . . . . . . . 30,594,130 10.9Italian . . . . . . . . . . . . . . . . . . . . . . . . . . . . . . . . . . . . . . . 15,723,555 5.6Lithuanian . . . . . . . . . . . . . . . . . . . . . . . . . . . . . . . . . . . 659,992 0.2Norwegian. . . . . . . . . . . . . . . . . . . . . . . . . . . . . . . . . . . 4,477,725 1.6Polish . . . . . . . . . . . . . . . . . . . . . . . . . . . . . . . . . . . . . . . 8,977,444 3.2Portuguese . . . . . . . . . . . . . . . . . . . . . . . . . . . . . . . . . . 1,177,112 0.4Russian . . . . . . . . . . . . . . . . . . . . . . . . . . . . . . . . . . . . . 2,652,214 0.9Scotch-Irish. . . . . . . . . . . . . . . . . . . . . . . . . . . . . . . . . . 4,319,232 1.5Scottish . . . . . . . . . . . . . . . . . . . . . . . . . . . . . . . . . . . . . 4,890,581 1.7Slovak . . . . . . . . . . . . . . . . . . . . . . . . . . . . . . . . . . . . . . 797,764 0.3Subsaharan African. . . . . . . . . . . . . . . . . . . . . . . . . . . 1,781,877 0.6Swedish. . . . . . . . . . . . . . . . . . . . . . . . . . . . . . . . . . . . . 3,998,310 1.4Swiss . . . . . . . . . . . . . . . . . . . . . . . . . . . . . . . . . . . . . . . 911,502 0.3Ukrainian . . . . . . . . . . . . . . . . . . . . . . . . . . . . . . . . . . . . 892,922 0.3United States or American. . . . . . . . . . . . . . . . . . . . . 20,625,093 7.3Welsh. . . . . . . . . . . . . . . . . . . . . . . . . . . . . . . . . . . . . . . 1,753,794 0.6West Indian (excluding Hispanic groups) . . . . . . . . 1,869,504 0.7Other ancestries . . . . . . . . . . . . . . . . . . . . . . . . . . . . . 91,609,005 32.6
-Represents zero or rounds to zero. (X) Not applicable.1The data represent a combination of two ancestries shown separately in Summary File 3. Czech includes Czechoslovakian. French includes Alsa-tian. French Canadian includes Acadian/Cajun. Irish includes Celtic.
Source: U.S. Census Bureau, Census 2000.
U.S. Census Bureau, Census 2000
3

Table DP-3. Profile of Selected Economic Characteristics: 2000Geographic area: United States[Data based on a sample. For information on confidentiality protection, sampling error, nonsampling error, and definitions, see text]
Subject Number Percent
EMPLOYMENT STATUSPopulation 16 years and over . . . . . . . . . . . . 217,168,077 100.0
In labor force . . . . . . . . . . . . . . . . . . . . . . . . . . . . . . . . 138,820,935 63.9Civilian labor force. . . . . . . . . . . . . . . . . . . . . . . . . . 137,668,798 63.4
Employed . . . . . . . . . . . . . . . . . . . . . . . . . . . . . . . 129,721,512 59.7Unemployed . . . . . . . . . . . . . . . . . . . . . . . . . . . . . 7,947,286 3.7
Percent of civilian labor force . . . . . . . . . . . . 5.8 (X)Armed Forces. . . . . . . . . . . . . . . . . . . . . . . . . . . . . . 1,152,137 0.5
Not in labor force. . . . . . . . . . . . . . . . . . . . . . . . . . . . . 78,347,142 36.1
Females 16 years and over . . . . . . . . . . . . . . 112,185,795 100.0In labor force . . . . . . . . . . . . . . . . . . . . . . . . . . . . . . . . 64,547,732 57.5
Civilian labor force. . . . . . . . . . . . . . . . . . . . . . . . . . 64,383,493 57.4Employed . . . . . . . . . . . . . . . . . . . . . . . . . . . . . . . 60,630,069 54.0
Own children under 6 years. . . . . . . . . . . . . . 21,833,613 100.0All parents in family in labor force . . . . . . . . . . . . . . 12,787,501 58.6
COMMUTING TO WORKWorkers 16 years and over . . . . . . . . . . . . . . 128,279,228 100.0
Car, truck, or van - - drove alone . . . . . . . . . . . . . . . 97,102,050 75.7Car, truck, or van - - carpooled. . . . . . . . . . . . . . . . . 15,634,051 12.2Public transportation (including taxicab) . . . . . . . . . 6,067,703 4.7Walked. . . . . . . . . . . . . . . . . . . . . . . . . . . . . . . . . . . . . . 3,758,982 2.9Other means. . . . . . . . . . . . . . . . . . . . . . . . . . . . . . . . . 1,532,219 1.2Worked at home . . . . . . . . . . . . . . . . . . . . . . . . . . . . . 4,184,223 3.3Mean travel time to work (minutes)1 . . . . . . . . . . . . 25.5 (X)
Employed civilian population16 years and over . . . . . . . . . . . . . . . . . . . . . 129,721,512 100.0
OCCUPATIONManagement, professional, and relatedoccupations . . . . . . . . . . . . . . . . . . . . . . . . . . . . . . . . 43,646,731 33.6
Service occupations . . . . . . . . . . . . . . . . . . . . . . . . . . 19,276,947 14.9Sales and office occupations . . . . . . . . . . . . . . . . . . 34,621,390 26.7Farming, fishing, and forestry occupations. . . . . . . 951,810 0.7Construction, extraction, and maintenanceoccupations . . . . . . . . . . . . . . . . . . . . . . . . . . . . . . . . 12,256,138 9.4
Production, transportation, and material movingoccupations . . . . . . . . . . . . . . . . . . . . . . . . . . . . . . . . 18,968,496 14.6
INDUSTRYAgriculture, forestry, fishing and hunting,and mining . . . . . . . . . . . . . . . . . . . . . . . . . . . . . . . . . 2,426,053 1.9
Construction . . . . . . . . . . . . . . . . . . . . . . . . . . . . . . . . . 8,801,507 6.8Manufacturing. . . . . . . . . . . . . . . . . . . . . . . . . . . . . . . . 18,286,005 14.1Wholesale trade. . . . . . . . . . . . . . . . . . . . . . . . . . . . . . 4,666,757 3.6Retail trade . . . . . . . . . . . . . . . . . . . . . . . . . . . . . . . . . . 15,221,716 11.7Transportation and warehousing, and utilities . . . . 6,740,102 5.2Information . . . . . . . . . . . . . . . . . . . . . . . . . . . . . . . . . . 3,996,564 3.1Finance, insurance, real estate, and rental andleasing . . . . . . . . . . . . . . . . . . . . . . . . . . . . . . . . . . . . . 8,934,972 6.9
Professional, scientific, management, adminis-trative, and waste management services . . . . . . . 12,061,865 9.3
Educational, health and social services . . . . . . . . . 25,843,029 19.9Arts, entertainment, recreation, accommodationand food services . . . . . . . . . . . . . . . . . . . . . . . . . . . 10,210,295 7.9
Other services (except public administration) . . . . 6,320,632 4.9Public administration. . . . . . . . . . . . . . . . . . . . . . . . . . 6,212,015 4.8
CLASS OF WORKERPrivate wage and salary workers . . . . . . . . . . . . . . . 101,794,361 78.5Government workers. . . . . . . . . . . . . . . . . . . . . . . . . . 18,923,353 14.6Self-employed workers in own not incorporatedbusiness . . . . . . . . . . . . . . . . . . . . . . . . . . . . . . . . . . . 8,603,761 6.6
Unpaid family workers . . . . . . . . . . . . . . . . . . . . . . . . 400,037 0.3
Subject Number Percent
INCOME IN 1999Households . . . . . . . . . . . . . . . . . . . . . . . . . . . . . 105,539,122 100.0
Less than $10,000. . . . . . . . . . . . . . . . . . . . . . . . . . . . 10,067,027 9.5$10,000 to $14,999 . . . . . . . . . . . . . . . . . . . . . . . . . . . 6,657,228 6.3$15,000 to $24,999 . . . . . . . . . . . . . . . . . . . . . . . . . . . 13,536,965 12.8$25,000 to $34,999 . . . . . . . . . . . . . . . . . . . . . . . . . . . 13,519,242 12.8$35,000 to $49,999 . . . . . . . . . . . . . . . . . . . . . . . . . . . 17,446,272 16.5$50,000 to $74,999 . . . . . . . . . . . . . . . . . . . . . . . . . . . 20,540,604 19.5$75,000 to $99,999 . . . . . . . . . . . . . . . . . . . . . . . . . . . 10,799,245 10.2$100,000 to $149,999. . . . . . . . . . . . . . . . . . . . . . . . . 8,147,826 7.7$150,000 to $199,999. . . . . . . . . . . . . . . . . . . . . . . . . 2,322,038 2.2$200,000 or more . . . . . . . . . . . . . . . . . . . . . . . . . . . . 2,502,675 2.4Median household income (dollars) . . . . . . . . . . . . . 41,994 (X)
With earnings . . . . . . . . . . . . . . . . . . . . . . . . . . . . . . . . 84,962,743 80.5Mean earnings (dollars)1 . . . . . . . . . . . . . . . . . . . . 56,604 (X)
With Social Security income . . . . . . . . . . . . . . . . . . . 27,084,417 25.7Mean Social Security income (dollars)1 . . . . . . . 11,320 (X)
With Supplemental Security Income . . . . . . . . . . . . 4,615,885 4.4Mean Supplemental Security Income(dollars)1 . . . . . . . . . . . . . . . . . . . . . . . . . . . . . . . . . 6,320 (X)
With public assistance income . . . . . . . . . . . . . . . . . 3,629,732 3.4Mean public assistance income (dollars)1 . . . . . 3,032 (X)
With retirement income . . . . . . . . . . . . . . . . . . . . . . . 17,659,058 16.7Mean retirement income (dollars)1 . . . . . . . . . . . . 17,376 (X)
Families . . . . . . . . . . . . . . . . . . . . . . . . . . . . . . . . 72,261,780 100.0Less than $10,000. . . . . . . . . . . . . . . . . . . . . . . . . . . . 4,155,386 5.8$10,000 to $14,999 . . . . . . . . . . . . . . . . . . . . . . . . . . . 3,115,586 4.3$15,000 to $24,999 . . . . . . . . . . . . . . . . . . . . . . . . . . . 7,757,397 10.7$25,000 to $34,999 . . . . . . . . . . . . . . . . . . . . . . . . . . . 8,684,429 12.0$35,000 to $49,999 . . . . . . . . . . . . . . . . . . . . . . . . . . . 12,377,108 17.1$50,000 to $74,999 . . . . . . . . . . . . . . . . . . . . . . . . . . . 16,130,100 22.3$75,000 to $99,999 . . . . . . . . . . . . . . . . . . . . . . . . . . . 9,009,327 12.5$100,000 to $149,999. . . . . . . . . . . . . . . . . . . . . . . . . 6,936,210 9.6$150,000 to $199,999. . . . . . . . . . . . . . . . . . . . . . . . . 1,983,673 2.7$200,000 or more . . . . . . . . . . . . . . . . . . . . . . . . . . . . 2,112,564 2.9Median family income (dollars) . . . . . . . . . . . . . . . . . 50,046 (X)
Per capita income (dollars)1 . . . . . . . . . . . . . . . . . . . 21,587 (X)Median earnings (dollars):Male full-time, year-round workers. . . . . . . . . . . . . . 37,057 (X)Female full-time, year-round workers . . . . . . . . . . . 27,194 (X)
Subject
Numberbelow
povertylevel
Percentbelow
povertylevel
POVERTY STATUS IN 1999Families . . . . . . . . . . . . . . . . . . . . . . . . . . . . . . . . 6,620,945 9.2
With related children under 18 years. . . . . . . . . . . . 5,155,866 13.6With related children under 5 years. . . . . . . . . . . 2,562,263 17.0
Families with female householder, nohusband present . . . . . . . . . . . . . . . . . . . . . . . 3,315,916 26.5
With related children under 18 years. . . . . . . . . . . . 2,940,459 34.3With related children under 5 years. . . . . . . . . . . 1,401,493 46.4
Individuals . . . . . . . . . . . . . . . . . . . . . . . . . . . . . . 33,899,812 12.418 years and over . . . . . . . . . . . . . . . . . . . . . . . . . . . . 22,152,954 10.9
65 years and over . . . . . . . . . . . . . . . . . . . . . . . . . . 3,287,774 9.9Related children under 18 years . . . . . . . . . . . . . . . 11,386,031 16.1
Related children 5 to 17 years . . . . . . . . . . . . . . . 7,974,006 15.4Unrelated individuals 15 years and over. . . . . . . . . 10,721,935 22.7
-Represents zero or rounds to zero. (X) Not applicable.1If the denominator of a mean value or per capita value is less than 30, then that value is calculated using a rounded aggregate in the numerator.See text.
Source: U.S. Census Bureau, Census 2000.
U.S. Census Bureau, Census 2000
4
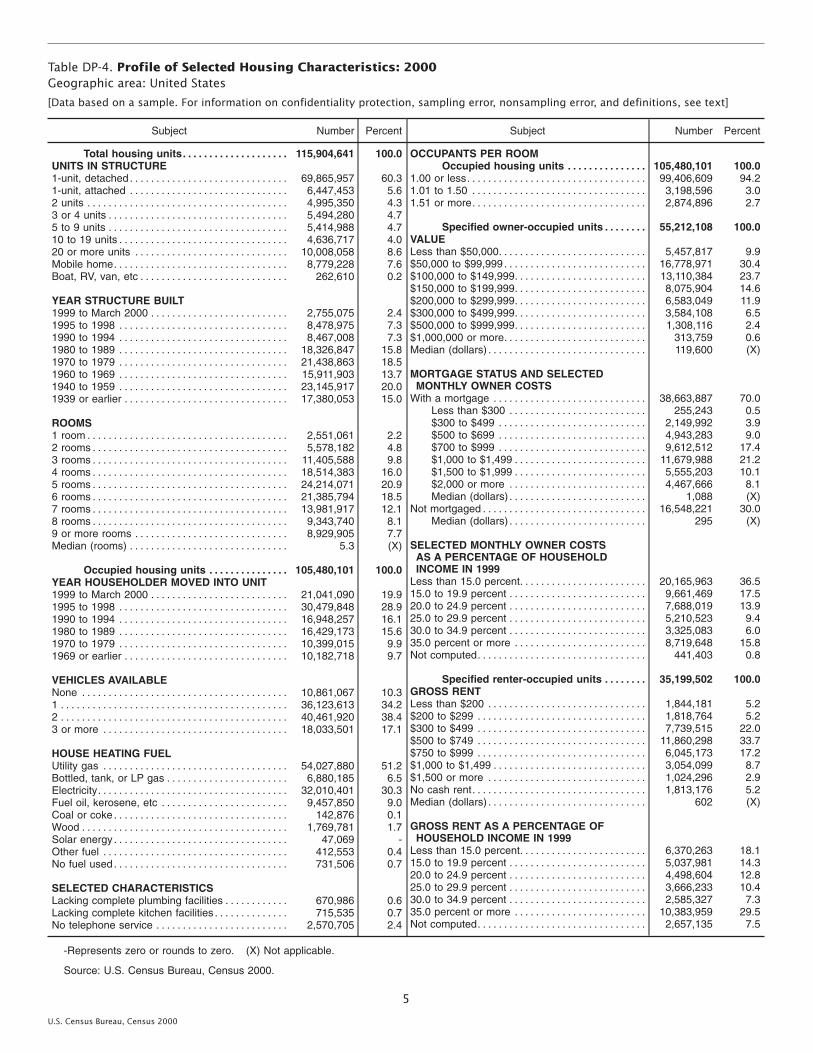
Table DP-4. Profile of Selected Housing Characteristics: 2000Geographic area: United States
[Data based on a sample. For information on confidentiality protection, sampling error, nonsampling error, and definitions, see text]
Subject Number Percent
Total housing units. . . . . . . . . . . . . . . . . . . . 115,904,641 100.0UNITS IN STRUCTURE1-unit, detached . . . . . . . . . . . . . . . . . . . . . . . . . . . . . . 69,865,957 60.31-unit, attached . . . . . . . . . . . . . . . . . . . . . . . . . . . . . . 6,447,453 5.62 units . . . . . . . . . . . . . . . . . . . . . . . . . . . . . . . . . . . . . . 4,995,350 4.33 or 4 units . . . . . . . . . . . . . . . . . . . . . . . . . . . . . . . . . . 5,494,280 4.75 to 9 units . . . . . . . . . . . . . . . . . . . . . . . . . . . . . . . . . . 5,414,988 4.710 to 19 units . . . . . . . . . . . . . . . . . . . . . . . . . . . . . . . . 4,636,717 4.020 or more units . . . . . . . . . . . . . . . . . . . . . . . . . . . . . 10,008,058 8.6Mobile home. . . . . . . . . . . . . . . . . . . . . . . . . . . . . . . . . 8,779,228 7.6Boat, RV, van, etc . . . . . . . . . . . . . . . . . . . . . . . . . . . . 262,610 0.2
YEAR STRUCTURE BUILT1999 to March 2000 . . . . . . . . . . . . . . . . . . . . . . . . . . 2,755,075 2.41995 to 1998 . . . . . . . . . . . . . . . . . . . . . . . . . . . . . . . . 8,478,975 7.31990 to 1994 . . . . . . . . . . . . . . . . . . . . . . . . . . . . . . . . 8,467,008 7.31980 to 1989 . . . . . . . . . . . . . . . . . . . . . . . . . . . . . . . . 18,326,847 15.81970 to 1979 . . . . . . . . . . . . . . . . . . . . . . . . . . . . . . . . 21,438,863 18.51960 to 1969 . . . . . . . . . . . . . . . . . . . . . . . . . . . . . . . . 15,911,903 13.71940 to 1959 . . . . . . . . . . . . . . . . . . . . . . . . . . . . . . . . 23,145,917 20.01939 or earlier . . . . . . . . . . . . . . . . . . . . . . . . . . . . . . . 17,380,053 15.0
ROOMS1 room . . . . . . . . . . . . . . . . . . . . . . . . . . . . . . . . . . . . . . 2,551,061 2.22 rooms . . . . . . . . . . . . . . . . . . . . . . . . . . . . . . . . . . . . . 5,578,182 4.83 rooms . . . . . . . . . . . . . . . . . . . . . . . . . . . . . . . . . . . . . 11,405,588 9.84 rooms . . . . . . . . . . . . . . . . . . . . . . . . . . . . . . . . . . . . . 18,514,383 16.05 rooms . . . . . . . . . . . . . . . . . . . . . . . . . . . . . . . . . . . . . 24,214,071 20.96 rooms . . . . . . . . . . . . . . . . . . . . . . . . . . . . . . . . . . . . . 21,385,794 18.57 rooms . . . . . . . . . . . . . . . . . . . . . . . . . . . . . . . . . . . . . 13,981,917 12.18 rooms . . . . . . . . . . . . . . . . . . . . . . . . . . . . . . . . . . . . . 9,343,740 8.19 or more rooms . . . . . . . . . . . . . . . . . . . . . . . . . . . . . 8,929,905 7.7Median (rooms) . . . . . . . . . . . . . . . . . . . . . . . . . . . . . . 5.3 (X)
Occupied housing units . . . . . . . . . . . . . . . 105,480,101 100.0YEAR HOUSEHOLDER MOVED INTO UNIT1999 to March 2000 . . . . . . . . . . . . . . . . . . . . . . . . . . 21,041,090 19.91995 to 1998 . . . . . . . . . . . . . . . . . . . . . . . . . . . . . . . . 30,479,848 28.91990 to 1994 . . . . . . . . . . . . . . . . . . . . . . . . . . . . . . . . 16,948,257 16.11980 to 1989 . . . . . . . . . . . . . . . . . . . . . . . . . . . . . . . . 16,429,173 15.61970 to 1979 . . . . . . . . . . . . . . . . . . . . . . . . . . . . . . . . 10,399,015 9.91969 or earlier . . . . . . . . . . . . . . . . . . . . . . . . . . . . . . . 10,182,718 9.7
VEHICLES AVAILABLENone . . . . . . . . . . . . . . . . . . . . . . . . . . . . . . . . . . . . . . . 10,861,067 10.31 . . . . . . . . . . . . . . . . . . . . . . . . . . . . . . . . . . . . . . . . . . . 36,123,613 34.22 . . . . . . . . . . . . . . . . . . . . . . . . . . . . . . . . . . . . . . . . . . . 40,461,920 38.43 or more . . . . . . . . . . . . . . . . . . . . . . . . . . . . . . . . . . . 18,033,501 17.1
HOUSE HEATING FUELUtility gas . . . . . . . . . . . . . . . . . . . . . . . . . . . . . . . . . . . 54,027,880 51.2Bottled, tank, or LP gas . . . . . . . . . . . . . . . . . . . . . . . 6,880,185 6.5Electricity. . . . . . . . . . . . . . . . . . . . . . . . . . . . . . . . . . . . 32,010,401 30.3Fuel oil, kerosene, etc . . . . . . . . . . . . . . . . . . . . . . . . 9,457,850 9.0Coal or coke . . . . . . . . . . . . . . . . . . . . . . . . . . . . . . . . . 142,876 0.1Wood . . . . . . . . . . . . . . . . . . . . . . . . . . . . . . . . . . . . . . . 1,769,781 1.7Solar energy . . . . . . . . . . . . . . . . . . . . . . . . . . . . . . . . . 47,069 -Other fuel . . . . . . . . . . . . . . . . . . . . . . . . . . . . . . . . . . . 412,553 0.4No fuel used . . . . . . . . . . . . . . . . . . . . . . . . . . . . . . . . . 731,506 0.7
SELECTED CHARACTERISTICSLacking complete plumbing facilities . . . . . . . . . . . . 670,986 0.6Lacking complete kitchen facilities . . . . . . . . . . . . . . 715,535 0.7No telephone service . . . . . . . . . . . . . . . . . . . . . . . . . 2,570,705 2.4
Subject Number Percent
OCCUPANTS PER ROOMOccupied housing units . . . . . . . . . . . . . . . 105,480,101 100.0
1.00 or less. . . . . . . . . . . . . . . . . . . . . . . . . . . . . . . . . . 99,406,609 94.21.01 to 1.50 . . . . . . . . . . . . . . . . . . . . . . . . . . . . . . . . . 3,198,596 3.01.51 or more. . . . . . . . . . . . . . . . . . . . . . . . . . . . . . . . . 2,874,896 2.7
Specified owner-occupied units . . . . . . . . 55,212,108 100.0VALUELess than $50,000. . . . . . . . . . . . . . . . . . . . . . . . . . . . 5,457,817 9.9$50,000 to $99,999 . . . . . . . . . . . . . . . . . . . . . . . . . . . 16,778,971 30.4$100,000 to $149,999. . . . . . . . . . . . . . . . . . . . . . . . . 13,110,384 23.7$150,000 to $199,999. . . . . . . . . . . . . . . . . . . . . . . . . 8,075,904 14.6$200,000 to $299,999. . . . . . . . . . . . . . . . . . . . . . . . . 6,583,049 11.9$300,000 to $499,999. . . . . . . . . . . . . . . . . . . . . . . . . 3,584,108 6.5$500,000 to $999,999. . . . . . . . . . . . . . . . . . . . . . . . . 1,308,116 2.4$1,000,000 or more. . . . . . . . . . . . . . . . . . . . . . . . . . . 313,759 0.6Median (dollars) . . . . . . . . . . . . . . . . . . . . . . . . . . . . . . 119,600 (X)
MORTGAGE STATUS AND SELECTEDMONTHLY OWNER COSTS
With a mortgage . . . . . . . . . . . . . . . . . . . . . . . . . . . . . 38,663,887 70.0Less than $300 . . . . . . . . . . . . . . . . . . . . . . . . . . 255,243 0.5$300 to $499 . . . . . . . . . . . . . . . . . . . . . . . . . . . . 2,149,992 3.9$500 to $699 . . . . . . . . . . . . . . . . . . . . . . . . . . . . 4,943,283 9.0$700 to $999 . . . . . . . . . . . . . . . . . . . . . . . . . . . . 9,612,512 17.4$1,000 to $1,499 . . . . . . . . . . . . . . . . . . . . . . . . . 11,679,988 21.2$1,500 to $1,999 . . . . . . . . . . . . . . . . . . . . . . . . . 5,555,203 10.1$2,000 or more . . . . . . . . . . . . . . . . . . . . . . . . . . 4,467,666 8.1Median (dollars) . . . . . . . . . . . . . . . . . . . . . . . . . . 1,088 (X)
Not mortgaged . . . . . . . . . . . . . . . . . . . . . . . . . . . . . . . 16,548,221 30.0Median (dollars) . . . . . . . . . . . . . . . . . . . . . . . . . . 295 (X)
SELECTED MONTHLY OWNER COSTSAS A PERCENTAGE OF HOUSEHOLDINCOME IN 1999
Less than 15.0 percent. . . . . . . . . . . . . . . . . . . . . . . . 20,165,963 36.515.0 to 19.9 percent . . . . . . . . . . . . . . . . . . . . . . . . . . 9,661,469 17.520.0 to 24.9 percent . . . . . . . . . . . . . . . . . . . . . . . . . . 7,688,019 13.925.0 to 29.9 percent . . . . . . . . . . . . . . . . . . . . . . . . . . 5,210,523 9.430.0 to 34.9 percent . . . . . . . . . . . . . . . . . . . . . . . . . . 3,325,083 6.035.0 percent or more . . . . . . . . . . . . . . . . . . . . . . . . . 8,719,648 15.8Not computed. . . . . . . . . . . . . . . . . . . . . . . . . . . . . . . . 441,403 0.8
Specified renter-occupied units . . . . . . . . 35,199,502 100.0GROSS RENTLess than $200 . . . . . . . . . . . . . . . . . . . . . . . . . . . . . . 1,844,181 5.2$200 to $299 . . . . . . . . . . . . . . . . . . . . . . . . . . . . . . . . 1,818,764 5.2$300 to $499 . . . . . . . . . . . . . . . . . . . . . . . . . . . . . . . . 7,739,515 22.0$500 to $749 . . . . . . . . . . . . . . . . . . . . . . . . . . . . . . . . 11,860,298 33.7$750 to $999 . . . . . . . . . . . . . . . . . . . . . . . . . . . . . . . . 6,045,173 17.2$1,000 to $1,499 . . . . . . . . . . . . . . . . . . . . . . . . . . . . . 3,054,099 8.7$1,500 or more . . . . . . . . . . . . . . . . . . . . . . . . . . . . . . 1,024,296 2.9No cash rent. . . . . . . . . . . . . . . . . . . . . . . . . . . . . . . . . 1,813,176 5.2Median (dollars) . . . . . . . . . . . . . . . . . . . . . . . . . . . . . . 602 (X)
GROSS RENT AS A PERCENTAGE OFHOUSEHOLD INCOME IN 1999
Less than 15.0 percent. . . . . . . . . . . . . . . . . . . . . . . . 6,370,263 18.115.0 to 19.9 percent . . . . . . . . . . . . . . . . . . . . . . . . . . 5,037,981 14.320.0 to 24.9 percent . . . . . . . . . . . . . . . . . . . . . . . . . . 4,498,604 12.825.0 to 29.9 percent . . . . . . . . . . . . . . . . . . . . . . . . . . 3,666,233 10.430.0 to 34.9 percent . . . . . . . . . . . . . . . . . . . . . . . . . . 2,585,327 7.335.0 percent or more . . . . . . . . . . . . . . . . . . . . . . . . . 10,383,959 29.5Not computed. . . . . . . . . . . . . . . . . . . . . . . . . . . . . . . . 2,657,135 7.5
-Represents zero or rounds to zero. (X) Not applicable.
Source: U.S. Census Bureau, Census 2000.
U.S. Census Bureau, Census 2000
5

U.S. Department of Commerce Economics and Statistics Administration U.S. CENSUS BUREAU
U S C E N S U S B U R E A UHelping You Make Informed Decisions •1902-2002
Census 2000: United States Profile
0 100 300 500 Kilometers
0 100 300 500 Miles
0 100 Kilometers
0 100 Miles
0 300 Kilometers
0 300 Miles
3,000.0 to 66,940.1
300.0 to 2,999.9
160.0 to 299.9
79.6 to 159.9
7.0 to 79.5
1.0 to 6.9
Less than 1.0
State Boundary
County Boundary
United States Mean Centerof Population
Population Per Square Mileby County
U.S. density is79.6
County and statistically equivalent entity
Population Density by County
33.8% RenterOccupied66.2% Owner Occupied
Average Household Sizeof Renter-Occupied Units:
2.40 people
Average Household Sizeof Owner-Occupied Units:
2.69 people
Total Occupied Housing Units:
105,480,101
Housing Tenure
80
70
60
50
40
30
20
10
85+ Years
0 6,000,000 12,000,00012,000,000 6,000,000
FemaleMale
Population by Sex and AgeTotal Population: 281,421,906
Hispanic or Latino (of any race) makes up 12.5% of the U.S. population.
U.S. Race* BreakdownBlack or African American
(12.3%)
American Indian andAlaska Native (0.9%)
Asian (3.6%)
Native Hawaiian and OtherPacific Islander (0.1%)
Some other race (5.5%)
Two or more races(2.4%)
White(75.1%)
*One race