u.s. port operational risks and the call for port...
TRANSCRIPT

U.S. Port Operational Risks and the Call for Port Resilience November 9, 2011
Rutgers University
New Jersey
James B. Rice, Jr.
Deputy Director
MIT Center for Transportation and Logistics
Funding for this work was provided by several sources, including the US DHS.
The opinions presented are those of the researchers and not those of US DHS.

Outline
• Motivation – Ports are a key vulnerability to US Economy
• Issues in (defining) Port Resilience
• Survey & Field Visits
• Assessing Base Resilience of Ports
• Port Capacity Study
• Framework for developing a detailed capacity estimate
• Making Ports Resilient
• Catalogue of actions to make resilient ports, Failure Mode Analysis
• Port disruption cargo allocation tool/guide
• Catalogue of port disruptions
• Port Delay Data Study & Global Ocean Transport Study
• Port design impact on resilience

Background/Context
• Need: US economic security dependent on sea port flows
• Action: DHS charters Center of Excellence focused on security and resilience of Maritime Transportation System
• Assertion: New concept of port resilience may reduce risk
• Work-to-date: Base understanding of MTS flows, applying SC Resilience concepts to MTS
• Get grounded – Survey of 525 Shippers, Carriers, TO, PA
• Assessing resilience of US Ports – Capacity studies
• Global ocean transport and port delay studies
• Sendai disaster impact on ports study
• Port disruption capacity allocation tool/guide
• Today sharing observations to date
• Progress made… but still many unanswered questions

Field Visits
• Port Authority Visits:
• Port Authority of New York/New Jersey MTSRU, Long Beach, Hueneme, Tacoma, Seattle, Catoosa
• Port Authority of Los Angeles Simulation Exercise
• US Coast Guard Visits and Tours:
• Sector Los Angeles
• Sector Boston
• Sector Houston
• Marine Safety Detachment, Fort Smith (Sector LMR)
• Visits to terminal operations in Port Hueneme, Port of Los Angeles, Port of Long Beach, Port of Houston, Port of Oakland, Port of NY-NJ, Port of Catoosa, Port of Baltimore

Issues in Defining Port Resilience
• Definition of Port & Boundaries: water, land side
• Who runs the port?
• Port resilience – is it a resilient terminal, a resilient port, resilient regional ports, or a resilient system of ports?
• How you answer this depends on your perspective/interest
• Port Resilience = Resil(TO)+Resil(NW)+Resil(IC)?
• If you’ve seen one port….. you’ve seen one port
• This is true for physical aspects of the port
• But its not true for all other common port elements
• Result: highly complex environment, multiple parties with different objectives
Framework for Developing a Detailed Capacity Estimate

Developing a Detailed Capacity Estimate
• No capacity estimate made for domestic US
• No detailed estimate or methodology for calculating capacity estimate
• Port Capacity estimates need to consider several core capacities
• Anchorage
• Waterway
• Terminal
• Intermodal connections (including infrastructure)
• Work done with Prof. Ioannis Lagoudis, University of the Aegean

Research aim
The paper revisits port capacity providing a more
holistic approach via including immediate port
connections from the seaside and the hinterland.
The methodology provided adopts a systemic approach
encapsulating the different port terminals along with
the seaside and hinterland connections providing a
holistic estimation of port capacity.

Literature review
Source: Lagoudis and Rice (2011)

Port capacity
‟... A port’ s capacity is normally defined as the cargo volume that the port is capable of
handling within 1 year and is often expressed as a throughput in tons per unit
length of a wharf per year (MT/m/yr or LT/ft/yr), multiplied by the available berth length, for each type of berth separately.”
Source: Frankel (1987)
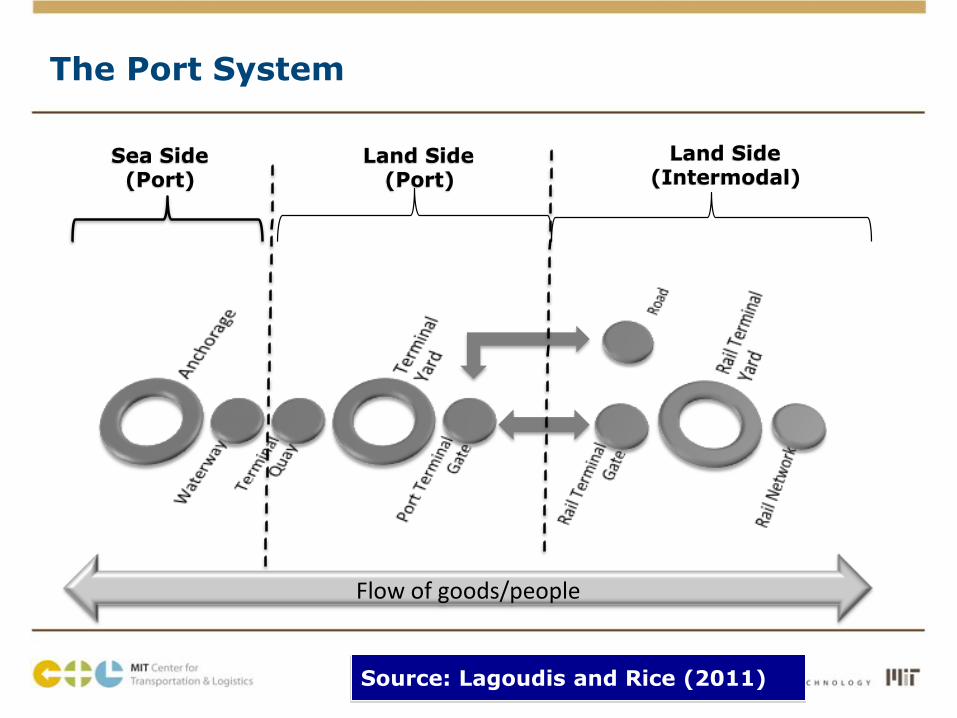
The Port System
Flowofgoods/people
Land Side (Port)
Land Side (Intermodal)
Sea Side (Port)
Source: Lagoudis and Rice (2011)
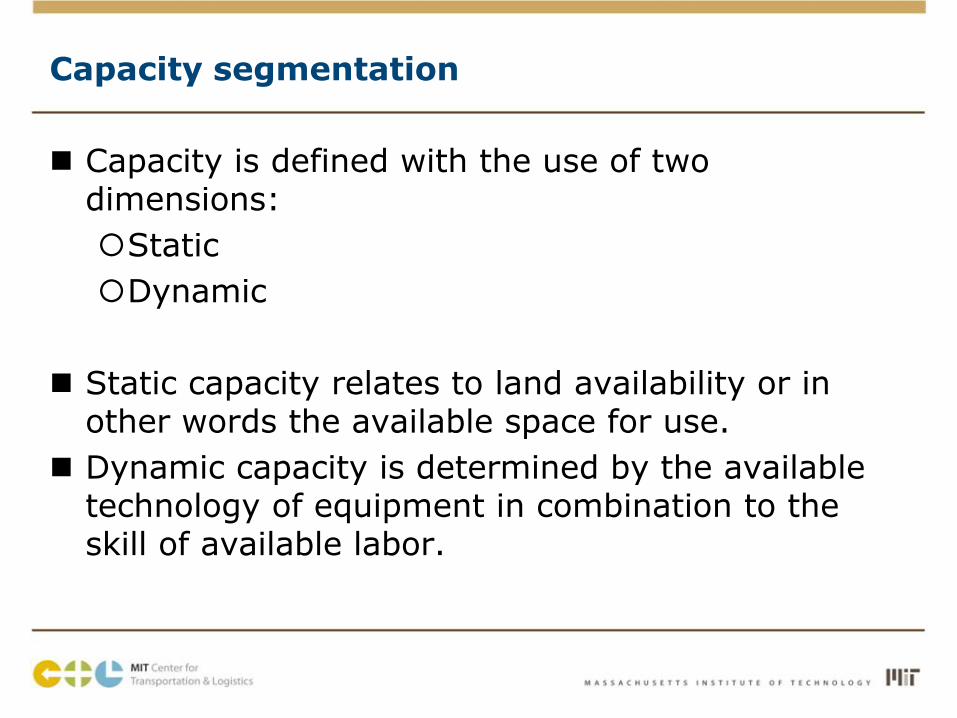
Capacity segmentation
Capacity is defined with the use of two dimensions:
Static
Dynamic
Static capacity relates to land availability or in other words the available space for use.
Dynamic capacity is determined by the available technology of equipment in combination to the skill of available labor.

Measuring Capacity at Static and Dynamic Level
Static Dynamic
Anchorage Area determined by longitude and latitude in the ocean.
It depends on the average time a vessel waits before it is actually served.
Waterway It is determined by the length, breadth and depth of the channel. Regulation in terms of safety is a non-physical factor that affects capacity.
Mostly determined by the frequency of the vessels and their characteristics in terms of size and type.
Terminal Quay/Berth
The length of the quay and the available depth determine the size of the vessels that can call and the number that can be served at the same time
The available equipment in combination with labor determine the vessels’ turnaround
Terminal Yard/Area
Container The layout is composed of three main areas: stacking area, consolidation/de-consolidation area and traffic space. The number of ground slots provide the basis for the static capacity. Depending on the product mix (import, export, empty, refer, dangerous) and the stacking policy the total static capacity is derived.
The available equipment (cranes etc) in combination with labor and the demand mix characteristics (import, export, empty, refer, dangerous) determine the containers’ turnaround and thus the overall capacity volume wise.
General cargo The terminal layout is composed of three main areas: stacking area, consolidation/de-consolidation area and traffic space. The stacking capacity is derived by the length, breadth and highth of the products. Depending on the product mix (commodities, finished goods etc) and the stacking policy the total volume that can be handled can be derived.
The available equipment (cranes etc) in combination with labor and the demand mix characteristics (commodities, finished goods etc) determine the merchandises turnaround and thus the overall capacity volume wise.
Liquid The terminal layout is composed of three main areas: tanks where oil products are stored, refining area and traffic space. Tank capacity is dependent on the density of the products stored.
The available equipment (pumping specification of pipes) in combination with labor and the demand mix characteristics (oil, ethanol, gas etc) determine the overall capacity volume wise.
Car The layout is composed of two main areas: stacking area and traffic space. The number of ground slots provide the basis for the static capacity. Depending on the vehicle mix (cars, trucks etc) the total static capacity is derived.
The available equipment (security check pints etc) in combination with labor and the demand mix characteristics determine the vehicles’ turnaround and thus the overall capacity volume wise.
Ferry The terminal layout includes infrastructure for passenger waiting area, space for vehicle waiting area and free space for traffic. Here capacity is measured in terms of passengers and vehicles. Capacity is dependent on the allocated area in both cases.
The available equipment (security check pints etc) in combination with labor and the demand mix characteristics determine the passenger and vehicles turnaround and thus the overall capacity volume wise.
Cruise The terminal layout includes infrastructure for passenger waiting area, and free space for traffic. Here capacity is measured in terms of passengers thus is dependent on the allocated area.
The available equipment (security check pints etc) in combination with labor determine the passenger turnaround and thus the overall capacity volume wise.
Port Terminal Gate The number of servers at the gates is determined by the terminal layout which determines the length of the gate The available equipment in combination to labor determine the truck/cars/rail cars/people turnaround
Rail Terminal Gate The number of servers at the gates is determined by the terminal layout which determines the length of the gate The available equipment in combination to labor determine the rail cars turnaround
Rail Terminal Yard The layout is composed of three main areas: stacking area for boxes, stacking area for commodities and traffic space. The number of ground slots provide the basis for the static capacity. Depending on the product mix (import, export, empty, refer, dangerous) and the stacking policy the total static capacity is derived.
The available equipment (cranes etc) in combination with labor and the demand mix characteristics (import, export, empty, refer, dangerous, commodities etc) determine the containers’ turnaround and thus the overall capacity volume wise.
Rail Network It is defined by the number of trucks connecting the terminal with the rail network It is determined by the available equipment (rail cars and locomotives), labor and regulatory environment related to safety
Road Network It is defined by the number of lanes connecting the terminal with the road network It is determined by the mix of vehicles (cars/trucks/bikes/buses) and regulatory environment related to safety

Capacity Calculation
Static Dynamic
Anchorage Anchorage Capacity = Designated Area / Area needed by average ship size
Anchorage Capacity = Designated Area / (Area needed by average ship size * Average Waiting time)
Waterway Waterway Capacity = (Length * Number of lanes) / Average ship size
Waterway Capacity = (Length * Number of lanes) / (Average ship size * Average Cruising Time)
Terminal Quay/Berth
Quay Capacity = Length of Quay / Average vessel size
Quay Capacity = Length of Quay / (Average vessel size * Turnaround time)
Terminal Yard/Area
Container Container Terminal Yard Capacity = Designated area / TEU size = Number of ground slots * TEU stacking policy Container Terminal Warehouse Capacity = Designated area / TEU size = Number of ground slots
Container Terminal Yard Capacity = (Number of ground slots * TEU stacking policy) / TEU average idle time Container Terminal Warehouse Capacity = Number of ground slots / TEU average marshaling time
General cargo Yard Capacity = Designated area / Commodity size Warehouse Capacity = Designated area / Commodity size
Yard Capacity = Designated area / (Commodity size * Commodity average idle time) Warehouse Capacity = Designated area / Commodity average marshaling time
Liquid Liquid Capacity = Designated area / (No of Tanks * Average Tank Capacity) Liquid Capacity = Designated area / (No of Tanks * Average Tank Capacity * Average pumping time)
Car Car Capacity = Designated area / Average vehicle size = Number of slots Car Capacity = Designated area / Average vehicle size = Number of slots / Vehicle average idle time
Ferry Ferry Passenger Capacity = Designated area / Average space per passenger Ferry Vehicle Capacity = Designated area / Average vehicle size
Ferry Passenger Capacity = Designated area / (Average space per passenger * Average waiting time) Ferry Vehicle Capacity = Designated area / (Average vehicle size * Average idle time)
Cruise Ferry Cruise Capacity = Designated area / Average space per passenger
Ferry Cruise Capacity = Designated area / (Average space per passenger * Average waiting time)
Port Terminal Gate
Port Terminal Gate Capacity = Gate Length / Gate size = Number of gates Port Terminal Gate Capacity = Gate Length / Gate size = Number of gates / Average unit process time
Rail Terminal Gate Rail Terminal Gate Capacity = Gate Length / Gate size = Number of gates Rail Terminal Gate Capacity = Gate Length / Gate size = Number of gates / Average unit process time
Rail Terminal Yard Rail Terminal Yard Capacity (Container) = Designated area / TEU size = Number of ground slots * TEU stacking policy Rail Terminal Yard Capacity (Bulk) = Designated area / Commodity size
Rail Terminal Yard Capacity (Container)= (Number of ground slots * TEU stacking policy) / TEU average idle time Rail Terminal Yard Capacity (Bulk) = Designated area / (Commodity size * Commodity average idle time)
Rail Network Rail Network Capacity = (Truck length * Number of trucks) / Average car size Rail Network Capacity = (Truck length * Number of trucks) / (Average car size * Average cruising speed)
Road Network Road Network Capacity = (Lane length * Number of lanes) / Average vehicle size Road Network Capacity = (Lane length * Number of lanes) / (Average vehicle size * Average cruising
time)

Conclusions
The specific methodology enables the measurement of the port capacity itself by the identification of possible bottlenecks present in the handling process of goods and commodities
It also provides a framework enabling the state, port authorities and port operators to make strategic decisions regarding investment priorities in the modern global turbulent business environment.

US Port Capacity Study

Two Driving Questions
Q1
•What is the capacity of the United States port system?
Q2 •Can the system absorb
a port failure?

Dual Approach - #1 Estimate Current Capability
• 1st Approach – Estimate current capacity utilization & identify ability of ports to absorb the volume of any one port closure
• Assume port closure: displaced volume assigned to nearest ports in order of proximity to the disrupted port
• Capacity estimations extrapolated from MergeGlobal port utilization data for top 10-12 ports in 2006
• Identified how far and avg # stops required to relocate the volume
• Considered ability at 3 levels: 1st with no constraints, 2nd require matching commodity class, 3rd require minimum volume/stop (4000TEU)
• Other potential constraints not considered (e.g. channel depth, cost of stops, intermodal connectivity, labor, etc.)
• # of stops & distance required to offload volume calculated for the loss of each port (but this matters only for volume in or en route to port)

US Port Capacity
• Can the 300+ ports in the US handle a disruption at any port? • At a gross level, the system can absorb disrupted volume from any one port
closure on an annual basis considering tonnage only
• Distance to travel to clear disrupted volume = 205 miles
• Average # of stops to clear disrupted volume = 5
• Matching Commodity (e.g. containers go to container terminals) • But the system cannot absorb all volume if commodities have to go to
terminals that handle those commodities
• Distance to travel to clear disrupted volume = 369 miles
• Average # of stops to clear disrupted volume = 7
• Minimum Unload Requirement (e.g. vessels unload ½ vessel/stop) • System cannot absorb all volume if vessels also unload min ½ vessel per stop
• Distance to travel to clear disrupted volume = 539 miles
• Average # of stops to clear disrupted volume = 2
• Realistically • Distance to travel only matters to the volume in the port at point of disruption
• The system cannot absorb all volume if a major port is closed without significant delays and costs
*Using MergeGlobal estimate of port capacity utilization

Dual Approach - #2 Estimate Required Capability
• 2nd Approach – Identify the maximum current capacity utilization in order for the remaining ports to absorb the volume of any one port closure
• Use recent handled volumes as base volume for each port
• Remove the port with the highest volume in each commodity class
• For each commodity class, calculate the maximum level of capacity utilization of all other ports serving that commodity class in order for the remaining ports to absorb the displaced volume

US Port Capacity needed to absorb volume
• Manufactured Equipment Capacity = 107,240,591 tons/yr • Max capacity utilization for ports to absorb loss of largest port’s volume = 82%
• Top 3 ports handle 41% of total volume
• Container Capacity = 29,980,993 TEU/yr** • Max capacity utilization for ports to absorb loss of largest container port* = 74%
• Top 3 ports handle 45% of total volume
• Chemical Capacity = 195957,624 tons/yr • Max capacity utilization for ports to absorb loss of largest chemical port = 77%
• Top 3 ports handle 37% of total volume
• Petroleum Capacity = 1,057,271,241 tons/yr • Max capacity utilization for ports to absorb loss of largest petro port = 84%
• Top 3 ports handle 29% of total volume
• Food & Farm Capacity = 307,561,126 tons/yr • Max capacity utilization for ports to absorb loss of largest food & farm port = 50%
• Top 3 ports handle 43% of total volume
*Data from ACOE 2009 volumes; capacity utilization presented represents maximum utilization in order to clear volume, min ½ vessel unload per stop ** TEU data from ACOE 2009 volumes from US container ports

Absorbing Volume Post-disruption
Commodity/Conveyance Top 3 Ports for the commodity
Min Capacity Needed to Absorb Volume of Top Port
Container Top 3 Ports: Los Angeles, Long Beach, NY/NJ
26%
Chemicals Top 3 Ports: Houston, South Louisiana, Baton Rouge
23%
Coal Top 3 Ports: Mobile, Pittsburgh, Hampton Roads
16%
Food and Farm Products Top 3 Ports: So. Louisiana, New Orleans, Plaquemines
50%
Manufactured Equipment Top 3 Ports: Los Angeles, NY/NJ, Hampton Roads
18%
Petroleum Top 3 Ports: Houston, NY/NJ, South Louisiana
16%
Raw Materials Top 3 Ports: Duluth-Superior, NY/NJ, So. Louisiana
5%
Waste and Scrap Top 3 Ports: Port Arthur, South Louisiana, Vancouver
46%
*Data based on ACOE 2009 volumes
US Port Disruption Response – Cargo Allocation Tool
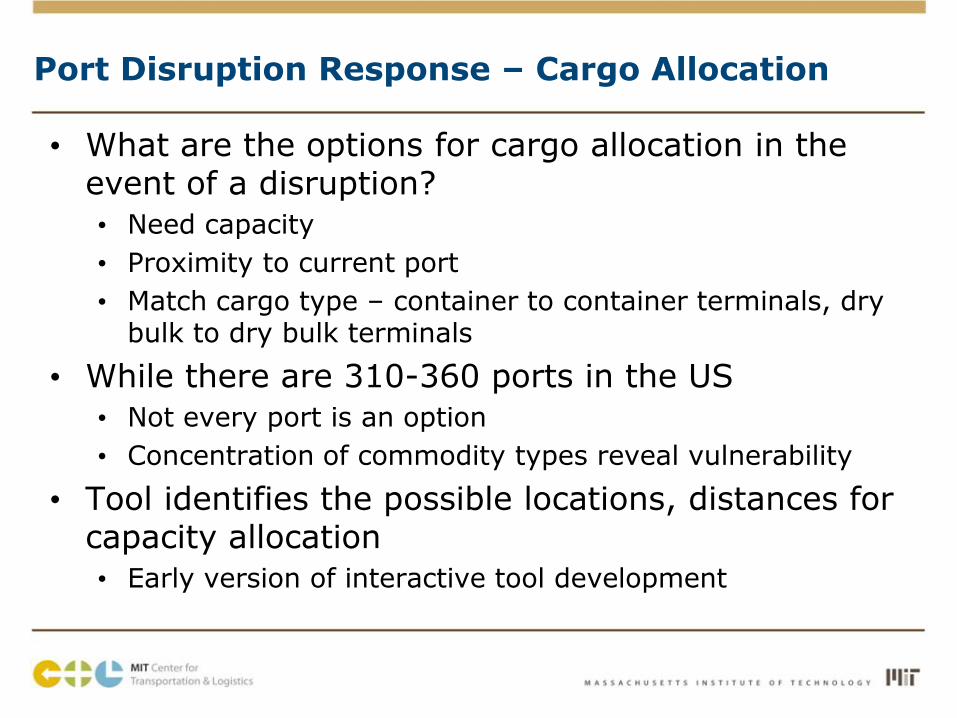
Port Disruption Response – Cargo Allocation
• What are the options for cargo allocation in the event of a disruption?
• Need capacity
• Proximity to current port
• Match cargo type – container to container terminals, dry bulk to dry bulk terminals
• While there are 310-360 ports in the US
• Not every port is an option
• Concentration of commodity types reveal vulnerability
• Tool identifies the possible locations, distances for capacity allocation
• Early version of interactive tool development

What would happen if Los Angeles could not handle containers? Where would the volume go?

Continued: LA constraint. Where could the volume go if only the Top 10 container ports were used?

What if So. Louisiana could not handle Food & Farm Products? Where would the volume go?

Continued: So. Louisiana constraint. Where would the volume go if only the Top 10 ports were used?
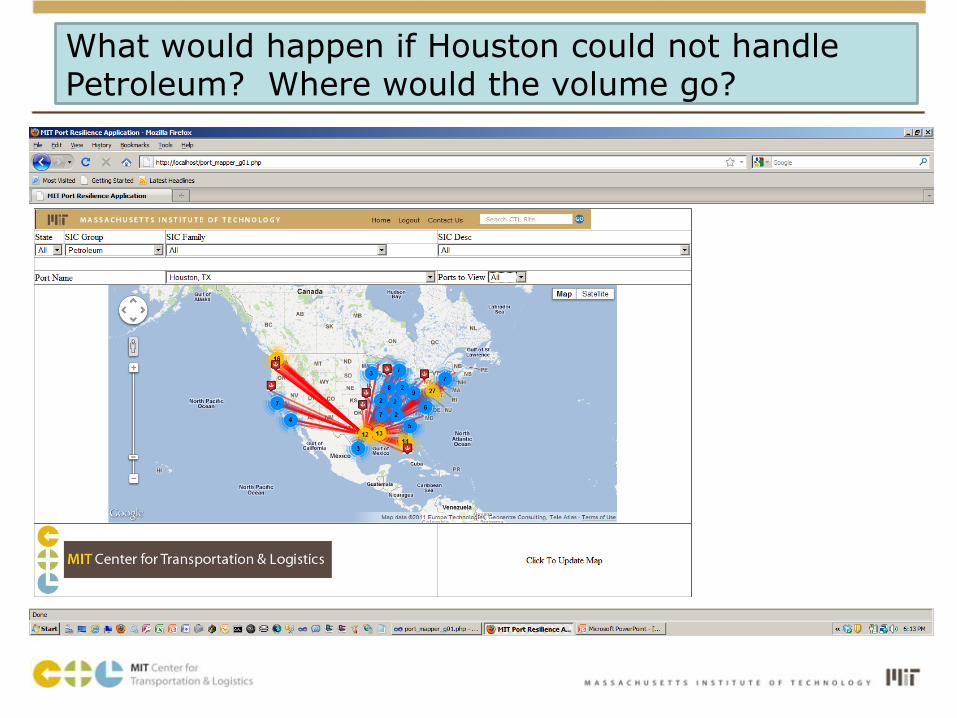
What would happen if Houston could not handle Petroleum? Where would the volume go?

Coninued: Houston constraint. Where would the volume go if only the Top 10 ports were used?

Port Resilience Team
• MIT Port Resilience Project Team
• Jim Rice, [email protected], 617.258.8584
• Matt Mattingley, [email protected]
• Ioannis Lagoudis, [email protected]
• Kai Trepte, [email protected]
• Øyvind Berle, [email protected]
• Adrien Gasparini, [email protected]
• John Waller, [email protected]
• Antonella Moretto, Visiting PhD Candidate, Politecnico di Milano
• Raathai Molian, MIT Graduate Student

Thank you
Jim Rice
617.258.8584
http://ctl.mit.edu
Research/MIT Port Resilience Project