us & nafta commercial freight acvity modes of transportation
TRANSCRIPT

U.S. & NAFTA COMMERCIAL FREIGHT ACTIVITY MODES OF TRANSPORTATION: ECONOMIC AND ENVIRONMENTAL IMPACTS.
Andrew Pagano, 5/7/15, Transportation & Environment

Agenda
Introduction
Economics of Freight (U.S.)
Environmental Impacts (U.S.)
Benchmarking Policies (U.S.)
NAFTA overview
NAFTA figures
Conclusions
Introduction
United States has the largest transportation sector in the world
Serving over 7 million domestic business establishments and 288 million residents
Employing 1 out of every 7 workers in the nation
Over $1 out of every $10 produced in the GDP of the U.S. is related to transportation activity
Objective of paper:
1. Discuss and analyze the economic and environmental impacts of each different mode used to move commercial freight throughout the U.S.
2. Quantify and measure the total value of goods transported by each mode, amount of tons per mode and efficiencies of each mode in ratio of tons of goods transported by the miles traveled
3. Provide figures of the North American Free trade Agreement (NAFTA) between the U.S., Canada and Mexico through the lenses of U.S goods trade, supply chains and modes of transport with NAFTA Partners

Economics of Freight (U.S)
Value of freight shipments in 2002, including domestic commodity shipments and
domestic transportation of exports and imports, was $11 trillion
Consumption of goods, products and changing needs for changing populations are
closely correlated with the population growth
According to the FHWA and FAF the economic activity correspondence to the trade
network, the freight transportation tonnage is set to increase 72% by 2050.

Economics of Freight (U.S)
Dominant Freight transport modes are Rail and Road
Rail accounts for volume in with a value of 3.1 trillion Freight Ton Kilometers
equivalent to 56% of the industry's overall volume
Road freight had a volume of 2.5 trillion Freight Ton Kilometers in 2012, equating
to 44% of the industry total.
Total value for both the modes of transport of $857.6bn was measured in 2012.
The $857.6bn represents an annual growth rate of 1.9% from 2008 to 2012.

Economics of Freight (U.S)
Value and revenues are measured differently, these are broken down into industry-
wide revenue and tons-miles
From this measurement, largest share of revenue and tons-miles is trucking both
included in highway and city streets.
Environmental Impacts (U.S)
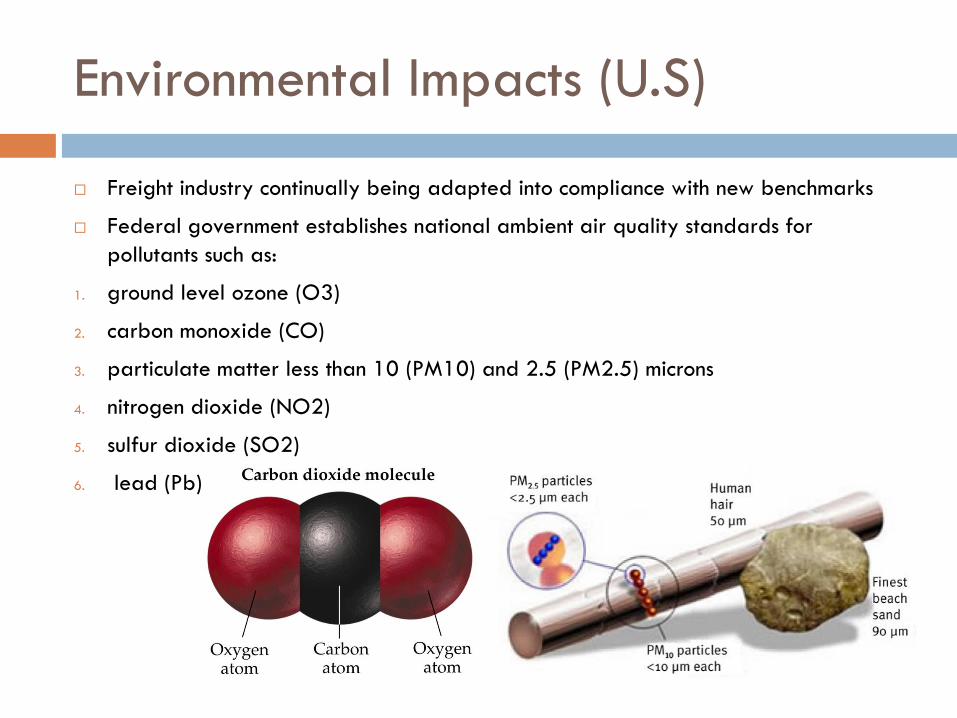
Freight industry continually being adapted into compliance with new benchmarks
Federal government establishes national ambient air quality standards for
pollutants such as:
1. ground level ozone (O3)
2. carbon monoxide (CO)
3. particulate matter less than 10 (PM10) and 2.5 (PM2.5) microns
4. nitrogen dioxide (NO2)
5. sulfur dioxide (SO2)
6. lead (Pb)
Environmental Impacts (U.S)
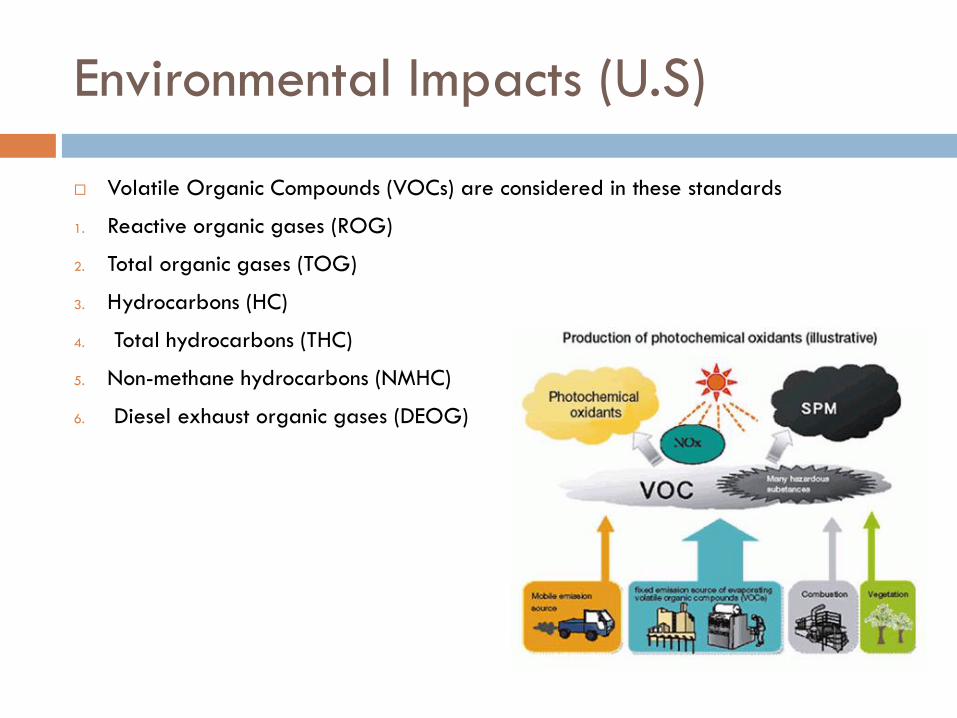
Volatile Organic Compounds (VOCs) are considered in these standards
1. Reactive organic gases (ROG)
2. Total organic gases (TOG)
3. Hydrocarbons (HC)
4. Total hydrocarbons (THC)
5. Non-methane hydrocarbons (NMHC)
6. Diesel exhaust organic gases (DEOG)

Environmental Impacts (U.S)
The National emissions inventory categorizes specific mobile source emissions such as
Ozone and measures the highly reactive gas, which is Nitrogen Oxides
Nitrogen oxides include nitrogen dioxide and serves as the measureable component
to map out percentage of NOx emissions by specific modes in the U.S.

Environmental Impacts (U.S)
Second measure from the National emissions inventory is the Particulate matter of
10 micrometers and below (PM10)
Transportation sector is responsible for the majority of these emissions
Primarily emitted via road dust, covering the extent of 54% of total national PM10
emissions.

Environmental Impacts (U.S)
Most importantly for the impacts related to climate change and ozone depletion,
are the EPA’s greenhouse gas inventory for the U.S. Carbon dioxide emissions
Remains the primary gas of interest accounting for over 95% of the transportation
sector’s global warming potential-weighted GHG emissions.

Benchmarking Policies (U.S)
Policy implementation and air quality standard benchmarking are not executed
uniformly even in mode-specific areas
There is a limitation and challenge when comparing specific modes collectively
Not all individual modes operate in the same framework for analysis and cannot be
stood side-by-side to standardize across the board of that mode.
Benchmarking Policies (U.S.)
Difficulties for standardizing trucking include:
1. vehicle classes
2. vehicle
3. cargo type
4. vehicle routes.
Weight level, would deem the fleet level environmental performance standards to
be separated by different classes of trucks.
Refrigeration or heavier chassis and should rather be standardized according to the
type of vehicle and cargo unit.
Routes containing steep terrain or warm climates, as these routes naturally produce
more emissions levels than flat or moderate temperatures.

Benchmarking (U.S.)
Rail transport considerations
1. Differences between classes of railroads
2. Equipment
3. Facilities
4. Cargos
5. Geography
6. Rail lines
Rail classes are divided into categories which are operating revenue,
size of rail carrier
infrastructure to improve environmental performance.
1. Switch Cars: 2,000 hp or under
2. Freight line-haul: 2,000hp-3,00hp in older units and 3,000hp to 5,000hp in newer units

Benchmarking
Two categories for benchmarking
1. Ship type: auto carriers, barge carriers, bulk carrier, container ships, general cargo
ships, tugs/tows, reefers, roll-on/roll-off ships, and of course tankers.
2. Vessel characteristics:
Propulsion engines: slow-speed diesel, medium-speed diesel, gas turbines and steam
turbines.
Auxiliary engines: are the engines that generate electricity for on-board operations
and are usually Medium speed diesel technologies.
NAFTA Overview
In 1996 population of North America was 390 million
Population of the United States accounted for 68.2% of North
America’s population,
Mexico accounted for 24.1%
Canada accounted for 7.7%.
With regards to labor force percentage
United States accounted for 72.1%
Mexico accounted for 19.7%
Canada accounted for 8.1%.

NAFTA figures
GDP percentages by industry category
i. United States having 22.6% of its GDP attributed to services
ii. Mexico having 22.4%
iii. Canada having 20.9%
Manufacturing was a very close second for every country’s GDP
i. United States having 18.3% of its economy dedicated to manufacturing,
ii. Mexico leading the pack at 21.5%
iii. Canada having 17.7%
To conclude GDP categories, transportation
i. U.S. having 3.4% of its economy based in transportation industry,
ii. Mexico leading the percentage pack with 8.6%
iii. Canada having 3.2%

NAFTA Figures
NAFTA Figures

NAFTA Figures
Most important factor relating to NAFTA is its transportation, energy and
environmental analysis. Energy consumption by the transportation sector is measured
in joules, specifically in (Exajoules, 10^18).
The United States’ transportation sector consumes 99.04 (Exajoules, 10^18) or
26.02% of the nation’s total energy consumption.
Mexico consumes 5.9 (Exajoules, 10^18) or 24.45% of the nation’s total
Canada consumes 8.98 (Exajoules, 10^18) or 25.9% of the nation’s total energy
consumption on the transportation sector)
NAFTA Figures
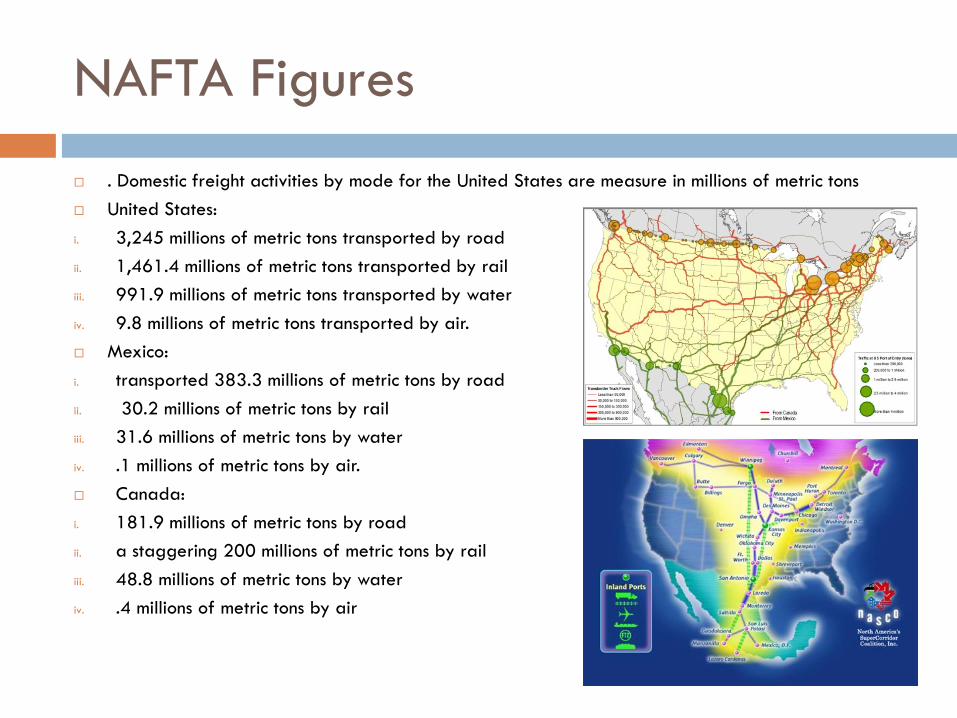
. Domestic freight activities by mode for the United States are measure in millions of metric tons
United States:
i. 3,245 millions of metric tons transported by road
ii. 1,461.4 millions of metric tons transported by rail
iii. 991.9 millions of metric tons transported by water
iv. 9.8 millions of metric tons transported by air.
Mexico:
i. transported 383.3 millions of metric tons by road
ii. 30.2 millions of metric tons by rail
iii. 31.6 millions of metric tons by water
iv. .1 millions of metric tons by air.
Canada:
i. 181.9 millions of metric tons by road
ii. a staggering 200 millions of metric tons by rail
iii. 48.8 millions of metric tons by water
iv. .4 millions of metric tons by air
Conclusions
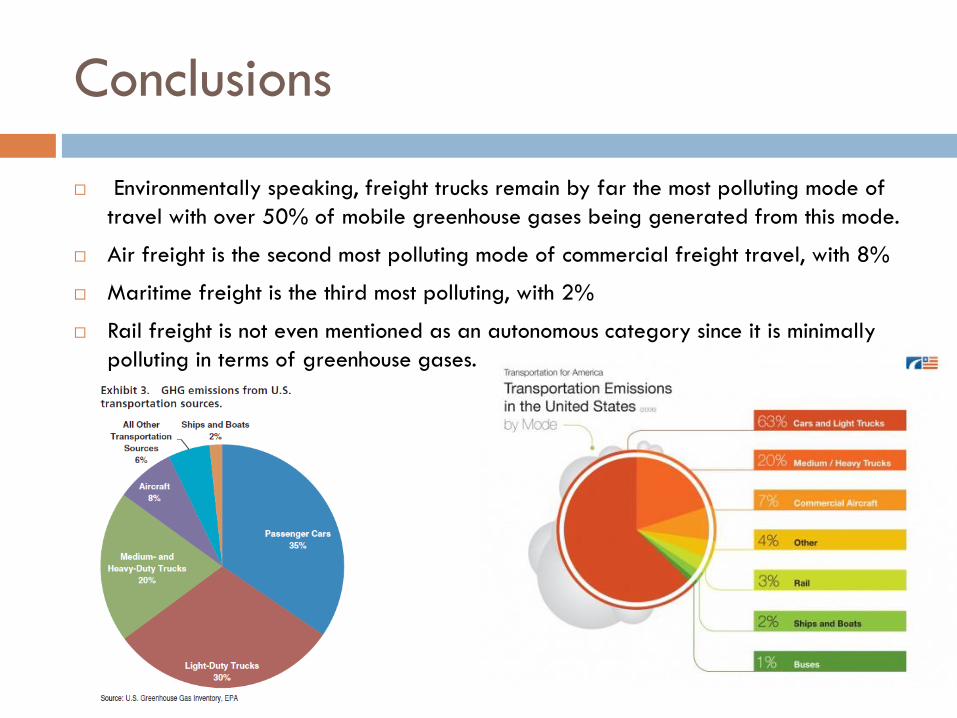
Environmentally speaking, freight trucks remain by far the most polluting mode of
travel with over 50% of mobile greenhouse gases being generated from this mode.
Air freight is the second most polluting mode of commercial freight travel, with 8%
Maritime freight is the third most polluting, with 2%
Rail freight is not even mentioned as an autonomous category since it is minimally
polluting in terms of greenhouse gases.

Conclusions
Remains to be seen how much of a focus will be fixed on providing more
infrastructure for lesser-polluting transportation modes such as rail or maritime
freight, but
Trucking remains the top contender for both revenue and ton-miles
Rail is far behind in second place for revenue amounts but is most efficient form of
transport by measure of tons-miles
Maritime travel is the third largest revenue stream, although Maritime has low
efficiency in the tons-miles.
Air cargo which is the fourth largest revenue source by far, third most efficient in
terms of tons-miles

Conclusions
NAFTA has not come out with formal studies for its emissions
Import policies to protect the infrastructure, safety and environmental well-being domestically are still being implemented.
Data reveals that an even greater percentage of international transportation within the NAFTA countries is done by trucks
Mexico remains highly reliant on substandard trucks for transport to U.S. depots at the expense of U.S. environment and infrastructure
Canada remains a steady and compliant trading partner for the U.S, but also remains dependent on trucking for mean s of transport, with some supplemental maritime freight venues

Thank You