us multifamily marketview - q2 2014
TRANSCRIPT
U.S. Multifamily MarketView
CBRE Global Research and Consulting Q2 2014
© 2014, CBRE, Inc.
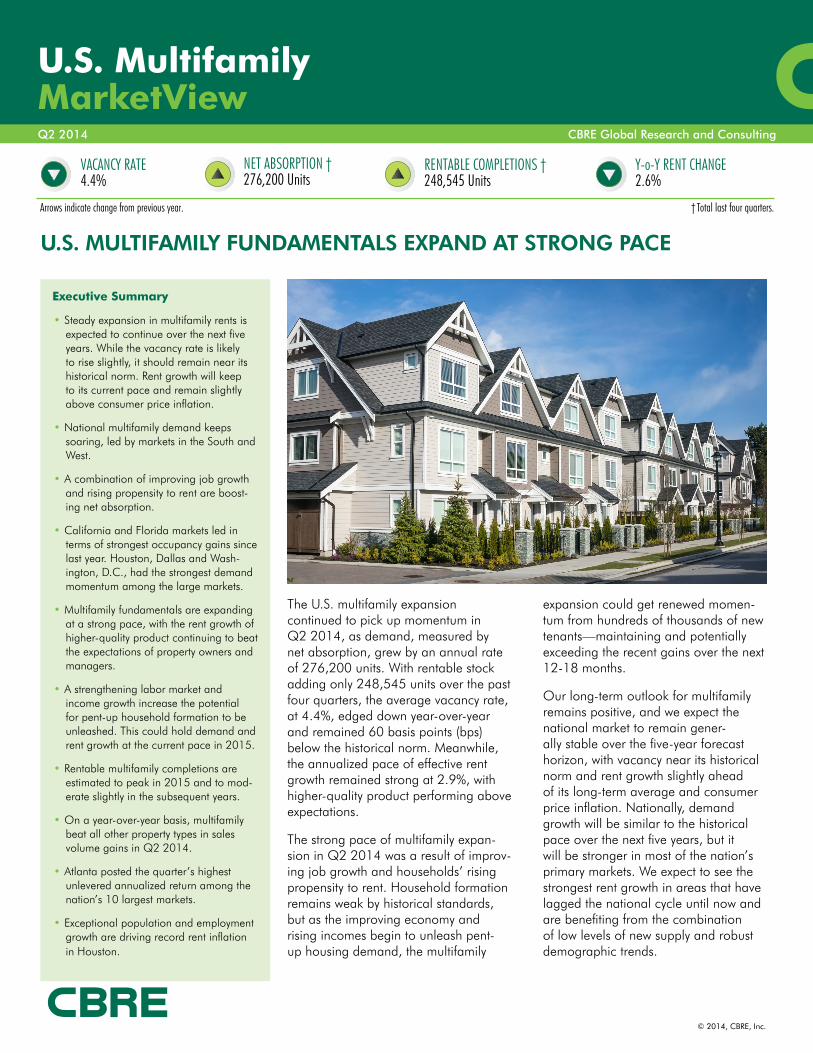
The U.S. multifamily expansion continued to pick up momentum in Q2 2014, as demand, measured by net absorption, grew by an annual rate of 276,200 units. With rentable stock adding only 248,545 units over the past four quarters, the average vacancy rate, at 4.4%, edged down year-over-year and remained 60 basis points (bps) below the historical norm. Meanwhile, the annualized pace of effective rent growth remained strong at 2.9%, with higher-quality product performing above expectations.
The strong pace of multifamily expan-sion in Q2 2014 was a result of improv-ing job growth and households’ rising propensity to rent. Household formation remains weak by historical standards, but as the improving economy and rising incomes begin to unleash pent-up housing demand, the multifamily
expansion could get renewed momen-tum from hundreds of thousands of new tenants—maintaining and potentially exceeding the recent gains over the next 12-18 months.
Our long-term outlook for multifamily remains positive, and we expect the national market to remain gener-ally stable over the five-year forecast horizon, with vacancy near its historical norm and rent growth slightly ahead of its long-term average and consumer price inflation. Nationally, demand growth will be similar to the historical pace over the next five years, but it will be stronger in most of the nation’s primary markets. We expect to see the strongest rent growth in areas that have lagged the national cycle until now and are benefiting from the combination of low levels of new supply and robust demographic trends.
U.S. MULTIFAMILY FUNDAMENTALS EXPAND AT STRONG PACE
Y-o-Y RENT CHANGE2.6%
Arrows indicate change from previous year. † Total last four quarters.
NET ABSORPTION †276,200 Units
VACANCY RATE4.4%
Executive Summary
• Steady expansion in multifamily rents is expected to continue over the next five years. While the vacancy rate is likely to rise slightly, it should remain near its historical norm. Rent growth will keep to its current pace and remain slightly above consumer price inflation.
• National multifamily demand keeps soaring, led by markets in the South and West.
• A combination of improving job growth and rising propensity to rent are boost-ing net absorption.
• California and Florida markets led in terms of strongest occupancy gains since last year. Houston, Dallas and Wash-ington, D.C., had the strongest demand momentum among the large markets.
• Multifamily fundamentals are expanding at a strong pace, with the rent growth of higher-quality product continuing to beat the expectations of property owners and managers.
• A strengthening labor market and income growth increase the potential for pent-up household formation to be unleashed. This could hold demand and rent growth at the current pace in 2015.
• Rentable multifamily completions are estimated to peak in 2015 and to mod-erate slightly in the subsequent years.
• On a year-over-year basis, multifamily beat all other property types in sales volume gains in Q2 2014.
• Atlanta posted the quarter’s highest unlevered annualized return among the nation’s 10 largest markets.
• Exceptional population and employment growth are driving record rent inflation in Houston.
RENTABLE COMPLETIONS †248,545 Units

U.S. M
ultifa
mily| M
arketV
iew
2
Q2 2
014
© 2014, CBRE, Inc.
Households’ rising propensity to rent, along with steady improvement in job growth, supported the sector’s strong Q2 2014 expansion. Total employment grew by 301,000 jobs, or 0.4%, across the 60 U.S. multifamily markets tracked by CBRE—compared to a 0.3% gain in the prior quarter. The largest contributors to national job growth in Q2 2014 included New York, Atlanta, Houston, Dallas, Minneapolis, Seattle, Denver, Fort Worth, Portland, Boston, Orlando and Phoenix—together they accounted for more than half of the 60 markets’ total gain.
Markets that led in relative job growth in Q2 2014 (record-ing growth of 3% or more from Q2 2013) included San Jose, Dallas, Orlando, Austin, Las Vegas and Oklahoma City. Albuquerque, Hartford, Pittsburgh, Dayton, Norfolk, Greensboro, Detroit and Edison were among those recording negative to flat year-over-year job growth.
Nashville, Orlando, Austin, West Palm Beach, Tucson, Charlotte, Las Vegas, Fort Lauderdale, Phoenix and Fort Worth are among the markets expected to record the strongest job growth (averaging more than 3% per year) over the next
two years. Those anticipated to see the slowest job growth (averaging less than 1% per year) include Hartford, Cleveland, Albuquerque, Dayton, Newark, Detroit, San Jose and Philadelphia.
Broad rental demand continues to grow in the U.S. as more existing households shift from owning to renting, and as more newly formed households choose to rent—rather than buy—single-family homes and apartments (see Figure 3). According to the Housing Vacancy Survey conducted by the Bureau of the Census, U.S. housing demand grew by 458,000 house-holds between Q2 2013 and Q2 2014, while the national homeownership rate declined by 30 bps—from 65% to 64.7%. Over this period, total household growth and the decline in the homeownership rate produced an increase of 534,000 renter households nationally. Over the next 12-18 months, elevated foreclosure rates are likely to remain a headwind to owner de-mand, and as the labor market and income growth strengthen, there is rising potential for pent-up household formation to be unleashed—which would boost rental demand and extend the multifamily sector’s strong performance.
ECONOMIC TRENDSTHE HOMEOWNERSHIP RATE CONTINUES TO FALL
Figure 2: Markets in the South and West Lead Job Growth
Average Annual Growth in Total Employment (%)
PhoenixDallas
San DiegoSan Francisco
DenverAtlantaMiami
U.S. AverageSeattle
Washington, D.C.Boston
HoustonChicago
Los AngelesNew York
Source: CBRE Econometric Advisors, Q2 2014.Last 2 Years Next 2 Years (Forecast)
0 1 32 4
Figure 1: U.S. Multifamily Supply & Demand Outlook
Completions and Net Absorption (Units, 000’s) Vacancy Rate (%)
-200
-100
0
100
300
200
400 8
6
4
7
5
3
2
2000
1999
1998
1997
1996
1995
2002
2004
2006
2008
2010
2012
2016
2001
2003
2005
2007
2009
2011
2014
2013
2017
2015
2018
Source: CBRE Econometric Advisors, Q2 2014. Historical and current multifamily vacancy and rent data are provided by RealPage Inc.’s MPF Research division.
Completions (L) Net Absorption (L) Vacancy Rate (R)
Forecast
Figure 3: U.S. Homeownership Rate and Renter Households
Homeownership Rate (%) Renter Households (Mil.)
606162636465666768
7069
71 42
38
34
40
36
32302826242220
1966196
8197
0198
0199
0200
0201
0197
4198
4199
4200
4201
4197
2198
2199
2200
2201
2197
6198
6199
6200
6197
8198
8199
8200
8
Sources: Bureau of the Census and CBRE Econometric Advisors, Q2 2014.
Homeownership Rate (L) Renter Households (R)

U.S. M
ultifa
mily | M
arketV
iew
3
Q2 2
014
© 2014, CBRE, Inc.
In Q2 2014, multifamily demand expanded by 276,200 units, or 1.9%, on a year-over-year basis (see Figure 4). The national vacancy rate dropped by 20 bps from its year-earlier level (see Figure 5), to 4.4%, bringing the four-quarter trailing average rate to 4.7%—60 bps below the 1999-2013 average. The largest contributors to national demand growth over the past four quarters were Houston, Dallas, New York, Los Angeles, Austin, Atlanta, Washington, D.C., Seattle, Denver, Orlando, Raleigh, Tampa and Boston—together accounting for more than half of the period’s total net absorption. Markets with the strongest growth in demand (over 3.5% from a year earlier) were all in the South or West, and included Austin, Raleigh, Jacksonville, Orlando, El Paso, Houston, Charlotte, Nashville, San Jose, Portland and Denver. Markets expected to see the strongest demand growth over the next two years (averaging more than 2.5% per year) include Raleigh, Austin, Norfolk, Charlotte and Salt Lake City.
In 40 of the 60 markets, vacancy rates declined from Q2 2013, with the strongest improvement (declines of 100 bps or more from a year ago) reported in Albuquerque, Sacramento,
Jacksonville, St. Louis, Riverside, Fort Lauderdale, Atlanta and Cleveland. Over the same period, vacancy rates increased by 50 bps or more in Norfolk, Greensboro, Salt Lake City, San Antonio, Birmingham and Greenville.
Markets with the lowest vacancy rates (below 3.5%, averaged over the past four quarters) included Minneapolis, Oakland, Miami, Portland, San Jose, Newark, Ventura, Edison, Boston, Providence, Pittsburgh and San Diego. Those with the highest vacancy rates (averaging 7% or more over the past four quarters) included Greensboro, Las Vegas, Birmingham, El Paso, Indianapolis, Memphis and Tucson.
The markets that are tightest by historical standards—those whose vacancy rates are more than 150 bps below their respective 1999-2013 averages—include Houston, Portland, Detroit, Denver, Charlotte, Nashville, Columbus, Minneapolis, Cincinnati, Dallas, Cleveland, Dayton, Austin and Seattle. Those experiencing higher vacancy pressure that they have in the past (with current vacancy rates more than 50 bps above their 1999-2013 averages) include Richmond, Newark, Washington, D.C., Tucson, Las Vegas, Norfolk and El Paso.
DEMAND TRENDSNET ABSORPTION SOARS, LED BY SOUTH AND WEST REGIONS
Figure 4: Multifamily Demand Growth for 60 Major Markets
Y-o-Y Change (%)
-6
-5
-4
-3
-2
-1
0
1
3
2
4
2000
2002
2004
2006
2008
2010
2012
2001
2003
2005
2007
2009
2011
2014
2013
Source: CBRE Econometric Advisors, Q2 2014. Historical and current multifamily vacancy and rent data are provided by RealPage Inc.’s MPF Research division.
Total Employment Multifamily Demand
2000
2002
2004
2006
2008
2010
2012
2001
2003
2005
2007
2009
2011
2014
2013
Source: CBRE Econometric Advisors, Q2 2014. Historical and current multifamily vacancy and rent data are provided by RealPage Inc.’s MPF Research division.
Figure 5: Multifamily Vacancy Rate for 60 Major Markets
Y-o-Y Vacancy Change (bps) Vacancy Rate (%)
-150
-100
-50
0
50
100
200
150
250 8
6
4
7
5
3
2
1
0
Year-over-Year Vacancy Change (L) Vacancy Rate (R)

U.S. M
ultifa
mily| M
arketV
iew
4
Q2 2
014
© 2014, CBRE, Inc.
For the U.S., multifamily (5+ units) permits stood at an an-nualized pace of 369,300 units in Q2 2014, versus 360,700 units in Q1 2014, while starts increased to 351,300 units from 311,700 units. Both leading indicators of new construction activity were firmly above their respective 1989-2008 annual averages of 301,000 units for permits and 265,000 units for starts. Given the historical relationship between starts and completions, deliveries are on track to surpass 275,000 units in 2014—up from 2013’s annual pace of 214,000 units. We expect completions to peak and begin to level off in 2015, which will help maintain market stability and keep the national occupancy rate above 94%.
Across the 60 major markets, estimated rentable multifamily completions increased to 69,753 in Q2 2014, from 52,358 units a year earlier. More than half of these completions were concentrated in New York, Houston, Miami, Washington, D.C., Atlanta, Los Angeles, Austin, Dallas, Orlando, Boston
and Seattle. The highest completion rates (percentage growth in rentable multifamily inventory) were in Austin, Raleigh, Nashville, Miami, Orlando, Kansas City, San Jose, El Paso, Portland and Charlotte. The lowest completion rates were in Dayton, Sacramento, Detroit, Providence and Cleveland.
There remains wide variation in new construction activity across markets (see Figure 7). Estimated from permits over the past four quarters, rentable multifamily completions over the next four quarters will be more than 2.5 times their 1989-2008 averages in Newark, San Francisco, Austin, New York, Nashville, Tulsa, Richmond and Norfolk; and 2-2.5 times their 1989-2008 averages in Louisville, San Jose, El Paso, Orange County, Dallas, Boston, Houston, Salt Lake City, Raleigh, Philadelphia and Denver. By contrast, completions are estimated to come in well below their historical norms in Chicago, Cincinnati, Hartford, Sacramento, Detroit, Las Vegas and Dayton.
SUPPLY TRENDSPERMITS AND STARTS EDGE HIGHER
Figure 6: U.S. Multifamily Permits (5+ units) Increase Slightly in Q2 2014
Units (000’s)
0
100
200
400
300
500
1989199
0199
2199
4199
6199
8199
1199
3199
5199
7199
9200
0200
2200
4200
6200
8201
0201
2200
1200
3200
5200
7200
9201
1201
3201
4
Sources: Bureau of the Census and CBRE Econometric Advisors, Q2 2014.
1989 – 2008 Average
Figure 7: Near-Term Supply Pressures Vary Across Markets
Ratio of Multifamily (5+ units) Permits in the Last 4 Quarters to 1989-2008 Average
San FranciscoAustin
New YorkOrange County
DallasBoston
HoustonPhiladelphia
Washington, D.C.Minneapolis
MiamiSeattle
Sum of MarketsLos Angeles
San DiegoTampa
PhoenixAtlantaChicagoDetroit
Sources: Bureau of the Census and CBRE Econometric Advisors, Q2 2014.
0.0 1.0 1.50.5 3.02.0 2.5 3.5

U.S. M
ultifa
mily | M
arketV
iew
5
Q2 2
014
© 2014, CBRE, Inc.
RENT/REVENUE TRENDSRENT GROWTH STRENGTHENS IN MOST MARKETS
The national same-store effective rent index grew at an an-nualized rate of 2.9% in Q2 2014, down slightly from 3.2% in Q1 2014. On a year-over-year basis, the index grew 2.6% from a year earlier (see Figure 8). The New York market was largely responsible for the slightly slower annualized growth in the national rent index. Effective rent growth in New York slowed to an annualized rate of 1.4% in Q2 2014, from 3.6% in Q1 2014. Most markets, however, have reported stronger annualized rent growth compared to the previous quarter, with particularly notable improvements in Washington, D.C., Atlanta, Los Angeles, West Palm Beach, Greenville, Sacramento, Houston, Denver and Ventura, among others (see Figure 9).
Compared to a year ago, the strongest growth (4% or more) in same-store effective rent was reported in Oakland, San Jose, Denver, Portland, San Francisco, Seattle, Miami, Houston, Austin, Atlanta and Nashville. Markets with the slowest year-over-year growth (less than 1%) included Pittsburgh, Las Vegas, Philadelphia, Norfolk, Albuquerque, Washington, D.C., Hartford and El Paso.
Most of the nation’s major markets are firmly in the expan-sion phase of their cycles, with revenues well above their
pre-downturn (2007-2008) peak levels. San Francisco, San Jose, Oakland and Denver lead by a wide margin, followed by Boston, Houston and New York. Smaller markets in which revenues have fared particularly well in this cycle include Portland, Pittsburgh, Louisville, Oklahoma City and Columbus. Greensboro, Phoenix and Tucson are on the verge of transi-tioning from recovery into expansion, while Las Vegas remains the only market lagging significantly in its recovery.
In 2014, most markets are expected to see rent growth that is similar or stronger than last year’s—including Las Vegas, Sacramento, Atlanta, San Jose, Phoenix, Jacksonville, Orlando, New York, Dallas, Denver, Boston, Los Angeles, Houston, Austin and Washington, D.C., among others. Over the next five years, we expect rent and revenue growth to match or slightly exceed historical performance. Revenue growth will exceed historical averages by more than 100 bps per year in Las Vegas, Austin, Atlanta, San Antonio, Phoenix, Kansas City, Detroit, Dallas, Greensboro, Charlotte, Raleigh and Orlando. Markets where revenues are expected to grow notably slower than they have historically include Oakland, San Francisco and San Jose, as they are more likely to moderate after several years of record performance.
Figure 8: National Rent and Revenue Growth Continued to Strengthen in Q2 2014
Y-o-Y Change (%)
0
1
3
2
4
6
5
7
Q1 2011
Q1 2012
Q1 2013
Q1 2014
Q2 2011
Q2 2012
Q2 2013
Q2 2014
Q3 2011
Q3 2012
Q3 2013
Q4 2011
Q4 2012
Q4 2013
Source: CBRE Econometric Advisors, Q2 2014. Historical and current multifamily vacancy and rent data are provided by RealPage Inc.’s MPF Research division.
Same-Store Rent Same-Store Revenue
Figure 9: Slightly Better Rent Growth on Average across Markets
Annualized Change in Same-Store Rent Index (%)
Denver
Houston
Atlanta
Seattle
San Francisco
Miami
Los Angeles
Dallas
Phoenix
San Diego
Boston
U.S. Average
Chicago
New York
Washington, D.C.
-2 2 40 6 8 10
Source: CBRE Econometric Advisors, Q2 2014. Historical and current multifamily vacancy and rent data are provided by RealPage Inc.’s MPF Research division.
Q1 2014 Q2 2014

U.S. M
ultifa
mily| M
arketV
iew
6
Q2 2
014
© 2014, CBRE, Inc.
CAPITAL MARKETSBUYER VALUATION UNDERWRITING TRENDS
Buyer Valuation Underwriting TrendsMultifamily investment activity remained strong in Q2 2014, due to robust market fundamentals and capital availability. High-priced assets in major markets supported further expan-sion into secondary and tertiary markets, while value-add buyers struggled to acquire assets at the right prices. According to an underwriting criteria survey of CBRE professionals (see Figure 10), covering prime assets in 14 key submarkets, buyers valued prime asking rents well above $4 per sq. ft. in Manhattan, San Francisco’s South of Market district, Downtown Boston, West Los Angeles and Washington, D.C.’s West End. Quarter-over-quarter, rents increased in half of the markets tracked, and remained unchanged in five. Only Washington, D.C.’s West End district and Intown Dallas saw slight declines. Average annual rent growth is projected to be 3.6% over 2014-2016, according to buyers, and unlevered IRR targets range from 8% in West Los Angeles to 5.75% in San Francisco’s South of Market district. Going-in cap rates ranged between 3.8% in San Francisco’s South of Market district and 4.8% in Phoenix’s Camelback district. Exit cap rates ranged from 4.25% in Intown Dallas to 5.5% in Chicago’s River North, Houston’s Montrose/Museum District and Phoenix’s
Camelback district. The spread between the going-in cap rate and unlevered target IRR—which averaged 211 bps in Q2 2014—can indicate how aggressive underwriting may be in select markets relative to initial yield, as well as the strength of buyers’ outlooks for a particular market.
Loan-to-Value RatiosMultifamily and commercial loan-to-value (LTV) ratios for permanent, fixed-rate loans converged slightly in Q2 2014 (see Figure 11). The average LTV for commercial loans edged up to 64.2% from 62.8%, while the average multifamily LTV edged down slightly, to 67.7% from 68.3%. Average LTVs for agency and bank loans were 70.7% and 68.7%, respectively. Life company multifamily and commercial loans were un-derwritten more conservatively, with average LTVs registering 59.1%. Since the second half of 2012, commercial LTVs have averaged 64%. Despite a surge in debt availability over this period, average LTVs have remained fairly consistent. During Q2 2014, life company LTVs averaged 57.4%, while banks and conduits offered more-highly leveraged loans, at 69.6% and 71.1%, respectively.
Figure 10: Buyer Valuation Underwriting Survey: Prime/Class A Multifamily Assets
Note: The prime statistics displayed above are an estimate of current buyer underwriting assumptions for the highest quality assets in the best location of a particular market. The quoted prime rents reflect the level at which top-tier relevant transactions are being completed. Estimates are based on the expert opinion of CBRE brokers that handle deals in these particular markets. Source: CBRE Research, Q2 2014.
Market SubmarketMultifamily Subtype
Q2 2014 Prime
Asking Rent ($/SF/PM)
Q2 2014 Average
Annual Rent Growth
Underwrit-ing, First 3 Years (%)
Average Annual Rent
Growth, 2014-16
(EA Base-line) (%)
BPS Spread Between
Rent Growth Underwrit-ing & EA Baseline Forecast
Unlevered IRR Target
(%)
Going-in Cap Rate
(%)
Exit Cap Rate (%)
Holding Period (Years)
BPS Spread Between Going-in
Cap Rate & IRR Target
New York Manhattan High Rise 5.8 3.7 2.8 93 6.5 4 4.5 10 250
San Francisco South of Market Mid Rise 5.5 5 2.8 223 5.75 3.75 4.75 10 200
Boston Downtown High Rise 4.56 3.4 3.4 3 6.5 4.25 4.75 7-10 225
Los Angeles West Los Angeles Mid Rise 4.5 5 3.9 107 7-8 4 5 5-7 350
Washington, D.C. West End High Rise 4.4 1.5 1.1 40 6.5 4.5 5 7 200
Chicago River North High Rise 3.4 3.5 0.8 270 6.5 4.75 5.5 7 175
Seattle Downtown Mid Rise 3.2 4 1.8 223 6 4 5 10 200
Austin Downtown High Rise 3.05 3.8 3.6 17 6 4.25 5 10 175
Houston Montrose/Museum Dist. High Rise 2.83 4 4.1 (7) 6-7 4.5-4.75 5.25-5.5 7-10 ~188
Denver Downtown High Rise 2.65 3 3.3 (27) 6.75 4.7 5.3 7 205
Dallas Intown Dallas High Rise 2.6 3 2.2 80 6-6.25 4.25-4.5 4.25-5 5 ~175
Miami Downtown/Brickell High Rise 2.5 3 3.1 (7) 6-6.5 4-4.5 5-5.25 5-7 ~200
Atlanta Midtown High Rise 2.3 4 4.9 (87) 6.25 4.25-4.5 5.25 7 ~188
Phoenix Camelback Mid Rise 2.05 3.7 5.3 (160) 6.75-7.25 4.75 5.35-5.5 10 ~225
U.S. M
ultifa
mily | M
arketV
iew
7
Q2 2
014
© 2014, CBRE, Inc.
CAPITAL MARKETSINVESTMENT ACTIVITY AND RETURNS
Sales Volume and PricingMultifamily sales volume exceeded $26.0 billion in Q2 2014 for a 39.3% year-over-year gain, the strongest gain among all property types, according to Real Capital Analytics (see Figure 12). Mid/high-rise sales surpassed $9.9 billion, for a 55.5% gain over Q2 2013, while garden property sales of $16.1 bil-lion were up 30.9%. Year-over-year, the average price per unit increased 3.3% to $87,461 for garden properties, and 7.5% to $215,254 for mid/high-rise properties. Over the same period, overall, the price per unit increased 5% to $113,494. Sales activity of $45.6 billion in the first half of 2014 was down 8.9% year-over-year, reflecting the significant Archstone portfolio sales that occurred in Q1 2013. Los Angeles, Manhattan, New York City Boroughs, Dallas and Houston were the five most active markets in terms of sales volume during the first half of 2014—although secondary and tertiary markets saw strong relative growth, partly due to high-priced assets in major markets, and to investors’ search for yield.
The average cap rate compressed further in Q2 2014—to 6.0%, having held at 6.2% for the previous five quarters. Average cap rates were 4.9% for mid/high-rise properties and 6.3% for garden properties; however, both segments saw compression from the prior quarter and from Q2 2013.
Alternatively, cap rates in the six primary markets dipped to 4.9% in Q2 2014, while cap rates in secondary and tertiary markets held steady at 6.6% and 7.2%, respectively.
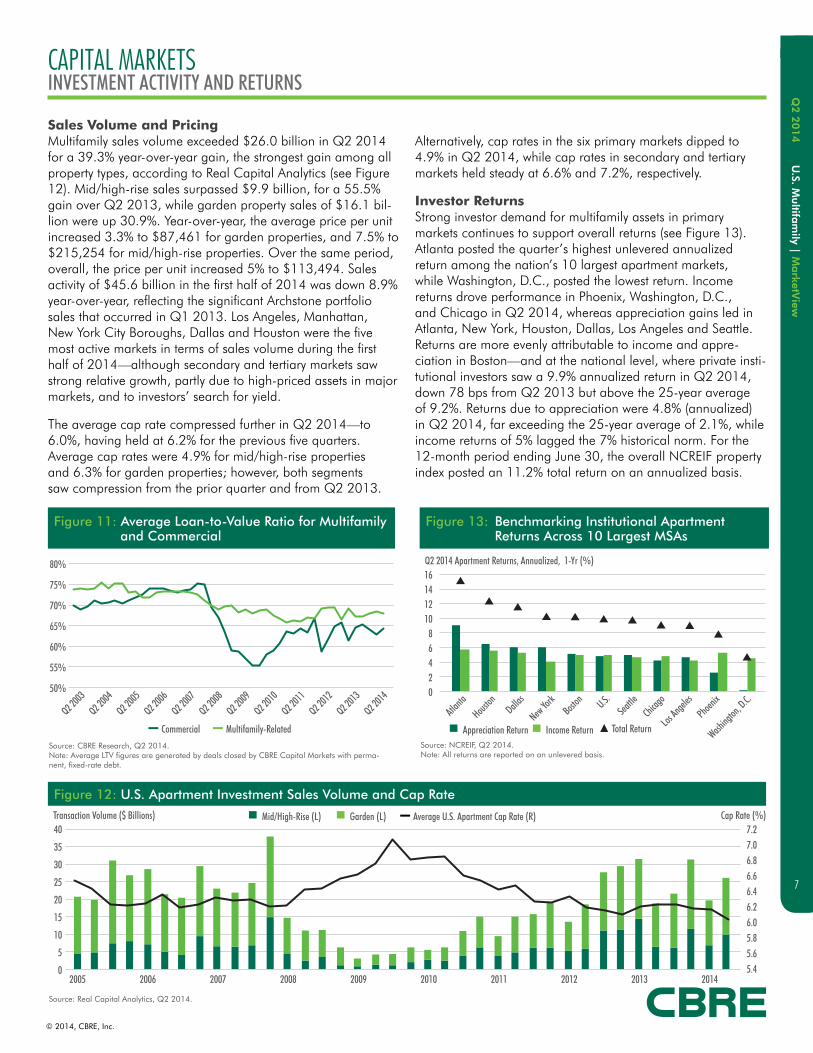
Investor Returns Strong investor demand for multifamily assets in primary markets continues to support overall returns (see Figure 13). Atlanta posted the quarter’s highest unlevered annualized return among the nation’s 10 largest apartment markets, while Washington, D.C., posted the lowest return. Income returns drove performance in Phoenix, Washington, D.C., and Chicago in Q2 2014, whereas appreciation gains led in Atlanta, New York, Houston, Dallas, Los Angeles and Seattle. Returns are more evenly attributable to income and appre-ciation in Boston—and at the national level, where private insti-tutional investors saw a 9.9% annualized return in Q2 2014, down 78 bps from Q2 2013 but above the 25-year average of 9.2%. Returns due to appreciation were 4.8% (annualized) in Q2 2014, far exceeding the 25-year average of 2.1%, while income returns of 5% lagged the 7% historical norm. For the 12-month period ending June 30, the overall NCREIF property index posted an 11.2% total return on an annualized basis.
Figure 11: Average Loan-to-Value Ratio for Multifamily and Commercial
50%
60%
55%
65%
75%
70%
80%
Q2 2003
Q2 2005
Q2 2007
Q2 2004
Q2 2006
Q2 2008
Q2 2009
Q2 2010
Q2 2011
Q2 2012
Q2 2013
Q2 2014
Source: CBRE Research, Q2 2014. Note: Average LTV figures are generated by deals closed by CBRE Capital Markets with perma-nent, fixed-rate debt.
Commercial Multifamily-Related
Figure 12: U.S. Apartment Investment Sales Volume and Cap Rate
0
15
20
5
10
25
35
30
40 7.2
6.8
5.85.65.4
6.4
7.0
6.0
6.6
6.2
2005
Transaction Volume ($ Billions) Cap Rate (%)
2007 2009 2011 20132006 2008 2010 2012 2014
Source: Real Capital Analytics, Q2 2014.
Mid/High-Rise (L) Garden (L) Average U.S. Apartment Cap Rate (R)
Figure 13: Benchmarking Institutional Apartment Returns Across 10 Largest MSAs
0
4
8
2
6
10
1412
16Q2 2014 Apartment Returns, Annualized, 1-Yr (%)
Washing
ton, D.C.
Phoenix
Los Ange
les
Chicag
oSea
ttleU.S.Bost
on
New Yo
rkDalla
s
Houston
Atlanta
Source: NCREIF, Q2 2014.Note: All returns are reported on an unlevered basis.
Appreciation Return Income Return Total Return

U.S. M
ultifa
mily| M
arketV
iew
8
Q2 2
014
© 2014, CBRE, Inc.
MARKET SPOTLIGHT: HOUSTONSTRONG POPULATION AND EMPLOYMENT GROWTH SUPPORT RECORD RENT INFLATION
Exceptional employment and population growth have bolstered apartment demand in Houston through the first half of 2014. In 2013, Houston led the nation in population growth, adding nearly 140,000 residents. Over the past 10 years, the metro’s population has increased by more than 100,000 people per year, with nearly half of the increase attributed to net migra-tion. Houston has gained more than 370,000 jobs since its late-2009 recessionary low—more than double the number of jobs lost in the recession. This growth has driven apartment net absorption in excess of 10,000 units per year since 2011. Over the four quarters ending Q2 2014, Houston registered positive net absorption of 21,394 units—the highest figure for the period among the 50 largest U.S. markets, and the highest figure for Houston in nearly a decade.
The supply of apartments has not kept pace with the rapid growth of demand, resulting in diminished vacancy and record rent growth. Following the recent recession, construction activity was subdued for a number of years, with completions of rentable units dropping from more than 15,000 in 2009 to less than 5,000 in 2010 and 2011. With supply temporarily limited, gains in population and employment have lowered apartment vacancy in Houston to 5.1% as of Q2 2014, the market’s lowest quarterly rate since Q4 2001. Vacancy declined 80 bps year-over-year and 110 bps quarter-over-quarter, after having increased slightly in Q1 2014.
Houston’s apartment rents are currently growing at the fastest pace on record (see Figure 14). As of Q2 2014, the
Figure 14: Houston Rent Growth vs. Vacancy Rate
2.0
1.5
1.0
0.5
0.0
-1.5
-1.0
-0.5
14
10
0
6
12
2
8
4
Q4 2004
Q4 2005
Q4 2006
Q4 2007
Q4 2008
Q4 2009
Q4 2010
Q4 2011
Q4 2012
Q4 2013
Q4 2014
Q4 2015
Q2 2004
Q2 2005
Q2 2006
Q2 2007
Q2 2008
Q2 2009
Q2 2010
Q2 2011
Q2 2012
Q2 2013
Q2 2014
Q2 2015
Rent Inflation (%) Vacancy Rate (%)
Forecast
Source: CBRE Econometric Advisors, Q2 2014.Historical and current multifamily vacancy and rent data are provided by RealPage Inc.’s MPF Research division.
Rent Inflation (L) Vacancy Rate (R)

U.S. M
ultifa
mily | M
arketV
iew
9
Q2 2
014
© 2014, CBRE, Inc.
Figure 15: Houston Multifamily Completions vs. Net Absorption
47Units (000’s)
37
27
17
7
42
32
22
12
2-3
2004 2008 20122006 2010 2014
Forecast
2005 2009 20132007 2011 2015
Source: CBRE Econometric Advisors, Q2 2014.Historical and current multifamily vacancy and rent data are provided by RealPage Inc.’s MPF Research division.
Rentable Completions (Units) Net Absorption (Units)
Figure 16: Houston Multifamily Sales Volume
6,000
5,000
4,000
3,000
2,000
1,000
0
Sales Volume ($ Millions)
Q1 2009
Q1 2010
Q1 2011
Q1 2012
Q1 2013
Q1 2014
Q2 2009
Q2 2010
Q2 2011
Q2 2012
Q2 2013
Q2 2014
Q3 2009
Q3 2010
Q3 2011
Q3 2012
Q3 2013
Q4 2009
Q4 2010
Q4 2011
Q4 2012
Q4 2013
Source: Real Capital Analytics, Q2 2014.
Quarterly Volume Rolling 12-Month Total
same-store rent index for Houston increased by 4.9% year-over-year and 1.4% quarter-over-quarter, the fastest annual and quarterly growth rates since the beginning of the historical data series in 1994.
Construction activity has increased since completions hit a post-recession low in 2011, with a little over 8,000 units completed in 2012, roughly 15,000 completed in 2013 and nearly 18,000 units expected in 2014. Strong demand and rent growth will continue to drive construction over the next several quarters, with rentable completions forecast to increase to more than 18,300 units in 2015 (see Figure 15). With the
additional supply, rent growth is expected to moderate slightly in the coming quarters.
According to Real Capital Analytics, Houston posted $1.2 billion in multifamily sales in Q2 2014—a gain of 48% from Q1 2014, but a year-over-year loss of 4% (see Figure 16). Due to an active fourth quarter in 2013, 12-month total sales activity increased by 25.1% year-over-year, to $4.8 billion. The average price per unit in Q2 2014 stood at $93,784, which was down 5.4% quarter-over-quarter, but up 1.6% year-over-year. The decline in the average price per unit is consistent with a recent increase in sales of older assets, and assets in suburban submarkets.
MARKET SPOTLIGHT: HOUSTONSTRONG POPULATION AND EMPLOYMENT GROWTH SUPPORT RECORD RENT INFLATION

U.S. M
ultifa
mily| M
arketV
iew
10
Q2 2
014
© 2014, CBRE, Inc.
Across the 60 markets, total employment gained 1.5 million jobs, or 2%, in 2013; and the forecast calls for 1.4 million, or 1.8%, to be added in 2014. While job growth in 2014 will taper slightly compared to 2013, steady growth in broad rental demand will allow net absorption to improve from 208,902 units in 2013 to 217,884 units in 2014. As a result, the vacancy rate is expected to edge down from 4.8% in 2013 to 4.7% in 2014, with effective rent growth improving from 2.3% to 3.1% over the same period (see Figure 17).
The longer-term outlook calls for robust growth in multifamily demand, averaging more than 200,000 units per year over the next five years, compared to 170,000 units per year historically. With new supply moderating after 2015, the national market should remain balanced, with the average vacancy rate staying near its historical norm of 5.3% over the forecast horizon.
Real (inflation-adjusted) revenue growth is projected to aver-age 0.3% per year over 2015-2019—slower than 2014, but similar to its historical performance. While apartment rent and revenues are expected to grow slightly above consumer price inflation and above their historical rates over the next
five years, they still will only be returning to long-term norms in many markets, as measured in real (inflation-adjusted) rent and revenue levels. Our analysis suggests that markets in the South and West are positioned particularly well to achieve revenue growth that would be notably stronger than historic rates, particularly in areas with robust demographic and employ-ment trends, such as Las Vegas, Austin, Atlanta, Tucson, San Antonio, Salt Lake City, Tulsa, Phoenix, Birmingham, Dallas, Greensboro, Charlotte, Raleigh, Orlando and Sacramento.
The demographics of rental demand—which includes rapid growth in single-person households and households under the age of 34 and over the age of 64—will keep multifamily fundamentals strong beyond the immediate horizon. Assuming steady recovery in employment and home prices, growth in multifamily demand should suffice to keep the vacancy rate stable—as long as new completions begin to moderate after 2015. At the same time, if lending for home purchases re-mains constrained, there is potential for stronger-than-expected growth in rental demand, occupancy and rent growth over the next 12-18 months.
MARKET OUTLOOKSTRONGER RENT GROWTH IN THE NEAR TERM
2005 2009 20132007 2011 2015 20172006 2010 20142008 2012 2016
Forecast
2018
Source: CBRE Econometric Advisors, Q2 2014. Historical and current multifamily vacancy and rent data are provided by RealPage Inc.’s MPF Research division.
Figure 17: National Rent Growth Strengthens in 2014
Y-o-Y Change (%)
-6
-4
-2
0
2
4
6
Consumer Price Index (CPI) Same-Store Effective Rent Index

U.S. M
ultifa
mily | M
arketV
iew
11
Q2 2
014
© 2014, CBRE, Inc.
Figure 18: Multifamily Fundamentals for the 50 Largest U.S. Markets, Q2 2014
* National figures include the sum of 60 markets. Source: CBRE Econometric Advisors, Q2 2014. Historical and current multifamily vacancy and rent data are provided by RealPage Inc.’s MPF Research division.
Inventory Rank MarketVacancy Rate Q2 2014 (%)
Vacancy Rate Y-o-Y (bps)
Net Absorption Last 4 Quarters (Units)
Rent per Unit Q2 2014 ($) Y-o-Y Rent Change (%)
1 New York 5.3 20 12,942 2,534 1.4
2 Los Angeles 3.3 -40 12,618 1,735 3.2
3 Chicago 4.1 40 797 1,293 2.1
4 Houston 5.1 -80 21,394 939 4.9
5 Washington, D.C. 4.4 0 11,209 1,559 0.0
6 Dallas 4.9 -40 14,076 910 3.6
7 Boston 2.7 -30 7,038 1,732 2.8
8 Atlanta 6.3 -100 11,386 891 4.3
9 Phoenix 6.1 -70 6,938 795 3.0
10 Seattle 3.1 -30 9,729 1,243 5.8
11 San Diego 3.2 -20 4,345 1,514 3.8
12 Philadelphia 4.3 -70 5,173 1,175 0.8
13 Denver 3.5 -20 9,248 1,116 7.4
14 Miami 2.5 0 6,338 1,234 5.2
15 Detroit 3.7 -10 696 822 2.4
16 Minneapolis 2.5 30 5,952 1,035 2.2
17 Orange County 3.5 -80 5,589 1,662 3.6
18 San Francisco 3.2 10 5,028 2,639 6.5
19 Tampa 4.5 -70 7,099 915 2.2
20 Oakland 2.2 -60 4,164 1,726 8.3
21 Austin 4.1 -30 12,274 1,040 4.4
22 Baltimore 4.3 10 2,013 1,209 1.6
23 Orlando 4.2 -60 7,302 927 2.3
24 Las Vegas 6.5 -90 3,085 750 0.9
25 Riverside 3.8 -140 4,759 1,129 2.7
26 Portland 2.3 -70 6,737 1,022 6.6
27 Fort Lauderdale 3.7 -110 4,458 1,277 3.3
28 Fort Worth 5.4 -50 3,964 798 3.8
29 Cleveland 3.2 -100 2,014 799 2.1
30 San Antonio 6.4 60 2,091 833 1.8
31 Newark 2.6 0 2,179 1,381 2.6
32 Cincinnati 4.5 40 421 803 2.0
33 San Jose 2.4 -50 5,535 2,191 7.6
34 Sacramento 3.3 -150 2,786 1,026 3.4
35 Columbus 3.3 -60 4,647 769 2.1
36 Indianapolis 6.7 -30 1,623 758 2.1
37 St. Louis 5.5 -140 3,582 797 2.4
38 Pittsburgh 3.0 0 608 1,027 0.9
39 Kansas City 5.2 -20 3,003 798 2.2
40 Charlotte 4.5 10 4,841 882 2.5
41 Nashville 3.5 -60 3,811 924 4.2
42 Raleigh 4.9 30 7,177 912 1.5
43 Edison 3.1 20 1,515 1,322 2.2
44 Norfolk 5.8 50 1,808 959 0.3
45 Providence 2.7 -10 329 1,196 1.2
46 West Palm Beach 3.8 -70 2,505 1,248 3.9
47 Jacksonville 5.7 -150 5,083 822 1.4
48 Memphis 7.4 10 619 750 2.1
49 Hartford 3.8 30 174 1,148 -0.1
50 Salt Lake City 4.6 50 1,586 842 2.4
National* 4.4 -20 276,200 1,380 2.6
U.S. M
ultifa
mily| M
arketV
iew
12
Q2 2
014
© 2014, CBRE, Inc.
GLOBAL RESEARCH AND CONSULTING This report was prepared by the CBRE U.S. Research Team which forms part of CBRE Global Research and Consulting – a network of preeminent researchers and consultants who collaborate to provide real estate market research, econometric forecasting and consulting solutions to real estate investors and occupiers around the globe.
Additional U.S. research produced by Global Research and Consulting can be found at www.cbre.us/research.
DISCLAIMER
Information contained herein, including projections, has been obtained from sources believed to be reliable. While we do not doubt its accuracy, we
have not verified it and make no guarantee, warranty or representation about it. It is your responsibility to confirm independently its accuracy and
completeness. This information is presented exclusively for use by CBRE clients and professionals and all rights to the material are reserved and cannot be
reproduced without prior written permission of CBRE.
For more information about this U.S. Multifamily MarketView, please contact:
Peter Donovan Senior Managing Director Capital Markets, Multifamily CBRE t: +1 617 217 6035 e: [email protected]
Brian McAuliffe Senior Managing Director Capital Markets, Multifamily CBRE t: +1 312 935 1891 e: [email protected]
Colleen Pentland Lally Director, Capital Markets Operations Capital Markets, Multifamily CBRE t: +1 617 217 6041 e: [email protected]
Gleb Nechayev Senior Managing Economist Econometric Advisors t: +1 617 912 5245 e: [email protected]
Jessica Ostermick Director, Research and Analysis CBRE Research t: +1 720 528 6338 e: [email protected]
Quinn Eddins Director, Research and Analysis CBRE Research t: +1 305 428 6325 e: [email protected]
FOLLOW CBRE
CONTACTS