u.s. multifamily housing: a primer for offshore...
TRANSCRIPT

U.S. MULTIFAMILY HOUSING: A Primer for Offshore Investors

WHAT IS U.S. MULTIFAMILY?
CLASS A: Generally a core asset. Newly constructed or fully renovated, which is well-located with high-end finishes and fixtures, and full spectrum of amenities.
CLASS B: Positioned somewhat lower than Class A. Potentially a combination of any of the following factors: age, inferior location, limited amenities, deferred maintenance, basic fixtures and finishes. Generally a value add strategy of varying degree.
CLASS C: Inferior age and/or location with original/outdated/low-end finishes and fixtures, and possible deferred maintenance and/or substandard management, possible value add or an opportunistic strategy.
Multifamily housing is a type of residential structure with more than one dwelling residence in the same building.
GARDEN/ SUBURBAN
HIGH-RISE/URBAN INFILL
MID-RISE
MIXED-USE
TYPES AND CLASSES OF U.S. MULTIFAMILY INVESTMENT OPPORTUNITIES
CORE: Stabilized real estate. Typically new assets in top quality locations. Tend to be the lowest yielding, institutional quality assets.
CORE PLUS: Similar to core, but with a small value add component and/or less favorable location to the investment. Should trade with a slightly higher yield.
VALUE ADD: Most tend to be older assets requiring varying degrees of renovation, whether it be repairing deferred maintenance or upgrading the interiors to take advantage of raising rents, or mis-managed assets requiring repositioning.
OPPORTUNISTIC: Can be a more comprehensive value add with significant asset repositioning and higher risk. Can be new construction or redevelopment.
CBRE | U.S. Multifamily Housing: A Primer for Offshore Investors 2

WHAT IS U.S. MULTIFAMILY?
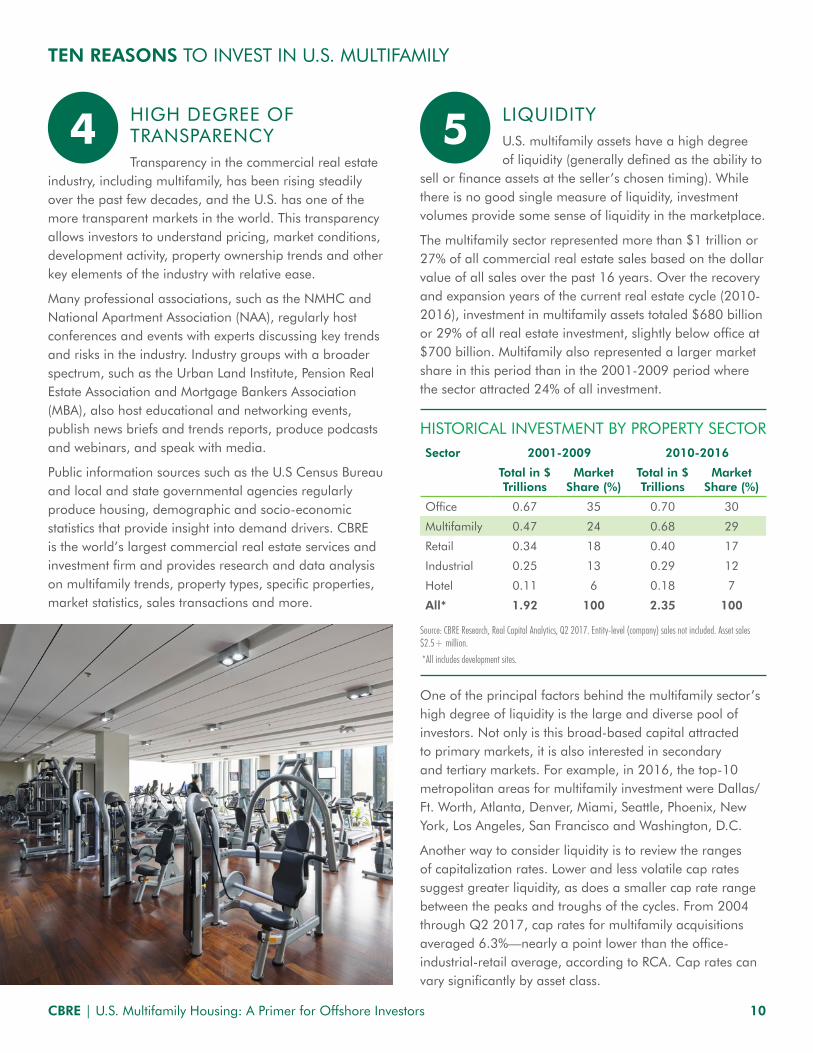
CORE MULTIFAMILY CHARACTERISTICS
• Secure-Access Structured Parking Garage
• Reserved Parking Available
• Elevators
• Climate-Controlled Corridors
• Resort-Style Swimming Pool
• Large Sundeck with Luxury Loungers
• Outdoor Fireplace
• Outdoor Grills/Cooking Areas
• Superior Quality Fitness Studio with TVs
• Cardio Spin/Yoga Room
• Resident Lounge
• Game/Technology Room
• Cyber Cafe/Kitchen Area
• Covered Outdoor Social Area (with TV/Sound System)
• Personal Lockers in Fitness Center
• On-Site Dry Cleaning Pick-up
COMMON AMENITIES AND SERVICES
TYPICAL FLOOR PLANS
45 THE RIALTOTRPROPERTY DESCR I P T ION
A11 BR/1 BA 839 - 1,104 SF75 units
A21 BR/1 BA 1,080 SF4 units
FLOOR PLANS
47 THE RIALTOTRPROPERTY DESCR I P T ION
B22 BR/2 BA 1,275 SF20 units
B32 BR/2 BA 1,932 SF9 units
FLOOR PLANS
1 BR/1 BA765 SF71 square meters
2 BR/2 BA980 SF91 square meters
CBRE | U.S. Multifamily Housing: A Primer for Offshore Investors 3

U.S. MULTIFAMILY SECTOR OVERVIEW
SIZE OF THE MARKETMultifamily* rental housing is a common form of housing in the U.S., especially in urban areas, with most of these assets renter-occupied. The multifamily sector includes 14.5 million units across the 62 largest metro markets in the U.S. (population > 1 million).
The portion of the multifamily sector that is of most interest to domestic and international investors is professionally managed rental communities with at least 150 units. The National Multifamily Housing Council (NMHC) estimates that the total value of U.S. multifamily rental properties is more than $3.3 trillion.
OWNERSHIPReal Capital Analytics (RCA) divides commercial real estate owners into four major groups: institutional, public companies (predominantly publicly traded REITs), private buyers and international (all types of companies). Private buyers own 68% of the multifamily market (based on value). These buyers include entities of all sizes, businesses and domestic and international capital partners, and high net-worth firms and developers, primarily focused on individual metros or regions within the U.S.
Institutional ownership of multifamily assets has been rising over the past few decades, and this trend is expected to continue. For example, 25 years ago, multifamily assets represented only 11% of the NCREIF Property Index; retail, office and industrial all had substantially higher market shares. Today the multifamily sector represents 24% of the total and is second only to office for total market value. Institutional owners include investment managers, pension funds, equity funds, insurance companies and sovereign wealth funds (SWFs). The majority of multifamily assets in the U.S. are owned by domestic privately held companies. Currently only about 4% of multifamily holdings are owned by non-U.S. companies.
In the past few years, direct investment by offshore investors of all types (from large SWFs to high net-worth individuals) has averaged approximately 6% of the total. International investors are very active in the sector indirectly through investment funds, REIT stock purchases and equity investment in companies.
*Multifamily (also referred to as apartments) refers to rental housing properties with at least five units.
**According to recent study by NMHC and MBA
Source: CBRE Research, NCREIF, Q3 2017. Based on total market value.
Source: CBRE Research, Real Capital Analytics, Q2 2017. Based on RCA estimated dollar value.
MULTIFAMILY OWNERSHIP BY INVESTOR TYPE
MULTIFAMILY MARKET SHARE IN NCREIF PROPERTY INDEX
68% Private
17% Institutional
8% Public
Companies
4% Cross-Border
3% Other
>14.6MTotal Units
4.6M OR 325K ANNUALLYUnits Needed by 2030**
MultifamilyMarketShareinNCREIFPropertyIndex19923 Q31992 11.04 11.04%19924 Q41992 11.42 11.42%19931 Q11993 11.71 11.71%19932 Q21993 11.92 11.92%19933 Q31993 11.53 11.53%19934 Q41993 11.67 11.67%19941 Q11994 12.40 12.40%19942 Q21994 12.32 12.32%19943 Q31994 12.42 12.42%19944 Q41994 12.91 12.91%19951 Q11995 13.11 13.11%19952 Q21995 13.60 13.60%19953 Q31995 13.81 13.81%19954 Q41995 13.96 13.96%19961 Q11996 13.95 13.95%19962 Q21996 14.62 14.62%19963 Q31996 14.66 14.66%19964 Q41996 14.50 14.50%19971 Q11997 15.00 15.00% Source:CBREResearch,NCREIF,Q32017.Basedontotalmarketvalue.19972 Q21997 14.78 14.78%19973 Q31997 15.43 15.43%19974 Q41997 14.55 14.55%19981 Q11998 15.05 15.05%19982 Q21998 15.78 15.78%19983 Q31998 15.40 15.40%19984 Q41998 16.06 16.06%19991 Q11999 16.19 16.19%19992 Q21999 16.04 16.04%19993 Q31999 15.89 15.89%19994 Q41999 16.46 16.46%20001 Q12000 16.91 16.91%20002 Q22000 17.49 17.49%20003 Q32000 17.60 17.60%20004 Q42000 18.03 18.03%20011 Q12001 18.30 18.30%
0
5
10
15
20
25
30
Q3 1992 Q3 1997 Q3 2002 Q3 2007 Q3 2012 Q3 2017
(%)
CBRE | U.S. Multifamily Housing: A Primer for Offshore Investors 4

TEN REASONS TO INVEST IN U.S. MULTIFAMILY
CBRE | U.S. Multifamily Housing: A Primer for Offshore Investors 5

Multifamily investment returns are favorableFigure 3: Institutional Multifamily Returns TDD(11/13/2017):UpdatedChartforQ3
HistoricalTotal Appreciation Income Rank Total Appreciation Income
2000 12.25 3.46 8.58 12.99 4.41 8.312001 7.28 -1.31 8.67 9.37 1.23 8.072002 6.75 -1.58 8.42 8.76 1.57 7.112003 9.00 0.97 7.97 8.90 2.44 6.352004 14.49 6.66 7.46 13.04 6.66 6.082005 20.06 12.68 6.75 21.15 14.85 5.692006 16.60 9.92 6.22 14.63 8.89 5.392007 15.85 9.88 5.56 11.36 6.42 4.712008 -6.46 -11.15 5.13 -7.29 -11.37 4.452009 -16.85 -21.98 6.17 -17.51 -21.94 5.332010 13.11 6.05 6.76 18.21 11.77 5.932011 14.26 7.80 6.11 15.45 9.60 5.472012 10.54 4.51 5.84 2 11.23 5.64 5.362013 10.98 5.16 5.61 3 10.42 5.06 5.16 2010-15 avg2014 11.82 6.21 5.36 5 10.29 5.17 4.942015 13.33 8.03 5.01 5 11.99 6.99 4.75 12.34 12.932016 7.97 3.10 4.76 3 7.33 2.64 4.60
Q3 2017 6.22 1.71 4.45
Source: CBRE Research, NCREIF, Q3 2017. All returns are reported on an unlevered basis. Q3 2017 represents the four quarters ending Q3 2017.
All Property Sectors Apartments
-24
-16
-8
0
8
16
24
2000 2001 2002 2003 2004 2005 2006 2007 2008 2009 2010 2011 2012 2013 2014 2015 2016 Q3 2017
Appreciation Income (%)
ATTRACTIVE, RISK-ADJUSTED RETURNS AND RELATIVELY LOW VOLATILITYMultifamily is less impacted by cyclical downturns than other property
types. It was the first sector to recover from the 2008 recession and has achieved superior returns through the recovery and expansion phases. The 2010-2016 average return was 12.1%, based on data from the National Council of Real Estate Investment Fiduciaries (NCREIF). In 2016 and 2017, the annual investment returns reflect the maturity of the sector, yet the income components remain healthy at 4.5%.
Over the past 25 years, multifamily investment has had the highest average returns of any commercial real estate asset class. The 9.8% average annual return is slightly ahead of industrial, and more than 100 basis points greater than office.
Multifamily can be considered a “defensive play”. Using standard deviation as a measure of volatility over the 25-year period, retail and multifamily had the lowest levels of volatility in return performance.
TEN REASONS TO INVEST IN U.S. MULTIFAMILY
1
MULTIFAMILY INSTITUTIONAL INVESTMENT RETURNS
AVERAGE ANNUAL RETURN AND STANDARD DEVIATION BY PROPERTY TYPE
Source: CBRE Research, NCREIF, Q3 2017. All returns are reported on an unlevered basis. Q3 2017 represents the four quarters ending Q3 2017.
Source: CBRE Research, NCREIF, Q3 2017. Based on trailing four-quarter total returns from Q3 1992 through Q3 2017.
SectorAverage Total
Return (%)Standard
Deviation (%)
Multifamily 9.75 7.75
Hotel 9.61 8.36
Industrial 9.57 11.03
Retail 9.44 7.38
Office 8.38 9.64
Q3 2017
Multifamily institutional investment returns
HistoricalTotal Appreciation Income Rank Total Appreciation Income
2000 12.25 3.46 8.58 12.99 4.41 8.312001 7.28 -1.31 8.67 9.37 1.23 8.072002 6.75 -1.58 8.42 8.76 1.57 7.112003 9.00 0.97 7.97 8.90 2.44 6.352004 14.49 6.66 7.46 13.04 6.66 6.082005 20.06 12.68 6.75 21.15 14.85 5.692006 16.60 9.92 6.22 14.63 8.89 5.392007 15.85 9.88 5.56 11.36 6.42 4.712008 -6.46 -11.15 5.13 -7.29 -11.37 4.452009 -16.85 -21.98 6.17 -17.51 -21.94 5.332010 13.11 6.05 6.76 18.21 11.77 5.932011 14.26 7.80 6.11 15.45 9.60 5.472012 10.54 4.51 5.84 2 11.23 5.64 5.362013 10.98 5.16 5.61 3 10.42 5.06 5.16 2010-15 avg2014 11.82 6.21 5.36 5 10.29 5.17 4.942015 13.33 8.03 5.01 5 11.99 6.99 4.75 12.34 12.932016 7.97 3.10 4.76 3 7.33 2.64 4.60
Q1 2017 7.27 2.45 4.73 6.73 2.10 4.56
Source: CBRE Research, NCREIF, Q1 2017. All returns are reported on an unlevered basis. Q1 2017 represents the four quarters ending Q1 2017.
All Property Sectors Apartments
-24
-16
-8
0
8
16
24
2000 2001 2002 2003 2004 2005 2006 2007 2008 2009 2010 2011 2012 2013 2014 2015 2016 Q1 2017
Appreciation Income (%)
CBRE | U.S. Multifamily Housing: A Primer for Offshore Investors 6

HEALTHY DEMAND AND FAVORABLE DEMOGRAPHIC OUTLOOKDemand for multifamily housing has been robust in the past several years. From mid-2012 through Q2 2017, net absorption—the measure of demand—totaled 948,445 units or about 189,689 per year
(based on the 62 major markets tracked by CBRE Econometric Advisors). This total represents a healthy 7.3% increase to total multifamily demand over the five-year period. The high level of demand is due to a combination of cyclical and secular trends.
DEMOGRAPHICS FAVOR RENTER DEMAND
For the large U.S. millennial population (ages 22 to 37) renting is the most common form of housing. There are 71 million in this generation, and the average number of people for each age is 4.5 million. The average is 10% higher than the 4.1 million averages for both the preceding generation (Gen X) and the generation following the millennials (Gen Z). The homeownership rate among 25 to 29-year-olds was 31% in 2016 and 45% for 30 to 34-year-olds—levels that are well below the national average of 64%.
While millennials are reaching life stages in which homebuying typically accelerates, unlike previous generations, they are slowly moving into homeownership. Millennials are delaying marriage and starting families—traditionally, trigger points for buying a home. The average age of first marriage in the U.S. has risen to 29.5 years for men and 27.4 for women, both up two years from a decade ago. For the first time in history, the birthrate for women for ages 30 to 34 was higher than the rate for women aged 25 to 29.
BARRIERS TO HOMEOWNERSHIP
Homeownership is financially out of reach for many multifamily residents. Although interest rates have remained relatively low, the cost of home ownership has increased as home values have been steadily climbing in recent years. Over the past five years (2012-2016), annual increases of the median sales price averaged 7.1%. The most recent (September 2017) monthly median figure of $245,100 represents a 4.2% year-over-year increase.
Few moderately priced homes are being built. Over the past several years through the recovery and expansion, homebuilding has been rising, but the volume is still below the prior peak levels and the activity remains concentrated in the “move-up” market. The U.S. Census Bureau reports that the median price of a new single-family home in August 2017 was $313,000. Homebuilders are trying to move into lower price ranges, but rising land and construction costs, and a more restrictive regulatory environment creates significant obstacles.
The mortgage application process remains challenging and higher credit standards limit home buying. Total single-family loan origination volume is down by more than one-third since Q1 2007. The near-term outlook is for continued tight mortgage credit standards.
Renters also struggle with saving for down payments. The NAR’s 2016 Profile of Home Buyers and Sellers reports that down payments averaged 10% in 2016. The challenge of saving enough money for a down payment on a house is not a new phenomenon, but seems more difficult for millennials; many of whom are saddled with student loan payments.
U.S. HOME OWNERSHIP RATES AND RENTER HOUSEHOLDS
Source: CBRE Research, U.S. Census Bureau (CPS/HVS), Q1 2017.
TEN REASONS TO INVEST IN U.S. MULTIFAMILY
2
CBRE | U.S. Multifamily Housing: A Primer for Offshore Investors 7

CHANGING ATTITUDES AND PREFERENCES TOWARDS RENTING
Many younger and older adults prefer the flexibility that renting offers for geographic mobility, flexibility to change residences when new job opportunities arise, or when other reasons dictate intra-city or inter-city moves. Compared to previous generations, renting an apartment is far more socially acceptable, especially after a professional career has been established.
The appeal of urban living has been a huge positive force for multifamily demand. Over the past two decades, the urban cores of U.S. cities (downtowns and surrounding neighborhoods) have become increasingly popular as places to live, work and play. This urban renaissance has attracted multifamily development, presenting new residential choices for the increasing number of people who desire and can afford the urban lifestyle.
The reviving urban cores are attractive to people of all ages. Some older households—particularly the baby boomers (aged 52 to 70)—are moving back into the cities, especially when they no longer need a large house in the suburbs. The availability of for-sale multifamily housing (condominiums) is relatively limited in most U.S. cities. For urban living, the predominant housing choice is multifamily rental. Demand for multifamily housing from baby boomers as well as Gen Xers (age 38 to 51) is expected to rise significantly over the next decade.
While urban core submarkets are likely to attract the largest portion of the older households, some of the demand will be generated for suburban multifamily as well. The rising demand from older households will likely drive design changes to new product with new communities offering larger units and amenities catering to former homeowners.
Commercial real estate investment will always be influenced by economic cycles, however multifamily housing is typically impacted less than other property types in a downturn. People need housing no matter the condition of the economy. Homeownership rates could slightly rise from the current 64% as millennials move into life stages that favor homeownership. Near-term increases will likely be modest, and the homeownership level is not expected to return to its prior peak (69% in 2006) in the near future.
New technologies are driving significant changes across the economy; the multifamily sector is relatively immune from the long list of potential disruptors.
TEN REASONS TO INVEST IN U.S. MULTIFAMILY
CBRE | U.S. Multifamily Housing: A Primer for Offshore Investors 8

FAVORABLE REGULATORY ENVIRONMENTThe U.S. has a relatively landlord-friendly regulatory
environment. While many governmental regulations exist, especially at the local and state level that protect apartment renters’ health, safety and tenure rights, most multifamily properties are owned and operated without restrictions on rents. There are some exceptions, including metros with rent control (principally city laws limiting rent increases). New York City is one of these metros, and the laws can be complicated. In cities where there are no rent controls, market dynamics and operator skill dictate rents.
With respect to “social” housing, the U.S. has a lower level of subsidized/low-income inventory than many other countries. These properties require additional expertise on the regulatory environment, but represent only a small portion of the total inventory (estimated 5% to 10%).
3
TEN REASONS TO INVEST IN U.S. MULTIFAMILY
9CBRE | U.S. Multifamily Housing: A Primer for Offshore Investors
HIGH DEGREE OF TRANSPARENCYTransparency in the commercial real estate
industry, including multifamily, has been rising steadily over the past few decades, and the U.S. has one of the more transparent markets in the world. This transparency allows investors to understand pricing, market conditions, development activity, property ownership trends and other key elements of the industry with relative ease.
Many professional associations, such as the NMHC and National Apartment Association (NAA), regularly host conferences and events with experts discussing key trends and risks in the industry. Industry groups with a broader spectrum, such as the Urban Land Institute, Pension Real Estate Association and Mortgage Bankers Association (MBA), also host educational and networking events, publish news briefs and trends reports, produce podcasts and webinars, and speak with media.
Public information sources such as the U.S Census Bureau and local and state governmental agencies regularly produce housing, demographic and socio-economic statistics that provide insight into demand drivers. CBRE is the world’s largest commercial real estate services and investment firm and provides research and data analysis on multifamily trends, property types, specific properties, market statistics, sales transactions and more.
4
TEN REASONS TO INVEST IN U.S. MULTIFAMILY
LIQUIDITYU.S. multifamily assets have a high degree of liquidity (generally defined as the ability to
sell or finance assets at the seller’s chosen timing). While there is no good single measure of liquidity, investment volumes provide some sense of liquidity in the marketplace.
The multifamily sector represented more than $1 trillion or 27% of all commercial real estate sales based on the dollar value of all sales over the past 16 years. Over the recovery and expansion years of the current real estate cycle (2010-2016), investment in multifamily assets totaled $680 billion or 29% of all real estate investment, slightly below office at $700 billion. Multifamily also represented a larger market share in this period than in the 2001-2009 period where the sector attracted 24% of all investment.
One of the principal factors behind the multifamily sector’s high degree of liquidity is the large and diverse pool of investors. Not only is this broad-based capital attracted to primary markets, it is also interested in secondary and tertiary markets. For example, in 2016, the top-10 metropolitan areas for multifamily investment were Dallas/Ft. Worth, Atlanta, Denver, Miami, Seattle, Phoenix, New York, Los Angeles, San Francisco and Washington, D.C.
Another way to consider liquidity is to review the ranges of capitalization rates. Lower and less volatile cap rates suggest greater liquidity, as does a smaller cap rate range between the peaks and troughs of the cycles. From 2004 through Q2 2017, cap rates for multifamily acquisitions averaged 6.3%—nearly a point lower than the office-industrial-retail average, according to RCA. Cap rates can vary significantly by asset class.
5
HISTORICAL INVESTMENT BY PROPERTY SECTOR
Source: CBRE Research, Real Capital Analytics, Q2 2017. Entity-level (company) sales not included. Asset sales $2.5+ million.
*All includes development sites.
Sector 2001-2009 2010-2016
Total in $ Trillions
Market Share (%)
Total in $ Trillions
Market Share (%)
Office 0.67 35 0.70 30
Multifamily 0.47 24 0.68 29
Retail 0.34 18 0.40 17
Industrial 0.25 13 0.29 12
Hotel 0.11 6 0.18 7
All* 1.92 100 2.35 100
CBRE | U.S. Multifamily Housing: A Primer for Offshore Investors 10

Figure 7: U.S. Multifamily Mortgage Holdings by Lender Type
in trillions GSEs Commercial Banks Others Life Companies CMBS Issuers
1990 0.042 0.127 0.088 0.029 0.0011991 0.040 0.115 0.096 0.029 0.0041992 0.040 0.106 0.092 0.027 0.0071993 0.040 0.104 0.087 0.028 0.0081994 0.041 0.102 0.088 0.028 0.0101995 0.045 0.105 0.083 0.029 0.0121996 0.050 0.107 0.082 0.031 0.0161997 0.054 0.109 0.084 0.030 0.0201998 0.064 0.112 0.091 0.032 0.0331999 0.078 0.127 0.093 0.033 0.0422000 0.091 0.139 0.091 0.034 0.0472001 0.115 0.149 0.091 0.036 0.0532002 0.136 0.163 0.089 0.037 0.0592003 0.177 0.182 0.092 0.039 0.0662004 0.188 0.206 0.098 0.040 0.0732005 0.194 0.237 0.105 0.042 0.0892006 0.194 0.253 0.114 0.046 0.1022007 0.236 0.261 0.125 0.052 0.1242008 0.283 0.280 0.120 0.052 0.1132009 0.310 0.271 0.119 0.049 0.1072010 0.323 0.258 0.125 0.047 0.0982011 0.347 0.251 0.119 0.049 0.0912012 0.380 0.260 0.119 0.051 0.0802013 0.391 0.289 0.119 0.054 0.071
Source: CBRE Research, Federal Reserve Bank, Q4 2016. Q4 totals represented in graph.
0.00
0.25
0.50
0.75
1.00
1.25
1990 1992 1994 1996 1998 2000 2002 2004 2006 2008 2010 2012 2014 2016
GSEs Commercial Banks Others
Life Companies CMBS Issuers $ trillion
PREFERENTIAL MORTGAGE MARKET AND ABUNDANT FINANCING SOURCESLoan terms, leverage and pricing are more favorable for multifamily than other property types. The
availability of debt capital is important for investment in any commercial real estate sector. Leverage is used for most transactions, with acquisition financing usually in the 50%-to-75% loan-to-value (LTV) range.
The largest sources of capital for financing acquisitions of all property types in the U.S. are banks, life insurance companies and CMBS or conduit lenders. The multifamily sector also benefits from U.S. government-backed lending programs not available for other property sectors. Specifically, Fannie Mae, Freddie Mac and the Federal Housing Administration are major sources of debt capital for existing assets. Fannie Mae and Freddie Mac are government-sponsored enterprises (GSEs) because they are backed by the U.S. government.
The GSE share of multifamily mortgages has risen dramatically over the past two decades, and the availability of capital from Fannie Mae and Freddie Mac provides a unique financing advantage. These capital sources increase investment and financing liquidity—important during economic downturns—and help the multifamily sector sustain premium pricing.
Multifamily’s strong market performance, active investment arena and the availability of agency GSE for financing acquisitions and refinancing assets (during both favorable and unfavorable phases of the market) have contributed to the sector’s ability to obtain more favorable loan pricing and terms than other property types. Current loan underwriting metrics reflect the preferential loan underwriting characteristics that multifamily mortgages received in Q2 2017 compared with other major property types.
Multifamily borrowers have obtained higher LTV ratios and lower debt-service-coverage ratios. The average mortgage rate was lower than all other property types combined by 30 bps. Multifamily’s preferential treatment is not limited to 2017. Historically, multifamily debt capital has been more favorably priced than other commercial property assets.
U.S. MULTIFAMILY MORTGAGE HOLDINGS BY LENDER TYPE
SELECT MORTGAGE UNDERWRITING TERMS
Source: CBRE Research, Federal Reserve Bank, Q4 2016. Q4 totals represented in graph.
*Represents office, industrial and retail.
Q2 2017
Commercial Real Estate* Multifamily
Mortgage Rate 4.50 4.25
Loan-to-Value 59 67
Debt Service Coverage Ratio 1.74 1.25
Debt Yield 10.40 7.25
Cap Rate 6.60 5.50
1990 1992 1994 1996 1998 2000 2002 2004 2006 2008 2010 2012 2014 2016
GSEs
Life CompaniesCommercial BanksCMBS Issuers
Others
1.25$ trillion
1.00
0.75
0.50
0.25
0
Source: CBRE Research, Real Capital Analytics, Q2 2017. For fixed-rate loans only. Covers a variety of lender types.
TEN REASONS TO INVEST IN U.S. MULTIFAMILY
Mortgage underwriting terms are reflective of Fannie Mae and Freddie Mac underwriting. These terms exhibit advantageous leverage and rates compared to other types of commercial real estate, which is an indication of lenders’ higher level of comfort and of lower volatility of multifamily.
6
CBRE | U.S. Multifamily Housing: A Primer for Offshore Investors 11

DIVERSIFIED CREDIT RISKIn commercial real estate, there is always risk that leases will not be renewed or
easily back-filled when space is vacated. In addition to revenue loss from vacancies, there are costs to release and physically prepare available space for new tenants. Multifamily shares this risk in the aggregate, but the sector is very different in that each individual lease only represents a very small portion of overall income of the asset.
Because multifamily assets have a large volume of leases, it also means that credit is well diversified across many leases and lease holders. Diversified credit mitigates risk and gives the sector a distinct advantage over office, industrial and retail assets, each with much smaller numbers of tenants.
SHORT-TERM LEASES ALLOW IMMEDIATE ADJUSTMENT TO MARKET CONDITIONS
Short-term leases—typically one year vs. five or more years for office, industrial and retail—means that leasing activity is a constant part of multifamily operations. Short-term leases and the steady leasing/renewal activity provide a financial cushion for operations which generally results in higher occupancy. In other sectors, the loss of an individual tenant can seriously disrupt cash flow and create more risk for owners.
The short-term lease structure, relative to other property types, provides an advantage with respect to both market conditions and inflation. In periods of high rent growth, the short-term leases provide owners the ability to adjust rents upward quickly. More importantly, if the U.S. moves into a period of higher inflation, short-term leases provide owners with the ability to make upward adjustments to cover the increased costs of operations.
7 8
TEN REASONS TO INVEST IN U.S. MULTIFAMILY
CBRE | U.S. Multifamily Housing: A Primer for Offshore Investors 12

TEN REASONS TO INVEST IN U.S. MULTIFAMILY
THIRD-PARTY LEASING AND MANAGEMENT OPTIONS
In the U.S., it is common to outsource property management and leasing for all types of commercial real estate, including multifamily assets. Management and leasing are almost always handled by the same organization in the multifamily sector.
The NMHC reported that the 50 largest multifamily management companies in the U.S. managed 3.2 million units. Many management companies also own assets, and these units are included in the count. The largest 50 firms each managed at least 30,000 units; the top five are each responsible for more than 100,000 units. Additionally, many of the larger firms have a broad geographic coverage and operate in all or most major metropolitan areas across the U.S.
Revenue management systems are used by nearly all major management companies. These sophisticated software programs are like those used in the airline and travel industries and help determine optimal rent pricing based on market conditions, property occupancy, availability of units by size and other market and property-level criteria. Revenue management systems greatly assist in obtaining the best pricing for new leases and renewals, enhancing revenue for the owner.
Disclaimer: Information contained herein, including projections, has been obtained from sources believed to be reliable. While we do not doubt its accuracy, we have not verified it and make no guarantee, warranty or representation about it. It is your responsibility to confirm independently its accuracy and completeness. This information is presented exclusively for use by CBRE clients and professionals and all rights to the material are reserved and cannot be reproduced without prior written permission of CBRE.
RELATIVELY LOW CAPITAL EXPENDITURES CAN BE MORE ACCURATELY FORECASTED
Multifamily investments tend to provide elevated net cashflow. While multifamily properties require on-going maintenance and, occasionally, major capital improvements, the amount of capital expenditures (“cap ex”) needed to maintain them is typically lower than the cap ex investment required for other commercial real estate assets.
Similarly, apartment unit turnover requires only minimal investment in contrast to what can be unpredictable and significant tenant improvement expenses needed to attract and retain office, industrial or retail tenants. Annual unit turnover costs are predictable within a tight range and do not result in dramatic swings in cash flows for multifamily owners and investors.
CBRE | U.S. Multifamily Housing: A Primer for Offshore Investors 13

KEYS TO SUCCESSThe multifamily sector offers opportunities for all types of foreign investors, including institutional, public and private REITs and private capital. Here are some suggestions for success:
TAKE ACTIONExplore and carefully consider the reasons to invest in the multifamily sector and how this fits with your investment strategy. Today’s
attractive financing options provide a host of opportunities to invest in the sector. Browse available properties at cbredealflow.com.
The best way to gain a baseline understanding of what’s happening in a given market is to subscribe to a third-party multifamily
data provider. There are many fee-based market research providers, including CBRE Econometric Advisors.
KNOW WHERE THE OPPORTUNITIES AREMarket statistics including vacancy, rents, net absorption, construction and investment activity and pricing are readily available.
Understanding construction activity is also critical for making well-informed decisions. For example, high levels of Class A
completions in some metropolitan areas and submarkets create opportunities in other multifamily segments. Class A-, Class B
and Class C multifamily product offer tremendous investment opportunities for conventional and value-add strategies. Due to
substantially lower rents, the new supply does not impact these assets and they often obtain higher rent growth.
Armed with insights, you can navigate the opportunities that align with your investment strategy. Access the latest forecasts, research
and reports at cbre.com/research.
PARTNER WITH EXPERTSTo effectively execute on a multifamily investment strategy, partner with experts who specialize in the sector and have global capital
expertise. CBRE executes on all types of transactions and is the largest originator of U.S. government-backed financing programs
such as Fannie Mae, Freddie Mac and FHA. For real-time insights, please reach out to any of our professionals:
ABOUT CBRE MULTIFAMILYCBRE Multifamily consists of more than 300 dedicated professionals that specialize in all aspects of multifamily real estate brokerage and finance, providing investment and advisory services. CBRE Multifamily is part of CBRE’s Capital Markets platform comprised of property sales, debt and structured finance and investment banking for all property types. With offices in 65 cities across every major U.S. market, CBRE Multifamily is seamlessly connected across the globe, offering strategic advice and execution for residential and multifamily assignments worldwide. In 2016, CBRE completed more than $52 billion in capital markets multifamily transactions and has been named “Top U.S. Apartment Broker” by Real Capital Analytics since 2001.
Colleen Pentland LallyDirector Capital Markets+1 617 217 [email protected]
Mitchell KiffeSenior Managing Director Co-Head of National ProductionCapital Markets, Debt & Structured Finance+1 703 905 [email protected]
Jeanette I. Rice, CREAmericas Head of Multifamily Research+1 214 979 [email protected] Jeanette on Twitter: @RiceJeanette
Brian McAuliffePresident Capital Markets, Institutional Properties+1 312 935 [email protected]
Peter DonovanExecutive Managing Director Capital Markets, Multifamily+1 617 217 [email protected]
James ScottManaging Principal CBRE Capital Advisors Executive Managing DirectorCapital Markets+1 212 656 [email protected]
Spencer G. LevyAmericas Head of Research & Senior Economic Advisor+1 617 912 [email protected] Spencer on Twitter: @SpencerGLevy
www.cbre.com/multifamily