u.s. market | industrial
TRANSCRIPT

Second Quarter 2021
COMMERCIAL REAL ESTATE
U.S. MARKET | INDUSTRIAL

U . S . M A R K E T | I N D U S T R I A L | Q 2 2 0 2 1
-50
0
50
100
150
200
2012 2013 2014 2015 2016 2017 2018 2019 2020 2021
0
100
200
300
400
500
600
700
2012 2013 2014 2015 2016 2017 2018 2019 2020 2021
U.S. TRENDLINES
5-Year Trend Current Quarter
VACANCY
U.S. HIGHLIGHTS
5.2%Lowest level since pandemic began
ECONOMY
• Following disappointing April and May figures, job growth exceeded expectations in June, though the unemployment rate was higher than anticipated.
• Industrial-using employment was virtually unchanged as supply chain challenges adversely affected manufacturing and construction.
• E-commerce’s share of overall retail sales cooled as brick-and-mortar stores reopened.
INDUSTRIAL MARKET
• Q2 marked the third consecutive quarter with over 100 MSF of positive net absorption, which hasn’t occurred since the first three quarters of 2018.
• Occupancy levels increased in all but one market in the past 12 months and 40 of 44 markets during Q2.
• The overall vacancy rate improved in consecutive quarters for the first time in three years.
• New inventory delivered to the market was at its lowest level in more than two years.
• The volume of product under construction is 30% higher YoY and double that of year-end 2015.
• After slowing during much of 2020, rent growth acceleration has returned to pre-pandemic levels.
LOOKING AHEAD
• Most brick & mortar retailers are investing more in e-commerce than on the in-store experience.
• Food/beverage will grow its share of e-commerce.
• As America’s ports continued to report record cargo volumes, the supply chain is still congested, and is anticipated to remain so well into 2022.
• Increased warehouse pricing, coupled with supply chain issues, could create opportunities for other transportation hubs in secondary logistics markets.
VACANCY VS ASKING RENT
0.0%
3.0%
6.0%
9.0%
12.0%
$0
$2
$4
$6
$8
2012 2013 2014 2015 2016 2017 2018 2019 2020 2021
Average Asking NNN Rent (PSF) Vacancy
NET ABSORPTION (MILLION SF)
UNDER CONSTRUCTION (MILLION SF)3 Yr Qrtly Avg 456.3 MSF 5 Yr Qrtly Avg 413.8 MSF
3 Yr Qtrly Avg 81.3 MSF5 Yr Qtrly Avg 93.3 MSF
NET ABSORPTION 102.2 MSFDemand continued to accelerate
ASKING RENT$6.96 PSF38th consecutive quarterly increase
UNDER CONSTRUCTION
573.7 MSFDevelopers ramp up to record levels
YTD
UNEMPLOYMENT RATE
5.9%Job gains in nearly every sector
RETAIL SALES GROWTH
-0.3%Consumers returned to brick & mortar retail
U.S. HISTORICAL
O V E R V I E W
YTD
U . S . M A R K E T | I N D U S T R I A L | Q 2 2 0 2 1
0
5
10
15
20
25
30
35
40
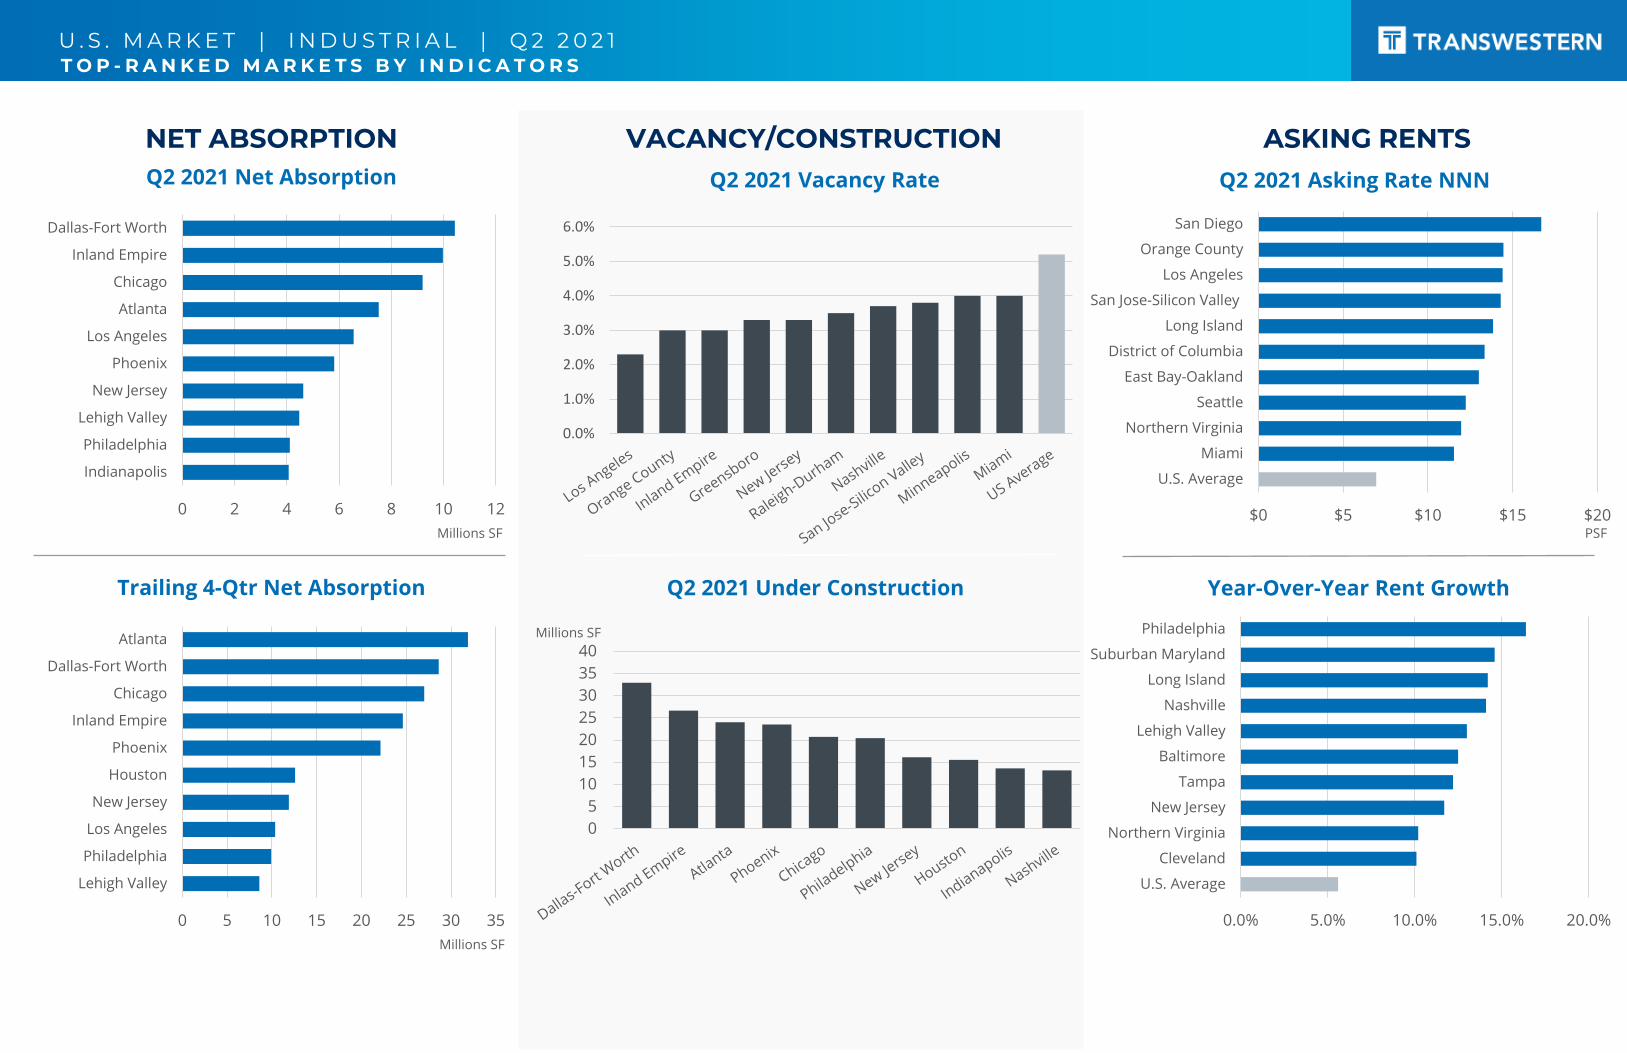
NET ABSORPTIONQ2 2021 Net Absorption
VACANCY/CONSTRUCTION ASKING RENTS
Trailing 4-Qtr Net Absorption Q2 2021 Under Construction
Q2 2021 Vacancy Rate
Year-Over-Year Rent Growth
Q2 2021 Asking Rate NNN
0 2 4 6 8 10 12
Indianapolis
Philadelphia
Lehigh Valley
New Jersey
Phoenix
Los Angeles
Atlanta
Chicago
Inland Empire
Dallas-Fort Worth
0 5 10 15 20 25 30 35
Lehigh Valley
Philadelphia
Los Angeles
New Jersey
Houston
Phoenix
Inland Empire
Chicago
Dallas-Fort Worth
Atlanta
$0 $5 $10 $15 $20
U.S. Average
Miami
Northern Virginia
Seattle
East Bay-Oakland
District of Columbia
Long Island
San Jose-Silicon Valley
Los Angeles
Orange County
San Diego
0.0%
1.0%
2.0%
3.0%
4.0%
5.0%
6.0%
0.0% 5.0% 10.0% 15.0% 20.0%
U.S. Average
Cleveland
Northern Virginia
New Jersey
Tampa
Baltimore
Lehigh Valley
Nashville
Long Island
Suburban Maryland
Philadelphia
Millions SF
Millions SF PSF
Millions SF
T O P - R A N K E D M A R K E T S B Y I N D I C A T O R S

U . S . M A R K E T | I N D U S T R I A L | Q 2 2 0 2 1
NET ABSORPTION
MARKET EXPANSION: 3 YEAR NET ABSORPTION % STOCK
K E Y P E R F O R M A N C E I N D I C A T O R S
• Positive annual and quarterly net absorption was reported in most markets as industrial space needs continued to grow.
• Further, net absorption accelerated in Q2 for over 60% of tracked markets. This subset experienced higher net absorption in the past quarter than their quarterly average over the past 12 months.
• Here we consider 3-year net absorption as a percent of stock. A higher percentage indicates that a market is more expansionary.
• Markets experiencing the most growth include Savannah, Lehigh Valley, Las Vegas, Inland Empire, Charleston, and Phoenix.
-5%
0%
5%
10%
15%
20%
25%
30%
Sava
nn
ah
Leh
igh
Val
ley
Las
Ve
gas
Inla
nd
Em
pir
e
Ch
arle
sto
n
Ph
oen
ix
San
An
ton
io
No
rth
ern
Vir
gin
ia
Dal
las
/ Fo
rt W
ort
h
Atl
anta
Au
stin
Ind
ian
apo
lis
Ral
eigh
-Du
rham
Ho
ust
on
Nas
hvi
lle
Orl
and
o
Mia
mi
Tam
pa
Co
lum
bu
s
Bal
tim
ore
Ch
icag
o
Kan
sas
Cit
y
Jack
son
ville
Ch
arlo
tte
Ne
w J
ers
ey
St. L
ou
is
Den
ver
Ph
ilad
elp
hia
Gre
ensb
oro
San
Die
go
Cin
cin
nat
i
Seat
tle
Milw
auke
e
Bo
sto
n
Sub
urb
an M
aryl
and
San
Jo
se/S
ilico
n V
alle
y
Los
An
gele
s
Det
roit
Cle
vela
nd
Min
ne
apo
lis
East
Bay
/Oak
lan
d
Ora
nge
Co
un
ty
Dis
tric
t o
f C
olu
mb
ia
Lon
g Is
lan
d
T-3
6 N
et
Ab
sorp
tio
n P
erc
en
t St
ock
-5
0
5
10
15
20
25
30
35A
tlan
ta
Dal
las
/ Fo
rt W
ort
h
Ch
icag
o
Inla
nd
Em
pir
e
Ph
oen
ix
Ho
ust
on
Ne
w J
ers
ey
Los
An
gele
s
Ph
ilad
elp
hia
Leh
igh
Val
ley
Co
lum
bu
s
Las
Ve
gas
Ind
ian
apo
lis
Mia
mi
St. L
ou
is
Nas
hvi
lle
Orl
and
o
Ral
eigh
-Du
rham
Au
stin
No
rth
ern
Vir
gin
ia
Bal
tim
ore
Kan
sas
Cit
y
Cin
cin
nat
i
San
An
ton
io
Ch
arlo
tte
Sava
nn
ah
San
Die
go
Tam
pa
Gre
ensb
oro
Seat
tle
Milw
auke
e
Ora
nge
Co
un
ty
Ch
arle
sto
n
Jack
son
ville
Bo
sto
n
East
Bay
/Oak
lan
d
Cle
vela
nd
Det
roit
Min
ne
apo
lis
Den
ver
Sub
urb
an M
aryl
and
San
Jo
se/S
ilico
n V
alle
y
Dis
tric
t o
f C
olu
mb
ia
Lon
g Is
lan
d
Squ
are
Fe
et
(mill
ion
s)
T12 Month Net Absorption T3 Month Net Absorption Quarterly Avg T12 Month Net Absorption

U . S . M A R K E T | I N D U S T R I A L | Q 2 2 0 2 1
RENTAL RATES (NNN)
RENTAL RATE CHANGE
K E Y P E R F O R M A N C E I N D I C A T O R S
• Markets with the highest rental rates were located on the West coast and near Washington, D.C., and New York.
• Some Midwest markets with low rental rates saw relatively high rent growth over the past year, including Cleveland, Chicago, and Columbus.
• More than half of the tracked markets saw rental growth for the year surpass 5%, with all but three experiencing increases over the past 12 months.
• While a few of the markets with low or negative rental-rate changes may be reacting to recent strong supply (e.g., Raleigh-Durham, Savannah), others may be adjusting to low or negative net absorption (e.g., Washington, D.C., Minneapolis).
0
2
4
6
8
10
12
14
16
18Sa
n D
iego
Ora
nge
Co
un
ty
Los
An
gele
s
San
Jo
se/S
ilico
n V
alle
y
Lon
g Is
lan
d
Dis
tric
t o
f C
olu
mb
ia
East
Bay
/Oak
lan
d
Seat
tle
No
rth
ern
Vir
gin
ia
Mia
mi
Au
stin
Sub
urb
an M
aryl
and
Bo
sto
n
Ne
w J
ers
ey
Inla
nd
Em
pir
e
Las
Ve
gas
Den
ver
Ral
eigh
-Du
rham
Ph
oen
ix
Ph
ilad
elp
hia
Ho
ust
on
Orl
and
o
Bal
tim
ore
Nas
hvi
lle
Tam
pa
Leh
igh
Val
ley
Ch
icag
o
Det
roit
San
An
ton
io
Ch
arle
sto
n
Jack
son
ville
Dal
las
/ Fo
rt W
ort
h
Min
ne
apo
lis
Atl
anta
Ch
arlo
tte
Sava
nn
ah
St. L
ou
is
Kan
sas
Cit
y
Milw
auke
e
Cin
cin
nat
i
Co
lum
bu
s
Cle
vela
nd
Ind
ian
apo
lis
Gre
ensb
oro
Ave
rage
Re
nt
Pe
r Sq
uar
e F
oo
t ($
)
-10%
-5%
0%
5%
10%
15%
20%
Ph
ilad
elp
hia
Sub
urb
an M
aryl
and
Lon
g Is
lan
d
Nas
hvi
lle
Leh
igh
Val
ley
Bal
tim
ore
Tam
pa
Ne
w J
ers
ey
No
rth
ern
Vir
gin
ia
Cle
vela
nd
Mia
mi
Los
An
gele
s
Orl
and
o
Seat
tle
Ch
icag
o
Ora
nge
Co
un
ty
East
Bay
/Oak
lan
d
Bo
sto
n
Las
Ve
gas
Inla
nd
Em
pir
e
Atl
anta
Co
lum
bu
s
Dal
las
/ Fo
rt W
ort
h
Gre
ensb
oro
Den
ver
Ph
oen
ix
Ch
arle
sto
n
Cin
cin
nat
i
San
Jo
se/S
ilico
n V
alle
y
Ind
ian
apo
lis
St. L
ou
is
San
Die
go
Jack
son
ville
Det
roit
Ho
ust
on
Ch
arlo
tte
San
An
ton
io
Au
stin
Ral
eigh
-Du
rham
Milw
auke
e
Kan
sas
Cit
y
Min
ne
apo
lis
Sava
nn
ah
Dis
tric
t o
f C
olu
mb
ia
Ye
ar O
ver
Ye
ar C
han
ge (
%)
Rental Rate T12 Percent Change Deliveries T12 as a Percent of Stock

U . S . M A R K E T | I N D U S T R I A L | Q 2 2 0 2 1
CONSTRUCTION PIPELINE
AVAILABILITY
K E Y P E R F O R M A N C E I N D I C A T O R S
• Many coastal markets where the busiest U.S. container ports are located reported the lowest availability as a percent of stock.
• Markets seeing the largest increases in availability include Savannah, Kansas City, and Seattle – all of which also have higher than average overall availability as a percent of stock as well. Those seeing the largest decreases include St. Louis, Austin, San Antonio, and Los Angeles.
• Under construction stock is indicative of future expansion.
• Savannah and Austin are growing relatively quickly with under construction stock exceeding 12%.
• Growth in the Sun Belt is evidenced here, as Savannah, Austin, Phoenix, San Antonio, Charleston, and Charlotte have seen the most acceleration of under construction SF as a percent of stock over the past year.
-3%
2%
7%
12%
17%
22%
Sava
nn
ah
Ho
ust
on
Ch
arlo
tte
Ph
oen
ix
Bal
tim
ore
Leh
igh
Val
ley
Den
ver
Kan
sas
Cit
y
Dal
las
/ Fo
rt W
ort
h
Ch
icag
o
Ch
arle
sto
n
Sub
urb
an M
aryl
and
Dis
tric
t o
f C
olu
mb
ia
Seat
tle
Tam
pa
Cle
vela
nd
Det
roit
St. L
ou
is
Atl
anta
Bo
sto
n
Au
stin
Ph
ilad
elp
hia
Orl
and
o
Nas
hvi
lle
Milw
auke
e
San
An
ton
io
East
Bay
/Oak
lan
d
Cin
cin
nat
i
Ind
ian
apo
lis
No
rth
ern
Vir
gin
ia
Co
lum
bu
s
San
Die
go
Min
ne
apo
lis
Ral
eigh
-Du
rham
Mia
mi
Las
Ve
gas
Inla
nd
Em
pir
e
Lon
g Is
lan
d
Jack
son
ville
Ne
w J
ers
ey
Gre
ensb
oro
San
Jo
se/S
ilico
n V
alle
y
Ora
nge
Co
un
ty
Los
An
gele
s
Availability % Stock T12 Change in Availability % Stock
-4%
-2%
0%
2%
4%
6%
8%
10%
12%
14%
16%
Sava
nn
ah
Au
stin
Ph
oen
ix
San
An
ton
io
Leh
igh
Val
ley
Nas
hvi
lle
Ch
arle
sto
n
Las
Ve
gas
Inla
nd
Em
pir
e
Ind
ian
apo
lis
Ch
arlo
tte
Ph
ilad
elp
hia
Kan
sas
Cit
y
Dal
las
/ Fo
rt W
ort
h
Seat
tle
Atl
anta
Ral
eigh
-Du
rham
Sub
urb
an M
aryl
and
San
Die
go
Den
ver
Tam
pa
Jack
son
ville
Ho
ust
on
Ne
w J
ers
ey
Co
lum
bu
s
Mia
mi
Bal
tim
ore
No
rth
ern
Vir
gin
ia
Cin
cin
nat
i
Orl
and
o
Ch
icag
o
Gre
ensb
oro
Det
roit
Min
ne
apo
lis
Bo
sto
n
Lon
g Is
lan
d
Milw
auke
e
Los
An
gele
s
St. L
ou
is
Cle
vela
nd
Ora
nge
Co
un
ty
Dis
tric
t o
f C
olu
mb
ia
East
Bay
/Oak
lan
d
San
Jo
se/S
ilico
n V
alle
y
Under Construction % Stock T12 Change in Under Construction % Stock
U . S . M A R K E T | I N D U S T R I A L | Q 2 2 0 2 1
MarketInventory
Square FeetOverall
Vacancy Rate Direct
Vacancy RateNet
Absorption12-Month
Net AbsorptionAsking Rent
NNNAnnual Rent
ChangeUnder
Construction
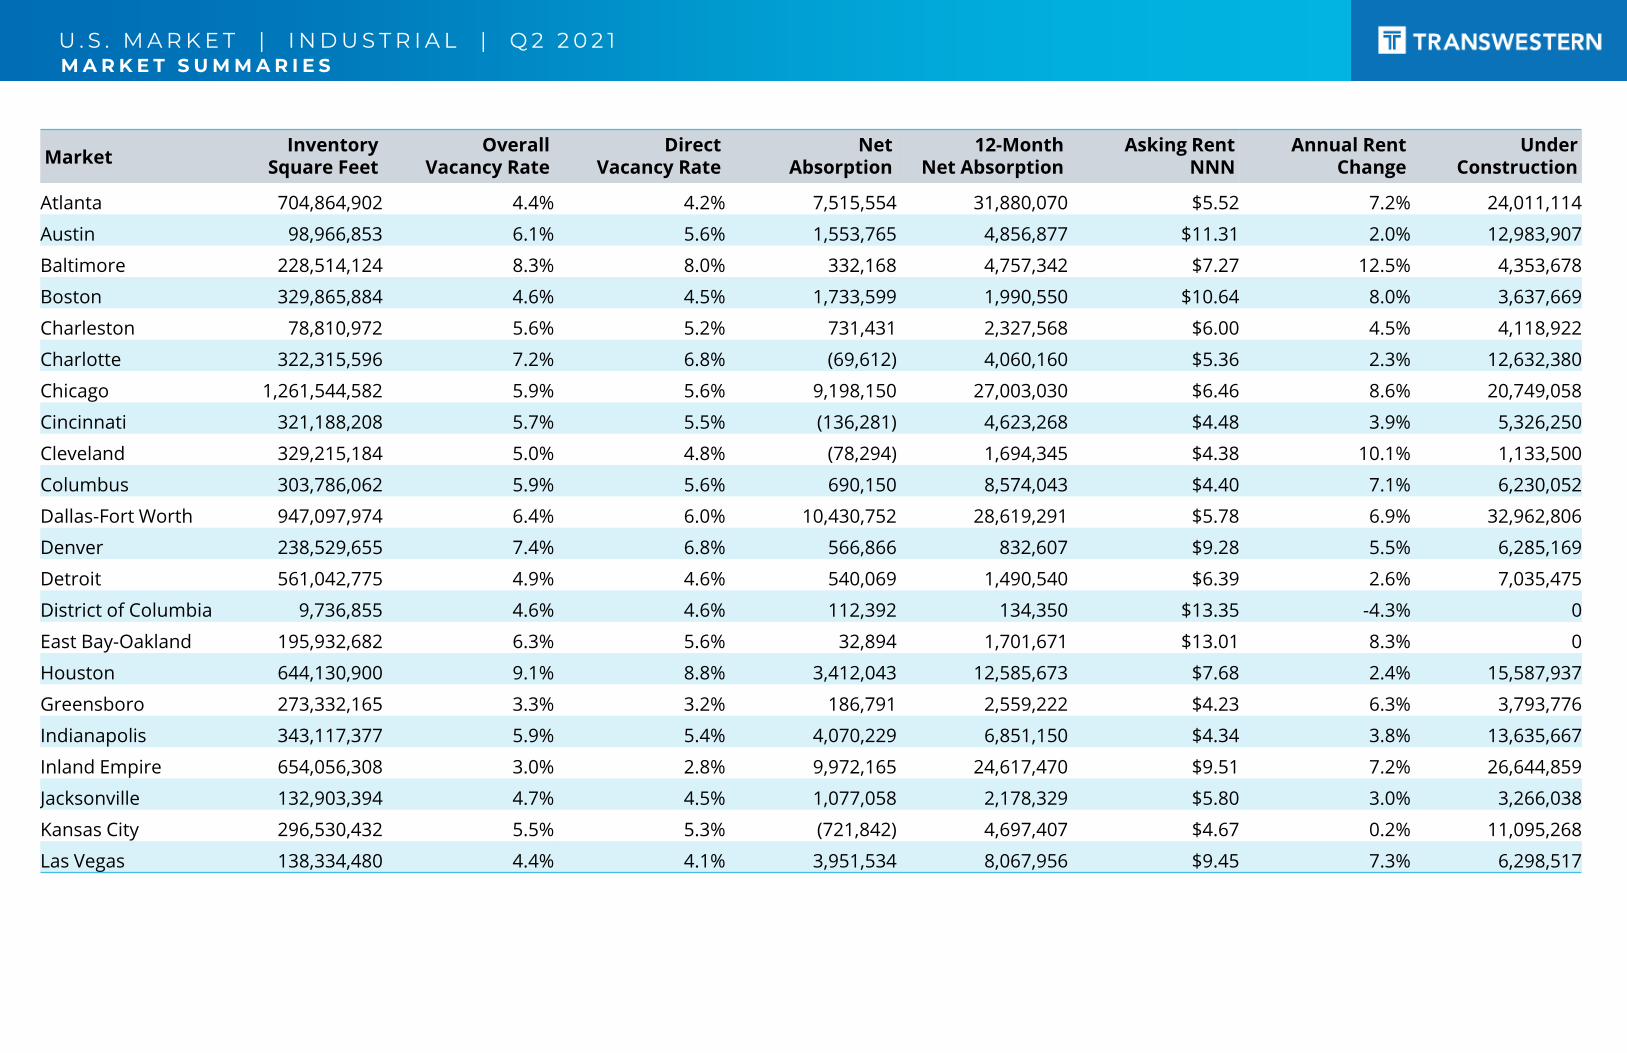
Atlanta 704,864,902 4.4% 4.2% 7,515,554 31,880,070 $5.52 7.2% 24,011,114
Austin 98,966,853 6.1% 5.6% 1,553,765 4,856,877 $11.31 2.0% 12,983,907
Baltimore 228,514,124 8.3% 8.0% 332,168 4,757,342 $7.27 12.5% 4,353,678
Boston 329,865,884 4.6% 4.5% 1,733,599 1,990,550 $10.64 8.0% 3,637,669
Charleston 78,810,972 5.6% 5.2% 731,431 2,327,568 $6.00 4.5% 4,118,922
Charlotte 322,315,596 7.2% 6.8% (69,612) 4,060,160 $5.36 2.3% 12,632,380
Chicago 1,261,544,582 5.9% 5.6% 9,198,150 27,003,030 $6.46 8.6% 20,749,058
Cincinnati 321,188,208 5.7% 5.5% (136,281) 4,623,268 $4.48 3.9% 5,326,250
Cleveland 329,215,184 5.0% 4.8% (78,294) 1,694,345 $4.38 10.1% 1,133,500
Columbus 303,786,062 5.9% 5.6% 690,150 8,574,043 $4.40 7.1% 6,230,052
Dallas-Fort Worth 947,097,974 6.4% 6.0% 10,430,752 28,619,291 $5.78 6.9% 32,962,806
Denver 238,529,655 7.4% 6.8% 566,866 832,607 $9.28 5.5% 6,285,169
Detroit 561,042,775 4.9% 4.6% 540,069 1,490,540 $6.39 2.6% 7,035,475
District of Columbia 9,736,855 4.6% 4.6% 112,392 134,350 $13.35 -4.3% 0
East Bay-Oakland 195,932,682 6.3% 5.6% 32,894 1,701,671 $13.01 8.3% 0
Houston 644,130,900 9.1% 8.8% 3,412,043 12,585,673 $7.68 2.4% 15,587,937
Greensboro 273,332,165 3.3% 3.2% 186,791 2,559,222 $4.23 6.3% 3,793,776
Indianapolis 343,117,377 5.9% 5.4% 4,070,229 6,851,150 $4.34 3.8% 13,635,667
Inland Empire 654,056,308 3.0% 2.8% 9,972,165 24,617,470 $9.51 7.2% 26,644,859
Jacksonville 132,903,394 4.7% 4.5% 1,077,058 2,178,329 $5.80 3.0% 3,266,038
Kansas City 296,530,432 5.5% 5.3% (721,842) 4,697,407 $4.67 0.2% 11,095,268
Las Vegas 138,334,480 4.4% 4.1% 3,951,534 8,067,956 $9.45 7.3% 6,298,517
M A R K E T S U M M A R I E S

U . S . M A R K E T | I N D U S T R I A L | Q 2 2 0 2 1M A R K E T S U M M A R I E S
MarketInventory
Square FeetOverall
Vacancy Rate Direct
Vacancy RateNet
Absorption12-Month
Net AbsorptionAsking Rent
NNNAnnual Rent
ChangeUnder
Construction
Lehigh Valley 141,039,681 5.1% 4.7% 4,475,189 8,602,478 $6.86 13.0% 8,833,651
Long Island 154,201,542 4.4% 4.1% 625,423 (236,613) $13.85 14.2% 1,118,412
Los Angeles 846,394,501 2.3% 2.1% 6,558,529 10,362,847 $14.41 9.7% 3,594,580
Miami 232,798,777 4.0% 3.8% 1,805,644 6,657,635 $11.54 9.7% 4,471,180
Milwaukee 242,792,344 4.7% 4.6% 767,629 2,432,352 $4.55 1.8% 1,608,295
Minneapolis 378,152,004 4.0% 3.7% 26,992 1,488,161 $5.62 -1.4% 4,358,745
Nashville 223,874,629 3.7% 3.1% 856,549 6,030,053 $6.89 14.1% 13,196,262
New Jersey 744,299,018 3.3% 3.0% 4,626,136 11,896,114 $9.85 11.7% 16,137,552
Northern Virginia 111,607,278 5.0% 4.7% 1,095,907 4,829,260 $11.97 10.2% 1,952,465
Orange County 273,354,015 3.0% 2.5% 1,106,426 2,351,518 $14.46 8.6% 391,203
Orlando 167,097,956 5.0% 4.7% 1,146,767 5,852,631 $7.66 9.4% 2,753,264
Philadelphia 531,340,472 4.6% 4.5% 4,111,807 9,911,255 $7.88 16.4% 20,467,343
Phoenix 353,036,428 6.1% 5.9% 5,814,504 22,114,343 $7.93 4.9% 23,532,863
Raleigh-Durham 124,281,930 3.5% 3.3% 1,675,298 5,301,116 $8.36 1.8% 4,065,411
San Antonio 116,579,281 6.1% 5.9% 524,216 4,376,453 $6.06 2.0% 7,448,358
San Diego 176,827,382 5.0% 4.6% 1,458,244 3,380,452 $16.69 3.7% 5,358,188
San Jose-Silicon Valley 82,957,183 3.8% 3.4% 172,621 216,366 $14.30 3.9% 0
Savannah 74,413,721 8.8% 7.9% 1,171,403 3,938,167 $4.88 -3.4% 10,780,508
Seattle 308,560,910 5.6% 5.1% 284,327 2,556,103 $12.24 8.7% 10,607,148
St. Louis 298,674,988 4.4% 4.0% 2,267,965 6,399,263 $4.68 3.8% 1,052,300
Suburban Maryland 105,255,098 6.5% 6.2% 98,121 420,420 $11.00 14.6% 3,333,523
Tampa 179,240,706 4.5% 4.3% 1,440,745 3,317,423 $6.89 12.2% 4,471,984

U . S . M A R K E T | I N D U S T R I A L | Q 2 2 0 2 1
RESEARCH METHODOLOGYThe information in this report is a compilation of single and multi-
tenant industrial and flex properties located in select U.S.
metropolitan areas. Government-owned buildings are excluded
from analysis. All rents are reported as triple net.
Copyright © 2021 Transwestern. All rights reserved. No part of this work may be reproduced or distributed to third parties without written permission of the copyright owner. The information contained in this report was gathered by Transwestern from CoStar and other primary and secondary sources believed to be reliable. Transwestern, however, makes no representation concerning the accuracy or completeness of such information and expressly disclaims any responsibility for any inaccuracy contained herein.
TRANSWESTERN LOCATIONS
ABOUT TRANSWESTERNThe privately held Transwestern companies have been delivering a higher level of personalized service and innovative real estate solutions since 1978. Through an integrated, customized approach that begins with good ideas, the firm drives value for clients across commercial real estate services, development, and investment management. Operating from 33 U.S. offices, Transwestern extends its platform capabilities globally through strategic alliance partners whose unique geographic,cultural, and business expertise fuels creative solutions. Learn more at transwestern.com and @Transwestern.
FOR MORE INFORMATION
Matthew DollyResearch Director | Research [email protected] 947 9244
Elizabeth NortonSr. Managing Director | Research [email protected] 775 7026
Laura HaltomManager | Data [email protected] 889 4087