u.s. long product market & trade issues
TRANSCRIPT

U.S. Long Product Market & Trade Issues
Presentation by Bernd Neuenkirchen

U.S. Economic Growth
-6%
-4%
-2%
0%
2%
4%
6%
Q3 2
007
Q4 2
007
Q1 2
008
Q2 2
008
Q3 2
008
Q4 2
008
Q1 2
009
Q2 2
009
Q3 2
009
Q4 2
009
Q1 2
010
Q2 2010
Q3 2
010
Q4 2
010
Q1 2
011
Q 2
2011
Q 3
2011
Q 4
2011
Q 1
2012
Q 2
2012
Q 3
2012
Q 4
2012
Q 1
2013
Q 2
2013
Q 3
2013
Q 4
2013
Q1 2
014
Q2 2
014
Q3 2
014
Q4 2
014
2015
Assumptions:Department of Commerce
One Trader's Opinion

U.S. Raw Steel Production Increases Slightly
1.000
1.200
1.400
1.600
1.800
2.000
2.200
NE
T T
ON
S X
1,0
00
2014 2013 2012 2011
2011 52 week average 1.834 million tons per week
2012 52 week average 1.870 million tons per week
2013 52 week average 1.843 million tons per week
2014 38 week average 1.857 million tons per week

U.S. Automotive Sales

The U.S. Housing Market

U.S. Construction Spending

Consumer Price Index

Selected Steel Import Data
-
50.000
100.000
150.000
200.000
250.000
300.000
350.000
400.000
450.000
500.000
ME
TR
IC T
ON
S
Hot Roll Sheet Rebar Wire Rod Cold Roll Sheet OCTG

AD and CVD Investigations of
Rebar from Mexico and TurkeyDOC’s Final Determination
Mexico (AD)• Deacero 20.58% (preliminary: 20.59%)
• Grupo Simec 66.70% (preliminary: 10.66%)
• Grupo Acerero 66.70% (preliminary: 66.70%)
• All Others 20.58% (preliminary: 20.59%)
The DOC also made an affirmative preliminary determination of critical circumstances with respect to all Mexican producers and exporters of rebar.
Turkey (AD)• Habas 0.00% (preliminary: 0.00%)
• ICDAS 0.00% (preliminary: 2.64%)
• All Others 0.00% (preliminary: 2.64%)
As the result of this negative final determination, the DOC will terminate the AD investigation of rebar from Turkey.
Turkey (CVD)• Habas 0.74% (de minimis) (preliminary: 0.78% (de minimis))
• ICDAS 1.25% (preliminary: 0.10% (de minimis))
• All Others 1.25%
As the result of its de minimis rate, Habas will be excluded from the CVD order.
The DOC made a negative determination of critical circumstances with regard to ICDAS but an affirmative determination with regard to all other
Turkish producers and exporters.
The U.S. International Trade Commission (ITC) is scheduled to make its final injury determination on October 14, 2014.

AD and CVD Investigation of
Chinese Wire Rods DOC’s Preliminary Determination
AD Investigation:
• Hunan Valin Xiangtan
• Jiangsu Shagang International Trade Co
• Rizhao Steel
• All others, including:
Benxi Beiying Iron & Steel
Tangshan Iron & Steel
Angang Group
Qingdao
Jiangsu Yonggang
Baotou
Retroactive date: June 10, 2014
CVD Investigation:
• Benxi Group 10.30% - Negative Critical Circumstance
• Heibei Iron & Steel including Tangshan 81.36% - Affirmative Critical Circumstances
• All Others 10.30%
Retroactive Date: April 9, 2014
Expected Final Determination: November 12, 2014
106.19% - Negative Critical Circumstances
110.25% - Affirmative Critical Circumstances
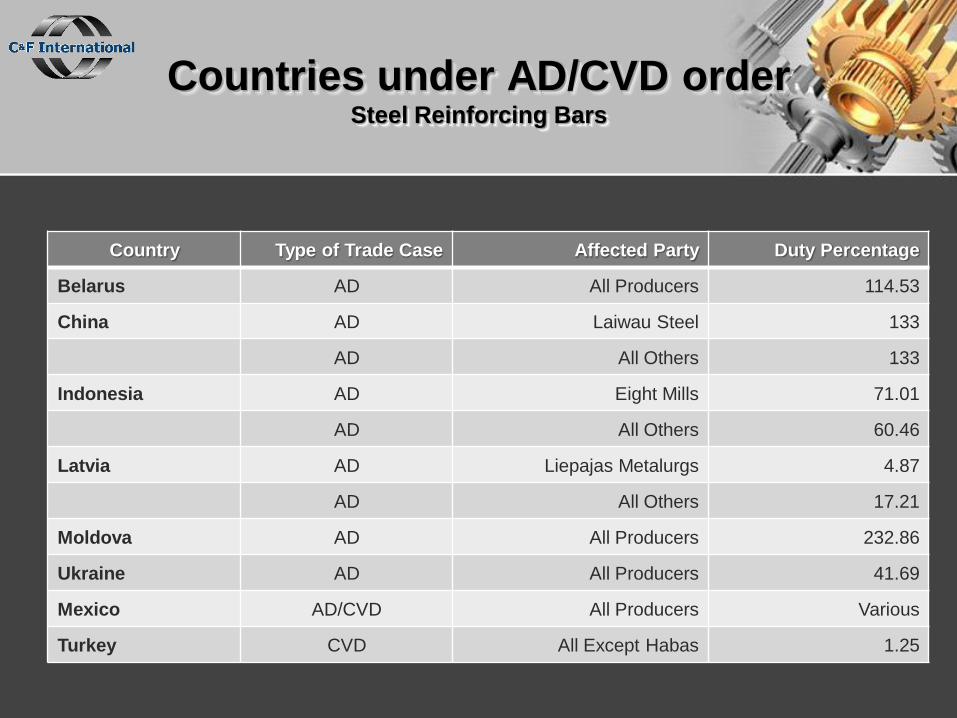
Countries under AD/CVD orderSteel Reinforcing Bars
Country Type of Trade Case Affected Party Duty Percentage
Belarus AD All Producers 114.53
China AD Laiwau Steel 133
AD All Others 133
Indonesia AD Eight Mills 71.01
AD All Others 60.46
Latvia AD Liepajas Metalurgs 4.87
AD All Others 17.21
Moldova AD All Producers 232.86
Ukraine AD All Producers 41.69
Mexico AD/CVD All Producers Various
Turkey CVD All Except Habas 1.25

Countries under AD/CVD orderCarbon Steel Wire Rod
Country Type of Trade Case Affected Party Duty Percentage
Brazil CVD Belgo Mineira 6.74
CVD Gerdau 2.76
CVD All Others 5.64
AD Belgo Mineira 98.69
AD All Others 74.45
Indonesia AD Ispat Indonesia 0
AD All Others 4.06
Mexico AD Ternium 17.94
AD De Acero 12.08
AD Arcelor Mittal (Sicartsa) 5.59
AD All Others 20.11
Moldova AD All Producers 369.11
Trinidad & Tobago AD Arcelor Mittal 23.95
AD All Others 11.40
China AD/CVD All Producers Various

Imports of Steel Reinforcing Bars
1.531.016
880.579
380.462
468.588
594.203
884.900
1.070.214
0
200.000
400.000
600.000
800.000
1.000.000
1.200.000
1.400.000
1.600.000
1.800.000
2007 2008 2009 2010 2011 2012 2013
IMP
OR
TS
IN
ME
TR
IC T
ON
S
2007 - 2013
Worldwide Mexico Turkey

2014 U.S. Imports of Rebarin Total and by Selected Countries (in ‘000 MT)
World Turkey Mexico Japan Spain Korea Peru Portugal
January 195 125 32 5 21 0 0 6
February 83 44 23 11 3 0 0 0
March 139 106 21 0 0 2 6 0
April 114 66 13 5 7 16 5 0
May 75 47 0.2 3 0 17 0 0
June 63 58 0.2 0 0 4 0 0
July 40 28 0 4 0 0 0.6 0
August 136 97 0.2 19 17 0 0 0
September
2382 50 0.3 10 0 0 14 7
Total 927 621 89.9 57 48 39 25.6 13

Imports of Carbon Steel Wire Rods
1.369.849
1.091.764
631.976
1.109.300
831.910881.309
677.456
0
200.000
400.000
600.000
800.000
1.000.000
1.200.000
1.400.000
1.600.000
2007 2008 2009 2010 2011 2012 2013
IMP
OR
TS
IN
ME
TR
IC T
ON
S
2007—2013
Worldwide Canada Japan Turkey China

2014 U.S. Imports Wire Rod in Total and by Selected Countries (in ‘000 MT)
World China Canada Turkey Japan Brazil Korea UK
January 129 66 34 0 6 8 6 7
February 87 31 26 0 10 9 2 5
March 117 50 31 0 10 10 4 6
April 201 112 35 1 13 10 6 9
May 153 71 33 3 8 10 11 5
June 136 2 34 44 10 8 26 7
July 76 3 34 0 12 10 4 0.3
August 109 0 34 28 9 7 6 4
September
23105 0 25 28 8 10 9 0.6
Total 1,113 335 286 104 86 82 74 43.9

Canadian AD Investigations of
Rebar from China, Korea, and Turkey CBSA Preliminary Dumping Determinations Effective September 11, 2014
China
Shiheng Special Steel Group Co., Ltd.• AD margin: 25.4%
• CVD margin: 0.6%
• Total AD/CVD Margin: 26.0%
All Other Chinese Exporters• AD margin: 32.9%
• CVD margin: 25.2%
• Total AD/CVD Margin: 58.1%
Turkey
Habaş Sinai ve Tıbbi Gazlar Istihsal Endüstrisi A.S.• AD margin: 15.2%
• CVD margin: 2.5%
• Total AD/CVD Margin: 17.7%
All Other Turkish Exporters• AD margin: 32.9%
• CVD margin: 22.8%
• Total AD/CVD Margin: 55.7%
Korea
Hyundai Steel Company• AD margin: 14.5%
• CVD margin: 0.3%
• Total AD/CVD Margin: 14.8%
Hyundai Corporation• AD margin: 21.5%
• CVD margin: 3.8%
• Total AD/CVD Margin: 25.3%
G.S. Global Corporation• AD margin: 25.6%
• CVD margin: 3.8%
• Total AD/CVD Margin: 29.4%
All Other Korean Exporters• AD margin: 32.9%
• CVD margin: 3.8%
• Total AD/CVD Margin: 36.7%

Questions?