us lodging industry overview - hotelnewsnow.com€¢ segmentation review ... hamburg paris lux &...
TRANSCRIPT

1
US Lodging Industry Overview
Jan D. Freitag
Senior Vice President

2
www.hotelnewsnow.com Click on “Hotel Data Presentations”

3
Agenda
• Global Review
• Total US Review
• Chain Scale Review
• Segmentation Review – Group & Transient
• 2012 / 2013 Forecast

4
2011: The World Recovered
Markets with Positive REVPAR % Change
Americas: 194 of 212
Europe: 84 of 98 AsiaPac: 38 of 47
Middle East / Africa: 19 of 33
*RevPAR in local currency Source: STR Global

5
Major Global Markets Did Well
*2011 % Change, ADR & RevPAR in local currency Source: STR Global
Market OCC ADR RevPAR
Beijing 8.2 5.8 14.6 Berlin 0.9 -2.0 -1.1 Dubai 7.0 3.4 10.7
Hong Kong 2.4 23.1 26.0 London -0.1 8.5 8.4
Mexico City 7.9 2.9 10.9 Moscow 2.7 5.4 8.3
Sao Paulo 2.9 17.7 21.1 Sydney -0.1 5.2 5.1 Tokyo -8.5 -6.7 -14.7
Toronto -0.6 0.6 0.0

6
-12
-8
-4
0
4
8
2004 2009 2014
GDP Demand
Expect Slowing Eurozone GDP / Demand % Change
*Eurozone Demand & GDP % Change, Quarterly 2004 – 2014F GDP Source: Oxford Economics

7
STR Global Forecast – Selected Cities 2012 RevPAR forecast % chg, local currency
-5% to -10% -5% to 0% 0% to +5%
Athens
Amsterdam Berlin
Brussels Frankfurt
Budapest London
Dublin Moscow
Dusseldorf Munich
Hamburg Paris Lux & Up Up
Madrid Prague
Warsaw Rome
Zurich Stockholm
Vienna

8
Total US Review

9
Supply / Demand Imbalance Drove 2011 Results
% Change
• Room Supply* 1.8 bn 0.6%
• Room Demand* 1.06 bn 5.0%
• Occupancy 60.1% 4.4%
• A.D.R. $102 3.7%
• RevPAR $61 8.2%
• Room Revenue* $108 bn 8.8%
Full Year 2011 Total US Results * All Time High

10
January 2012:
Highest January Demand - EVER
(73.4 Million Rooms Sold)

11
ADR Discounting at Twice The Speed of ADR Increases
95
100
105
110
2008 2009 2010 2011
*Total US, ADR $, 12 MMA 2007 - 2011
Apr ‘10 $97
Sept ‘08 $108
Dec ‘11 $102
+4.6%
-10%
19 Months
19 Months

12
3.1
2.6
3.9
2.9
4.1
3.7
4.0
3.5
4.1 4.0
4.4
3.5
3.9
3.1
3.8
2.9
4.6
* Total US, ADR $ % Change, by Month, 1/11 – 1/12, by Week 2/4 – 2/25
... That Being Said, ADRs Are Growing ...
2/4 2/11 2/18 2/25 1/12 1/11 4/11 7/11 9/11 Weekly data

13
Chain Scale Review
14
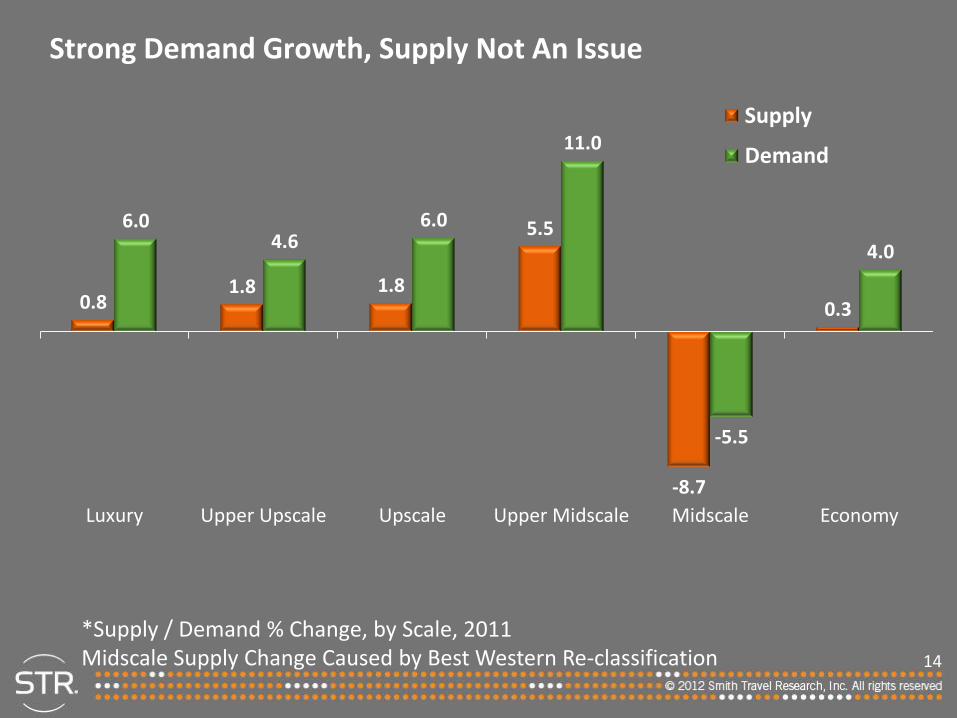
Strong Demand Growth, Supply Not An Issue
0.8 1.8 1.8
5.5
-8.7
0.3
6.0 4.6
6.0
11.0
-5.5
4.0
Luxury Upper Upscale Upscale Upper Midscale Midscale Economy
Supply
Demand
*Supply / Demand % Change, by Scale, 2011 Midscale Supply Change Caused by Best Western Re-classification

15
Early Recovery: OCC % > ADR %
5.2
2.8
4.1
5.2
3.5 3.7
5.7
3.6 3.8 3.3
-0.5
2.2
Luxury Upper Upscale Upscale Upper Midscale Midscale Economy
Occupancy
ADR
*OCC / ADR % Change, by Scale, 2011

16
Upper End Sells 7 out of 10 Rooms Every Night
71.7
70.5 69.6
65.3
58.4 57.0
69.9 69.3 69.5
61.5
53.5 53.5
Luxury Upper Upscale Upscale Upper Midscale Midscale Economy
2007 2011
*Absolute OCC %, by Scale, 2007 & 2011

17
ADR Growth Is Strong – But Not Strong Enough (...yet)
$286
$159
$121
$94 $77
$54
$257
$148
$112 $94
$73
$50
Luxury Upper Upscale Upscale Upper Midscale Midscale Economy
2007 2011
*Absolute ADR $, by Scale, 2007 / 2011

18
Segmentation Review

19
Transient Demand Breaks Records, But....
10
12.5
15
17.5
20
Jan Feb Mar Apr May Jun Jul Aug Sep Oct Nov Dec
2007 2010 2011
*Transient Demand in Millions of Rooms; 2007, 2010, 2011 Data is for upper tier hotels only (LUX & UU chains, & Upper Tier independents)
Mill
ion
s
1/12

20
… Transient ADR Still Lags 2007 Results
$140
$150
$160
$170
$180
$190
Jan Feb Mar Apr May Jun Jul Aug Sep Oct Nov Dec
2007 2010 2011
*Transient ADR $, 2007, 2010, 2011 Data is for upper tier hotels only (LUX & UU chains, & Upper Tier independents)
1/12

21
5.0
4.0
5.9
5.1
5.6
4.8 4.9
3.5
4.4 4.1
4.4
3.2
3.8
1.4
3.3
2.2
4.5
*Transient ADR % by Month, 1/11 – 1/12, by Week 2/4 – 2/25 Data is for upper tier hotels only (LUX & UU chains, & Upper Tier independents)
We Expect Transient ADR Growth To Continue
2/4 2/11 2/18 2/25 1/12 1/11 4/11 7/11 9/11 Weekly data

22
Group Demand Has Not Changed Over Time, But…
4
6
8
10
12
Jan Feb Mar Apr May Jun Jul Aug Sep Oct Nov Dec
Millio
ns
2007 2010 2011
*Group Demand in Millions of Rooms, 2007, 2010, 2011 Data is for upper tier hotels only (LUX & UU chains, & Upper Tier independents)
1/12

23
… Group ADR Does Not Increase (& Could Depress Future Absolute ADRs)
$130
$140
$150
$160
$170
Jan Feb Mar Apr May Jun Jul Aug Sep Oct Nov Dec
2008 2010 2011
*Group ADR $, 2008, 2010, 2011 Data is for upper tier hotels only (LUX & UU chains, & Upper Tier independents)
1/12

24
2.3 1.9
2.2
0.1
3.4
1.9 1.9 1.6
2.8 2.4
3.3
-0.7
2.8
-0.1
5.0
0.7
2.7
*Group ADR % by Month, 1/11 – 1/12, by Week 2/4 – 2/25 Data is for upper tier hotels only (LUX & UU chains, & Upper Tier independents)
Group ADR Growth Is Tepid So Far
2/4 2/11 2/18 2/25 1/12 1/11 4/11 7/11 9/11 Weekly data

25
2012 / 2013 Forecast

26
Rooms Pipeline Still Not An Issue in 2012
Phase Dec 2011 Dec 2010 Dec 2007
In Construction 54 52 211
“Planned Pipeline” 254 265 204
Active Pipeline 308 317 415
*Total US Pipeline, in ‘000s of rooms, by Phase by Year Planned Pipeline includes projects in Final Planning and Planning phases Source: STR / McGraw-Hill Construction Dodge

27
Total United States Forecast 2012 / 2013 Key Performance Indicator % Change
2012 Forecast
2013 Forecast
Supply 0.8% 1.4%
Demand 1.3% 2.0%
Occupancy 0.5% 0.5%
ADR 3.8% 4.4%
RevPAR 4.3% 4.9%

28
Publicly Traded Company 2012 RevPAR Guidance
Company Name Guidance 2012
HOST Hotels & Resorts
Choice Hotels
DiamondRock Hospitality +4-6%
FeCor Lodging Trust
Sunstone Hotel Investors
Marriott International
LaSalle Hotel Properties +5-7%
Starwood Hotels
Wyndham Worldwide +5-8%
Chatham Lodging Trust
Hersha Hospitality +6-8%
Strategic Hotels
Chesapeake Lodging Trust +6.5–8.5%
Pebblebrook Hotel Trust +8-10%

29
Total United States Chain Scale Key Performance Indicator Outlook 2012F by Chain Scale
Chain Scale Occupancy
(% chg) ADR
(% chg) RevPAR (%chg)
Luxury 2.7% 4.7% 7.4%
Upper Upscale 0.1% 3.5% 3.6%
Upscale 2.0% 4.5% 6.6%
Upper Midscale -0.3% 3.7% 3.4%
Midscale 1.0% 0.8% 1.8%
Economy 0.7% 2.4% 3.1%
Independent -0.3% 3.4% 3.1%
Total United States 0.5% 3.8% 4.3%

30