u.s. local governments: methodology and...
TRANSCRIPT
Permission to reprint or distribute any content from this presentation requires the prior written approval of
Standard & Poor’s. Copyright © 2013 by Standard & Poor’s Financial Services LLC. All rights reserved.
U.S. Local Governments: Methodology And Assumptions - An Overview of S&P’s Local GO Criteria and Top 10 Management Characteristics of Highly Rated U.S. Public Finance Issuers
MASSACHUSETTS COLLECTORS AND TREASURERS ASSOCIATION 44th ANNUAL SCHOOL UNIVERSITY OF MASSACHUSETTS, AMHERST, MA

Agenda
• What are credit ratings
• Overview of Criteria and Analytic Framework for Local Governments
• MA Credit Strengths and Weaknesses
• Revisiting Management Conditions and Top 10 Management Characteristics of Highly Rated U.S. Public Finance Issuers
2
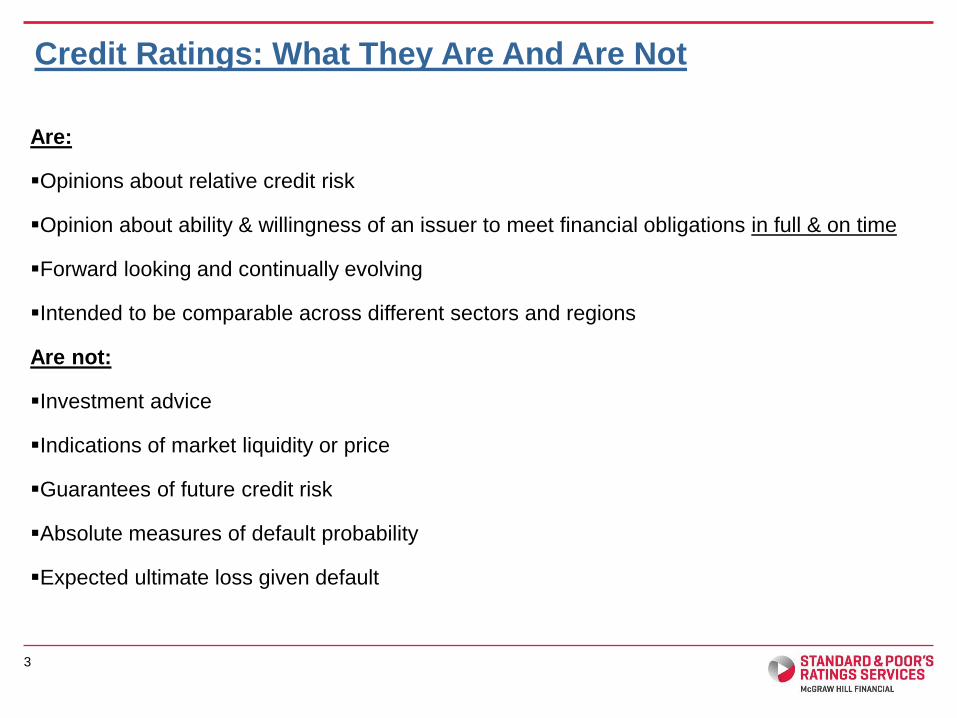
Are:
Opinions about relative credit risk
Opinion about ability & willingness of an issuer to meet financial obligations in full & on time
Forward looking and continually evolving
Intended to be comparable across different sectors and regions
Are not:
Investment advice
Indications of market liquidity or price
Guarantees of future credit risk
Absolute measures of default probability
Expected ultimate loss given default
3
Credit Ratings: What They Are And Are Not
4
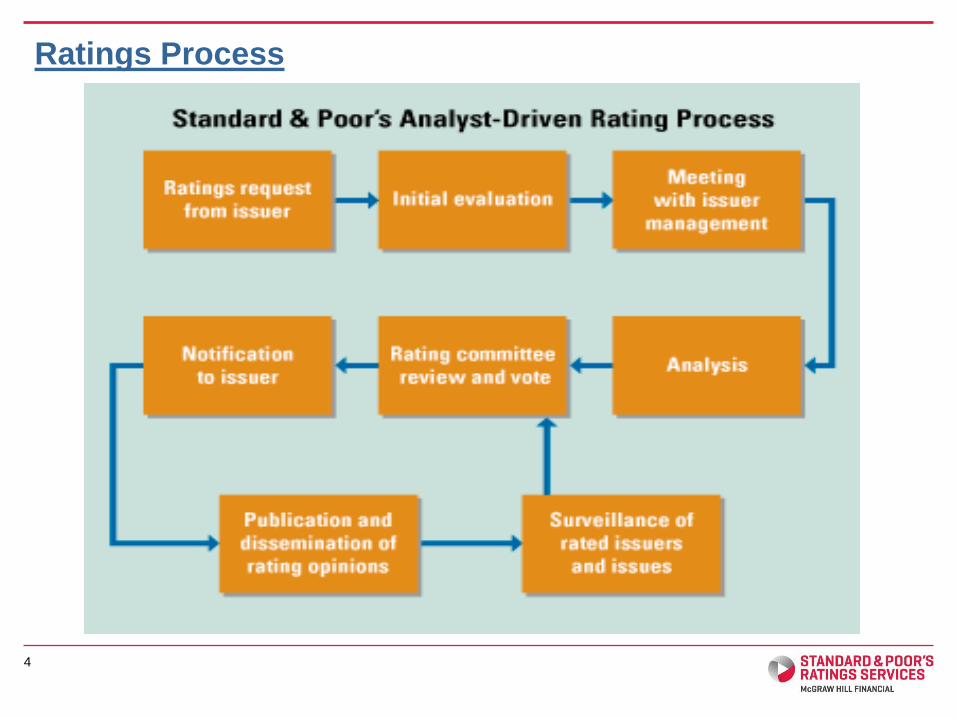
Ratings Process

Economy
30%
Management
20% Liquidity
10%
Budgetary
Performance
10%
Budgetary
Flexibility
10%
Debt & Contingent
Liabilities
10%
Financial Measures
Indicative Rating
Positive Overriding Factors
•High income levels (1 or 2
notch adjustment)
•Sustained high fund
balances (1 notch
adjustment)
Negative Overriding Factors
•Weak liquidity (caps rating at A- or BB+)
•Weak management (caps rating at A or BBB-)
•Lack of willingness to pay obligations (caps
rating at BBB- for leases and B for debt)
•Low market value per capita (1 notch
adjustment)
•Large or chronic negative fund balances (caps
rating at A+, A-, or BBB)
•Budgetary flexibility score of 5 (cap at A+)
•Low nominal fund balance (1 notch adjustment)
•Structural imbalance (caps rating at BBB+)
Final Rating
Institutional
Framework
10%
Local Government Analytical Rating Framework
Source: Standard & Poor’s Ratings Services. 5

Summary of the Factors
Revisiting The Local GO Criteria Factors
6

Institutional Framework (1 of 7 Factors)
Assesses the legal and practical environment in which the local government operates
The score is based on the average of four discretely scored areas
• Predictability: the extent to which a local government can forecast its revenues and expenditures on an ongoing basis
• Revenue and expenditure balance: the extent to which a local governments have the ability to finance the services they provide
• Transparency and accountability: the overall institutional framework’s role in encouraging the transparency and comparability of relative financial information
• Systemic support: the extent to which local governments receive extraordinary support from a state government when the local government is under extreme stress
7
Institutional
Framework
10%

Economic Score (2 of 7 Factors)
• Assess both the health of the asset base relied upon to provide both current and future
locally derived revenues as well as the likelihood of additional service demands resulting
from economic deterioration
• The initial score (1 - very strong) through (5 - very weak) is based on market value per
capita and projected per capita income as a % of U.S.
• Per capita income is based on a 5-year projection
• Especially high income will lead to a positive override and especially low market value
per capita will lead to a negative override
Total Market Value Per Capita
Projected Per Capita
EBI as a % of U.S.
Projected Per Capita
EBI
>$195,000 $100,000 to
$195,000
$80,000 to
$100,000
$55,000 to
$80,000 <$55,000
>150 1 1.5 2 2.5 3
110 to150 1.5 2 2.5 3 3.5
85 to110 2 2.5 3 3.5 4
70 to 85 2.5 3 3.5 4 4.5
<70 3 3.5 4 4.5 5
Source: Standard & Poor’s Ratings Services. 8
Economy
30%
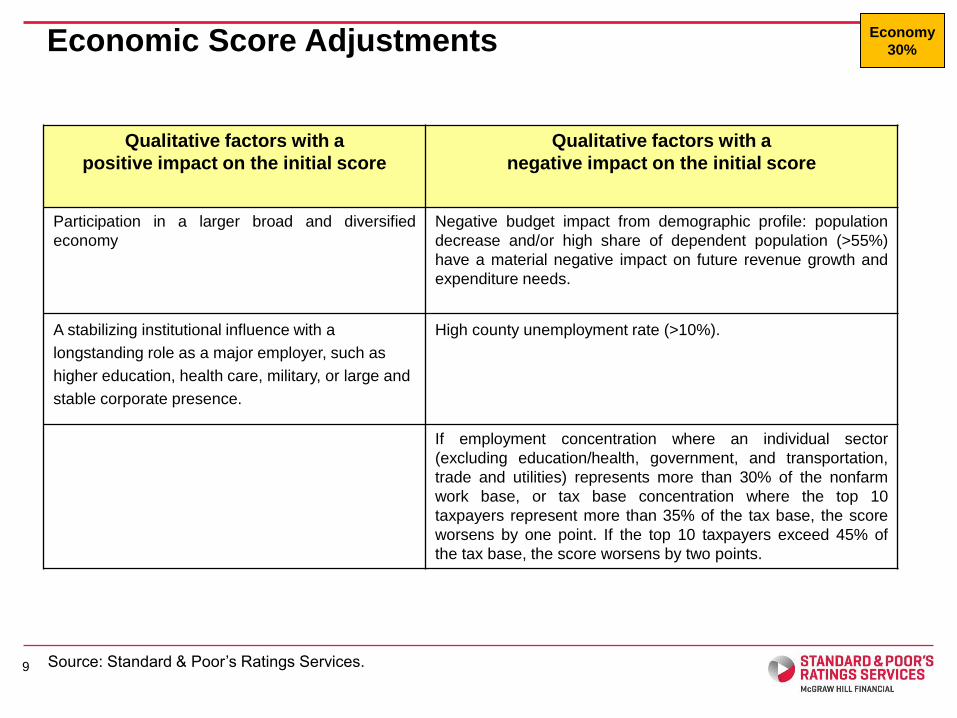
Economic Score Adjustments
Qualitative factors with a
positive impact on the initial score
Qualitative factors with a
negative impact on the initial score
Participation in a larger broad and diversified
economy
Negative budget impact from demographic profile: population
decrease and/or high share of dependent population (>55%)
have a material negative impact on future revenue growth and
expenditure needs.
A stabilizing institutional influence with a
longstanding role as a major employer, such as
higher education, health care, military, or large and
stable corporate presence.
High county unemployment rate (>10%).
If employment concentration where an individual sector
(excluding education/health, government, and transportation,
trade and utilities) represents more than 30% of the nonfarm
work base, or tax base concentration where the top 10
taxpayers represent more than 35% of the tax base, the score
worsens by one point. If the top 10 taxpayers exceed 45% of
the tax base, the score worsens by two points.
Source: Standard & Poor’s Ratings Services. 9
Economy
30%

Management Score (3 of 7 Factors)
• Assess the impact of management conditions on the likelihood of repayment
• The proposed Financial Management Assessment (FMA) is based upon our current methodology
Source: Standard & Poor’s Ratings Services.
Table 9: Assessing the Management Score (see paragraphs 47-56)
Rounded Score Characteristics
1 (Very strong) FMA score of “strong” and none of the factors in score ‘4‘ or ‘5’ is present.
2 (Strong) FMA score of “good” and none of the factors in score ‘4‘ or ‘5’ is present.
3 (Adequate) FMA score of “standard” and none of the factors in score ‘4‘ or ‘5’ is present.
4 (Weak) FMA score of “vulnerable” or any of the following is present: there is a financial reporting
restatement that has a material negative impact; any of the conditions in score ‘5’ existed in
the past three years; the structural imbalance override condition exists or existed within the past three
years; or a very high debt, pension and OPEB burden.
5 (Very weak)
Regardless of the FMA score, any of the following is present: a management team that
lacks relevant skills resulting in a weak capacity for planning, monitoring, and
management; an auditor has delivered a going concern opinion; the government appears
unwilling to support a debt or capital lease obligation; or the government is actively
considering bankruptcy in the near term
10
Management
20%

Management Score (3 of 7 Factors)
Source: Standard & Poor’s Ratings Services. 11
1. Revenue and expenditure assumptions 2. Budget amendments and updates 3. Long term financial planning 4. Long term capital planning 5. Investment management policies 6. Debt management policies 7. Reserve and liquidity policies
Institutional
Framework
10%

Financial Measures
• Three components factor into our assessment of a municipality’s financial credit characteristics
• Budgetary flexibility, budgetary performance, and liquidity
• Each factor is weighted 10% — all financial measures together are 30%
Liquidity
10%
Budgetary
Performance
10%
Budgetary
Flexibility
10%
Financial Measures

Financial Measures: Budgetary Flexibility Score (4 of 7 Factors)
The budgetary flexibility initial score measures the degree to which the government can create additional financial flexibility in times of stress
• Available fund balance as a % of general fund expenditures: the average of the most recently reported fiscal year and our estimate for the following year, which may differ from that shown in the original or amended budget
• When other fund balances outside of the government’s general fund are available beyond the current fiscal year, they are included in the calculation
• This measure can cap a rating or it can be a positive override if extremely strong
Budgetary
Flexibility
10%
Source: Standard & Poor’s Ratings Services. 13
Budgetary Flexibility Ranges
available reserves as a percent of expenditures
Very Strong (1) > 15%
Strong (2) 8% to 15%
Adequate (3) 4 to 8
Weak (4) 1 to 4
Very Weak (5) < 1%
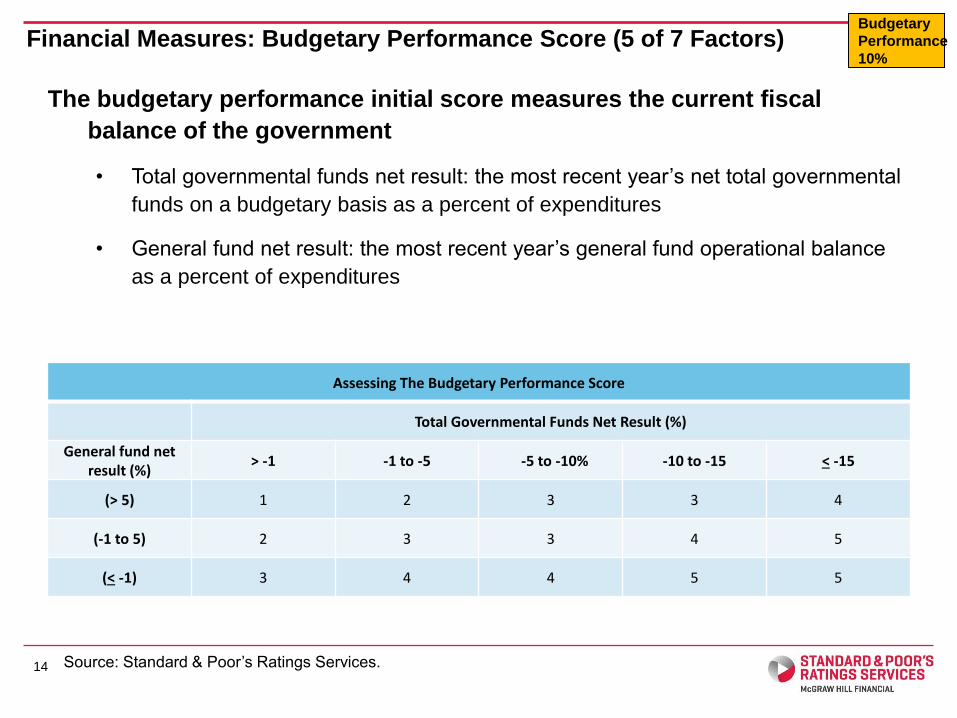
Financial Measures: Budgetary Performance Score (5 of 7 Factors)
The budgetary performance initial score measures the current fiscal
balance of the government
• Total governmental funds net result: the most recent year’s net total governmental
funds on a budgetary basis as a percent of expenditures
• General fund net result: the most recent year’s general fund operational balance
as a percent of expenditures
Source: Standard & Poor’s Ratings Services. 14
Assessing The Budgetary Performance Score
Total Governmental Funds Net Result (%)
General fund net result (%)
> -1 -1 to -5 -5 to -10% -10 to -15 < -15
(> 5) 1 2 3 3 4
(-1 to 5) 2 3 3 4 5
(< -1) 3 4 4 5 5
Budgetary
Performance
10%

Financial Measures: Liquidity Score (6 of 7 Factors)
The initial score measures the availability of cash and cash equivalents to service both debt and other expenditures
Initial liquidity score: combination of two measures
• Total government cash as % of total governmental funds debt service
• Total cash % of total governmental funds expenditures
Source: Standard & Poor’s Ratings Services. 15
Table 12: Assessing The Liquidity Score (see paragraphs 68-72)
Total Government Available Cash As % Of Total Governmental Funds Debt Service
Total Government Available Cash As %
Of Total Governmental Funds
Expenditures
>120 100 to120 80 to100 40 to 80 <40
>15 1 2 3 4 5
8 to15 2 2 3 4 5
4 to 8 3 3 3 4 5
1 to 4 4 4 4 4 5
<1 5 5 5 5 5
Liquidity
10%

Debt and Contingent Liability (7 of 7 Factors)
Initial debt score: combination of two measures
• Total governmental funds debt service as a percentage of expenditures
o Measures the annual fixed cost burden that debt places on the government
• Net direct debt as a percentage of total governmental funds revenue
o Measures the total debt burden on the government's revenue position rather than the annual cost of the debt, which can be manipulated by amortization structures
Source: Standard & Poor’s Ratings Services. 16
Assessing The Debt And Contingent Liabilities Score
Net Direct Debt As % Of Total Governmental Funds Revenue
TGF Debt
Service As A %
of TGF
Expenditures
<30 30 to 60 60 to 120 120 to 180 >180
< 8 1 2 3 4 5
8 to 15 2 3 4 4 5
15 to 25 3 4 5 5 5
25 to 35 4 4 5 5 5
>35 4 5 5 5 5
Debt & Contingent
Liability
10%
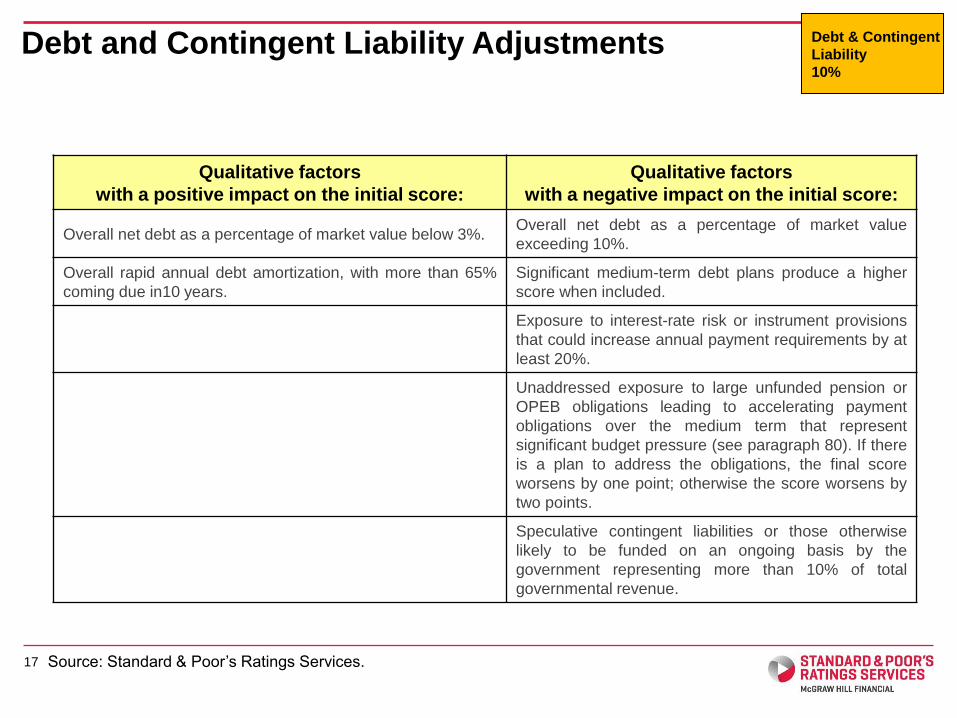
Debt and Contingent Liability Adjustments
Qualitative factors
with a positive impact on the initial score:
Qualitative factors
with a negative impact on the initial score:
Overall net debt as a percentage of market value below 3%. Overall net debt as a percentage of market value
exceeding 10%.
Overall rapid annual debt amortization, with more than 65%
coming due in10 years.
Significant medium-term debt plans produce a higher
score when included.
Exposure to interest-rate risk or instrument provisions
that could increase annual payment requirements by at
least 20%.
Unaddressed exposure to large unfunded pension or
OPEB obligations leading to accelerating payment
obligations over the medium term that represent
significant budget pressure (see paragraph 80). If there
is a plan to address the obligations, the final score
worsens by one point; otherwise the score worsens by
two points.
Speculative contingent liabilities or those otherwise
likely to be funded on an ongoing basis by the
government representing more than 10% of total
governmental revenue.
Source: Standard & Poor’s Ratings Services. 17
Debt & Contingent
Liability
10%

• Participate in or are near exceptionally broad and diversified economies.
• Exhibit extremely strong, mature and diverse tax base.
• Have stronger household income measures
• Demonstrate stable and predictable revenue sources – property/sales tax.
• Carry sufficient budgetary reserves and better budget flexibility.
• Practice good financial management.
• Show a low fixed debt burden, with most having what we consider to be an aggressive principal debt amortization schedule and no contingent liquidity risks.
Positive Credit Factors: Relative to national peers S&P rated Massachusetts cities/towns
18

• Are built-out communities with many having minimal prospects for organic tax base growth.
• Older, slower-growing population than the U.S. and slower-growing employment.
• Constrained ability to raise revenues if needed due to tax caps.
• Limited flexibility in managing labor costs.
• Higher pension and retiree health liabilities.
19
Negative Credit Factors: Relative to national peers S&P rated Massachusetts cities/towns

Revisiting the Management Factor
20

• Revenue and Expenditure Assumptions
• Budget Amendments and Updates
• Long-term Financial Planning
• Long-term Capital Planning
• Investment Management Policies
• Debt Management Policies
• Reserve and Liquidity Policies
21
Revisiting the FMA:
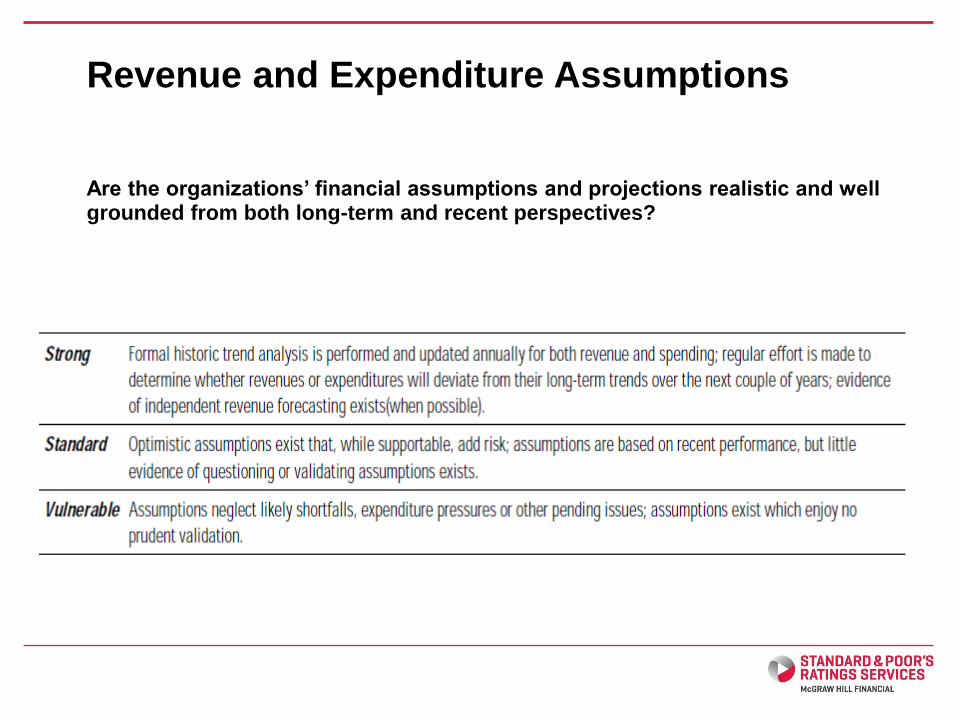
Revenue and Expenditure Assumptions
Are the organizations’ financial assumptions and projections realistic and well grounded from both long-term and recent perspectives?

Budget Amendments and Updates
Are there procedures for reviewing and amending the budget based on updated information and actual performance to ensure fiscal targets are met?
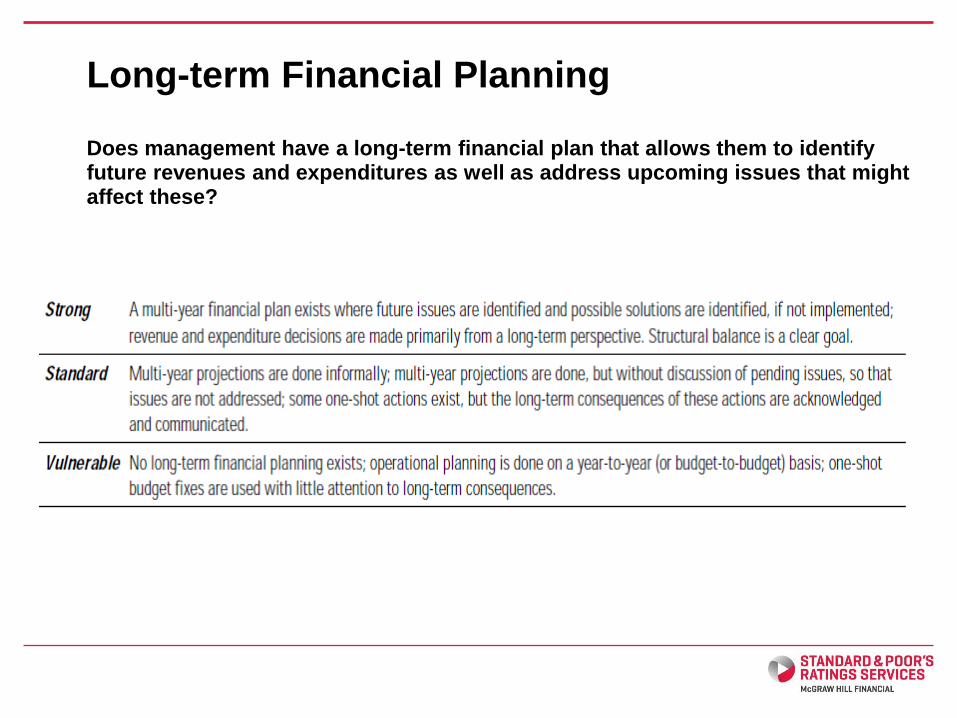
Long-term Financial Planning
Does management have a long-term financial plan that allows them to identify future revenues and expenditures as well as address upcoming issues that might affect these?

Long-term Capital Planning
Has the organization created a long-term capital improvement program?
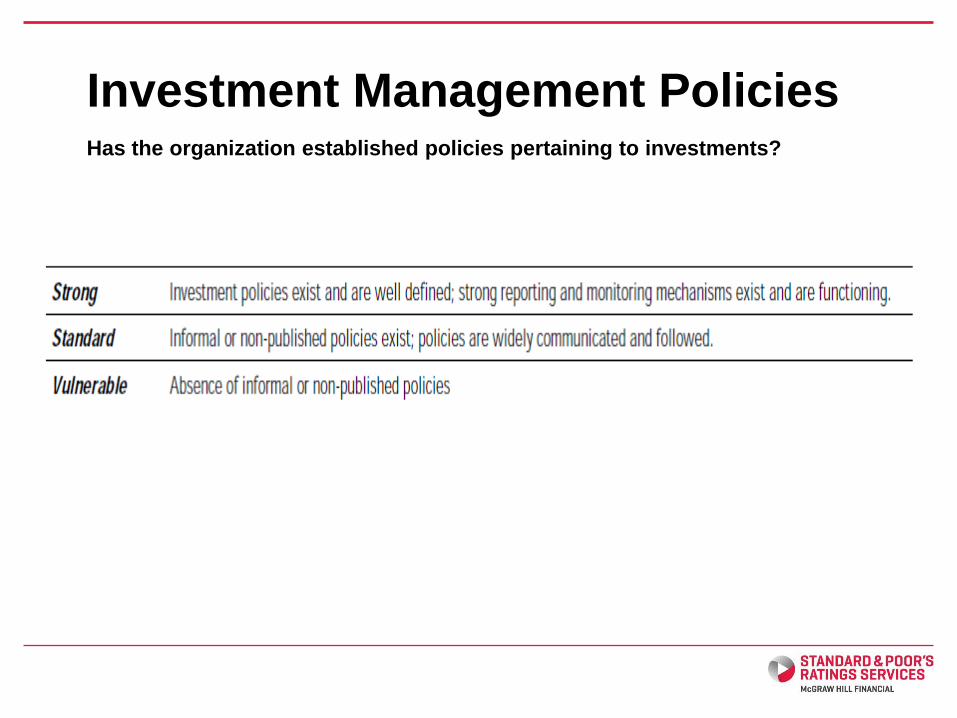
Investment Management Policies
Has the organization established policies pertaining to investments?

Debt Management Policies
Has the organization established policies on debt issuance; maturity and debt service structure; use of security and pledges, credit enhancement, and derivatives?

Reserve and Liquidity Policies
Has the organization established a formalized operating reserve policy, which takes into account the governments cash flow/operating requirements and the historic volatility of revenues and expenditures through economic cycles?
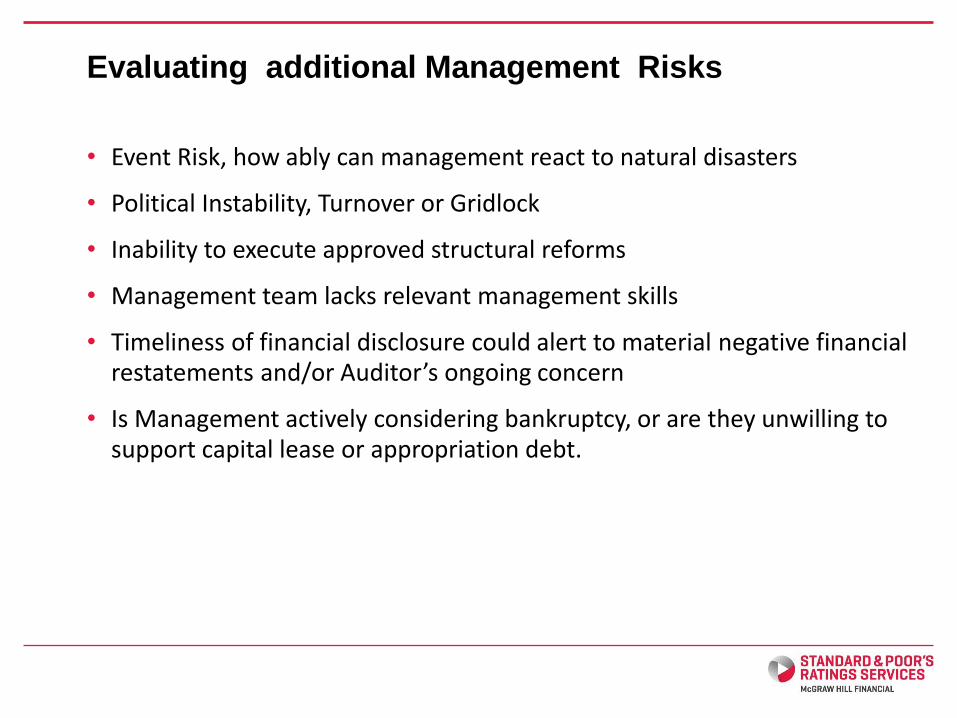
Evaluating additional Management Risks
• Event Risk, how ably can management react to natural disasters
• Political Instability, Turnover or Gridlock
• Inability to execute approved structural reforms
• Management team lacks relevant management skills
• Timeliness of financial disclosure could alert to material negative financial restatements and/or Auditor’s ongoing concern
• Is Management actively considering bankruptcy, or are they unwilling to support capital lease or appropriation debt.

Standard & Poor’s CONFIDENTIAL & PROPRIETARY 30 McGraw Hill Financial |
Top 10 Management Characteristics of Highly Rated U.S. Public Finance Issuers
Management and administrative characteristics can move a rating up or down more significantly and swiftly than any other factor.
S&P published a list of some distinct commonalities in the management practices of highly rated U.S. public finance issuers over the years.

Standard & Poor’s CONFIDENTIAL & PROPRIETARY 31 McGraw Hill Financial |
1. Focus on structural balance
• Some issuers view a balanced budget as:
– current revenues + available reserves = operating expenditures
• S&P views a balanced budget as:
– recurring revenues = recurring expenditures
• Highly rated credits:
– Maintain or quickly return to structural balance during a period of economic weakness.
– Are not reliant on one-time revenues to fund ongoing expenditures.

Standard & Poor’s CONFIDENTIAL & PROPRIETARY 32 McGraw Hill Financial |
2. Strong liquidity management
• Ability to manage cash flow and identify potential issues.
• Sufficient money to meet debt obligations.
• Access to pooled cash or interfund loan is not enough, accountability of where cash comes from and how to pay back is important.
• Liquidity risk often tie to variable rate demand obligations or other debt instruments.

Standard & Poor’s CONFIDENTIAL & PROPRIETARY 33 McGraw Hill Financial |
3. Regular economic and revenue updates to identify shortfalls early
• Regular intervals is a key feature of stable financial performance.
• Evaluate historical performance of key revenues is important because each government has different leading or lagging economic indicators that signal potential revenue variance issues based on its economic structure.
• It’s also important to identify a surge in revenues to determine if the trend is short term or sustainable.

Standard & Poor’s CONFIDENTIAL & PROPRIETARY 34 McGraw Hill Financial |
4. An established rainy day/budget stabilization reserve
• Formalized financial reserve policy is a consistent feature of most S&P’s highly rate credits.
• Factors to establish the level:
– Cash flow/operating requirement
– Volatility of revenue/expenditures, and
– Susceptibility to a natural disaster
Standard & Poor’s CONFIDENTIAL & PROPRIETARY 35 McGraw Hill Financial |
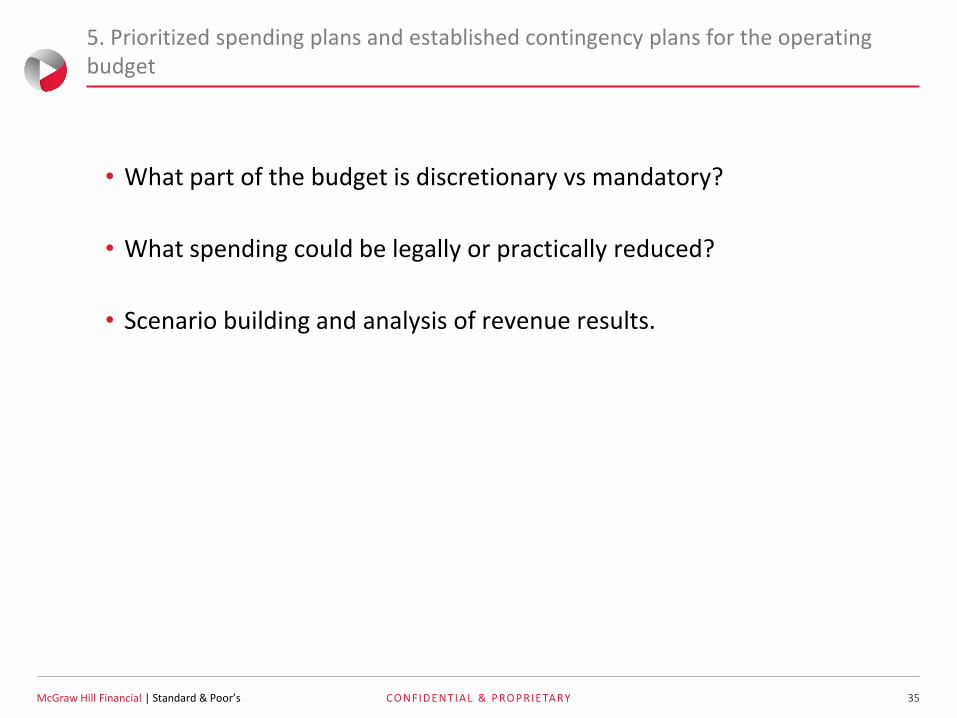
5. Prioritized spending plans and established contingency plans for the operating budget
• What part of the budget is discretionary vs mandatory?
• What spending could be legally or practically reduced?
• Scenario building and analysis of revenue results.

Standard & Poor’s CONFIDENTIAL & PROPRIETARY 36 McGraw Hill Financial |
6. Strong long-term and contingent liability management
• Growing pension and OPEB pay-as-you-go and unfunded liabilities.
• Management of non-essential government operations such as stadiums, convention centers, golf course.

Standard & Poor’s CONFIDENTIAL & PROPRIETARY 37 McGraw Hill Financial |
7. Multiyear financial plan that considers the affordability of actions
• Is the plan comprehensive and based on realistic assumptions?
– Putting a general inflator across all expenditures and revenues might not work for all line items.
• Plan often has out-year gaps projected, which would allow governments to work out, in advance, the optimal method of restoring fiscal balance.

Standard & Poor’s CONFIDENTIAL & PROPRIETARY 38 McGraw Hill Financial |
8. A formal debt management policy to evaluate future debt profile
• Many highly rated governments have developed debt affordability guidelines or models, such as:
– Debt as a percentage of market value;
– Debt as a percentage of operating expenditures;
– Variable rate debt does not exceed X% of total debt;
– Amortization of debt to be no longer than X years, etc.
Standard & Poor’s CONFIDENTIAL & PROPRIETARY 39 McGraw Hill Financial |
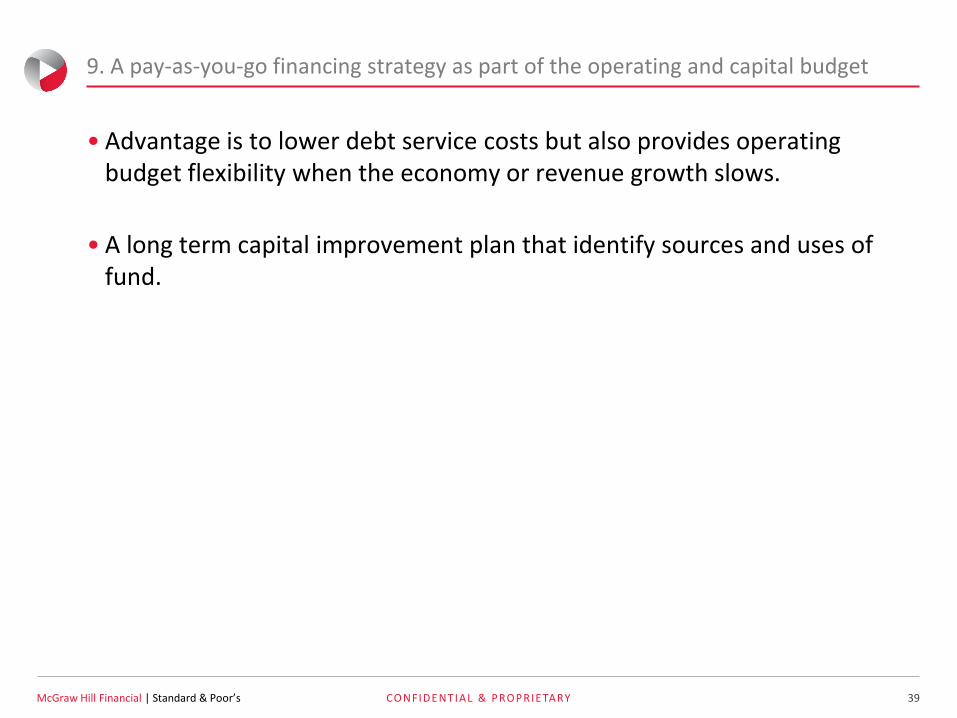
9. A pay-as-you-go financing strategy as part of the operating and capital budget
• Advantage is to lower debt service costs but also provides operating budget flexibility when the economy or revenue growth slows.
• A long term capital improvement plan that identify sources and uses of fund.

Standard & Poor’s CONFIDENTIAL & PROPRIETARY 40 McGraw Hill Financial |
10. A well-defined and coordinated economic development strategy
• How significant a resource commitment should be dedicated to running economic development programs and offering incentives?
• Synergies of activities to create employment, enhance diversification, and generate solid income growth.
• Coordinated effort between state and local governments.

Standard & Poor’s CONFIDENTIAL & PROPRIETARY 41 McGraw Hill Financial |
Top 10 Management Characteristics of Highly Rated U.S. Public Finance Issuers
FMA Category Example from Article
Revenue and expenditure assumptions 1
Budget amendments and updates 2, 3, 5
Long term financial planning 7
Long term capital planning 9
Investment management policies 2
Debt management policies 6, 8
Reserve and liquidity policies 2, 4
Proactive budget and liability planning, strong liquidity management,
and the establishment of reserves are among the factors the strongest issuer share

Copyright © 2013 by Standard & Poor’s Financial Services LLC. All rights reserved.
No content (including ratings, credit-related analyses and data, valuations, model, software or other application or output therefrom) or any part thereof (Content) may be modified,
reverse engineered, reproduced or distributed in any form by any means, or stored in a database or retrieval system, without the prior written permission of Standard & Poor’s
Financial Services LLC or its affiliates (collectively, S&P). The Content shall not be used for any unlawful or unauthorized purposes. S&P and any third-party providers, as well as their
directors, officers, shareholders, employees or agents (collectively S&P Parties) do not guarantee the accuracy, completeness, timeliness or availability of the Content. S&P Parties
are not responsible for any errors or omissions (negligent or otherwise), regardless of the cause, for the results obtained from the use of the Content, or for the security or
maintenance of any data input by the user. The Content is provided on an “as is” basis. S&P PARTIES DISCLAIM ANY AND ALL EXPRESS OR IMPLIED WARRANTIES,
INCLUDING, BUT NOT LIMITED TO, ANY WARRANTIES OF MERCHANTABILITY OR FITNESS FOR A PARTICULAR PURPOSE OR USE, FREEDOM FROM BUGS,
SOFTWARE ERRORS OR DEFECTS, THAT THE CONTENT’S FUNCTIONING WILL BE UNINTERRUPTED OR THAT THE CONTENT WILL OPERATE WITH ANY SOFTWARE
OR HARDWARE CONFIGURATION. In no event shall S&P Parties be liable to any party for any direct, indirect, incidental, exemplary, compensatory, punitive, special or
consequential damages, costs, expenses, legal fees, or losses (including, without limitation, lost income or lost profits and opportunity costs or losses caused by negligence) in
connection with any use of the Content even if advised of the possibility of such damages.
Credit-related and other analyses, including ratings, and statements in the Content are statements of opinion as of the date they are expressed and not statements of fact. S&P’s
opinions, analyses and rating acknowledgment decisions (described below) are not recommendations to purchase, hold, or sell any securities or to make any investment decisions,
and do not address the suitability of any security. S&P assumes no obligation to update the Content following publication in any form or format. The Content should not be relied on
and is not a substitute for the skill, judgment and experience of the user, its management, employees, advisors and/or clients when making investment and other business decisions.
S&P does not act as a fiduciary or an investment advisor except where registered as such. While S&P has obtained information from sources it believes to be reliable, S&P does not
perform an audit and undertakes no duty of due diligence or independent verification of any information it receives.
To the extent that regulatory authorities allow a rating agency to acknowledge in one jurisdiction a rating issued in another jurisdiction for certain regulatory purposes, S&P reserves
the right to assign, withdraw or suspend such acknowledgement at any time and in its sole discretion. S&P Parties disclaim any duty whatsoever arising out of the assignment,
withdrawal or suspension of an acknowledgment as well as any liability for any damage alleged to have been suffered on account thereof.
S&P keeps certain activities of its business units separate from each other in order to preserve the independence and objectivity of their respective activities. As a result, certain
business units of S&P may have information that is not available to other S&P business units. S&P has established policies and procedures to maintain the confidentiality of certain
non-public information received in connection with each analytical process.
S&P may receive compensation for its ratings and certain analyses, normally from issuers or underwriters of securities or from obligors. S&P reserves the right to disseminate its
opinions and analyses. S&P's public ratings and analyses are made available on its Web sites, www.standardandpoors.com (free of charge), and www.ratingsdirect.com and
www.globalcreditportal.com (subscription), and may be distributed through other means, including via S&P publications and third-party redistributors. Additional information about our
ratings fees is available at www.standardandpoors.com/usratingsfees.
STANDARD & POOR’S, S&P, GLOBAL CREDIT PORTAL and RATINGSDIRECT are registered trademarks of Standard & Poor’s Financial Services LLC.
42