u.s. history 2010 - national center for education ... · for the 2010 national assessment of...
TRANSCRIPT

U.S. History 2010 NATIONAL ASSESSMENT OF EDUCATIONAL PROGRESS AT GRADES 4, 8, AND 12
With highlighted results from the 2009 High School Transcript Study
U.S. Department of EducationNCES 2011–468
I n s t i t u t e o f E d u c a t i o n S c i e n c e s

Contents
1 Executive Summary
4 Introduction
7 Grade 4
21 Grade 8
36 Grade 12
49 – High School Transcript Study Results
52 Technical Notes
55 Appendix Tables
What Is The Nation’s Report Card™?
The Nation’s Report Card™ informs the public about the academic achieve-ment of elementary and secondary students in the United States. Report cards communicate the findings of the National Assessment of Educational Progress (NAEP), a continuing and nationally representative measure of achievement in various subjects over time.
Since 1969, NAEP assessments have been conducted periodically in reading, mathematics, science, writing, U.S. history, civics, geography, and other subjects. NAEP collects and reports information on student performance at the national and state levels, making the assessment an integral part of our nation’s evaluation of the condition and progress of education. Only academic achievement data and related background information are collected. The privacy of individual students and their families is protected.
NAEP is a congressionally authorized project of the National Center for Education Statistics (NCES) within the Institute of Education Sciences of the U.S. Department of Education. The Commissioner of Education Statistics is responsible for carrying out the NAEP project. The National Assessment Governing Board oversees and sets policy for NAEP.
Photo Credits:© Joe Sohm/Visions of America, LLC/Alamy #AM15KF; © Ocean Photography/Veer #PDP0326197; © Alistair Scott/iStockphoto #1941697; © Christopher Futcher/iStockphoto #15222870; © Stephan Zabel/iStockphoto #14920875; © DNY59/iStockphoto #1454889; © onur ersin/iStockphoto #12633617; © spxChrome/iStockphoto #1836238; © Hodag Media/iStockphoto #11939640; © RiverNorthPhotography/iStockphoto #12360596; © Chris Scredon/iStockphoto #6512313; © Sean Locke/iStockphoto #13709712; © Time & Life Pictures/Getty Images #50694617; © bobbieo/iStockphoto #138979; © naphtalina/iStockphoto #5885818; © Sean Locke/iStockphoto #10526470; © fotoVoyager/iStockphoto #15003726; © Neustockimages/iStockphoto #10713683; © Andreea Manciu/iStockphoto #2453129; © Gamma-Keystone/Getty Images #105220851; © Jani Bryson/iStockphoto #15580919; © Library of Congress #LC-USZ62-115628; © North Wind Picture Archives/Alamy #A8FDN2; © Fuse/Jupiterimages #88257190; © Ableimages/Digital Vision/Jupiterimages #200474360; © Carmen Martínez Banús/iStockphoto #14370710; © Ryan McVay/Photodisc/Getty Images #AA009688; © Thinkstock/Comstock Images/Getty Images #92573406; © Grady Reese/iStockphoto #13559183; © Pgiam/iStockphoto #13304833; © Brandon Laufenberg/iStockphoto #15106812; © Library of Congress #LC-USZ62-76385; © Doug Steley/Alamy #A920D4; © Soubrette/iStockphoto #2979002; © Stephen Rees/iStockphoto #3706296; © Greg Cooksey/iStockphoto 13859071; © Larry T. Hodge; © Big Cheese Photo/Jupiterimages #76649166; © Stockbyte/Jupiterimages #57638798; © Bartomeu Amengual/Creatas/Jupiterimages #89006601; © Aldo Murillo/iStockphoto #6566992; © Sally Scott/iStockphoto #3258511; © Steven Wynn/iStockphoto #9960697; © Getty Images/Photos.com/Jupiterimages #87789793; © Christopher Futcher/iStockphoto #10686935; © Aldo Murillo/iStockphoto #7697684; © John Morton Blum. Used by permission of Houghton-Mifflin Harcourt Publishing Company; © Duncan Walker/iStockphoto #15440062; © Orietta Gaspari/iStockphoto #14418173; © Heather Nemec/iStockphoto #3748174
Executive SummaryFor the 2010 National Assessment of Educational Progress (NAEP) in U.S. history, students responded to questions designed to measure their knowledge of American history in the context of democracy, culture, technological and economic changes, and America’s changing world role. Nationally representative samples of more than 7,000 fourth-graders, 11,000 eighth-graders, and 12,000 twelfth-graders participated.
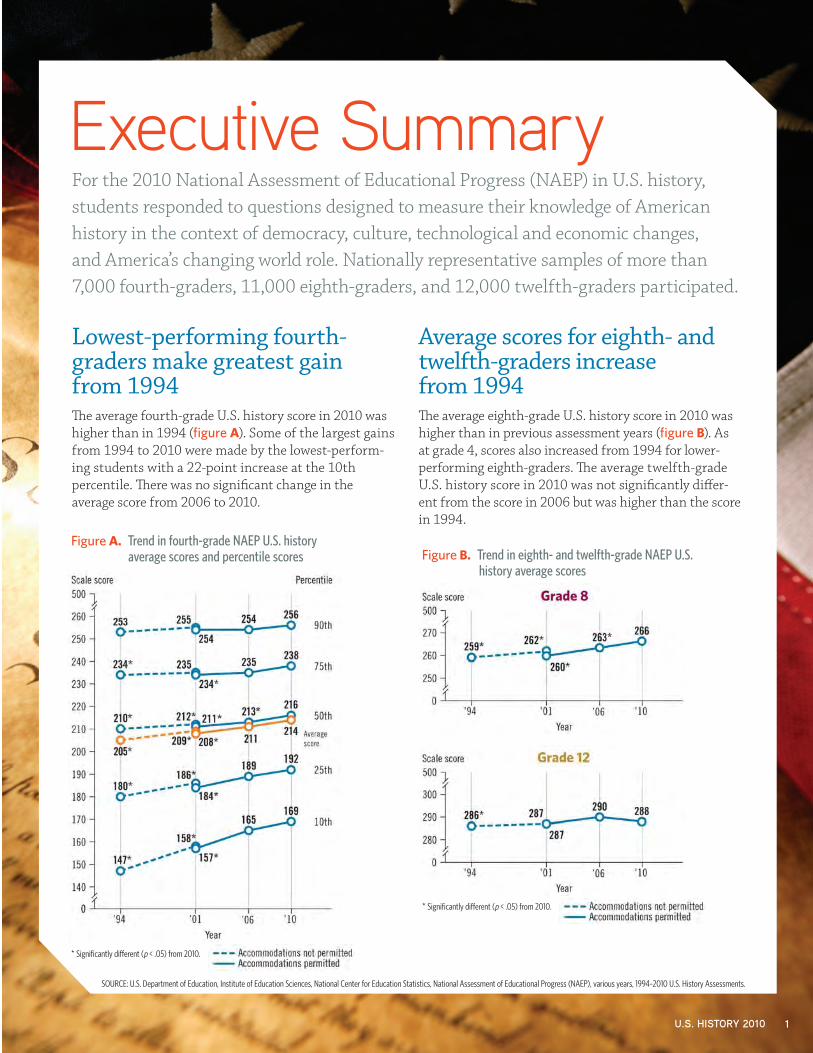
Lowest-performing fourth-graders make greatest gain from 1994The average fourth-grade U.S. history score in 2010 was higher than in 1994 (figure A). Some of the largest gains from 1994 to 2010 were made by the lowest-perform-ing students with a 22-point increase at the 10th percentile. There was no significant change in the average score from 2006 to 2010.
Average scores for eighth- and twelfth-graders increase from 1994 The average eighth-grade U.S. history score in 2010 was higher than in previous assessment years (figure B). As at grade 4, scores also increased from 1994 for lower-performing eighth-graders. The average twelfth-grade U.S. history score in 2010 was not significantly differ-ent from the score in 2006 but was higher than the score in 1994.
Figure A. Trend in fourth-grade NAEP U.S. history average scores and percentile scores
* Significantly different (p < .05) from 2010.
Figure B. Trend in eighth- and twelfth-grade NAEP U.S. history average scores
* Significantly different (p < .05) from 2010.
SOURCE: U.S. Department of Education, Institute of Education Sciences, National Center for Education Statistics, National Assessment of Educational Progress (NAEP), various years, 1994–2010 U.S. History Assessments.
U.S. HISTORY 2010 1
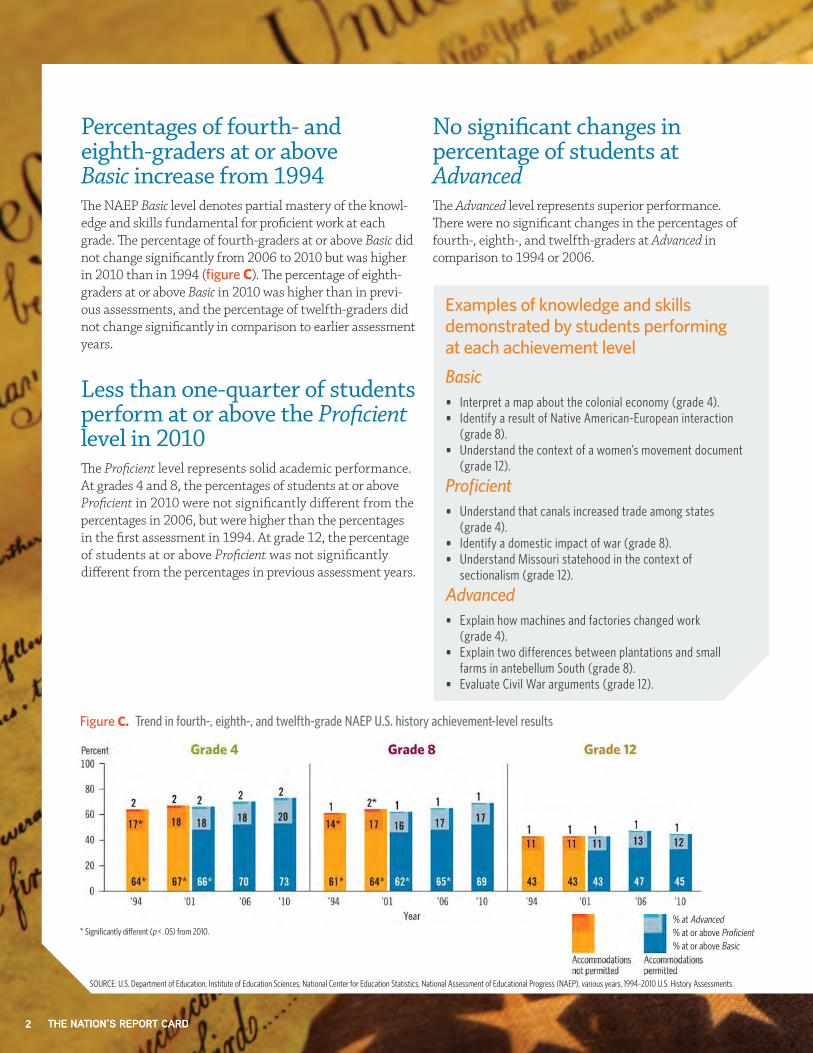
Percentages of fourth- and eighth-graders at or above Basic increase from 1994The NAEP Basic level denotes partial mastery of the knowl-edge and skills fundamental for proficient work at each grade. The percentage of fourth-graders at or above Basic did not change significantly from 2006 to 2010 but was higher in 2010 than in 1994 (figure C). The percentage of eighth-graders at or above Basic in 2010 was higher than in previ-ous assessments, and the percentage of twelfth-graders did not change significantly in comparison to earlier assessment years.
Figure C. Trend in fourth-, eighth-, and twelfth-grade NAEP U.S. history achievement-level results
% at Advanced% at or above Proficient% at or above
* Significantly different (p < .05) from 2010.
Less than one-quarter of students perform at or above the Proficient level in 2010The Proficient level represents solid academic performance. At grades 4 and 8, the percentages of students at or above Proficient in 2010 were not significantly different from the percentages in 2006, but were higher than the percentages in the first assessment in 1994. At grade 12, the percentage of students at or above Proficient was not significantly different from the percentages in previous assessment years.
No significant changes in percentage of students at AdvancedThe Advanced level represents superior performance. There were no significant changes in the percentages of fourth-, eighth-, and twelfth-graders at Advanced in comparison to 1994 or 2006.
Basic
Examples of knowledge and skills demonstrated by students performing at each achievement levelBasic• Interpret a map about the colonial economy (grade 4).• Identify a result of Native American-European interaction
(grade 8).• Understand the context of a women’s movement document
(grade 12).
Proficient• Understand that canals increased trade among states
(grade 4).• Identify a domestic impact of war (grade 8).• Understand Missouri statehood in the context of
sectionalism (grade 12).
Advanced• Explain how machines and factories changed work
(grade 4).• Explain two differences between plantations and small
farms in antebellum South (grade 8).• Evaluate Civil War arguments (grade 12).
SOURCE: U.S. Department of Education, Institute of Education Sciences, National Center for Education Statistics, National Assessment of Educational Progress (NAEP), various years, 1994–2010 U.S. History Assessments.
2 THE NATION’S REPORT CARD 2 THE NATION’S REPORT CARD

Scores increase since 2006 for Black and Hispanic eighth-gradersAt grade 8, increases since 2006 for Black and Hispanic students contributed to a narrowing of the score gaps between those groups and their White peers. There were no significant changes from 2006 to 2010 in the average scores for racial/ethnic groups at grades 4 and 12.
In comparison to 1994, scores were higher in 2010 for those racial/ethnic groups with samples large enough to report results at grades 4 and 8. At grade 12, scores for White, Hispanic, and Asian/Pacific Islander students were higher in 2010 than in 1994.
Score for male eighth-graders increases since 2006The average score for male students was higher in 2010 than in 2006 at grade 8, while there was no significant change for female students. In comparison to 1994, average scores were higher in 2010 for male students at all three grades and for female students at grades 4 and 8.
CharacteristicGrade 4 Grade 8 Grade 12
Since 1994 Since 2006 Since 1994 Since 2006 Since 1994 Since 2006
Overall p t p p p tRace/ethnicity
White p t p t p tBlack p t p p t tHispanic p t p p p tAsian/Pacific Islander p t p t p t
Alaska Native American Indian/ ‡ t p t t t
Gender
Male p t p p p tFemale p t p t t t
Gaps
White – Black Narrowed t Narrowed Narrowed t tWhite – Hispanic Narrowed t t Narrowed t tMale – Female t t Widened t t t
p Indicates the score was higher in 2010.t Indicates no significant change in the score or the gap in 2010. ‡ Reporting standards not met. Sample size insufficient to permit a reliable estimate.
3U.S. HISTORY 2010 3U.S. HISTORY 2010

IntroductionThe 2010 National Assessment of Educational Progress (NAEP) U.S. history assessment measures how well fourth-, eighth-, and twelfth-graders are learning American history, and whether they can evaluate historical evidence and understand change and continuity over time. Comparing the results from the 2010 assessment to results from previous years shows how students’ knowledge and skills in U.S. history at these grade levels have progressed over time.
The U.S. History FrameworkThe National Assessment Governing Board oversees the development of NAEP frameworks that describe the specific knowledge and skills that should be assessed in each subject. Frameworks incorporate ideas and input from subject area experts, school administrators, policymakers, parents, and others. The U.S. History Framework for the 2010 National Assessment of Educational Progress describes the types of questions that should be included in the assessment and how they should be designed and scored.
The U.S. history framework specifies that the assessment be organized around three major components: themes of U.S. history, periods of U.S. history, and ways of knowing and thinking about U.S. history. To reflect developmental differ-ences of students at each of the three grade levels assessed, the proportion of the assessment devoted to each of the historical themes, time periods, and ways of knowing and thinking about U.S. history varies for each grade assessed. The amount of assessment time devoted to the historical themes and periods is presented in each of the grade sections in this report on pages 14, 28, and 42.
Themes of U.S. history establish the context for the people, events, ideas, movements, issues, and sources addressed in each historical period. The following four historical themes make up the core structure of the U.S. history assessment for each of the three grades assessed:
Democracy – Change and Continuity in American Democracy: Ideas, Institutions, Events, Key Figures, and Controversies
This theme focuses on the development of American political democracy from colonial times to the present and includes basic principles and core civic ideas developed through the American Revolution, the U.S. Constitution, the Civil War, and the struggles over slavery and civil rights.
Culture – The Gathering and Interactions of Peoples, Cultures, and Ideas
This theme focuses on how different racial, ethnic, and religious groups gathered and interacted in American society, and the cultural traditions and heritage that devel-oped as a result of this interaction.
4 THE NATION’S REPORT CARD

Technology – Economic and Technological Changes and Their Relationship to Society, Ideas, and the Environment
This theme focuses on the transformation of the American economy from rural frontier to industrial superpower and its impact on society, ideas, and the environment. It ad-dresses the influence of geography; the development of business and labor; and the impact of science and technol-ogy, a market economy, and urbanization.
World Role – The Changing Role of America in the World
This theme focuses on the movement from isolation to worldwide responsibility. It addresses the evolution of relationships between the United States and other nations, including American foreign policy and the nation’s partici-pation in world and regional wars, as well as the influence of geography, economic interests, and democratic ideals in the role the United States plays in foreign affairs.
Periods of U.S. history establish a basic chronological structure for organizing the experiences of people over time. The framework divides U.S. history into the following eight chronological periods:
• Beginningsto1607
• Colonization,Settlement,andCommunities(1607–1763)
• TheRevolutionandtheNewNation(1763–1815)
• ExpansionandReform(1801–1861)
• CrisisoftheUnion:CivilWarandReconstruction(1850–1877)
• TheDevelopmentofModernAmerica(1865–1920)
• ModernAmericaandtheWorldWars(1914–1945)
• ContemporaryAmerica(1945tothepresent)
Ways of knowing and thinking about U.S. history refer to the cognitive skills required for historical study. The development of the U.S. history assessment was guided by two overarching ways of knowing and thinking about history.
Historical knowledge and perspective include the following:• Knowingandunderstandingpeople,events,concepts,
and historical sources
• Sequencingevents
• Recognizingmultipleperspectivesandseeinganeraormovement through the eyes of different groups
Historical analysis and interpretation include the following:• Explainingissues
• Identifyinghistoricalpatterns
• Establishingcause-and-effectrelationships
• Findingvaluestatements
• Establishingsignificance
• Applyinghistoricalknowledge
• Weighingevidencetodrawsoundconclusions
• Makingdefensiblegeneralizations
• Renderinginsightfulaccountsofthepast
More detailed information about each of the three major components of the assessment is provided in the U.S. history framework, which can be found at http://www.nagb.org/publications/frameworks/historyframework.pdf.
Reporting NAEP ResultsTheresultsfromthe2010NAEPU.S.historyassessmentarebased on nationally representative samples of public and nonpublicschoolstudentsatgrades4,8,and12(table 1).Unlike NAEP assessments in other subjects such as reading, mathematics, and science, the administration of the U.S. history assessment was not designed to report results for individual states or large urban districts.
Table 1. Number of participating schools and students in NAEP U.S. history assessment, by grade: 2010
Grade Number of schools Number of students
Grade 4 510 7,000
Grade 8 480 11,800
Grade 12 500 12,400NOTE: The number of schools is rounded to the nearest ten. The number of students is rounded to the nearest hundred.
SOURCE: U.S. Department of Education, Institute of Education Sciences, National Center for Education Statistics, National Assessment of Educational Progress (NAEP), 2010 U.S. History Assessment.
5U.S. HISTORY 2010

6 THE NATION’S REPORT CARD
Scale scoresNAEP U.S. history results are reported as average scores on a0–500scaleoverallandforeachofthefourU.S.historythemes. Because the NAEP scales were derived indepen-dently for each theme and for each grade, scores cannot be compared across themes or across grades. NAEP scores also cannot be compared across subjects.
In addition to reporting an overall U.S. history score for each grade, scale scores are reported at five percentiles to show trendsinresultsforstudentsperformingatlower(10thand25thpercentiles),middle(50thpercentile),andhigher(75thand90thpercentiles)levels.
Achievement levelsBased on recommendations from policymakers, educators, and members of the general public, the Governing Board sets specific achievement levels for each subject area and grade. Achievement levels are performance standards showing what students should know and be able to do. NAEP results are reported as percentages of students performing at or above the Basic and Proficient levels and at the Advanced level.
As provided by law, the National Center for Education Statistics(NCES),uponreviewofcongressionallymandatedevaluations of NAEP, has determined that achievement levels are to be used on a trial basis and should be interpreted with caution. The NAEP achievement levels have been widely used by national and state officials.
NAEP Achievement LevelsBasic denotes partial mastery of prerequisite knowledge and skills that are fundamental for proficient work at each grade.
Proficient represents solid academic performance. Students reaching this level have demonstrated competency over challenging subject matter.
Advanced represents superior performance.
Interpreting the ResultsChanges in performance over timeNationalresultsfromthe2010U.S.historyassessmentarecompared to results from three earlier assessment years. Changes in students’ performance over time are summarized bycomparingtheresultsin2010to2006andtothefirstassessment year, except when pointing out consistent pat-terns across assessments.
NAEP reports results using widely accepted statistical standards; findings are reported based on statistical signifi-cancesetat.05withappropriateadjustmentsformultiplecomparisons(seetheTechnicalNotesformoreinformation).Thesymbol(*)isusedintablesandfigurestoindicatethatan earlier year’s score or percentage is significantly different fromthe2010results.Onlythosedifferencesthatarefoundto be statistically significant are discussed as higher or lower. The same standard applies when comparing the perfor-mance of one student group to another.
A significant increase or decrease in scores from one assessment year to the next is reliable evidence that student performance has in fact changed. However, NAEP is not designed to identify the causes of these changes. Further-more, the many factors that may influence average student achievement scores also change over time. These include educational policies and practices, available resources, and the demographic characteristics of the student body.
Accommodations and exclusions in NAEPIt is important to assess all selected students from the target population,includingstudentswithdisabilities(SD)andEnglishlanguagelearners(ELL).Toaccomplishthisgoal,many of the same testing accommodations allowed on state testing(e.g.,extratestingtimeorindividualratherthangroupadministration)areprovidedforSDandELLstudentspartici-pating in NAEP. Accommodations were first made available fortheU.S.historyassessmentin2001.Noaccommodationswereprovidedinthe1994U.S.historyassessment.
Because providing accommodations represented a change in testing conditions that could potentially affect the measure-ment of changes over time, split national samples of students wereassessedin2001—onesamplepermittedaccommoda-tions, and the other did not. Although the results for both samples are presented in the tables and figures, the compari-sonsto2001inthetextarebasedonjusttheaccommodatedsamples.
Even with the availability of accommodations, some students may still be excluded. See appendix tables A-1 through A-3 for the percentages of students accommodated and excluded at the national level. More information about NAEP’s policy on the inclusion of special-needs students is available at http://nces.ed.gov/nationsreportcard/about/inclusion.asp.
Explore Additional ResultsNot all of the data from the NAEP U.S. history assessment are presented in this report. Additional results can be found on the Nation’s Report Card website at http://nationsreportcard.gov/ushistory_2010 and in the NAEP Data Explorer at http://nces.ed.gov/nationsreportcard/naepdata/.

7
GRADE 4Lowest-performing students make greatest gains from 1994 to 2010The average U.S. history score for the nation’s fourth-graders did not change significantly since the last assessment in 2006; however, the score in 2010 was higher than in 1994. The score for students at the 10th percentile increased 22 points from 1994 to 2010. Gains from 1994 to 2010 for Black and Hispanic students contributed to the narrowing of the gaps between these groups and their White peers over this 16-year period.
U.S. HISTORY 2010

8 THE NATION’S REPORT CARD
GRADE
4
No significant change in students’ performance since 2006There was no significant change from 2006 to 2010 in the average fourth-grade U.S. history score; however, the score in 2010 was higher than the score in 1994 (figure 1). The lowest-performing students made the greatest gains from 1994 to 2010 with a 22-point increase for students at the 10th percentile that was larger than the increases at the 25th, 50th, and 75th percentiles over the same period (figure 2). Although there was no significant change from 2006 to 2010 in the overall average score, there was an increase in the score for students at the 50th percentile.
Figure 1. Trend in fourth-grade NAEP U.S. history average scores
* Significantly different (p < .05) from 2010.
Figure 2. Trend in fourth-grade NAEP U.S. history percentile scores
* Significantly different (p < .05) from 2010.
Basic
* Significantly different (p < .05) from 2010.
SOURCE: U.S. Department of Education, Institute of Education Sciences, National Center for Education Statistics, National Assessment of Educational Progress (NAEP), various years, 1994–2010 U.S. History Assessments.
Percentages of students at or above Basic and Proficient increase from 1994Seventy-three percent of students performed at or above the Basic level in 2010, and 20 percent performed at or above the Proficient level (figure 3). There were no significant changes in the percentages of students at or above Basic and Proficient since 2006; however, both percentages were higher in 2010 than in 1994. Two percent of students performed at the Advanced level in 2010, which was not significantly different from the percentages in earlier assessment years.
Figure 3. Trend in fourth-grade NAEP U.S. history achievement-level results
% at Advanced% at or above Proficient% at or above
9U.S. HISTORY 2010
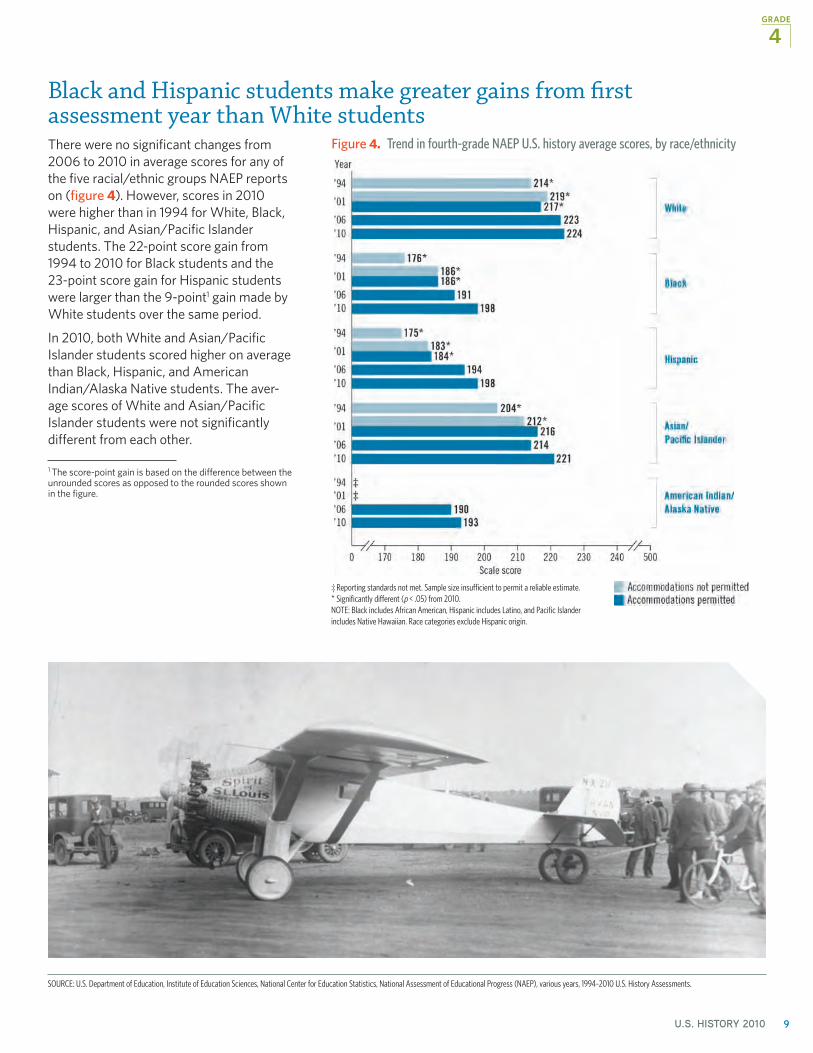
Black and Hispanic students make greater gains from first assessment year than White studentsThere were no significant changes from 2006 to 2010 in average scores for any of the five racial/ethnic groups NAEP reports on (figure 4). However, scores in 2010 were higher than in 1994 for White, Black, Hispanic, and Asian/Pacific Islander students. The 22-point score gain from 1994 to 2010 for Black students and the 23-point score gain for Hispanic students were larger than the 9-point1
1 The score-point gain is based on the difference between the unrounded scores as opposed to the rounded scores shown in the figure.
gain made by White students over the same period.
In 2010, both White and Asian/Pacific Islander students scored higher on average than Black, Hispanic, and American Indian/Alaska Native students. The aver-age scores of White and Asian/Pacific Islander students were not significantly different from each other.
Figure 4. Trend in fourth-grade NAEP U.S. history average scores, by race/ethnicity
‡ Reporting standards not met. Sample size insufficient to permit a reliable estimate.* Significantly different (p < .05) from 2010.NOTE: Black includes African American, Hispanic includes Latino, and Pacific Islander includes Native Hawaiian. Race categories exclude Hispanic origin.
SOURCE: U.S. Department of Education, Institute of Education Sciences, National Center for Education Statistics, National Assessment of Educational Progress (NAEP), various years, 1994–2010 U.S. History Assessments.
GRADE
4

10 THE NATION’S REPORT CARD
4
GRADE
A closer look at the achievement-level results from 1994 to 2010 shows where improvements were made for students performing at different levels. The percentage of students performing at the Proficient level increased from 1994 to 2010 for White students and did not change significantly for other racial/ethnic groups (figure 5). The percent-ages of students performing at the Basic level increased from 1994 to 2010 for all four racial/ethnic groups. There was no significant change in the percentage of students at Advanced for any of the racial/ethnic groups.
Figure 5. Trend in fourth-grade NAEP U.S. history achievement-level results, by selected racial/ethnic groups
# Rounds to zero.* Significantly different (p < .05) from 2010.1 Accommodations not permitted.NOTE: Black includes African American, Hispanic includes Latino, and Pacific Islander includes Native Hawaiian. Race categories exclude Hispanic origin. Detail may not sum to totals because of rounding.
Additional Results for Student GroupsAchievement-level results and percentile scores provide additional insight into the performance of student groups. See appendix tables A-4 and A-5 for additional fourth-grade results for the student groups highlighted in this section. Similar NAEP results for other student groups can be found in the NAEP Data Explorer at http://nces.ed.gov/nationsreportcard/naepdata/.
No significant change since 2006 in the percentage of students by race/ethnicityThe percentage of White students at grade 4 has decreased from 1994 to 2010, while the percentages of Hispanic students and Asian/Pacific Islander students have increased (table 2). There have been no significant changes in the proportion of fourth-graders in the five racial/ethnic groups from 2006 to 2010.
Table 2. Percentage of students assessed in fourth-grade NAEP U.S. history, by race/ethnicity: Various years, 1994–2010
Race/ethnicity 19941 2001 2006 2010
White 72* 69* 56 56
Black 17 16 15 15
Hispanic 7* 12* 21 21
Asian/Pacific Islander 3* 3* 5 5
American Indian/ Alaska Native 1 1 2 1
* Significantly different (p < .05) from 2010.1 Accommodations not permitted. NOTE: Black includes African American, Hispanic includes Latino, and Pacific Islander includes Native Hawaiian. Race categories exclude Hispanic origin. Detail may not sum to totals because results are not shown for students whose race/ethnicity was unclassified.
SOURCE: U.S. Department of Education, Institute of Education Sciences, National Center for Education Statistics, National Assessment of Educational Progress (NAEP), various years, 1994–2010 U.S. History Assessments.

11
4
U.S. HISTORY 2010
SOURCE: U.S. Department of Education, Institute of Education Sciences, National Center for Education Statistics, National Assessment of Educational Progress (NAEP), various years, 1994–2010 U.S. History Assessments.
Black and Hispanic students narrow long-term gaps with White studentsIn 2010, White students scored 26 points higher on average than Black students and 26 points higher than Hispanic students (figure 6). There were no significant changes in the gaps from 2006 to 2010. However, larger gains from 1994 to
2010 for Black and Hispanic students than for White stu-dents contributed to the narrowing of both gaps over the 16-year period.
Figure 6. Trend in fourth-grade NAEP U.S. history average scores and score gaps, by selected racial/ethnic groups
* Significantly different (p < .05) from 2010.NOTE: Black includes African American, and Hispanic includes Latino. Race categories exclude Hispanic origin. Score gaps are calculated based on differences between unrounded average scores.
Narrowing the gaps: a closer look at lower-performing Black and Hispanic studentsScore gains from 1994 to 2010 for Black and Hispanic students were made by lower-performing students scoring below the Basic achievement level. Black and Hispanic students at the 25th percentile scored at least 30 points2 higher in 2010 than in 1994 as compared to a 12-point2
2 The score-point difference is based on the difference between the unrounded scores as opposed to the rounded scores shown in the appendix table.
increase for White students at the 25th percentile over the same period (see appendix table A-5). Profiles of lower-performing Black and Hispanic students are presented below.
The score for Black students at the 25th percentile increased from 147 in 1994 to 176 in 2010. Among Black students who scored below 176 in 2010,
• 58%weremaleand42%werefemale;
• 85%wereeligibleforfree/reduced-priceschool lunch;
• 61%attendedschoolsincitylocations;and
• 31%wereidentifiedasstudentswithdisabilities.
The score for Hispanic students at the 25th percentile increased from 145 in 1994 to 177 in 2010. Among Hispanic students who scored below 177 in 2010,
• 52%weremaleand48%werefemale;
• 87%wereeligibleforfree/reduced-priceschool lunch;
• 49%attendedschoolsincitylocations;and
• 64%wereidentifiedasEnglishlanguagelearners.
GRADE

12 THE NATION’S REPORT CARD
4
GRADE
No significant difference in performance of male and female studentsAs in previous years, there was no significant difference in the average U.S. history scores for male and female students in 2010 (figure 7). Average scores for both groups in 2010 were not significantly different from the scores in 2006, but were higher than the scores in 1994.
Figure 7. Trend in fourth-grade NAEP U.S. history average scores, by gender
* Significantly different (p < .05) from 2010.
Although the overall average scores for male and female students did not differ significantly in 2010, male students scored 4 points higher than female students in the democracy theme and 6 points higher in the world role theme (figure 8). There were no significant differences in average scores for male and female students in either the culture or technology themes.
Figure 8. Average scores in fourth-grade NAEP U.S. history, by themes of U.S. history and gender: 2010
SOURCE: U.S. Department of Education, Institute of Education Sciences, National Center for Education Statistics, National Assessment of Educational Progress (NAEP), various years, 1994–2010 U.S. History Assessments.

13
4
U.S. HISTORY 2010
Gains for some income levelsNAEP uses students’ eligibility for the National School Lunch Program as an indicator of low income. Students from lower- income families are eligible for either free or reduced-price school lunches, while students from higher-income families are not (see the Technical Notes for eligibility criteria). Because of the improved quality of the data on students’ eligibility in more recent assessment years, results are only compared back to 2006.
Students who are not eligible score higher on average on NAEP assessments than those eligible for reduced-price lunch, who in turn score higher than those eligible for free lunch. Average scores were higher in 2010 than in 2006 for students who were eligible for free school lunch and for those who were not eligible (figure 9). There was no significant change in the score for students who were eligible for re-duced-price lunch.
Figure 9. Average scores in fourth-grade NAEP U.S. history, by eligibility for free or reduced-price school lunch: 2006 and 2010
* Significantly different (p < .05) from 2010.
Forty-six percent of fourth-graders eligible for the National School Lunch ProgramForty percent of fourth-graders were eligible for free lunch, and 6 percent were eligible for reduced-price lunch in 2010 (table 3). There were no significant changes since 2006 in the percentages of students based on their eligibility for the school lunch program.
Table 3. Percentage of students assessed in fourth-grade NAEPU.S. history, by eligibility for free or reduced-price school lunch: 2006 and 2010
Eligibility for school lunch 2006 2010
Eligible for free lunch 37 40
Eligible for reduced-price lunch 8 6
Not eligible 48 47
Information not available 7 7
SOURCE: U.S. Department of Education, Institute of Education Sciences, National Center for Education Statistics, National Assessment of Educational Progress (NAEP), 2006 and 2010 U.S. History Assessments.
GRADE

14 THE NATION’S REPORT CARD
Assessment Content at Grade 4Because the assessment covered a range of topics and included more questions than any one student could answer, each student took just a portion of the assessment. The 95 questions that made up the entire fourth-grade assess-ment were divided into six sections, each containing a mixture of multiple-choice and constructed-response ques-tions. Each student responded to questions in two 25-minute sections. The figures below show the proportions of the U.S. history assessment devoted to the four historical themes and the eight historical periods at grade 4.
25%Democracy
35%Culture
25%Technology
15%World Role
Beginnings to 1607
20%
The Revolution and the
New Nation (1763–1815)
15%
Crisis of the Union: Civil War and
Reconstruction (1850–1877)
10%
Modern America and the
World Wars (1914–1945)
5%
Colonization, Settlement, and
Communities (1607–1763)
15%
Expansion and Reform (1801–1861)
15%
The Development of Modern America
(1865–1920)
5%
Contemporary America (1945 to
the present)
15%

U.S. History Achievement-Level Descriptions for Grade 4NAEP U.S. history achievement-level descriptions outline expectations of student performance at each grade. The specific descriptions of what fourth-graders should know and be able to do at the Basic, Proficient, and Advanced levels in U.S. history are presented below. NAEP achievement levels are cumulative; therefore, student performance at the Proficient level includes the competencies associated with the Basic level, and the Advanced level includes the skills and knowledge associated with both the Basic and the Proficient levels. The cut score indicating the lower end of the score range for each level is noted in parentheses.
Basic (195)Fourth-grade students performing at the Basic level should be able to iden-tify and describe a few of the most familiar people, places, events, ideas, and documents in American history. They should be able to explain the reasons for celebrating most national holidays, have some familiarity with the geography of their own state and the United States, and be able to express in writing a few ideas about a familiar theme in American history.
Proficient (243)Fourth-grade students performing at the Proficient level should be able to identify, describe, and comment on the significance of many historical people, places, ideas, events, and documents. They should be able to interpret information from a variety of sources, including texts, maps, pic-tures, and timelines. They should be able to construct a simple timeline from data. These students should recognize the role of invention and technological change in history. They should also recognize the ways in which geographic and environmental factors have influenced life and work.
Advanced (276)Fourth-grade students performing at the Advanced level should have a beginning understanding of the rela-tionships between people, places, ideas, events, and documents. They should know where to look for infor-mation, including reference books, maps, local museums, interviews with family and neighbors, and other sources. They should be able to use historical themes to organize and interpret historical topics and to incorporate insights from beyond the classroom into their understanding of history. These students should under-stand and be able to explain the role of invention and technological change in history. They should also understand and be able to explain the ways in which geographic and environmental factors have influenced life and work.
GRADE
4
15U.S. HISTORY 2010

SOURCE: U.S. Department of Education, Institute of Education Sciences, National Center for Education Statistics, National Assessment of Educational Progress (NAEP), 2010 U.S. History Assessment.
GRADE
4
What Fourth-Graders Know and Can Do in U.S. HistoryThe item map below is useful for understanding perfor-mance at different levels on the NAEP scale. The scale scores on the left represent the scores for students who were likely to get the items correct or complete. The cut score at the low end of the range for each achievement level is boxed. The descriptions of selected assessment questions indicating what students need to do to answer the question correctly are listed on the right, along with the corresponding theme of U.S. history. For example, the map
on this page shows that fourth-graders performing at the Basic level with a score of 237 were likely to be able to understand a purpose of the Bill of Rights. Students performing at the Proficient level with a score of 259 were likely to be able to use a map to explain the purpose of the Lewis and Clark expedition. Students performing at the Advanced level with a score of 308 were likely to be able to explain how machines and factories altered the nature of work for Americans.
GRADE 4 NAEP U.S. HISTORY ITEM MAPScale score Theme Question description
Advanced
500
//417 Culture Give two reasons why people immigrate to the U.S.317 Culture Explain the historical context of a slave letter314 Culture Use a picture to describe Sioux life (shown on page 18)308 Technology Explain how machines and factories changed work293 Democracy Identify a photo of President Lincoln and give two reasons he was important292 Democracy Enter events on a timeline (shown on page 17)283 Culture Identify a role of women during the American Revolution276
Proficient
273 Technology Understand why cities grew in certain locations270 World Role Identify the role of an international organization268 World Role Identify the Cold War communist superpower263 Technology Understand why Europeans sought new trade in the 1400s259 Democracy Use a map to explain the purpose of the Lewis and Clark expedition256 Technology Understand that canals increased trade among states (shown on page 19)249 Culture Interpret a text about the African American experience243
Basic
237 World Role Understand a purpose of the Bill of Rights (shown on page 20)225 Democracy Identify the change for African Americans after the Civil War217 Technology Interpret a map about the colonial economy204 World Role Understand the purpose of a government poster195
191 Technology Understand the importance of certain colonial jobs178
//0
Culture Identify a civil rights goal
NOTE: Regular type denotes a constructed-response question. Italic type denotes a multiple-choice question. The position of a question on the scale represents the scale score attained by students who had a 65 percent probability of successfully answering a constructed-response question, or a 74 percent probability of correctly answering a four-option multiple-choice question. For constructed-response questions, the question description represents students’ performance rated as completely correct. Scale score ranges for U.S. history achievement levels are referenced on the map.
16 THE NATION’S REPORT CARD

SOURCE: U.S. Department of Education, Institute of Education Sciences, National Center for Education Statistics, National Assessment of Educational Progress (NAEP), 2010 U.S. History Assessment.
U.S. History Theme: Democracy
Write the letter for each event listed below in the correct square on the time line.
A Jamestown is founded.
B The United States Constitution is written.
C Christopher Columbus sails to the Americas.
D Abraham Lincoln announces the Emancipation Proclamation.
This sample constructed-response question from the 2010 U.S. history assessment measures fourth-graders’ knowledge of the chronological sequence of four major events in U.S. history. Responses to this question were rated using four scoring levels.
Complete responses placed all four events in the correct order as follows:
C A B D
Essential responses placed two or three events in the correct order.
Partial responses placed one event in the correct order.
Inappropriate responses did not place any event in the correct order.
Nineteen percent of fourth-graders’ responses to this question received a “Complete” rating.
Percentage of fourth-grade students in each response category: 2010 Complete Essential Partial Inappropriate Omitted
19 27 23 27 4
The table below shows the percentage of fourth-graders within each achievement level whose responses to this question were rated as “Complete.” For example, 15 percent of fourth-graders at the Basic level provided responses rated as “Complete.”
Percentage of fourth-grade students’ responses rated as “Complete” at each achievement level: 2010
Overall Below Basic At Basic At Proficient At Advanced
19 4 15 46 ‡ ‡ Reporting standards not met. The number of students who answered this question and scored at the Advanced level was insufficient to permit a reliable estimate.
Explore Additional Sample Questions More questions from the NAEP U.S. history assessment can be found in the Questions Tool at: http://nces.ed.gov/ nationsreportcard/itmrlsx/landing.aspx. .
4 GRADE
17 U.S. HISTORY 2010

4
18
GRADE
U.S. History Theme: Culture
Historians use artwork as well as what people wrote down to learn about the past.
The picture to the right was made in 1849. It shows members of the Sioux tribe. Using what you can see in the picture, describe three ways the Sioux used natural resources to meet their needs. Be specific.
COMPLETE RESPONSE:
This sample constructed-response question measures fourth-graders’ ability to “read” a historical picture, as well as their knowledge of how Native Americans of the nine-teenth century lived off the land. Responses to this ques-tion were rated using three levels. Spelling and grammar were not considered in rating the responses.
Complete responses described three things visible in the picture that show how the Sioux used natural resources to meet their needs. Credited responses included references to using branches to create stoves, chopping wood to make fires/keep warm, and using water for cooking.
Partial responses described one or two things visible in the picture that show how the Sioux used natural resources to meet their needs.
Inappropriate responses did not describe anything visible in the picture that shows how the Sioux used natural resources to meet their needs.
The sample student response shown above was rated “Complete” because it described three ways that the Sioux used natural resources. Students received credit for using
the same natural resource more than once as long as it was associated with different uses. As shown in the table below, 23 percent of fourth-graders’ responses to this question received a “Complete” rating.
Percentage of fourth-grade students in each response category: 2010Complete Partial Inappropriate Omitted
23 36 33 7NOTE: Detail may not sum to totals because the percentage of responses rated as “Off-task” is not shown. Off-task responses are those that do not provide any information related to the assessment task.
The following table shows the percentage of fourth-graders within each achievement level whose responses to this question were rated as “Complete.” For example, among fourth-graders performing at the Basic level, 22 percent provided responses rated as “Complete.”
Percentage of fourth-grade students’ responses rated as “Complete” at each achievement level: 2010
Overall Below Basic At Basic At Proficient At Advanced
23 3 22 49 ‡‡ Reporting standards not met. The number of students who answered this question and scored at the Advanced level was insufficient to permit a reliable estimate.
SOURCE: U.S. Department of Education, Institute of Education Sciences, National Center for Education Statistics, National Assessment of Educational Progress (NAEP), 2010 U.S. History Assessment.
THE NATION’S REPORT CARD

4
19
GRADE
U.S. HISTORY 2010
U.S. History Theme: Technology
AtlanticOcean
Lake Champlain
ChamplainCanal
Erie CanalLake Ontario
PennsylvaniaCanal
Susquehanna R.
James and Kanawha
Canal
James R.
Kanaw
ha R.
Lake Erie
Miamiand ErieCanal
Mia
mi
R.
WabashandErie
Canal
Wabash R.
Illinois-Michigan
Canal
Mis
siss
ippi
Riv
er
Ohio R.
Potomac R.
Lak
e M
ich
igan
Lake Huron
0 200 miles
0 200 kilometers
Scale
Ohio andErie Canal
Illi
nois
R.
AlbanyBuffalo
ToledoChicago
Cincinnati
Evansville
Ports-mouth
Cleveland
The map shows canals in the United States in the 1800’s.
An important result of the building of canals in the United States was that
A slavery spread to the western states
B people stopped building railroads
C more people traveled to California to farm
D trade increased among the states
This sample question is from a set of items that measured fourth-graders’ map-reading skills and their understanding of the impact of canal building during the first half of the nineteenth century. Forty-four percent of students knew that the building of canals resulted in an increase of trade among the states.
Percentage of fourth-grade students in each response category: 2010Choice A Choice B Choice C Choice D Omitted
20 15 18 44 2NOTE: Detail may not sum to totals because of rounding.
The table below shows the percentage of fourth-graders within each achievement level who answered this question correctly. For example, 43 percent of students at the Basic level selected the correct answer choice.
Percentage of fourth-grade students responding correctly at each achievement level: 2010
Overall Below Basic At Basic At Proficient At Advanced
44 26 43 69 ‡‡ Reporting standards not met. The number of students who answered this question and scored at the Advanced level was insufficient to permit a reliable estimate.
SOURCE: U.S. Department of Education, Institute of Education Sciences, National Center for Education Statistics, National Assessment of Educational Progress (NAEP), 2010 U.S. History Assessment.
Hu
dso
n R
.

4GRADE
20 THE NATION’S REPORT CARD
U.S. History Theme: World Role
Aung San Suu Kyi lives in a country called Myanmar (Burma). She has spent many years trying to change her country’s government. She spoke the words below in 1996.
“Those fortunate enough to live in societies where they are entitled to full political rights can reach out to help the less fortunate in other parts of our troubled planet. Young women and young men . . . might wish to cast their eyes beyond their own frontiers. . . . Please use your liberty to promote [help] ours.”
What document helps to give Americans what Aung San Suu Kyi wants her people to have?
A The Mayflower Compact
B The Gettysburg Address
C The Star-Spangled Banner
D The Bill of Rights
This sample question is part of a set of questions about individual rights that Americans have historically enjoyed, but that some people elsewhere in the world have not. Fifty-six percent of students knew that the Bill of Rights gives Americans the rights that Aung San Suu Kyi wants for her people.
Percentage of fourth-grade students in each response category: 2010Choice A Choice B Choice C Choice D Omitted
13 9 19 56 3
The table below shows the percentage of fourth-graders within each achievement level who answered this question correctly. For example, 59 percent of students at the Basic level selected the correct answer choice.
Percentage of fourth-grade students responding correctly at each achievement level: 2010
Overall Below Basic At Basic At Proficient At Advanced
56 35 59 77 ‡‡ Reporting standards not met. The number of students who answered this question and scored at the Advanced level was insufficient to permit a reliable estimate.
SOURCE: U.S. Department of Education, Institute of Education Sciences, National Center for Education Statistics, National Assessment of Educational Progress (NAEP), 2010 U.S. History Assessment.

GRADE 8Eighth-graders post highest average score to dateThe average U.S. history score for the nation’s eighth-graders was higher in 2010 than in previous assessment years. Gains from 2006 to 2010 for Black and Hispanic students contributed to the narrowing of the score gaps between these groups and their White peers. Increases were also seen since 2006 for students from both lower- and higher-income families.
U.S. HISTORY 2010 21

% at Advanced% at or above Proficient% at or above
22 THE NATION’S REPORT CARD
Eighth-graders’ performance improves since 2006The average score on the 2010 NAEP U.S. history assessment at grade 8 was higher than the scores in the three earlier assessment years (figure 10). Eighth-graders scored 3 points higher in 2010 than in 2006 and 6 points3 higher than in 1994.
3 The score-point difference is based on the difference between the unrounded scores as opposed to the rounded scores shown in the figure.
Scores at the 10th, 25th, and 50th percentiles were higher in 2010 than in 2006 while there were no significant changes at the 75th and 90th percentiles over the same period (figure 11). In comparison to 1994, scores were higher in 2010 at all five percentiles.
Figure 10. Trend in eighth-grade NAEP U.S. history average scores
* Significantly different (p < .05) from 2010.
Figure 11. Trend in eighth-grade NAEP U.S. history percentile scores
* Significantly different (p < .05) from 2010.
Percentage of students at or above Basic increasesSixty-nine percent of students performed at or above the Basic level in 2010, and 17 percent performed at or above the Proficient level (figure 12). The percentage of students at or above Basic was higher in 2010 than in earlier assessment years. There was no significant change in the percentage of students at or above Proficient from 2006 to 2010; however, the percentage in 2010 was higher than in 1994. One percent of students performed at the Advanced level in 2010, which was not significantly different from the percentages in 1994 or 2006.
Basic
Figure 12. Trend in eighth-grade NAEP U.S. history achievement-level results
* Significantly different (p < .05) from 2010.
SOURCE: U.S. Department of Education, Institute of Education Sciences, National Center for Education Statistics, National Assessment of Educational Progress (NAEP), various years, 1994–2010 U.S. History Assessments.
GRADE
8

23U.S. HISTORY 2010
Scores increase since 2006 for Black and Hispanic studentsAverage scores for Black and Hispanic students increased from 2006 to 2010 while there were no significant changes in average scores for other racial/ethnic groups over the same period (figure 13). Although not shown here, Black students made gains since 2006 at the 10th, 25th, 75th, and 90th percentiles, and Hispanic students made gains at the 25th percen-tile (see appendix table A-7). Scores were higher in 2010 than in 1994 for all five racial/ethnic groups as were the percentages of students at or above the Basic level (see appendix table A-6).
In 2010, the average scores for White and Asian/Pacific Islander students were not significantly different from each other, and both were higher than the scores for Black and Hispanic students. There were no significant differences in the average scores for American Indian/Alaska Native students and other racial/ethnic groups (see the section on Interpreting Statistical Significance in the Technical Notes).
Figure 13. Trend in eighth-grade NAEP U.S. history average scores, by race/ethnicity
* Significantly different (p < .05) from 2010.NOTE: Black includes African American, Hispanic includes Latino, and Pacific Islander includes Native Hawaiian. Race categories exclude Hispanic origin.
No significant change since 2006 in the percentage of students by race/ethnicityThere have been no significant changes in the proportion of eighth-graders in the five racial/ethnic groups from 2006 to 2010 (table 4). In comparison to the first assessment year in 1994, the percentage of White students at grade 8 has decreased while the percentage of Hispanic students has increased.
Table 4. Percentage of students assessed in eighth-grade NAEP U.S. history, by race/ethnicity: Various years, 1994–2010
Race/ethnicity 19941 2001 2006 2010
White 72* 70* 58 58
Black 16 15 16 15
Hispanic 8* 11* 19 20
Asian/Pacific Islander 3 4 4 4
American Indian/ Alaska Native 1 1 2 1
* Significantly different (p < .05) from 2010. 1 Accommodations not permitted.NOTE: Black includes African American, Hispanic includes Latino, and Pacific Islander includes Native Hawaiian. Race categories exclude Hispanic origin. Detail may not sum to totals because results are not shown for students whose race/ethnicity was unclassified.
SOURCE: U.S. Department of Education, Institute of Education Sciences, National Center for Education Statistics, National Assessment of Educational Progress (NAEP), various years, 1994–2010 U.S. History Assessments.
GRADE
8
24 THE NATION’S REPORT CARD
8
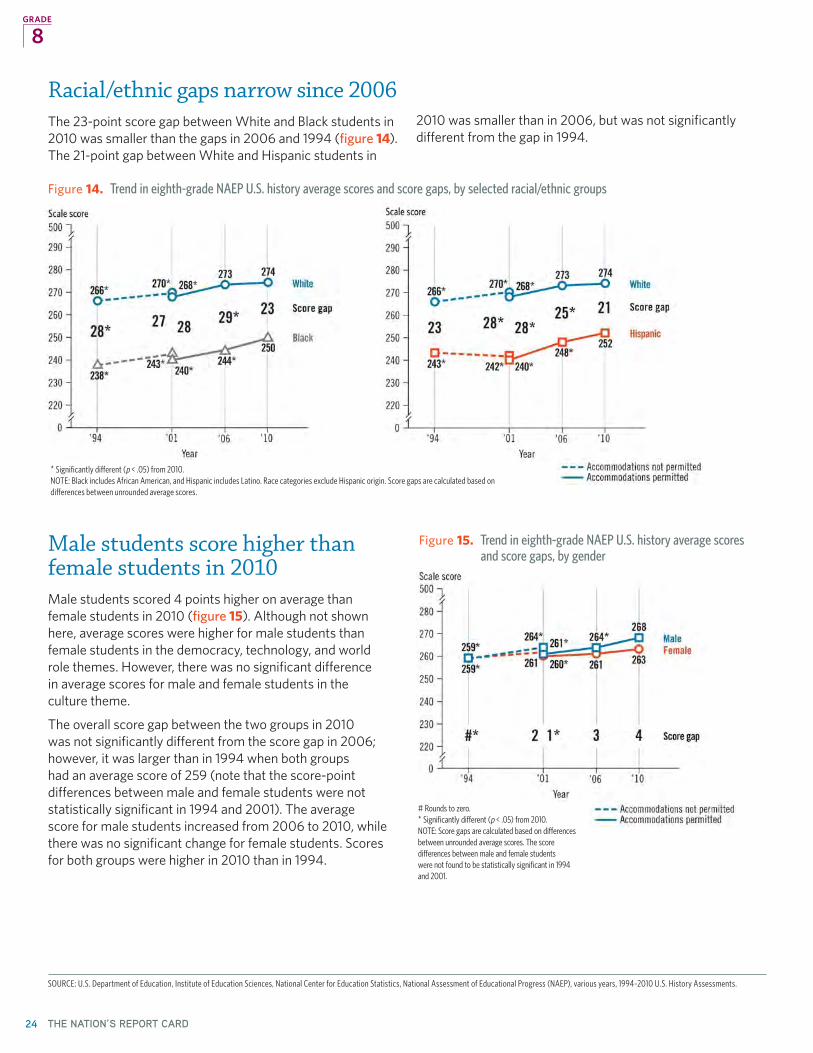
Racial/ethnic gaps narrow since 2006The 23-point score gap between White and Black students in 2010 was smaller than the gaps in 2006 and 1994 (figure 14). The 21-point gap between White and Hispanic students in
2010 was smaller than in 2006, but was not significantly different from the gap in 1994.
Figure 14. Trend in eighth-grade NAEP U.S. history average scores and score gaps, by selected racial/ethnic groups
* Significantly different (p < .05) from 2010.NOTE: Black includes African American, and Hispanic includes Latino. Race categories exclude Hispanic origin. Score gaps are calculated based on differences between unrounded average scores.
Male students score higher than female students in 2010Male students scored 4 points higher on average than female students in 2010 (figure 15). Although not shown here, average scores were higher for male students than female students in the democracy, technology, and world role themes. However, there was no significant difference in average scores for male and female students in the culture theme.
The overall score gap between the two groups in 2010 was not significantly different from the score gap in 2006; however, it was larger than in 1994 when both groups had an average score of 259 (note that the score-point differences between male and female students were not statistically significant in 1994 and 2001). The average score for male students increased from 2006 to 2010, while there was no significant change for female students. Scores for both groups were higher in 2010 than in 1994.
Figure 15. Trend in eighth-grade NAEP U.S. history average scores and score gaps, by gender
# Rounds to zero.* Significantly different (p < .05) from 2010.NOTE: Score gaps are calculated based on differences between unrounded average scores. The score differences between male and female students were not found to be statistically significant in 1994 and 2001.
SOURCE: U.S. Department of Education, Institute of Education Sciences, National Center for Education Statistics, National Assessment of Educational Progress (NAEP), various years, 1994–2010 U.S. History Assessments.
GRADE

25
8
U.S. HISTORY 2010
SOURCE: U.S. Department of Education, Institute of Education Sciences, National Center for Education Statistics, National Assessment of Educational Progress (NAEP), various years, 1994–2010 U.S. History Assessments.
A closer look at the achievement-level results by gender shows where improvements were made for students performing at different levels. The percentage of students performing at the Proficient level increased from 1994 to 2010 for male students but did not change significantly for female students (figure 16). The percentages of male and female students performing at the Basic level were higher in 2010 than in 2006 and 1994. There were no significant changes in the percentages of male and female students performing at the Advanced level.
Scores increase across income levelsAverage U.S. history scores were higher in 2010 than in 2006 for students who were eligible for free lunch, eligible for reduced-price lunch, and not eligible for either (figure 17). Although not shown here, students eligible for free lunch had gains in scores at the 10th, 25th, 50th, 75th, and 90th percentiles; students eligible for reduced-price lunch had gains at the 75th and 90th percentiles; and students who were not eligible had gains at the 10th and 25th percentiles (see appendix table A-7).
In 2010, eighth-graders who were not eligible scored 14 points4 higher on average than those eligible for reduced-price lunch, who in turn scored 11 points higher than those eligible for free lunch.
4 The score-point difference is based on the difference between the unrounded scores as opposed to the rounded scores shown in the figure.
Figure 16. Trend in eighth-grade NAEP U.S. history achievement-level results, by gender
* Significantly different (p < .05) from 2010.1 Accommodations not permitted.
Figure 17. Average scores in eighth-grade NAEP U.S. history, by eligibility for free or reduced-price school lunch: 2006 and 2010
* Significantly different (p < .05) from 2010.
No significant change in percentage of students eligible for the National School Lunch ProgramThirty-six percent of eighth-graders were eligible for free school lunch in 2010, and 7 percent were eligible for reduced-price lunch (table 5). There were no significant changes since 2006 in the percentages of students based on their eligibility for the school lunch program.
Table 5. Percentage of students assessed in eighth-grade NAEP U.S. history, by eligibility for free or reduced-price school lunch: 2006 and 2010
Eligibility for school lunch 2006 2010
Eligible for free lunch 32 36
Eligible for reduced-price lunch 7 7
Not eligible 55 52
Information not available 6 5
GRADE
26 THE NATION’S REPORT CARD
8
SOURCE: U.S. Department of Education, Institute of Education Sciences, National Center for Education Statistics, National Assessment of Educational Progress (NAEP), various years, 1994–2010 U.S. History Assessments.
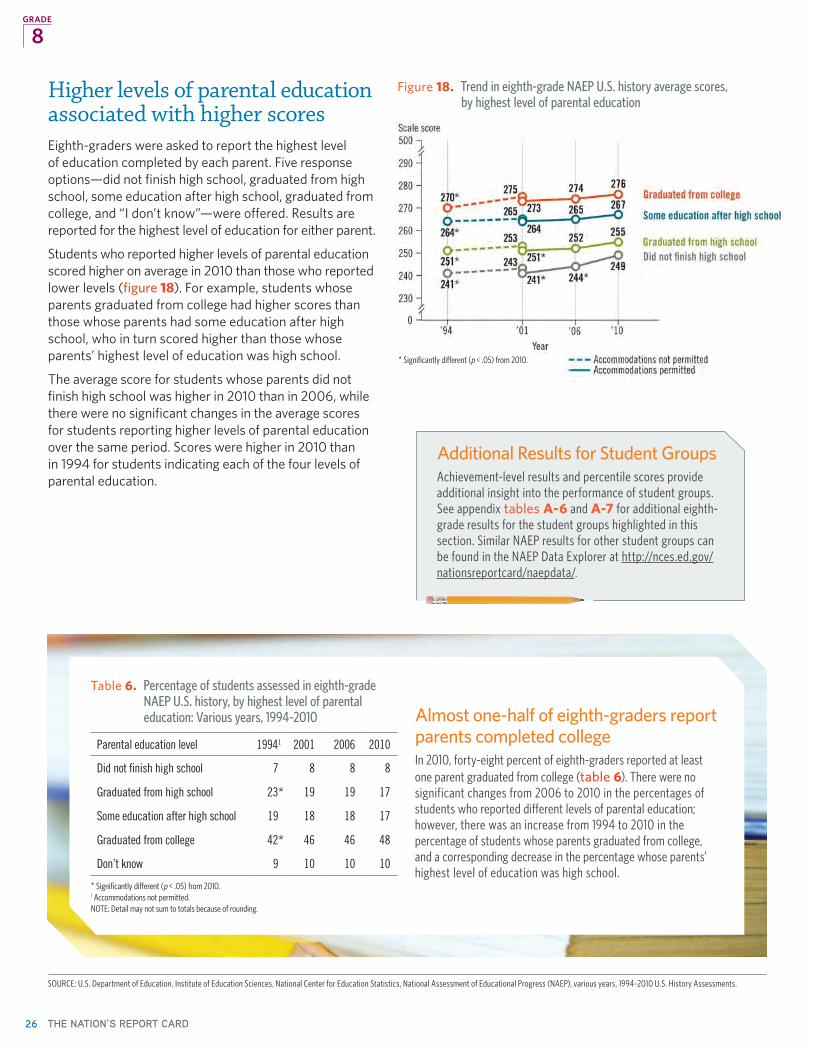
Higher levels of parental education associated with higher scoresEighth-graders were asked to report the highest level of education completed by each parent. Five response options—did not finish high school, graduated from high school, some education after high school, graduated from college, and “I don’t know”—were offered. Results are reported for the highest level of education for either parent.
Students who reported higher levels of parental education scored higher on average in 2010 than those who reported lower levels (figure 18). For example, students whose parents graduated from college had higher scores than those whose parents had some education after high school, who in turn scored higher than those whose parents’ highest level of education was high school.
The average score for students whose parents did not finish high school was higher in 2010 than in 2006, while there were no significant changes in the average scores for students reporting higher levels of parental education over the same period. Scores were higher in 2010 than in 1994 for students indicating each of the four levels of parental education.
Figure 18. Trend in eighth-grade NAEP U.S. history average scores, by highest level of parental education
* Significantly different (p < .05) from 2010.
Additional Results for Student GroupsAchievement-level results and percentile scores provide additional insight into the performance of student groups. See appendix tables A-6 and A-7 for additional eighth-grade results for the student groups highlighted in this section. Similar NAEP results for other student groups can be found in the NAEP Data Explorer at http://nces.ed.gov/nationsreportcard/naepdata/.
Almost one-half of eighth-graders report parents completed collegeIn 2010, forty-eight percent of eighth-graders reported at least one parent graduated from college (table 6). There were no significant changes from 2006 to 2010 in the percentages of students who reported different levels of parental education; however, there was an increase from 1994 to 2010 in the percentage of students whose parents graduated from college, and a corresponding decrease in the percentage whose parents’ highest level of education was high school.
Table 6. Percentage of students assessed in eighth-grade NAEP U.S. history, by highest level of parental education: Various years, 1994–2010
Parental education level 19941 2001 2006 2010
Did not finish high school 7 8 8 8
Graduated from high school 23* 19 19 17
Some education after high school 19 18 18 17
Graduated from college 42* 46 46 48
Don’t know 9 10 10 10
* Significantly different (p < .05) from 2010.1 Accommodations not permitted.NOTE: Detail may not sum to totals because of rounding.
GRADE

27
8
U.S. HISTORY 2010
GRADE
Majority of eighth-graders report taking U.S. historyAs part of the eighth-grade student questionnaire, students were asked whether or not they were currently taking a U.S. history course. Students who responded “yes” scored higher on average in 2010 than those who indicated “no” (figure 19). Eighty-four percent of students reported taking U.S. history in eighth grade in 2010.
Eighth-graders were also asked how much since the beginning of middle school or junior high school they had studied the four periods of U.S. history: before 1815, between 1815 and 1865, between 1865 and 1945, and from 1945 to the present. Students selected from one of three responses: “not at all,”
“some,” or “a lot.” The data for the two categories indicating “some” or “a lot” of study were combined so that results could be reported for those students who reported at least some study and those who reported none at all. In 2010, more than one-half of eighth-graders reported at least some study of each of the four periods (table 7). There were no significant changes from 2006 to 2010 in the percentages of students who reported at least some study of each of the four periods of U.S. history. The largest percentage of students reported studying the period before 1815, and the smallest percentage reported studying the period from 1945 to the present.
Figure 19. Percentage of students and average scores in eighth-grade NAEP U.S. history, by students’ responses to a question about whether or not they were currently taking a course in U.S. history: 2010
Table 7. Percentage of students assessed in eighth-grade NAEP U.S. history, by the extent to which they studied various periods of U.S. history since middle or junior high school: 2006 and 2010
Period of U.S. history
Not at all At least some
2006 2010 2006 2010
Before 1815 10 11 90 89
1815 to 1865 17 18 83 82
1865 to 1945 26 27 74 73
1945 to present 38 37 62 63
Explore Additional ResultsResults for other background questions from the eighth-grade student, teacher, and school questionnaires are available in the NAEP Data Explorer at http://nces.ed.gov/nationsreportcard/naepdata/.
SOURCE: U.S. Department of Education, Institute of Education Sciences, National Center for Education Statistics, National Assessment of Educational Progress (NAEP), 2006 and 2010 U.S. History Assessments.

Assessment Content at Grade 8The 166 questions that made up the entire eighth-grade assessment were divided into 10 sections, each containing a mixture of multiple-choice and constructed-response questions. Each student responded to questions in two 25-minute sections. The figures below show the proportions of the U.S. history assessment devoted to the four historical themes and the eight historical periods at grade 8.
20%Technology
20%World Role 30%
Democracy
30%Culture
28 THE NATION’S REPORT CARD
Beginnings to 1607
5%
The Revolution and the
New Nation (1763–1815)
20%
Crisis of the Union: Civil War and
Reconstruction (1850–1877)
20%
Modern America and the
World Wars (1914–1945)
10%
Colonization, Settlement, and
Communities (1607–1763)
10%
Expansion and Reform (1801–1861)
15%
The Development of Modern America
(1865–1920)
10%
Contemporary America (1945 to
the present)
10%

29U.S. HISTORY 2010
GRADE
U.S. History Achievement-Level Descriptions for Grade 8NAEP U.S. history achievement-level descriptions outline certain expectations of student performance. The specific descriptions of what eighth-graders should know and be able to do at the Basic, Proficient, and Advanced levels in U.S. history are presented below. NAEP achievement levels are cumulative; therefore, student performance at the Proficient level includes the competencies associated with the Basic level, and the Advanced level includes the skills and knowledge associated with both the Basic and the Proficient levels. The cut score indicating the lower end of the score range for each level is noted in parentheses.
Basic (252) Eighth-grade students performing at the Basic level should be able to identify and place in context a range of historical people, places, events, ideas, and documents. They should be able to distinguish between primary and sec-ondary sources. They should have a beginning understanding of the diversity of the American people and the ways in which people from a wide variety of national and cultural heritages have become part of a single nation. Eighth-grade students at the Basic level should also have a beginning understanding of the fundamental political ideas and institutions of American life and their historical origins. They should be able to explain the significance of some major historical events.
Proficient (294) Eighth-grade students performing at the Proficient level should be able to explain the significance of people, places, events, ideas, and documents, and to recognize the connection between people and events within historical contexts. They should understand and be able to explain the opportunities, perspectives, and challenges associated with a diverse cultural population. They should incorporate geographic, techno-logical, and other considerations in their understanding of events and should have knowledge of significant political ideas and institutions. They should be able to communicate ideas about historical themes while citing evidence from primary and secondary sources to support their conclusions.
Advanced (327) Eighth-grade students performing at the Advanced level should recognize signifi-cant themes and movements in history and begin to understand particular events in light of these themes and movements. They should have an awareness of continuity and change over time and be able to draw relevant analogies between past events and present-day situations. They should be able to frame questions about historical topics and use multiple sources to develop historical generalizations and interpretations. They should be able to explain the importance of historical themes, including some awareness of their political, social, and economic dimensions.
8

30 THE NATION’S REPORT CARD
What Eighth-Graders Know and Can Do in U.S. HistoryThe item map below illustrates the range of U.S. history knowledge and skills demonstrated by eighth-graders. The scale scores on the left represent the scores for students who were likely to get the items correct or complete. The cut score at the low end of the range for each achievement level is boxed. The descriptions of selected assessment questions indicating what students need to do to answer the question correctly, along with the corresponding themes of U.S. history, are listed on the right. For example, the map on
this page shows that eighth-graders performing at the Basic level with a score of 274 were likely to be able to use a map to help identify a cause of war. Students at the Proficient level with a score of 307 were likely to be able to identify an advantage held by American forces during the Revolution. Students performing at the Advanced level with a score of 342 were likely to be able to identify and explain civil rights issues.
GRADE 8 NAEP U.S. HISTORY ITEM MAPScale score Theme Question description
Advanced
500
//411 Culture Interpret a graph and explain immigration patterns350 Democracy Identify and explain the purpose of President Nixon’s resignation343 Culture Explain two differences between plantations and small farms in antebellum South (shown on pages 32 and 33)342 Democracy Identify and explain civil rights issues336 Technology Interpret data and explain an impact of farm technology332 Technology Identify a goal of the labor movement circa 1900327
Proficient
322 Technology Explain changes in colonial slave practices310 Culture Identify a domestic impact of war307 World Role Identify an advantage held by American forces during the American Revolution (shown on page 35)302 Technology Identify products shipped along the triangular trade route301 Democracy Understand what right is protected by the First Amendment299 World Role Explain a post-war foreign policy goal294
Basic
292 Technology Understand why the apprenticeship system declined in 1800s285 Democracy Identify the purpose of Three-Fifths Compromise (shown on page 31)281 Culture Identify a result of Native American-European interaction274 World Role Use a map and identify a cause of war265 Technology Understand an impact of the invention of barbed wire (shown on page 34)252
251 Technology Interpret a simple political cartoon250 World Role Understand the purpose of a wartime poster219
//0
Culture Understand the purpose of Progressive Era photos
NOTE: Regular type denotes a constructed-response question. Italic type denotes a multiple-choice question. The position of a question on the scale represents the scale score attained by students who had a 65 percent probability of successfully answering a constructed-response question, or a 74 percent probability of correctly answering a four-option multiple-choice question. For constructed-response questions, the question description represents students’ performance rated as completely correct. Scale score ranges for U.S. history achievement levels are referenced on the map.
SOURCE: U.S. Department of Education, Institute of Education Sciences, National Center for Education Statistics, National Assessment of Educational Progress (NAEP), 2010 U.S. History Assessment.
GRADE
8

31
8
U.S. HISTORY 2010
GRADE
U.S. History Theme: Democracy
At the 1787 Constitutional Convention, northern and southern delegates debated whether or not slaves would be counted as part of the state’s population. Disagreement over this question led to bitter tensions among delegates.
To resolve the question referred to in the passage, delegates agreed to
A include all male slaves in population totals
B include no slaves in population totals
C count each slave as three-fifths of a person in population totals
D count slaves in the southern states but not in the northern states
This sample question from the eighth-grade U.S. history assessment is from a set of items about the Three-Fifths Compromise. Fifty-nine percent of eighth-graders were able to identify that the Three-Fifths Compromise resolved the issue at the Constitutional Convention of how to account for slaves when determining state populations.
Percentage of eighth-grade students in each response category: 2010Choice A Choice B Choice C Choice D Omitted
15 16 59 9 ## Rounds to zero.NOTE: Detail may not sum to totals because of rounding.
The table below shows the percentage of eighth-graders within each achievement level who answered this question correctly. For example, 65 percent of students performing at the Basic level selected the correct answer choice.
Percentage of eighth-grade students responding correctly at each achievement level: 2010
Overall Below Basic At Basic At Proficient At Advanced
59 34 65 85 ‡‡ Reporting standards not met. The number of students who answered this question and scored at the Advanced level was insufficient to permit a reliable estimate.
SOURCE: U.S. Department of Education, Institute of Education Sciences, National Center for Education Statistics, National Assessment of Educational Progress (NAEP), 2010 U.S. History Assessment.

32
8
THE NATION’S REPORT CARD
U.S. History Theme: Culture
Courtesy of Library of Congress, #LC-USZ62-76385
The picture above shows farming on a Georgia cotton plantation before the Civil War. Using your knowledge of history and evidence from the picture, explain two important differences between farming on large plantations and farming on small farms in the South before the Civil War.
COMPLETE RESPONSE:
GRADE

33
8
U.S. HISTORY 2010
GRADE
SOURCE: U.S. Department of Education, Institute of Education Sciences, National Center for Education Statistics, National Assessment of Educational Progress (NAEP), 2010 U.S. History Assessment.
This sample constructed-response question (shown on the previous page) measures eighth-graders’ understanding of differences between plantation and non-plantation agricul-ture in the antebellum South. Students could use the picture for clues or draw completely on their outside knowledge. Responses to this question were rated using three scoring levels. Spelling and grammar were not considered in rating students’ responses.
Complete responses provided two differences (or two accurate facts related to differences) between farming on cotton plantations and small farms. Responses rated “Complete” did not need to make a direct comparison. Credit was given for responses such as those indicating (1) cotton plantations grew a product for sale or export that yielded profits, while small farmers often engaged in subsistence farming; (2) plantations had large numbers of slaves, while small farmers provided their own labor or had only a small number of slaves; or (3) large cotton plantations had overseers to manage slaves, while small farmers worked directly with slaves.
Partial responses provided one difference, or one accu-rate fact related to a difference, between farming on cotton plantations and small farms, but did not need to make a direct comparison.
Inappropriate responses did not provide a difference, or accurate fact related to a difference, between farming on cotton plantations and small farms.
The student response shown on the previous page was rated “Complete” because it provided two accurate examples of how plantations differed from small farms: plantations’ greater reliance on slave labor and their superior financial resources. Six percent of eighth-graders’ responses to this question received a “Complete” rating.
Percentage of eighth-grade students in each response category: 2010Complete Partial Inappropriate Omitted
6 32 55 6NOTE: Detail may not sum to totals because the percentage of responses rated as “Off-task” is not shown. Off-task responses are those that do not provide any information related to the assessment task.
The following table shows the percentage of eighth-graders within each achievement level whose responses to this question were rated “Complete.” For example, among stu-dents performing at the Basic level, 5 percent provided re-sponses rated as “Complete.”
Percentage of eighth-grade students’ responses rated as “Complete” at each achievement level: 2010
Overall Below Basic At Basic At Proficient At Advanced
6 1 5 18 ‡‡ Reporting standards not met. The number of students who answered this question and scored at the Advanced level was insufficient to permit a reliable estimate.

34
8
U.S. History Theme: Technology
THE NATION’S REPORT CARD
GRADE
The invention shown in the advertisement contributed to the
A end of the era of the open-range cattle industry
B end of the expansion of railroads
C Northern victory in the Civil War
D growth of the West Coast population and California statehood
This sample question is from a set of items referring to an advertisement on the introduction of the barbed wire fence, a seemingly innocuous event with profound consequences. Seventy-one percent of eighth-graders were able to under-stand the advertisement and identify that the invention of barbed wire contributed to the end of the open-range cattle farming on the Western Plains.
Percentage of eighth-grade students in each response category: 2010Choice A Choice B Choice C Choice D Omitted
71 5 7 17 1NOTE: Detail may not sum to totals because of rounding.
The table below shows the percentage of eighth-graders within each achievement level who answered this question correctly. For example, 79 percent of students at the Basic level selected the correct answer choice.
Percentage of eighth-grade students responding correctly at each achievement level: 2010
Overall Below Basic At Basic At Proficient At Advanced
71 44 79 91 ‡‡ Reporting standards not met. The number of students who answered this question and scored at the Advanced level was insufficient to permit a reliable estimate.
SOURCE: U.S. Department of Education, Institute of Education Sciences, National Center for Education Statistics, National Assessment of Educational Progress (NAEP), 2010 U.S. History Assessment.

U.S. History Theme: World Role
Identify one important advantage that the American forces had over the British forces in the American Revolution.
COMPLETE RESPONSE:
SOURCE: U.S. Department of Education, Institute of Education Sciences, National Center for Education Statistics, National Assessment of Educational Progress (NAEP), 2010 U.S. History Assessment.
This sample constructed-response question measures eighth-graders’ understanding of some of the factors that enabled the American colonies to defeat the more experienced British military in the American Revolution. Responses to this question were rated using three scoring levels. Spelling and grammar were not considered in rating responses to the question.
Complete responses identified one important advan-tage the American colonial forces had. Credit was given to responses that identified some of the following advantages: colonists did not have to transport supplies across the ocean; they fought on familiar territory/terrain; they fought to protect their homes, land, and freedom; Americans had more at stake than British soldiers, many of whom were forced to serve.
Partial responses identified an advantage, but not an important one, or the response identified an advantage that was vague or contained important inaccuracies.
Inappropriate responses did not identify any important advantages the American colonial forces had.
The sample response shown above was rated “Complete.” Though only required to provide one advantage, this answer provided two: first that the Americans did not suffer the same difficulty with supply lines that plagued the British, and second that they were familiar with the land on which they were fighting. Thirty-two percent of eighth-graders’ responses to this question received a rating of “Complete.”
Percentage of eighth-grade students in each response category: 2010Complete Partial Inappropriate Omitted
32 17 40 10NOTE: Detail may not sum to totals because the percentage of responses rated as “Off-task” is not shown. Off-task responses are those that do not provide any information related to the assessment task.
The table below shows the percentage of eighth-graders within each achievement level whose responses to this question were rated “Complete.” For example, among stu-dents performing at the Basic level, 34 percent provided responses rated as “Complete.”
Percentage of eighth-grade students’ responses rated as “Complete” at each achievement level: 2010
Overall Below Basic At Basic At Proficient At Advanced
32 5 34 72 ‡‡ Reporting standards not met. The number of students who answered this question and scored at the Advanced level was insufficient to permit a reliable estimate.
35U.S. HISTORY 2010
8GRADE

GRADE 12No significant change in twelfth-graders’ performance since 2006The average U.S. history score for the nation’s twelfth-graders in 2010 was not significantly different from the score in 2006 but was higher than the score in 1994. Forty-five percent of twelfth-grade students performed at or above the Basic level in 2010, and there were no significant changes in the percentages of students at or above the Basic and Proficient levels or at the Advanced level in comparison to previous assessment years.
36 THE NATION’S REPORT CARD

37U.S. HISTORY 2010
No significant change in twelfth-graders’ performance since 2006The average score on the 2010 NAEP U.S. history assessment at grade 12 did not change significantly from 2006 to 2010 but was 2 points higher in 2010 than in 1994 (figure 20). There were no significant changes in the scores at any of the five percentiles in 2010 compared to 2006 or 1994 (figure 21).
Figure 20. Trend in twelfth-grade NAEP U.S. history average scores
* Significantly different (p < .05) from 2010.
Figure 21. Trend in twelfth-grade NAEP U.S. history percentile scores
Forty-five percent of students performed at or above the Basic level in 2010, and 12 percent performed at or above the Proficient level (figure 22). The percentages of students at or above Basic, at or above Proficient, or at Advanced in 2010 were not significantly different from the percentages in previous assessment years.
Basic
Figure 22. Trend in twelfth-grade NAEP U.S. history achievement-level results
% at Advanced% at or above Proficient% at or above
SOURCE: U.S. Department of Education, Institute of Education Sciences, National Center for Education Statistics, National Assessment of Educational Progress (NAEP), various years, 1994–2010 U.S. History Assessments.
GRADE
12
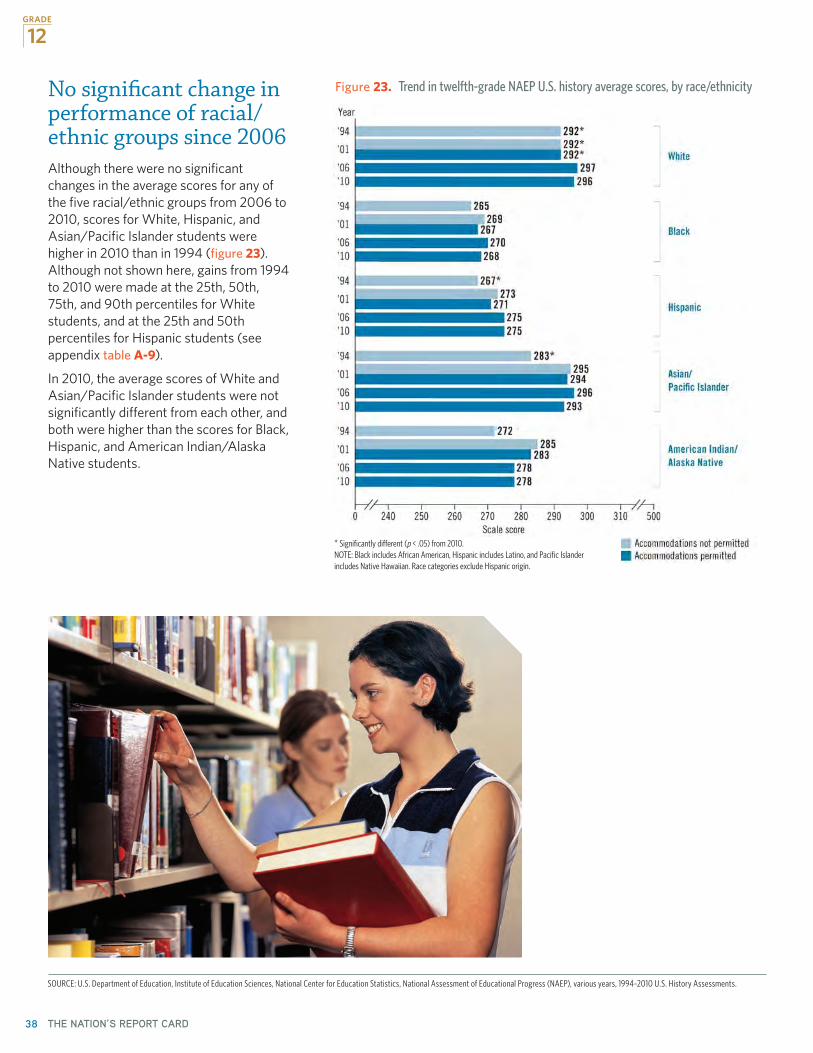
38 THE NATION’S REPORT CARD
No significant change in performance of racial/ethnic groups since 2006Although there were no significant changes in the average scores for any of the five racial/ethnic groups from 2006 to 2010, scores for White, Hispanic, and Asian/Pacific Islander students were higher in 2010 than in 1994 (figure 23). Although not shown here, gains from 1994 to 2010 were made at the 25th, 50th, 75th, and 90th percentiles for White students, and at the 25th and 50th percentiles for Hispanic students (see appendix table A-9).
In 2010, the average scores of White and Asian/Pacific Islander students were not significantly different from each other, and both were higher than the scores for Black, Hispanic, and American Indian/Alaska Native students.
Figure 23. Trend in twelfth-grade NAEP U.S. history average scores, by race/ethnicity
* Significantly different (p < .05) from 2010.NOTE: Black includes African American, Hispanic includes Latino, and Pacific Islander includes Native Hawaiian. Race categories exclude Hispanic origin.
SOURCE: U.S. Department of Education, Institute of Education Sciences, National Center for Education Statistics, National Assessment of Educational Progress (NAEP), various years, 1994–2010 U.S. History Assessments.
12GRADE

39
12
U.S. HISTORY 2010
SOURCE: U.S. Department of Education, Institute of Education Sciences, National Center for Education Statistics, National Assessment of Educational Progress (NAEP), various years, 1994–2010 U.S. History Assessments.
Racial/ethnic gaps persistIn 2010, White students scored 27 points higher on average than Black students and 20 points higher than Hispanic students (figure 24). There was no significant change in either gap in comparison to earlier assessment years.
Figure 24. Trend in twelfth-grade NAEP U.S. history average scores and score gaps, by selected racial/ethnic groups
* Significantly different (p < .05) from 2010.NOTE: Black includes African American, and Hispanic includes Latino. Race categories exclude Hispanic origin. Score gaps are calculated based on differences between unrounded average scores.
Percentage of Hispanic students increases over timeIn comparison to the first assessment year in 1994, the percentage of White students at grade 12 has decreased, while the percentages of Hispanic and Asian/Pacific Islander students have increased (table 8). There have been no significant changes in the proportion of twelfth-graders in the five racial/ethnic groups from 2006 to 2010.
Table 8. Percentage of students assessed in twelfth-grade NAEP U.S. history, by race/ethnicity: Various years, 1994–2010
Race/ethnicity 19941 2001 2006 2010
White 75* 72* 66 62
Black 13 13 13 13
Hispanic 7* 9* 13 16
Asian/Pacific Islander 4* 4* 6 6
American Indian/ Alaska Native 1 1 2 1
* Significantly different (p < .05) from 2010.1 Accommodations not permitted.N OTE: Black includes African American, Hispanic includes Latino, and Pacific Islander includes Native Hawaiian. Race categories exclude Hispanic origin. Detail may not sum to totals because results are not shown for students whose race/ethnicity was unclassified.
GRADE

40
12
THE NATION’S REPORT CARD
Male students score higher than female students in 2010Male students scored higher on average than female students in 2010 (figure 25). The average score for male students did not change significantly from 2006 to 2010 but was higher in 2010 than in 1994. The score for female students in 2010 was not significantly different from the scores for female students in 2006 or 1994. The 4-point score gap between the two groups in 2010 was not significantly different from the gap in previous assessment years (note that the score-point
difference between male and female students was not statistically significant in 2001).
Although not shown here, average scores were higher for male students than female students in the democracy and world role themes. However, there were no significant differences in average scores for male and female students in the culture and technology themes.
Figure 25. Trend in twelfth-grade NAEP U.S. history average scores and score gaps, by gender
* Significantly different (p < .05) from 2010.NOTE: Score gaps are calculated based on differences between unrounded average scores. The score difference between male and female students was not found to be statistically significant in 2001.
Additional Results for Student GroupsAchievement-level results and percentile scores provide additional insight into the performance of student groups. See appendix tables A-8 and A-9 for additional twelfth-grade results for the student groups highlighted in this section. Similar NAEP results for other student groups can be found in the NAEP Data Explorer at http://nces.ed.gov/nationsreportcard/naepdata/.
SOURCE: U.S. Department of Education, Institute of Education Sciences, National Center for Education Statistics, National Assessment of Educational Progress (NAEP), various years, 1994–2010 U.S. History Assessments.
GRADE

41
12
U.S. HISTORY 2010
SOURCE: U.S. Department of Education, Institute of Education Sciences, National Center for Education Statistics, National Assessment of Educational Progress (NAEP), various years, 1994–2010 U.S. History Assessments.
Score decreases since 2006 for students whose parents had some education after high schoolAs with eighth-graders, twelfth-graders were also asked to report the highest level of education completed by each parent. Although there was no significant change since 2006 in the overall average score for twelfth-graders, students who reported that the highest level of education completed by either parent was some education after high school scored lower in 2010 than in 2006 (figure 26). There were no significant changes from 1994 to 2010 in the average scores for students reporting different levels of parental education.
Scores in 2010 were higher for students who reported higher levels of parental education than for those who reported lower levels. For example, students whose parents graduated from college had higher scores than those whose parents had some education after high school, who in turn scored higher than those whose parents’ highest level of education was high school.
Figure 26. Trend in twelfth-grade NAEP U.S. history average scores, by highest level of parental education
* Significantly different (p < .05) from 2010.
One-half of twelfth-graders report parents completed collegeIn 2010, fifty percent of twelfth-graders reported at least one parent graduated from college (table 9). There were no significant changes from 2006 to 2010 in the percentages of students who reported different levels of parental education; however, there was an increase from 1994 to 2010 in the percentage of students whose parents graduated from college, and corresponding decreases in the percentages whose parents’ highest level of education was high school or some education after high school.
Table 9. Percentage of students assessed in twelfth-grade NAEP U.S. history, by highest level of parental education: Various years, 1994–2010
Parental education level 19941 2001 2006 2010
Did not finish high school 7 7 8 8
Graduated from high school 20* 19* 18 17
Some education after high school 25* 24* 23 22
Graduated from college 45* 46* 49 50
Don’t know 3 3 2 3
* Significantly different (p < .05) from 2010.1 Accommodations not permitted.NOTE: Detail may not sum to totals because of rounding.
GRADE
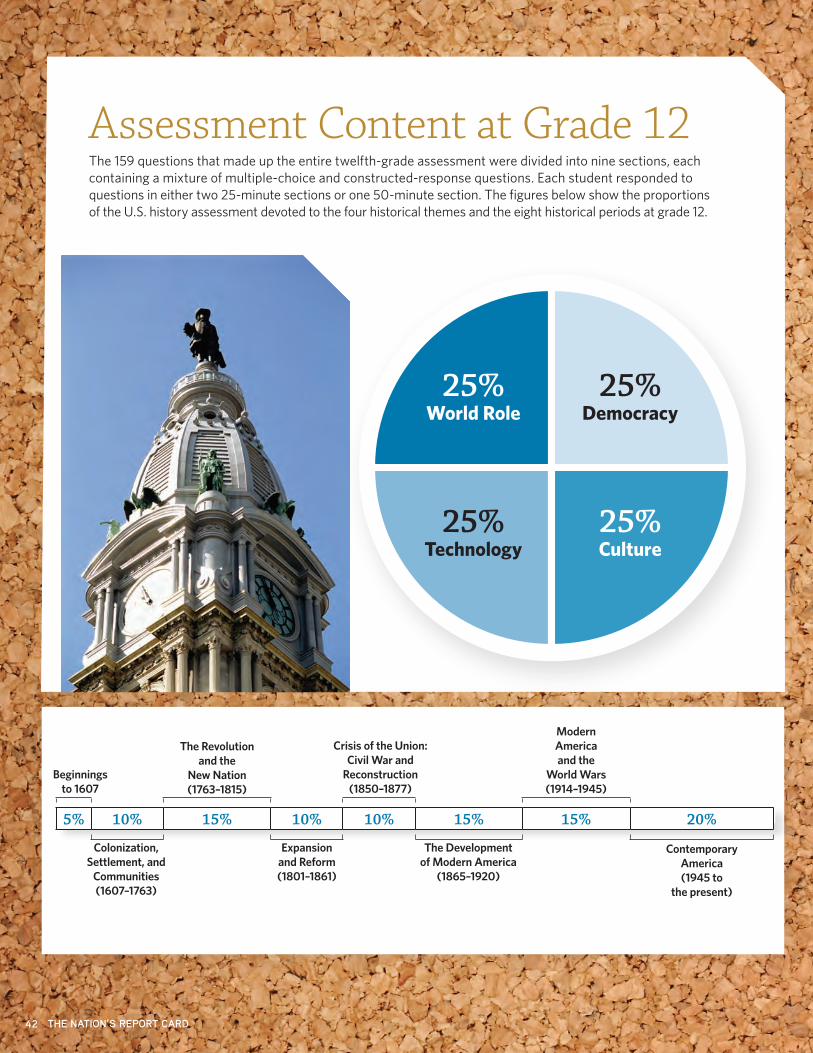
Assessment Content at Grade 12The 159 questions that made up the entire twelfth-grade assessment were divided into nine sections, each containing a mixture of multiple-choice and constructed-response questions. Each student responded to questions in either two 25-minute sections or one 50-minute section. The figures below show the proportions of the U.S. history assessment devoted to the four historical themes and the eight historical periods at grade 12.
25%Democracy
25%Culture
25%Technology
25%World Role
THE NATION’S REPORT CARD
5% 10% 15% 10% 10% 15% 15% 20%
Beginnings to 1607
The Revolution and the
New Nation (1763–1815)
Crisis of the Union: Civil War and
Reconstruction (1850–1877)
Modern America and the
World Wars (1914–1945)
Colonization, Settlement, and
Communities (1607–1763)
Expansion and Reform (1801–1861)
The Development of Modern America
(1865–1920)
Contemporary America (1945 to
42
the present)

43U.S. HISTORY 2010
U.S. History Achievement-Level Descriptions for Grade 12NAEP U.S. history achievement-level descriptions outline certain expectations of student performance. The specific descriptions of what twelfth-graders should know and be able to do at the Basic, Proficient, and Advanced levels in U.S. history are presented below. NAEP achievement levels are cumulative; therefore, student performance at the Proficient level includes the competencies associated with the Basic level, and the Advanced level includes the skills and knowledge associated with both the Basic and the Proficient levels. The cut score indicating the lower end of the score range for each level is noted in parentheses.
Basic (294) Twelfth-grade students performing at the Basic level should be able to identify the significance of many people, places, events, dates, ideas, and documents in U.S. history. They should also recognize the importance of unity and diversity in the social and cultural history of the United States and have an awareness of America’s changing relationships with the rest of the world. They should have a sense of continuity and change in history and be able to relate relevant experience from the past to their under-standing of contemporary issues. They should recognize that history is subject to interpretation and should understand the role of evidence in making a histori-cal argument.
Proficient (325) Twelfth-grade students performing at the Proficient level should understand particular people, places, events, ideas, and documents in historical context, with some awareness of the political, economic, geographic, social, religious, technological, and ideological factors that shape historical settings. They should be able to communicate rea-soned interpretations of past events, using historical evidence effectively to support their positions. Their written arguments should reflect some in-depth grasp of issues and should refer to both primary and secondary sources.
Advanced (355) Twelfth-grade students achieving at the Advanced level should demonstrate a comprehensive understanding of events and sources of U.S. history. Recognizing that history is subject to interpretation, they should be able to evaluate histori-cal claims critically in light of the evi-dence. They should understand that important issues and themes have been addressed differently at different times and that America’s political, social, and cultural traditions have changed over time. They should be able to write well-reasoned arguments on complex historical topics and draw upon a wide range of sources to inform their conclusions.
GRADE
12

44 THE NATION’S REPORT CARD
What Twelfth-Graders Know and Can Do in U.S. HistoryThe item map below illustrates the range of U.S. history knowledge and skills demonstrated by twelfth-graders. The scale scores on the left represent the scores for students who were likely to get the items correct or complete. The cut score at the lower end of the range for each achievement level is boxed. The descriptions of selected assessment questions indicating what students need to do to answer the question correctly, along with the corresponding theme of U.S. history,
are listed on the right. For example, the map on this page shows that twelfth-graders performing at the Basic level with a score of 316 were likely to be able to interpret a cartoon about the Cold War. Students at the Proficient level with a score of 344 were likely to be able to interpret a quotation by Henry David Thoreau. Students performing at the Advanced level with a score of 379 were likely to be able to explain how political campaigns have changed since 1948.
GRADE 12 NAEP U.S. HISTORY ITEM MAPScale score Theme Question description
Advanced
500
//402 World Role Evaluate arguments about the use of atomic bombs394 Democracy Evaluate Civil War arguments389 World Role Define and explain the purpose of the Proclamation Line of 1763379 Technology Explain how political campaigns have changed since 1948366 Democracy Identify Maryland as an early grantor of religious freedom357 World Role Identify North Korea’s ally in the Korean War (shown on page 45)355
Proficient
352 Culture Explain a trend in the U.S. population344 Democracy Interpret a Henry David Thoreau quotation342 Technology Compare the purposes of labor unions337 Democracy Understand Missouri statehood in the context of sectionalism (shown on page 45)335 Technology Understand a key aspect of the colonial economy329 World Role Understand the U.S. entry into World War I325 Culture Understand the context of a Frederick Jackson Turner quotation325
Basic
321 Culture Explain an impact of World War II on African Americans’ struggle for rights (shown on pages 46 and 47)318 Democracy Understand the context of a women’s movement document316 World Role Interpret a Cold War cartoon308 Technology Identify products shipped along the triangular trade route (shown on page 48)294
290 Democracy Understand the historical role of third parties273 Democracy Identify the states’ rights issue in 1832 quotation256
//0
World Role Identify the message of a World War II poster
NOTE: Regular type denotes a constructed-response question. Italic type denotes a multiple-choice question. The position of a question on the scale represents the scale score attained by students who had a 65 percent probability of successfully answering a constructed-response question, or a 74 percent probability of correctly answering a four-option multiple-choice question. For constructed-response questions, the question description represents students’ performance rated as completely correct. Scale score ranges for U.S. history achievement levels are referenced on the map.
SOURCE: U.S. Department of Education, Institute of Education Sciences, National Center for Education Statistics, National Assessment of Educational Progress (NAEP), 2010 U.S. History Assessment.
GRADE
12

45
12
U.S. HISTORY 2010
GRADE
U.S. History Theme: Democracy
Why did Missouri’s application for statehood in 1819 cause a political crisis?
A The United States had equal numbers of slave and free states, and Missouri’s entry would have upset the balance.
B The United States had never before established a state west of the Mississippi, and Missouri’s entry would have likely caused conflict with American Indians.
C Missouri was a center of abolitionist activity, and its admission would have antagonized southern states.
D Missouri was a center of secessionist activity, and its entry would have antagonized northern states.
This sample multiple-choice question from the twelfth-grade 2010 U.S. history assessment measures students’ knowledge of the sectional tensions that were growing in the first half of the nineteenth century. Forty-five percent of twelfth-graders were able to identify that Missouri’s application for statehood endangered the delicate balance between free and slave states.
Percentage of twelfth-grade students in each response category: 2010Choice A Choice B Choice C Choice D Omitted
45 26 20 8 1
The table below shows the percentage of twelfth-graders within each achievement level who answered this question correctly. For example, 64 percent of students performing at the Basic level selected the correct answer choice.
Percentage of twelfth-grade students responding correctly at each achievement level: 2010
Overall Below Basic At Basic At Proficient At Advanced
45 24 64 92 ‡‡ Reporting standards not met. The number of students who answered this question and scored at the Advanced level was insufficient to permit a reliable estimate.
U.S. History Theme: World Role
During the Korean War, United Nations forces made up largely of troops from the United States and South Korea fought against troops from North Korea and
A the Soviet Union
B Japan
C China
D Vietnam
This sample question measures twelfth-graders’ knowledge of the major national combatants during the Korean War. Twenty-two percent of students were able to identify China as North Korea’s ally during the war.
Percentage of twelfth-grade students in each response category: 2010Choice A Choice B Choice C Choice D Omitted
38 16 22 23 1
The table below shows the percentage of twelfth-graders within each achievement level who answered this question correctly. For example, 25 percent of students at the Basic level selected the correct answer choice.
Percentage of twelfth-grade students responding correctly at each achievement level: 2010
Overall Below Basic At Basic At Proficient At Advanced
22 13 25 52 ‡‡ Reporting standards not met. The number of students who answered this question and scored at the Advanced level was insufficient to permit a reliable estimate.
SOURCE: U.S. Department of Education, Institute of Education Sciences, National Center for Education Statistics, National Assessment of Educational Progress (NAEP), 2010 U.S. History Assessment.

46
12
THE NATION’S REPORT CARD
U.S. History Theme: Culture
COMPLETE RESPONSE:
Citing Sources L and M and your knowledge of United States history, explain how events of the Second World War inspired many African Americans to argue for civil rights at home.
GRADE

47
12
U.S. HISTORY 2010
GRADE
This sample constructed-response question (shown on the previous page) was part of a 50-minute section of questions, all of which focused on the home front during the Second World War. Like all the questions in the section, this one required students to engage with a variety of primary and secondary source documents. Here, students read a short statement by union leader A. Philip Randolph and a longer recollection that appeared in a book about the home front. The question measures students’ ability to analyze the docu-ments and place them in historical context. Responses were rated using three scoring levels. Spelling and grammar were not considered in rating students’ responses.
Complete responses explained, with clear references to the sources, the relationship between the war and the issue of civil rights for African Americans at home. Credited responses demonstrated an understanding that, because the war was being fought for democracy and against racism abroad, it was logical that African Americans would be more critical of problems in American society.
Partial responses explained in a general way the relation-ship between the war and the civil rights of African Americans at home.
Inappropriate responses did not explain the relationship between the war and civil rights for African Americans at home.
The sample student response shown on the previous page was rated “Complete” because it draws on information in the text and explains how African Americans’ experiences during the war both highlighted their unequal treatment and held out the promise of something better if they seized the opportunity. Twenty-two percent of twelfth-graders’ responses to this question received a rating of “Complete.”
Percentage of twelfth-grade students in each response category: 2010Complete Partial Inappropriate Omitted
22 34 42 1NOTE: Detail may not sum to totals because the percentage of responses rated as “Off-task” is not shown. Off-task responses are those that do not provide any information related to the assessment task.
The following table shows the percentage of twelfth-graders within each achievement level whose responses received a rating of “Complete” on this question. For example, among students performing at the Basic level, 30 percent provided responses rated as “Complete.”
Percentage of twelfth-grade students’ responses rated as “Complete” at each achievement level: 2010
Overall Below Basic At Basic At Proficient At Advanced
22 8 30 54 ‡‡ Reporting standards not met. The number of students who answered this question and scored at the Advanced level was insufficient to permit a reliable estimate.
SOURCE: U.S. Department of Education, Institute of Education Sciences, National Center for Education Statistics, National Assessment of Educational Progress (NAEP), 2010 U.S. History Assessment.

48
12
THE NATION’S REPORT CARD
GRADE
U.S. History Theme: Technology
In colonial times, what made up much of the trade that went along the route marked I on the map?
A Manufactured goods from the West Indies and slaves from North America
B Sugar and rum from the West Indies and grain and meat from North America
C Indigo from the West Indies and gold from North America
D Dried fish from the West Indies and oil and coal from North America
This sample multiple-choice question is part of a two- question set of items that measures students’ knowledge about the Atlantic triangular trade that operated during the colonial period. Fifty-six percent of twelfth-graders were able to identify the products that generally shipped along the route between the Caribbean and New England, marked with the letter “I” on the map.
Percentage of twelfth-grade students in each response category: 2010Choice A Choice B Choice C Choice D Omitted
24 56 10 9 1
The table below shows the percentage of twelfth-graders within each achievement level who answered this question correctly. For example, 68 percent of students at the Basic level selected the correct answer choice.
Percentage of twelfth-grade students responding correctly at each achievement level: 2010
Overall Below Basic At Basic At Proficient At Advanced
56 42 68 89 ‡‡ Reporting standards not met. The number of students who answered this question and scored at the Advanced level was insufficient to permit a reliable estimate.
SOURCE: U.S. Department of Education, Institute of Education Sciences, National Center for Education Statistics, National Assessment of Educational Progress (NAEP), 2010 U.S. History Assessment.
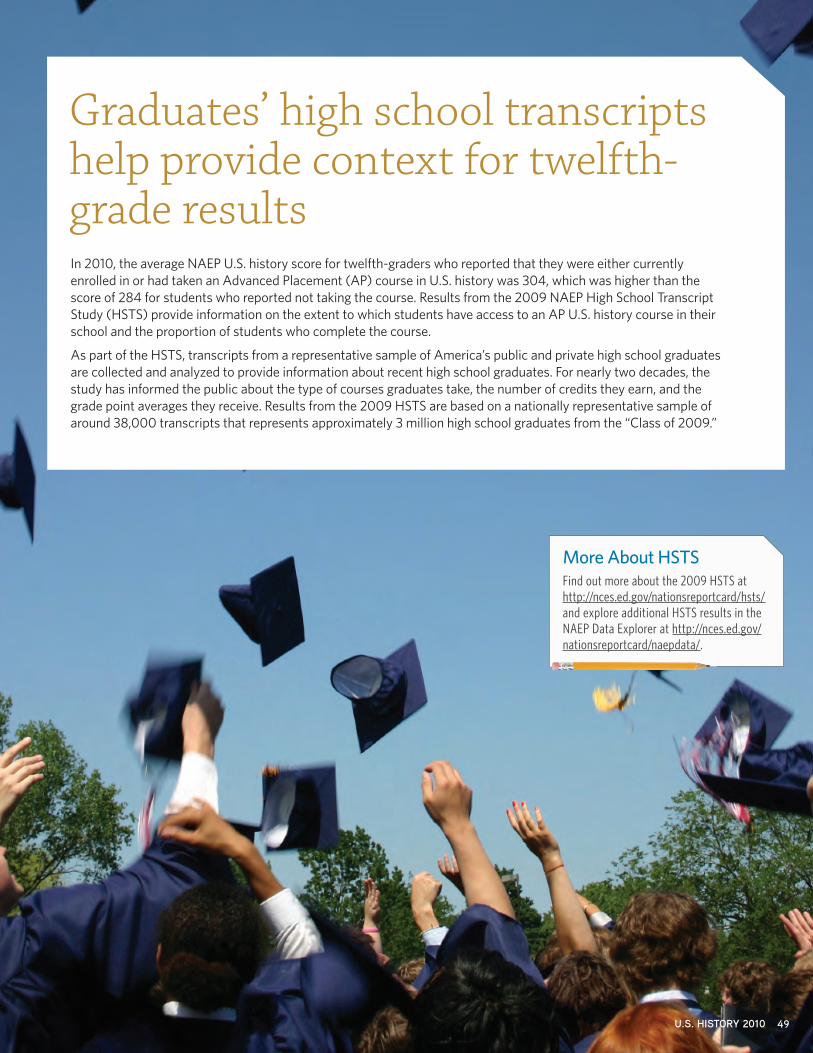
Graduates’ high school transcripts help provide context for twelfth-grade resultsIn 2010, the average NAEP U.S. history score for twelfth-graders who reported that they were either currently enrolled in or had taken an Advanced Placement (AP) course in U.S. history was 304, which was higher than the score of 284 for students who reported not taking the course. Results from the 2009 NAEP High School Transcript Study (HSTS) provide information on the extent to which students have access to an AP U.S. history course in their school and the proportion of students who complete the course.
As part of the HSTS, transcripts from a representative sample of America’s public and private high school graduates are collected and analyzed to provide information about recent high school graduates. For nearly two decades, the study has informed the public about the type of courses graduates take, the number of credits they earn, and the grade point averages they receive. Results from the 2009 HSTS are based on a nationally representative sample of around 38,000 transcripts that represents approximately 3 million high school graduates from the “Class of 2009.”
More About HSTSFind out more about the 2009 HSTS at http://nces.ed.gov/nationsreportcard/hsts/ and explore additional HSTS results in the NAEP Data Explorer at http://nces.ed.gov/nationsreportcard/naepdata/.
49U.S. HISTORY 2010

50
12
THE NATION’S REPORT CARD
GRADE
Access to AP U.S. history course increasesFor this analysis, graduates were considered to have access to an AP U.S. history course if at least one student in the school took the course or the course was listed in the school catalogue or course list (see the Technical Notes for more information about the 2009 HSTS). Differences in students’ access may be attributed to a number of factors, such as school enrollment.
From 1990 to 2009, the percentage of graduates who had access to an AP U.S. history course increased from 51 percent to 80 percent (figure 27). The same pattern was observed for the four reported racial/ethnic groups, with the larger increases for Black graduates (50 percent to 83 percent) and Hispanic graduates (54 percent to 91 percent).
In 1990, there were no significant differences in the percent-ages of White, Black, and Hispanic graduates who had access to AP U.S. history. In 2009, however, the percentage of White graduates with access was lower than that for Black or Hispanic graduates. While larger percentages of
Asian/Pacific Islander graduates had access than Hispanic graduates in 1990, there was no significant difference between these two groups in 2009.
Figure 27. Percentage of high school graduates who had access to an Advanced Placement (AP) course in U.S. history, by race/ethnicity: 1990 and 2009
* Significantly different (p < .05) from 2009.NOTE: Black includes African American, Hispanic includes Latino, and Pacific Islander includes Native Hawaiian. Race categories exclude Hispanic origin. Results are not shown separately for students whose race/ethnicity was American Indian/Alaska Native or unclassified.
Access to AP U.S. history lags in low minority schools and non-large city schoolsAccess to an AP U.S. history course varied by the racial/ethnic composition of the schools. Those in schools with less than 10 percent Black or Hispanic students (termed “low minority”) had less access in 2009 than graduates in schools with medium concentrations (10 percent to 49 percent) or high concentrations (50 percent or more) of minority students (figure 28). While there was no significant difference in access between graduates in low and high minority schools in 1990, 66 percent of graduates in low minority schools had access compared to 90 percent in high minority schools in 2009.
Figure 28. Percentage of high school graduates who had access to an Advanced Placement (AP) course in U.S. history, by school minority status: 1990 and 2009
Differences in access were also evident for graduates in schools located in large cities (cities with populations of 250,000 or more) compared with those in other locations (such as subur-ban or rural). In 2009, a higher percentage of graduates in large city schools than in other locations had access to an AP U.S. history course (figure 29). The percentage of graduates with access in locations other than large cities increased from 2000 to 2009.
* Significantly different (p < .05) from 2009.NOTE: Low minority = Schools with less than 10 percent minority students. Medium minority = Schools with 10 to 49 percent minority students. High minority = Schools with 50 percent or more minority students.
Figure 29. Percentage of high school graduates who had access to an Advanced Placement (AP) course in U.S. history, by type of school location: 2000 and 2009
* Significantly different (p < .05) from 2009.NOTE: Comparisons to 1990 and by more specific types of location were not possible because of changes in how school locations were classified.
SOURCE: U.S. Department of Education, Institute of Education Sciences, National Center for Education Statistics, High School Transcript Study (HSTS), 1990, 2000, and 2009.
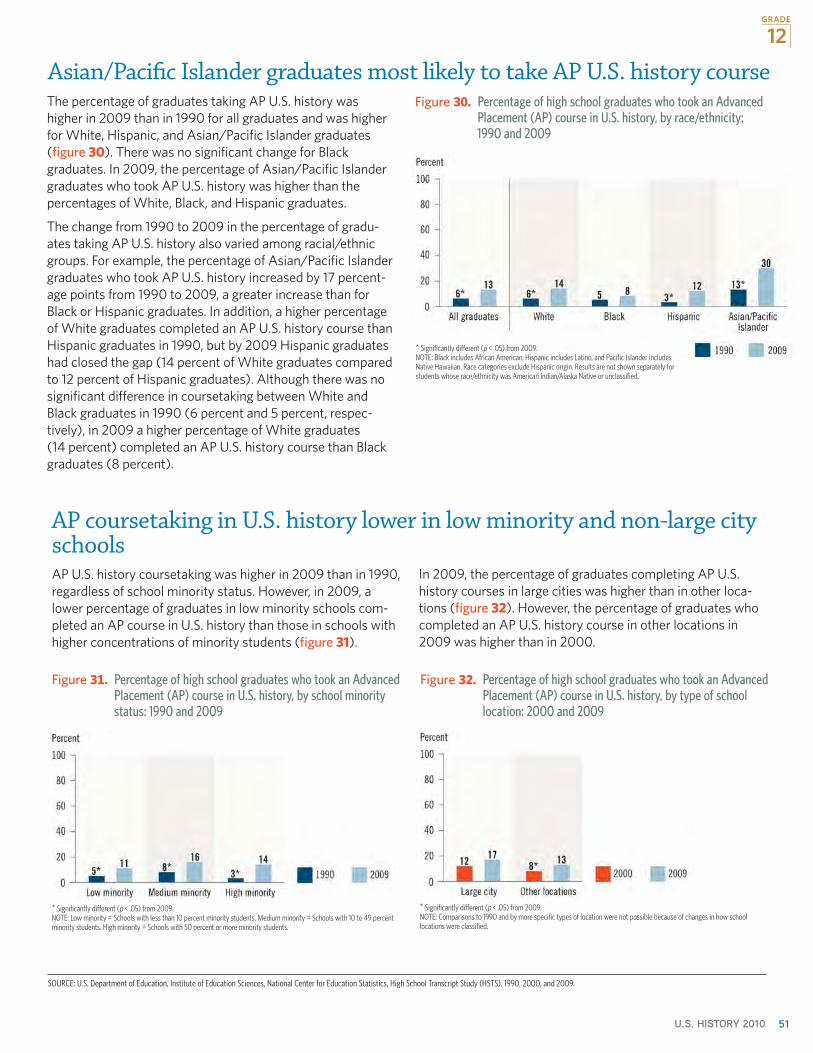
51
12
U.S. HISTORY 2010
GRADE
Asian/Pacific Islander graduates most likely to take AP U.S. history courseThe percentage of graduates taking AP U.S. history was higher in 2009 than in 1990 for all graduates and was higher for White, Hispanic, and Asian/Pacific Islander graduates (figure 30). There was no significant change for Black graduates. In 2009, the percentage of Asian/Pacific Islander graduates who took AP U.S. history was higher than the percentages of White, Black, and Hispanic graduates.
The change from 1990 to 2009 in the percentage of gradu-ates taking AP U.S. history also varied among racial/ethnic groups. For example, the percentage of Asian/Pacific Islander graduates who took AP U.S. history increased by 17 percent-age points from 1990 to 2009, a greater increase than for Black or Hispanic graduates. In addition, a higher percentage of White graduates completed an AP U.S. history course than Hispanic graduates in 1990, but by 2009 Hispanic graduates had closed the gap (14 percent of White graduates compared to 12 percent of Hispanic graduates). Although there was no significant difference in coursetaking between White and Black graduates in 1990 (6 percent and 5 percent, respec-tively), in 2009 a higher percentage of White graduates (14 percent) completed an AP U.S. history course than Black graduates (8 percent).
Figure 30. Percentage of high school graduates who took an Advanced Placement (AP) course in U.S. history, by race/ethnicity: 1990 and 2009
* Significantly different (p < .05) from 2009.NOTE: Black includes African American, Hispanic includes Latino, and Pacific Islander includes Native Hawaiian. Race categories exclude Hispanic origin. Results are not shown separately for students whose race/ethnicity was American Indian/Alaska Native or unclassified.
AP coursetaking in U.S. history lower in low minority and non-large city schoolsAP U.S. history coursetaking was higher in 2009 than in 1990, regardless of school minority status. However, in 2009, a lower percentage of graduates in low minority schools
an AP course in U.S. historcom-
pleted y than those in schools with higher concentrations of minority students (figure 31).
In 2009, the percentage of graduates completing AP U.S. history courses in large cities was higher than in other loca-tions (figure 32). However, the percentage of graduates who completed an AP U.S. history course in other locations in 2009 was higher than in 2000.
Figure 31. Percentage of high school graduates who took an Advanced Placement (AP) course in U.S. history, by school minority status: 1990 and 2009
* Significantly different (p < .05) from 2009.NOTE: Low minority = Schools with less than 10 percent minority students. Medium minority = Schools with 10 to 49 percent minority students. High minority = Schools with 50 percent or more minority students.
Figure 32. Percentage of high school graduates who took an Advanced Placement (AP) course in U.S. history, by type of school location: 2000 and 2009
* Significantly different (p < .05) from 2009.NOTE: Comparisons to 1990 and by more specific types of location were not possible because of changes in how school locations were classified.
SOURCE: U.S. Department of Education, Institute of Education Sciences, National Center for Education Statistics, High School Transcript Study (HSTS), 1990, 2000, and 2009.

SOURCE: U.S. Department of Education, Institute of Education Sciences, National Center for Education Statistics, National Assessment of Educational Progress (NAEP), 2010 U.S. History Assessment.
Technical NotesSampling and WeightingThe schools and students participating in NAEP assessments are selected to be representative of all schools nationally. The results from the assessed students are combined to provide accurate estimates of the overall performance of students in both public and nonpublic schools in the nation. More infor-mation on sampling can be found at http://nces.ed.gov/nationsreportcard/about/nathow.asp.
Because each school that participated in the assessment, and each student assessed, represents a portion of the population of interest, the results are weighted to account for the dispro-portionate representation of the selected sample. This in-cludes the oversampling of schools with high concentrations of students from certain racial/ethnic groups and the lower sampling rates of students who attend very small schools.
School and Student ParticipationTo ensure unbiased samples, NAEP statistical standards require that participation rates for original school samples be 70 percent or higher to report national results separately for public and private schools. In instances where participation rates meet the 70 percent criterion but fall below 85 percent, a nonresponse bias analysis is conducted to determine if the responding sample is not representative of the population, thereby introducing the potential for nonresponse bias. The numbers of participating schools and students along with the weighted participation rates for the 2010 U.S. history assess-ment are presented in table TN-1. Participation rate stan-dards were not met for private schools at grades 4 and 12; therefore, results for private schools are not reported sepa-rately at those grades.
Table TN-1. School and student participation rates in NAEP U.S. history, by grade and type of school: 2010School participation Student participation
Grade and type of schoolStudent-weighted
percentNumber of schools
participatingStudent-weighted
percentNumber of students
assessed
Grade 4
Nation 96 510 95 7,000
Public 99 440 95 6,600
Private 68 70 95 500
Grade 8
Nation 96 480 93 11,800
Public 99 400 93 10,900
Private 74 80 96 900
Grade 12
Nation 89 500 83 12,400
Public 91 420 82 10,900
Private 67 80 91 1,500
NOTE: The number of schools is rounded to the nearest ten. The number of students is rounded to the nearest hundred. Detail may not sum to totals because of rounding.
52 THE NATION’S REPORT CARD

Nonresponse bias analyses were conducted for the private school samples at all three grades. The results of these analyses showed that, while the original responding school samples may not have been fully representative, including substitute schools and adjusting the sampling weights to account for school nonresponse were at least partially effective in reducing the potential for nonresponse bias. After school substitution and nonresponse adjustments, a remaining potential bias at grade 8 was that schools in the Midwest were somewhat overrepresented in the final sample of private schools (32 percent in the responding sample compared to 29 percent in the full sample) and Northeast schools were somewhat underrepresented (16 percent, compared to 21 percent in the full sample). At grade 12, the application of nonresponse weight adjustments actually increased the potential bias with respect to school size, size of school attended by the average student, and estimated grade enrollment, suggesting that there remains a significant potential for nonresponse bias for grade 12 private schools. The phenomenon that nonresponse adjustments potentially increase biases related to school size appears to be explained by the fact that it was larger non-Catholic private schools that did not respond, and so adjustments made to address the underrepresentation of those schools resulted in overrep-resenting small schools at the expense of larger ones (a mean estimated grade enrollment of 38 in the responding sample compared to a full sample mean of 46).
An analysis was also performed to examine the potential for nonresponse bias introduced through student nonresponse in grade 12 public schools, where the weighted student response rate was 82 percent. The analysis showed that the sample of responding students differed from the original student sample with respect to gender, relative age, and student disability status. After adjusting the sampling weights to account for student nonresponse, there was no evidence of substantial bias, with the nonresponse-adjusted estimates for three variables—race/ethnicity, student disabil-ity (SD) status, and English language learner (ELL) status—differing from the unadjusted estimates by 1 percent or less.
Interpreting Statistical SignificanceComparisons over time or between groups are based on statistical tests that consider both the size of the differences and the standard errors of the two statistics being compared. Standard errors are margins of error, and estimates based on smaller groups are likely to have larger margins of error. The size of the standard errors may also be influenced by other factors such as how representative the assessed students are of the entire population.
When an estimate has a large standard error, a numerical difference that seems large may not be statistically signifi-cant. Differences of the same magnitude may or may not be statistically significant depending upon the size of the stan-dard errors of the estimates. For example, a 5-point change in the average score for Hispanic eighth-graders may be statistically significant while a 15-point change for American Indian/Alaska Native students may not be. Standard errors for the estimates presented in this report are available at http://nces.ed.gov/nationsreportcard/naepdata/.
To ensure that significant differences in NAEP data reflect actual differences and not mere chance, error rates need to be controlled when making multiple simultaneous compari-sons. The more comparisons that are made (e.g., comparing the performance of White, Black, Hispanic, Asian/Pacific Islander, and American Indian/Alaska Native students), the higher the probability of finding significant differences by chance. In NAEP, the Benjamini-Hochberg False Discovery Rate (FDR) procedure is used to control the expected propor-tion of falsely rejected hypotheses relative to the number of comparisons that are conducted. A detailed explanation of this procedure can be found at http://nces.ed.gov/nationsreportcard/tdw/analysis/infer.asp. NAEP employs a number of rules to determine the number of comparisons conducted, which in most cases is simply the number of possible statistical tests. However, there is an exception where the FDR is not applied: when comparing multiple years, the number of years does not count toward the number of comparisons.
53U.S. HISTORY 2010

National School Lunch ProgramNAEP collects data on student eligibility for the National School Lunch Program (NSLP) as an indicator of low family income. Under the guidelines of NSLP, children from families with incomes below 130 percent of the poverty level are eligible for free meals. Those from families with incomes between 130 and 185 percent of the poverty level are eligible for reduced-price meals. (For the period July 1, 2009, through June 30, 2010, for a family of four, 130 percent of the poverty level was $28,665, and 185 percent was $40,793.)
Some schools provide free meals to all students irrespective of individual eligibility, using their own funds to cover the costs of noneligible students. Under special provisions of the National School Lunch Act intended to reduce the adminis-trative burden of determining student eligibility every year, schools can be reimbursed based on eligibility data for a single base year. Participating schools might have high per-centages of eligible students and report all students as eligible for free lunch.
Because of the improved quality of the data on students’ eligibility for NSLP, the percentage of students for whom information was not available has decreased compared to the percentages reported prior to the 2006 assessment. There-fore, trend comparisons are only made back to 2006 in this report. For more information on NSLP, visit http://www.fns.usda.gov/cnd/lunch/.
NAEP 2009 High School Transcript StudyThe NAEP 2009 High School Transcript Study (HSTS) was designed to achieve a nationally representative sample of public and private high school graduates from the “Class of 2009.” The HSTS sample was a subset of the NAEP 2009 twelfth-grade school sample for the 2009 mathematics and science assessments. In addition to the 2009 national results, NAEP oversampled 11 states to report state results for twelfth-grade public school students in these states. However, the oversample of the NAEP public school students was not included in the HSTS. There was no oversample or adjustment to the sample for the private school students.
Students included in the sample were graduates earning a regular or honors high school diploma in 2009. However, not all students in the HSTS sample also participated in the NAEP assessments due to absence or exclusion, but over 80 percent of those participating HSTS students did participate in NAEP.
54 THE NATION’S REPORT CARD

Appendix TablesTable A-1. Percentage of students with disabilities (SD) and/or English language learners (ELL) identified, excluded, and assessed in NAEP
U.S. history, as a percentage of all students, by grade and SD/ELL category: Various years, 1994–2010
Grade and SD/ELL category
Accommodations not permitted Accommodations permitted
1994 2001 2001 2006 2010Grade 4
SD and/or ELL Identified 13 16 18 23 22
Excluded 5 7 3 3 2Assessed 8 9 14 20 20
Without accommodations 8 9 6 10 7With accommodations † † 8 10 13
SDIdentified 10 10 13 13 13
Excluded 4 5 2 2 1Assessed 5 5 11 11 12
Without accommodations 5 5 3 3 2With accommodations † † 7 8 9
ELLIdentified 4 6 6 12 10
Excluded 1 2 1 1 1Assessed 2 4 4 10 10
Without accommodations 2 4 3 7 5With accommodations † † 1 3 4
Grade 8SD and/or ELL
Identified 11 16 17 19 17Excluded 5 8 3 2 2Assessed 6 8 13 17 16
Without accommodations 6 8 7 7 4With accommodations † † 6 10 11
SDIdentified 8 12 13 13 12
Excluded 4 7 2 2 1Assessed 5 5 10 11 11
Without accommodations 5 5 4 3 2With accommodations † † 6 9 9
ELLIdentified 2 4 4 7 6
Excluded 1 1 1 1 #Assessed 1 3 3 6 6
Without accommodations 1 3 3 4 3With accommodations † † # 2 3
Grade 12SD and/or ELL
Identified 8 11 10 13 13Excluded 3 4 2 2 2Assessed 5 6 7 11 11
Without accommodations 5 6 5 4 3With accommodations † † 3 6 9
SDIdentified 6 8 8 10 10
Excluded 3 4 2 2 2Assessed 3 4 5 7 8
Without accommodations 3 4 3 2 1With accommodations † † 2 5 7
ELLIdentified 2 3 2 4 4
Excluded # 1 # # #Assessed 1 2 2 4 4
Without accommodations 1 2 2 2 2With accommodations † † # 1 2
† Not applicable. Accommodations were not permitted in this assessment year.# Rounds to zero.NOTE: Students identified as both SD and ELL were counted only once under the combined SD and/or ELL category, but were counted separately under the SD and ELL categories. Detail may not sum to totals because of rounding. SOURCE: U.S. Department of Education, Institute of Education Sciences, National Center for Education Statistics, National Assessment of Educational Progress (NAEP), various years, 1994–2010 U.S. History Assessments.
55U.S. HISTORY 2010

Table A-2. Percentage of students with disabilities (SD) and/or English language learners (ELL) identified, excluded, and assessed in NAEP U.S. history, as a percentage of all students, by grade, selected racial/ethnic groups, and SD/ELL category: 2010
SD/ELL category
Grade 4 Grade 8 Grade 12
White Black Hispanic White Black Hispanic White Black Hispanic
SD and/or ELL Identified 14 17 46 12 16 32 10 15 23
Excluded 1 2 2 1 2 2 2 3 2Assessed 13 15 43 11 14 30 8 12 21
Without accommodations 3 2 22 2 2 14 1 1 8With accommodations 10 13 22 10 12 16 7 11 13
SDIdentified 13 16 12 12 15 12 10 14 11
Excluded 1 2 2 1 2 1 2 3 2Assessed 12 14 10 11 13 10 8 11 9
Without accommodations 3 2 1 2 2 2 1 1 1With accommodations 9 13 9 9 12 9 7 10 7
ELLIdentified 1 1 39 1 1 23 # 1 15
Excluded # # 1 # # 1 # # 1Assessed 1 1 38 1 1 22 # 1 14
Without accommodations # # 21 # # 13 # # 7With accommodations 1 1 17 # 1 9 # 1 7
SOURCE: U.S. Department of Education, Institute of Education Sciences, National Center for Education Statistics, National Assessment of Educational Progress (NAEP), 2010 U.S. History Assessment.
# Rounds to zero.NOTE: Black includes African American, and Hispanic includes Latino. Race categories exclude Hispanic origin. Students identified as both SD and ELL were counted only once under the combined SD and/or ELL category, but were counted separately under the SD and ELL categories. Detail may not sum to totals because of rounding.
56 THE NATION’S REPORT CARD

57
Table A-3. Percentage of students identified as students with disabilities (SD) and/or English language learners (ELL) excluded and assessed in NAEP U.S. history, as a percentage of identified SD and/or ELL students, by grade and SD/ELL category: 2010
Grade and SD/ELL category
Percentage of identified SD and/or ELL students
Excluded AssessedAssessed without accommodations
Assessed with accommodations
Grade 4
SD and/or ELL 8 92 33 59
SD 11 89 16 72
ELL 5 95 51 44
Grade 8
SD and/or ELL 9 91 26 65
SD 10 90 13 77
ELL 7 93 51 42
Grade 12
SD and/or ELL 15 85 21 64
SD 19 81 11 70
ELL 8 92 44 48
NOTE: Students identified as both SD and ELL were counted only once under the combined SD and/or ELL category, but were counted separately under the SD and ELL categories. Detail may not sum to totals because of rounding. SOURCE: U.S. Department of Education, Institute of Education Sciences, National Center for Education Statistics, National Assessment of Educational Progress (NAEP), 2010 U.S. History Assessment.
U.S. HISTORY 2010

58 THE NATION’S REPORT CARD
Tabl
e A
-4.
Achi
evem
ent-l
evel
resu
lts fo
r fou
rth-g
rade
stud
ents
in N
AEP
U.S.
hist
ory,
by se
lecte
d ch
arac
teris
tics:
Vario
us ye
ars,
1994
–201
0
Char
acte
ristic
Perc
enta
ge o
f stu
dent
s
At o
r abo
ve Basic
At o
r abo
ve Proficient
At Advanced
Acco
mm
odat
ions
not
pe
rmitt
edAc
com
mod
atio
ns p
erm
itted
Acco
mm
odat
ions
not
pe
rmitt
edAc
com
mod
atio
ns p
erm
itted
Acco
mm
odat
ions
not
pe
rmitt
edAc
com
mod
atio
ns p
erm
itted
1994
2001
2001
2006
2010
1994
2001
2001
2006
2010
1994
2001
2001
2006
2010
Race
/eth
nici
tyW
hite
73*
78*
76*
8483
21*
2323
*26
283
33
23
Blac
k35
*42
*41
*46
544
65
58
##
##
1Hi
span
ic36
*39
*40
*49
564
66
67
#1
#1
#As
ian/
Paci
fic Is
land
er62
*69
*74
7182
1819
2222
232
43
24
Amer
ican
Indi
an/A
lask
a Na
tive
‡‡
‡41
49‡
‡‡
69
‡‡
‡#
#
Gend
er
Mal
e62
*66
*65
*69
7318
1919
2022
22
22
3Fe
mal
e65
*68
*67
*70
7316
1717
1618
22
21
2El
igib
ility
for f
ree
or re
duce
d-pr
ice
scho
ol lu
nch
Elig
ible
for f
ree
lunc
h—
——
48*
55—
——
56
——
—#
#El
igib
le fo
r red
uced
-pric
e lu
nch
——
—66
71—
——
1011
——
—#
#No
t elig
ible
——
—84
86—
——
2731
——
—3
4In
form
atio
n no
t ava
ilabl
e—
——
8583
——
—33
35—
——
55
— N
ot av
ailab
le. R
esul
ts fo
r the
1994
and
2001
asse
ssm
ent y
ears
are n
ot re
porte
d be
caus
e of t
he im
prov
ed q
ualit
y of t
he d
ata o
n st
uden
ts’ e
ligib
ility f
or th
e sch
ool lu
nch
prog
ram
beg
inni
ng in
2006
.#
Roun
ds to
zero
.‡
Repo
rting
stan
dard
s not
met
. Sam
ple s
ize in
suffi
cient
to p
erm
it a r
eliab
le es
timat
e.* S
igni
fican
tly d
iffer
ent (
p < .
05) f
rom
2010
.NO
TE: B
lack i
nclu
des A
frica
n Am
erica
n, Hi
span
ic in
clude
s Lat
ino,
and
Pacifi
c Isla
nder
inclu
des N
ative
Haw
aiian
. Rac
e cat
egor
ies ex
clude
Hisp
anic
orig
in.
SOUR
CE: U
.S. D
epar
tmen
t of E
duca
tion,
Inst
itute
of E
duca
tion
Scien
ces,
Natio
nal C
ente
r for
Educ
atio
n St
atist
ics, N
atio
nal A
sses
smen
t of E
duca
tiona
l Pro
gres
s (NA
EP),
vario
us ye
ars,
1994
–201
0 U.
S. Hi
stor
y Ass
essm
ents
.

59
Tabl
e A
-5.
Perc
entil
e sco
res f
or fo
urth
-gra
de st
uden
ts in
NAE
P U.
S. hi
stor
y, by
selec
ted
char
acte
ristic
s: Va
rious
year
s, 19
94–2
010
Perc
entil
e an
d ye
ar
Race
/eth
nici
tyGe
nder
Elig
ibili
ty fo
r fre
e or
redu
ced-
pric
e sc
hool
lunc
h
Whi
teBl
ack
Hisp
anic
Asia
n/
Paci
fic
Isla
nder
Amer
ican
In
dian
/ Al
aska
Na
tive
Mal
eFe
mal
e
Elig
ible
fo
r fre
e lu
nch
Elig
ible
for
redu
ced-
pric
e lu
nch
Not
elig
ible
Info
rmat
ion
not
avai
labl
e10
th p
erce
ntile
Acco
mm
odat
ions
not
per
mitt
ed19
9416
6*12
0*11
5*14
9*‡
141*
153*
——
——
2001
176*
139*
131*
165
‡15
7*16
0*—
——
—Ac
com
mod
atio
ns p
erm
itted
2001
173*
138*
133*
172
‡15
5*16
0*—
——
—20
0618
614
915
116
414
816
316
815
116
618
618
620
1018
415
515
517
914
216
817
015
617
318
918
425
th p
erce
ntile
Acco
mm
odat
ions
not
per
mitt
ed19
9419
3*14
7*14
5*17
9*‡
176*
183*
——
——
2001
198*
161*
157*
188
‡18
4*18
7*—
——
—Ac
com
mod
atio
ns p
erm
itted
2001
196*
161*
158*
193
‡18
2*18
5*—
——
—20
0620
516
917
218
916
418
7*19
017
118
620
620
820
1020
417
617
720
216
519
219
217
719
220
920
650
th p
erce
ntile
Acco
mm
odat
ions
not
per
mitt
ed19
9421
8*17
8*17
9*20
8*‡
210*
210*
——
——
2001
220*
188*
184*
213*
‡21
2*21
2—
——
—Ac
com
mod
atio
ns p
erm
itted
2001
219*
186*
186*
218
‡21
0*21
2*—
——
—20
0622
519
219
521
818
921
421
319
4*20
7*22
623
020
1022
519
820
022
319
321
721
519
921
222
922
975
th p
erce
ntile
Acco
mm
odat
ions
not
per
mitt
ed19
9424
0*20
6*20
6*23
4‡
235
233
——
——
2001
242
212*
210
237
‡23
623
5—
——
—Ac
com
mod
atio
ns p
erm
itted
2001
241
211*
210*
240
‡23
523
4—
——
—20
0624
421
421
624
021
423
723
421
522
624
525
020
1024
521
922
124
222
024
023
621
923
024
725
190
th p
erce
ntile
Acco
mm
odat
ions
not
per
mitt
ed19
9425
722
822
725
3‡
255
251
——
——
2001
259
232
233
258
‡25
625
4—
——
—Ac
com
mod
atio
ns p
erm
itted
2001
258
232
232
259
‡25
525
3—
——
—20
0626
023
323
525
623
325
525
223
324
326
026
720
1026
223
923
826
124
125
825
423
624
426
426
6—
Not
avail
able.
Res
ults
for t
he 19
94 an
d 20
01 as
sess
men
t yea
rs ar
e not
repo
rted
beca
use o
f the
impr
oved
qua
lity o
f the
dat
a on
stud
ents
’ elig
ibilit
y for
the s
choo
l lunc
h pr
ogra
m b
egin
ning
in 20
06.
‡ Re
porti
ng st
anda
rds n
ot m
et. S
ampl
e size
insu
fficie
nt to
per
mit
a reli
able
estim
ate.
* Sig
nific
antly
diff
eren
t (p
< .05
) fro
m 20
10.
NOTE
: Blac
k inc
lude
s Afri
can
Amer
ican,
Hisp
anic
inclu
des L
atin
o, an
d Pa
cific I
sland
er in
clude
s Nat
ive H
awaii
an. R
ace c
ateg
ories
exclu
de H
ispan
ic or
igin
.SO
URCE
: U.S.
Dep
artm
ent o
f Edu
catio
n, In
stitu
te o
f Edu
catio
n Sc
ience
s, Na
tiona
l Cen
ter f
or Ed
ucat
ion
Stat
istics
, Nat
iona
l Ass
essm
ent o
f Edu
catio
nal P
rogr
ess (
NAEP
), va
rious
year
s, 19
94–2
010
U.S.
Hist
ory A
sses
smen
ts.
U.S. HISTORY 2010

60 THE NATION’S REPORT CARD
Tabl
e A
-6.
Achi
evem
ent-l
evel
resu
lts fo
r eig
hth-
grad
e stu
dent
s in
NAEP
U.S.
hist
ory,
by se
lecte
d ch
arac
teris
tics:
Vario
us ye
ars,
1994
–201
0
Char
acte
ristic
Perc
enta
ge o
f stu
dent
s
At o
r abo
ve Basic
At o
r abo
ve Proficient
At Advanced
Acco
mm
odat
ions
no
t per
mitt
edAc
com
mod
atio
ns p
erm
itted
Acco
mm
odat
ions
no
t per
mitt
edAc
com
mod
atio
ns p
erm
itted
Acco
mm
odat
ions
no
t per
mitt
edAc
com
mod
atio
ns p
erm
itted
1994
2001
2001
2006
2010
1994
2001
2001
2006
2010
1994
2001
2001
2006
2010
Race
/eth
nici
ty
Whi
te70
*74
*71
*79
8017
*21
2023
231
22
21
Blac
k32
*38
*35
*40
*48
35
54
6#
##
##
Hisp
anic
41*
38*
36*
4652
55
56
6#
##
##
Asia
n/Pa
cific
Isla
nder
60*
67*
65*
7578
1819
1922
272
12
13
Amer
ican
Indi
an/A
lask
a Na
tive
42*
6057
4361
210
95
9#
11
#1
Gend
er
Mal
e61
*65
*62
*67
*71
15*
1817
1919
12
22
1
Fem
ale
61*
63*
61*
6467
1315
1414
141
11
11
Elig
ibili
ty fo
r fre
e or
redu
ced-
pric
e sc
hool
lunc
h
Elig
ible
for f
ree
lunc
h—
——
41*
50—
——
56
——
—#
#
Elig
ible
for r
educ
ed-p
rice
lunc
h—
——
5965
——
—7
10—
——
##
Not e
ligib
le—
——
78*
81—
——
2324
——
—2
2
Info
rmat
ion
not a
vaila
ble
——
—86
85—
——
3328
——
—4
1
High
est l
evel
of p
aren
tal e
duca
tion
Did
not fi
nish
hig
h sc
hool
37*
4138
*40
*48
33
33
3#
##
##
Grad
uate
d fro
m h
igh
scho
ol50
*52
50*
5256
77
77
7#
##
##
Som
e ed
ucat
ion
afte
r hig
h sc
hool
68*
7069
*70
7314
1414
1414
#1
11
#
Grad
uate
d fro
m c
olle
ge74
*78
77*
7981
22*
2726
2726
13
32
2
— N
ot av
ailab
le. R
esul
ts fo
r the
1994
and
2001
asse
ssm
ent y
ears
are n
ot re
porte
d be
caus
e of t
he im
prov
ed q
ualit
y of t
he d
ata o
n st
uden
ts’ e
ligib
ility f
or th
e sch
ool lu
nch
prog
ram
beg
inni
ng in
2006
.#
Roun
ds to
zero
.* S
igni
fican
tly d
iffer
ent (
p < .
05) f
rom
2010
.NO
TE: B
lack i
nclu
des A
frica
n Am
erica
n, Hi
span
ic in
clude
s Lat
ino,
and
Pacifi
c Isla
nder
inclu
des N
ative
Haw
aiian
. Rac
e cat
egor
ies ex
clude
Hisp
anic
orig
in.
SOUR
CE: U
.S. D
epar
tmen
t of E
duca
tion,
Inst
itute
of E
duca
tion
Scien
ces,
Natio
nal C
ente
r for
Educ
atio
n St
atist
ics, N
atio
nal A
sses
smen
t of E
duca
tiona
l Pro
gres
s (NA
EP),
vario
us ye
ars,
1994
–201
0 U.
S. Hi
stor
y Ass
essm
ents
.

61
Tabl
e A
-7.
Perc
entil
e sco
res f
or ei
ghth
-gra
de st
uden
ts in
NAE
P U.
S. hi
stor
y, by
selec
ted
char
acte
ristic
s: Va
rious
year
s, 19
94–2
010
Perc
entil
e an
d ye
ar
Race
/eth
nici
tyGe
nder
Elig
ibili
ty fo
r fre
e or
redu
ced-
pric
e sc
hool
lunc
hHi
ghes
t lev
el o
f par
enta
l edu
catio
n
Whi
teBl
ack
Hisp
anic
Asia
n/
Paci
fic
Isla
nder
Amer
ican
In
dian
/ Al
aska
Na
tive
Mal
eFe
mal
e
Elig
ible
fo
r fre
e lu
nch
Elig
ible
for
redu
ced-
pric
e lu
nch
Not
elig
ible
Info
rmat
ion
not
avai
labl
e
Did
not
finis
h hi
gh
scho
ol
Grad
uate
d fro
m h
igh
scho
ol
Som
e ed
ucat
ion
afte
r hig
h sc
hool
Grad
uate
d fro
m
colle
ge10
th p
erce
ntile
Acco
mm
odat
ions
not
per
mitt
ed19
9422
8*19
8*20
3*21
620
621
5*21
9*—
——
—20
4*21
1*22
8*23
0*20
0123
2*20
4*20
0*22
221
721
9*22
1—
——
—20
3*21
623
023
7Ac
com
mod
atio
ns p
erm
itted
2001
228*
199*
197*
218
210
213*
218*
——
——
199*
213
227*
234*
2006
237
205*
208
227
200
221*
221*
205*
220
236*
246
207
212
230
235
2010
239
215
215
234
220
229
226
214
227
241
246
214
220
233
239
25th
per
cent
ileAc
com
mod
atio
ns n
ot p
erm
itted
1994
248*
217*
222*
237
227
238*
239*
——
——
221*
231*
247
251*
2001
251*
223*
220*
244*
238
242*
241
——
——
223
234
248
255
Acco
mm
odat
ions
per
mitt
ed20
0124
8*21
8*21
7*24
2*23
323
8*23
9*—
——
—21
9*23
2*24
625
4*20
0625
522
4*22
8*25
222
124
4*24
222
4*23
925
5*26
322
5*23
324
825
620
1025
723
223
325
623
924
824
423
224
425
826
223
323
725
125
850
th p
erce
ntile
Acco
mm
odat
ions
not
per
mitt
ed19
9426
7*23
8*24
4*26
124
726
1*26
1*—
——
—24
225
2*26
427
3*20
0127
1*24
3*24
3*26
625
726
6*26
2*—
——
—24
625
326
627
6Ac
com
mod
atio
ns p
erm
itted
2001
269*
240*
240*
264*
258
263*
261*
——
——
242*
252*
266
275
2006
275
245
249
272
248
267
263
245*
258
274
283
245*
254
267
277
2010
275
251
254
277
262
270
265
252
263
276
280
251
257
268
278
75th
per
cent
ileAc
com
mod
atio
ns n
ot p
erm
itted
1994
286*
258*
265*
284
266
283*
281*
——
——
262*
271
283
291*
2001
290
263
264*
288
277
287
283
——
——
264
272
285
295
Acco
mm
odat
ions
per
mitt
ed20
0128
926
1*26
2*28
827
628
628
2—
——
—26
327
128
429
520
0629
326
5*26
929
126
728
828
326
5*27
6*29
230
026
427
328
529
520
1029
226
927
229
628
028
928
427
028
129
429
626
927
428
529
590
th p
erce
ntile
Acco
mm
odat
ions
not
per
mitt
ed19
9430
2*27
7*28
3*30
628
030
0*29
8—
——
—27
728
729
930
720
0130
628
228
230
729
330
530
1—
——
—28
228
929
931
1Ac
com
mod
atio
ns p
erm
itted
2001
305
281
281*
308
293
304
300
——
——
281
288
299
311
2006
308
281*
287
305
283
305
300
283*
289*
307
314*
281
289
300
310
2010
307
286
288
312
293
305
299
286
295
308
309
282
290
299
309
— N
ot av
ailab
le. R
esul
ts fo
r the
1994
and
2001
asse
ssm
ent y
ears
are n
ot re
porte
d be
caus
e of t
he im
prov
ed q
ualit
y of t
he d
ata o
n st
uden
ts’ e
ligib
ility f
or th
e sch
ool lu
nch
prog
ram
beg
inni
ng in
2006
.* S
igni
fican
tly d
iffer
ent (
p < .
05) f
rom
2010
.NO
TE: B
lack i
nclu
des A
frica
n Am
erica
n, Hi
span
ic in
clude
s Lat
ino,
and
Pacifi
c Isla
nder
inclu
des N
ative
Haw
aiian
. Rac
e cat
egor
ies ex
clude
Hisp
anic
orig
in.
SOUR
CE: U
.S. D
epar
tmen
t of E
duca
tion,
Inst
itute
of E
duca
tion
Scien
ces,
Natio
nal C
ente
r for
Educ
atio
n St
atist
ics, N
atio
nal A
sses
smen
t of E
duca
tiona
l Pro
gres
s (NA
EP),
vario
us ye
ars,
1994
–201
0 U.
S. Hi
stor
y Ass
essm
ents
.
U.S. HISTORY 2010

62 THE NATION’S REPORT CARD
Tabl
e A
-8.
Achi
evem
ent-l
evel
resu
lts fo
r twe
lfth-
grad
e stu
dent
s in
NAEP
U.S.
hist
ory,
by se
lecte
d ch
arac
teris
tics:
Vario
us ye
ars,
1994
–201
0
Char
acte
ristic
Perc
enta
ge o
f stu
dent
s
At o
r abo
ve Basic
At o
r abo
ve Proficient
At Advanced
Acco
mm
odat
ions
no
t per
mitt
edAc
com
mod
atio
ns p
erm
itted
Acco
mm
odat
ions
no
t per
mitt
edAc
com
mod
atio
ns p
erm
itted
Acco
mm
odat
ions
no
t per
mitt
edAc
com
mod
atio
ns p
erm
itted
1994
2001
2001
2006
2010
1994
2001
2001
2006
2010
1994
2001
2001
2006
2010
Race
/eth
nici
ty
Whi
te50
*49
*49
*56
5513
1313
1615
11
11
1
Blac
k17
2019
2020
22
22
3#
##
##
Hisp
anic
2224
2427
284
44
45
##
##
#
Asia
n/Pa
cific
Isla
nder
4052
5154
5012
2121
2017
15
53
2
Amer
ican
Indi
an/A
lask
a Na
tive
2140
3732
293
99
43
##
##
#
Gend
er
Mal
e45
4545
5049
12*
1212
1514
11
21
1
Fem
ale
4041
4044
419
1010
1110
11
11
1
High
est l
evel
of p
aren
tal e
duca
tion
Did
not fi
nish
hig
h sc
hool
1520
1918
201
22
33
##
##
#
Grad
uate
d fro
m h
igh
scho
ol29
2625
3130
44
45
6#
##
##
Som
e ed
ucat
ion
afte
r hig
h sc
hool
4239
3945
418
88
97
11
1#
#
Grad
uate
d fro
m c
olle
ge56
5858
6058
1718
1820
181
22
22
# Ro
unds
to ze
ro.
* Sig
nific
antly
diff
eren
t (p
< .05
) fro
m 20
10.
NOTE
: Blac
k inc
lude
s Afri
can
Amer
ican,
Hisp
anic
inclu
des L
atin
o, an
d Pa
cific I
sland
er in
clude
s Nat
ive H
awaii
an. R
ace c
ateg
ories
exclu
de H
ispan
ic or
igin
.SO
URCE
: U.S.
Dep
artm
ent o
f Edu
catio
n, In
stitu
te o
f Edu
catio
n Sc
ience
s, Na
tiona
l Cen
ter f
or Ed
ucat
ion
Stat
istics
, Nat
iona
l Ass
essm
ent o
f Edu
catio
nal P
rogr
ess (
NAEP
), va
rious
year
s, 19
94–2
010
U.S.
Hist
ory A
sses
smen
ts.

63
Tabl
e A
-9.
Perc
entil
e sco
res f
or tw
elfth
-gra
de st
uden
ts in
NAE
P U.
S. hi
stor
y, by
selec
ted
char
acte
ristic
s: Va
rious
year
s, 19
94–2
010
Perc
entil
e an
d ye
ar
Race
/eth
nici
tyGe
nder
High
est l
evel
of p
aren
tal e
duca
tion
Whi
teBl
ack
Hisp
anic
Asia
n/
Paci
fic
Isla
nder
Amer
ican
In
dian
/ Al
aska
Na
tive
Mal
eFe
mal
e
Did
not
finis
h hi
gh
scho
ol
Grad
uate
d fro
m h
igh
scho
ol
Som
e ed
ucat
ion
afte
r hig
h sc
hool
Grad
uate
d fro
m
colle
ge10
th p
erce
ntile
Acco
mm
odat
ions
not
per
mitt
ed19
9425
222
622
423
623
124
424
222
423
724
925
520
0125
323
123
524
824
624
424
723
223
724
925
8Ac
com
mod
atio
ns p
erm
itted
2001
252
228
228
246
245
243
245
226
235
248
258
2006
260
234
236
250
240
250
249
229
240
254
262
2010
257
231
235
250
239
247
246
229
236
250
258
25th
per
cent
ileAc
com
mod
atio
ns n
ot p
erm
itted
1994
272*
244
243*
257
253
265*
264
243
255
268
277
2001
273*
249
253
269
266
266
266
250
255
268
279
Acco
mm
odat
ions
per
mitt
ed20
0127
324
724
927
026
226
626
524
425
426
727
920
0627
925
225
527
226
027
226
824
825
827
228
120
1027
724
825
527
026
026
926
624
825
526
827
950
th p
erce
ntile
Acco
mm
odat
ions
not
per
mitt
ed19
9429
4*26
526
6*28
427
629
0*28
626
427
728
829
920
0129
326
927
329
628
629
028
727
027
528
730
0Ac
com
mod
atio
ns p
erm
itted
2001
293*
268
271
295
285
290
287
267
275
287
300
2006
298
270
276
298
279
294
289
269
279
290
302
2010
297
268
276
294
280
293
288
268
277
287
300
75th
per
cent
ileAc
com
mod
atio
ns n
ot p
erm
itted
1994
313*
286
291
309
291
311
307
285
297
307
318
2001
312*
289
293
320
306
311
307
290
295
305
318
Acco
mm
odat
ions
per
mitt
ed20
0131
328
829
331
930
331
130
728
829
430
531
820
0631
728
929
632
130
031
531
028
729
930
832
120
1031
628
929
731
629
831
430
828
929
830
631
990
th p
erce
ntile
Acco
mm
odat
ions
not
per
mitt
ed19
9432
8*30
431
232
930
832
8*32
430
131
432
233
320
0132
930
631
234
332
332
932
530
531
132
233
5Ac
com
mod
atio
ns p
erm
itted
2001
329
305
312
343
322
328
324
304
311*
322
335
2006
332
307
313
337
315
331
327
304
316
324
336
2010
332
308
315
335
317
330
325
308
317
321
335
* Sig
nific
antly
diff
eren
t (p
< .05
) fro
m 20
10.
NOTE
: Blac
k inc
lude
s Afri
can
Amer
ican,
Hisp
anic
inclu
des L
atin
o, an
d Pa
cific I
sland
er in
clude
s Nat
ive H
awaii
an. R
ace c
ateg
ories
exclu
de H
ispan
ic or
igin
.SO
URCE
: U.S.
Dep
artm
ent o
f Edu
catio
n, In
stitu
te o
f Edu
catio
n Sc
ience
s, Na
tiona
l Cen
ter f
or Ed
ucat
ion
Stat
istics
, Nat
iona
l Ass
essm
ent o
f Edu
catio
nal P
rogr
ess (
NAEP
), va
rious
year
s, 19
94–2
010
U.S.
Hist
ory A
sses
smen
ts.
U.S. HISTORY 2010

THE NATION’S REPORT CARD
U.S. History
2010JUNE 2011
U.S. Department of EducationThe National Assessment of Educational Progress (NAEP) is a congressionally authorized project sponsored by the U.S. Department of Education. The National Center for Education Statistics, within the Institute of Education Sciences, administers NAEP. The Commissioner of Education Statistics is responsible by law for carrying out the NAEP project.
Arne DuncanSecretaryU.S. Department of Education
John Q. EastonDirectorInstitute of Education Sciences
Jack BuckleyCommissionerNational Center for Education Statistics
The National Assessment Governing BoardIn 1988, Congress created the National Assessment Governing Board to set policy for the National Assessment of
TMEducational Progress, commonly known as The Nation's Report Card . The Governing Board is an independent, bipartisan group whose members include governors, state legislators, local and state school officials, educators, business representatives, and members of the general public.
Honorable David P. Driscoll, ChairFormer Commissioner of EducationMelrose, Massachusetts
Mary Frances Taymans, Vice ChairSisters of Notre DameNational Education OfficeBethesda, Maryland
David J. AlukonisFormer ChairmanHudson School BoardHudson, New Hampshire
Louis M. FabrizioDirector, Accountability Policy and Communications
North Carolina Department of Public Instruction
Raleigh, North Carolina
Honorable Anitere FloresSenatorFlorida State SenateMiami, Florida
Alan J. FriedmanConsultantMuseum Development and Science Communication
New York, New York
Shannon GarrisonFourth-Grade TeacherSolano Avenue Elementary SchoolLos Angeles, California
David W. GordonCounty Superintendent of SchoolsSacramento County Office of EducationSacramento, California
Doris R. HicksPrincipal and Chief Executive OfficerDr. Martin Luther King, Jr. Charter School for Science and Technology
New Orleans, Louisiana
Richard Brent HoustonPrincipalShawnee Middle SchoolShawnee, Oklahoma
Hector IbarraMiddle School Science TeacherBelin-Blank International Center and Talent Development
Iowa City, Iowa
Kathi M. KingTwelfth-Grade TeacherMessalonskee High SchoolOakland, Maine
Henry KranendonkMathematics ConsultantMilwaukee Public SchoolsMilwaukee, Wisconsin
Honorable Tom LunaIdaho Superintendent of Public InstructionBoise, Idaho
Honorable Jack MarkellGovernor of DelawareWilmington, Delaware
Tonya MilesGeneral Public RepresentativeMitchellville, Maryland
Honorable Steven L. PaineFormer State Superintendent of SchoolsWest Virginia Department of EducationCharleston, West Virginia
Honorable Sonny PerdueFormer Governor of GeorgiaAtlanta, Georgia
Susan PimentelEducational ConsultantHanover, New Hampshire
W. James PophamProfessor Emeritus Graduate School of Education and Information Studies
University of California, Los AngelesWilsonville, Oregon
Andrew C. PorterDeanGraduate School of EducationUniversity of PennsylvaniaPhiladelphia, Pennsylvania
Blair TaylorPresident and CEOLos Angeles Urban LeagueLos Angeles, California
Honorable Leticia Van de PutteSenatorTexas State SenateSan Antonio, Texas
Eileen L. WeiserGeneral Public RepresentativeAnn Arbor, Michigan
John Q. Easton (Ex officio)Director Institute of Education SciencesU.S. Department of EducationWashington, D.C.
Cornelia S. OrrExecutive Director National Assessment Governing BoardWashington, D.C.
M O R E I N F O R M A T I O NThe report release site is http://nationsreportcard.gov.The NCES Publications and Products address is http://nces.ed.gov/pubsearch.
For ordering information, write to ED Pubs U.S. Department of Education P.O. Box 22207 Alexandria, VA 22304
or call toll free 1-877-4-ED-Pubs
or order online at http://www.edpubs.gov.
S U G G E S T E D C I T A T I O NNational Center for Education Statistics (2011). The Nation’s Report Card: U.S. History 2010(NCES 2011–468). Institute of Education Sciences, U.S. Department of Education, Washington, D.C.
C O N T E N T C O N T A C TSamantha Burg 202-502-7335 [email protected]
This report was prepared for the National Center for Education Statistics under Contract No. ED-07-CO-0107 with Educational Testing Service. Mention of trade names, commercial products, or organizations does not imply endorsement by the U.S. Government.
“T he Depar tment of Education’s mission is to promote student achievement and preparat ion for g lobal competit iveness by foster ing educational excel lence and ensuring equal access.”
www.ed.gov