u.s. grocery retail food packaging to product ratios
TRANSCRIPT

U.S. GROCERY RETAIL FOOD PACKAGING TO PRODUCT RATIOS
2019

ReFED | U.S. GROCERY RETAIL FOOD PACKAGING TO PRODUCT RATIOS
CONTENTS
ACKNOWLEDGEMENTS........................................................................1
OVERVIEW............................................................................................... 2
METHODOLOGY..................................................................................... 3
Calculations........................................................................................................3
Limitations..........................................................................................................4
RESULTS.................................................................................................5
Department Level Packaging to Product Ratios.........................................5
Category Level Packaging to Product Ratios..............................................6
APPENDIX............................................................................................ .20
Appendix A: Methodology for Packaging to Product Ratios...................20

ReFED | U.S. GROCERY RETAIL FOOD PACKAGING TO PRODUCT RATIOS 1
ACKNOWLEDGEMENTSSpecial thank you to the following ReFED partners for their support in the development of this report.
Report AuthorsCaroline Powell, Director of Product Development - Juniata AnalyticsPhilip Curtis, Director of Operations - Juniata AnalyticsMatt Lally, Head of Strategic Sales Insights - Nielsen
Report ReviewersKai Robertson, Lead Advisor, FLW Protocol - World Resources InstituteBrian Lipinski, Associate - World Resources Institute
DesignerGiada Mannino, Owner | Visual Designer Giada Creative LLCwww.giada-creative.com
NIELSEN and the Nielsen logo are trademarks or registered trademarks of The Nielsen Company (US), LLC in the United States and other countries. Used with permission.®
The views expressed herein do not necessarily represent those of The Kroger Co. Zero Hunger | Zero Waste Foundation or The Kroger Co.
Nielsen has committed to donating at least $10 million a year in pro bono skills-based volunteering and projects through the company’s Data for Good program, which helps create new solutions to social and environmental challenges. This collaboration with ReFED is one example of how Nielsen is taking action. Nielsen is donating five years of food pricing and purchase data to help ReFED launch their ReFED Insights Engine, a digital-first, continuously updated platform to house the next generation of data and insights on food waste.
This report was made possible with the support from the following organizations:
AjanaFoundation
Kenneth Goldman Donor Fund
Arjay R & Frances F Miller Foundation
Posner Foundationof Pittsburgh
Robert W. Wilson Charitable Trust
Jackie & Orion Hindawi
Peter Welles
Atticus Trust

ReFED | U.S. GROCERY RETAIL FOOD PACKAGING TO PRODUCT RATIOS 2
OVERVIEWOne barrier to food waste measurement for businesses is the difficulty of removing the weight of packaging from weight-based food datasets. Many datasets critical to food waste measurement include the weight of food and packaging combined, such as the tons of food donated to food banks or the tons of food picked up by waste haulers. Before these datasets can be utilized in a comprehensive food waste measurement system, the weight of packaging must be removed, and packaging to product ratios are necessary to do so.
Packaging to product ratios are difficult for businesses to obtain because food business enterprise software systems were initially designed to track inventory cost and sales flows. Food and packaging weight, if included, is an afterthought. Some food business data systems may contain a database field that stores the total weight of food plus packaging, but they usually do not have a database field that stores the weight of packaging alone. These data systems typically include a database field that stores the weight of food alone (not including packaging), but these weights are usually not in a common unit of measurement. Instead, each item is recorded in various units such as pounds, eaches, fluid ounces, or counts and tracked accordingly. In order for businesses to quantify the weight of food, they have to convert these various units into a common unit of weight for every single item. For a business that sells thousands or millions of products, that is a time and resource intensive process. Furthermore, information maintenance at the item level is not often prioritized (e.g., the item level weight fields are often left blank or fail to get updated when the purchase or sell units change).
Therefore, in an effort to help U.S. grocery retailers overcome these barriers, ReFED has developed department and category level packaging to product ratios using data from Nielsen combined with packaging weights obtained from primary research as documented in the Appendix. Because packaging to product ratios don’t vary significantly among retailers, individual retailers can safely use these ratios to estimate the weight of packaging in their individual datasets.
This report provides U.S. grocery retail food packaging to product ratios at the department and category levels and describes the methodology used to do so. ReFED has developed this dataset with data from Nielsen combined with packaging weights obtained from primary research as documented in the Appendix.
NIELSEN and the Nielsen logo are trademarks or registered trademarks of The Nielsen Company (US), LLC in the United States and other countries. Used with permission.®
1 ReFED has also developed a report that describes the difficulty for businesses in quantifying the weight of food purchased, sold, and wasted
along with a set of U.S. industry average grocery retail value-to-weight conversion factors to address this lack of food product weight data:
https://www.refed.com/downloads/ReFED-U.S.-Grocery-Retail-Value-to-Weight-Conversion-Factors.pdf.

ReFED | U.S. GROCERY RETAIL FOOD PACKAGING TO PRODUCT RATIOS 3
METHODOLOGYCalculationsBecause there was no publicly available data on packaging to product ratios, ReFED conducted original research to develop proxy packaging to product ratios for each grocery retail category. Appendix A describes the methodology used to develop these category-level packaging to product ratios. These category proxies were then used to develop department-level packaging to product ratios using a sales-weighted approach with Nielsen sales data. Nielsen data represents over 85% coverage of grocery retail sales in the U.S. Each year top U.S. grocery retailers report item level register sales data to Nielsen, including information about each item such as the grocery chain where it was sold, the brand name of the product, the food classification (department, category, subcategory), the weight of food, and many other attributes. The following table displays the calculations used to develop U.S. grocery retail industry average category and department-level packaging to product ratios.
Table 1. Calculations Performed to Determine Average Retail Packaging to Product Ratios
DATA DATA SOURCE OR CALCULATION EXAMPLE
Item Sales Annual U.S. 50-state register sales for a single item according to Nielsen point-of-sale (POS) data
$3 Million in sales of a particular cookie product (a single UPC item)
Item Food Weight Item weight according to Nielsen POS data
0.07 lbs of food per unit
Item Units Sold Annual U.S. 50-state item units sold reported to Nielsen by grocery stores
1 Million units sold
Item Food Weight Sold = Item Food Weight * Item Units Sold = 1 Million units sold * 0.07 lbs per unit= 70,000 lbs food sold
Category Packaging to Product Ratio
See Appendix A for ReFED original research
0.0572 lbs of packaging per lb of food (5.72% packaging to product ratio)
Category Sales = SUM of Item Sales for all items in each Category
$8.6 Billion of products sold in the Cookie Category of the Dry Goods Department (all items across various brands in the Cookie Category)
Category Food Weight Sold = SUM of Item Food Weight Sold for all items in each Category
3.25 Billion lbs of food sold in the Cookie Category of the Dry Goods Department (all items across various brands in the Cookie Category)
Category Packaging Weight
= Category Food Weight Sold * Category Packaging to Product Ratio
= 3.25 Billion lbs * 5.72%= 186 Million lbs of packaging sold in the Cookie Category of the Dry Goods Department

ReFED | U.S. GROCERY RETAIL FOOD PACKAGING TO PRODUCT RATIOS 4
DATA DATA SOURCE OR CALCULATION EXAMPLE
Category Industry Average Packaging Weight per Dollar Sold
= Category Packaging Weight / Category Sales
= 186 Million lbs of packaging sold / $8.6 Billion sold= 0.0216 lbs packaging per retail $ sold
Department Sales = SUM of Item Sales for all items in each Department
$209.5 Billion of products sold in the Dry Goods Department (all items across all categories in the Dry Goods Department)
Department Food Weight Sold
= SUM of Item Food Weight Sold for all items in each Department
67.01 Billion lbs of food sold in the Dry Goods Department (all items across all categories in the Dry Goods Department)
Department Packaging Weight
= SUM of Category Packaging Weight for all Categories in each Department
10.228 Billion lbs of packaging sold in all Categories in the Dry Goods Department combined (all categories in the Dry Goods Department)
Department Industry Average Packaging to Product Ratio
= Department Packaging Weight / Department Food Weight Sold
= 10.228 Billion lbs of packaging / 67.01 Billion lbs of food sold= 15.26% industry average packaging to product ratio for the Dry Goods Department
Department Industry Average Packaging Weight per Dollar Sold
= Department Packaging Weight / Department Sales
= 10.228 Billion lbs of packaging / $209.5 Billion sold in the Dry Goods Department= 0.0488 lbs of packaging per retail $ sold for products in the Dry Goods Department
LimitationsThe accuracy of these estimates is limited to the accuracy of the Nielsen sales and weight data. The weight data for UPC items comes directly from up-to-date product packaging images. For non-UPC items sold in eaches, Nielsen estimates weight using a weight conversion factor (e.g., the average weight of a lemon). For other non-UPC items, Nielsen is reliant on the retailer transaction data to provide the item sale weight units (e.g., lbs of apples sold). Because proxy categories were selected in ReFED’s original research as outlined in Appendix A, the packaging to product ratios listed in this report are only rough estimates. While this approach is much more detailed and granular than other public estimates, further research and data development should be continued to capture variation within categories to more accurately quantify packaging to product ratios and to enable better measurement of food waste.

ReFED | U.S. GROCERY RETAIL FOOD PACKAGING TO PRODUCT RATIOS 5
RESULTS Table 2. Department Level Packaging to Product Ratios
FOOD DEPARTMENT
PACKAGING % OF PRODUCT WEIGHT
LBS PACKAGING / LBS
FOOD + PACKAGING
PACKAGING TO PRODUCT RATIO
LBS PACKAGING / LBS
FOOD
LBS OF PACKAGING PER RETAIL $ SOLD
LBS PACKAGING /
RETAIL $ SOLD
All food 6.86% 7.37% 0.0346
Breads & Bakery 3.97% 4.14% 0.0185
Dairy & Eggs 3.35% 3.47% 0.0276
Deli & Prepared Foods 6.40% 6.84% 0.0123
Dry Goods 13.27% 15.30% 0.0502
Fresh Meat & Seafood 7.84% 8.51% 0.0213
Frozen 8.21% 8.94% 0.0410
Produce 1.13% 1.15% 0.0074
Ready-To-Drink Beverages 7.61% 8.24% 0.1087
How to use this data:
• If you have the weight of food plus packaging: Multiply the weight of food plus packaging by the Item % Packaging by Weight to get the estimated weight of packaging.
• If you have the weight of food only: Multiply the weight of food only by the Item Packaging to Product Ratio to get the estimated weight of packaging.
• If you have the retail $ sold: Multiply the retail $ sold by the lbs of packaging per retail $ sold to get the estimated weight of packaging. CAUTION: These industry average retail $ ratios can vary significantly among retailers due to variations in retail price per lb and should only be used for rough estimates.

ReFED | U.S. GROCERY RETAIL FOOD PACKAGING TO PRODUCT RATIOS 6
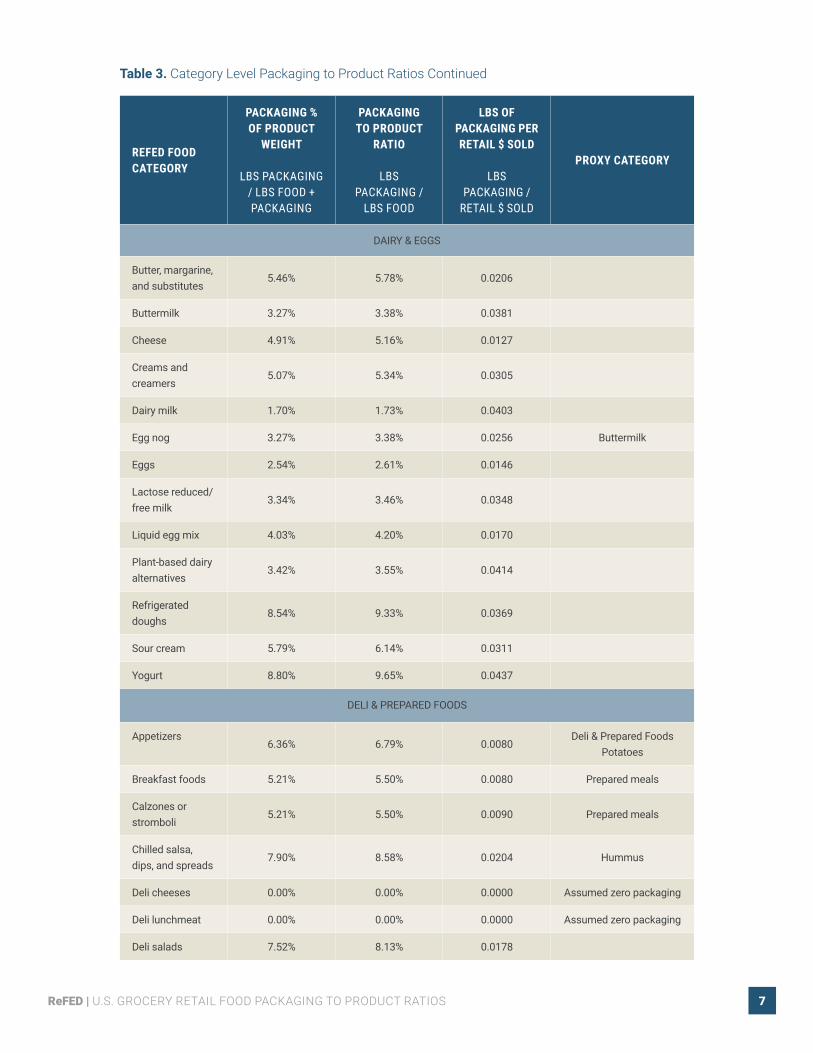
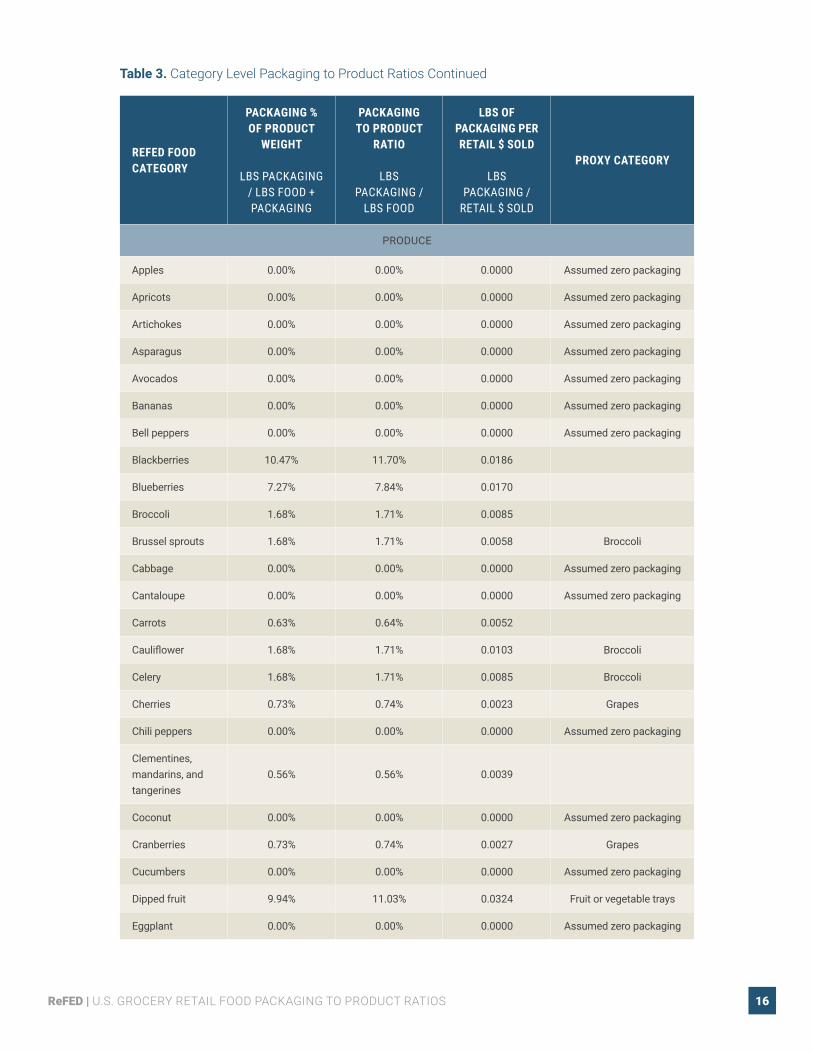
Table 3. Category Level Packaging to Product Ratios
The following table lists category level packaging to product ratios based on ReFED original research as outlined in Appendix A. Some categories were assigned packaging to product ratios based on proxy categories (e.g. ratio for pita bread was used as a proxy for naan).
REFED FOOD CATEGORY
PACKAGING % OF PRODUCT
WEIGHT
LBS PACKAGING / LBS FOOD + PACKAGING
PACKAGING TO PRODUCT
RATIO
LBS PACKAGING /
LBS FOOD
LBS OF PACKAGING PER RETAIL $ SOLD
LBS
PACKAGING / RETAIL $ SOLD
PROXY CATEGORY
BREADS & BAKERY
Artisan and specialty bread
2.38% 2.44% 0.0107
Bagels 0.88% 0.88% 0.0040
Brownies 12.58% 14.40% 0.0253
Cake 17.83% 21.70% 0.0397
Cheesecake 10.47% 11.69% 0.0182
Cookies 8.23% 8.97% 0.0233
Cupcakes 8.94% 9.81% 0.0170
Donuts 15.06% 17.73% 0.1072
English muffins and crumpets
6.78% 7.28% 0.0226
Flatbreads and pizza crusts
3.93% 4.10% 0.0103
Muffins 11.37% 12.83% 0.0403
Naan 1.56% 1.58% 0.0029 Pita bread
Other desserts 3.97% 4.08% 0.0173 Department average
Pies, cobblers, and crisps
6.01% 6.39% 0.0183
Pita bread 1.56% 1.58% 0.0048
Rolls and buns 1.56% 1.59% 0.0070
Sliced bread 1.35% 1.37% 0.0073
Soft tortillas 1.53% 1.55% 0.0114
Sweet goods 3.14% 3.24% 0.0122
ReFED | U.S. GROCERY RETAIL FOOD PACKAGING TO PRODUCT RATIOS 7
REFED FOOD CATEGORY
PACKAGING % OF PRODUCT
WEIGHT
LBS PACKAGING / LBS FOOD + PACKAGING
PACKAGING TO PRODUCT
RATIO
LBS PACKAGING /
LBS FOOD
LBS OF PACKAGING PER RETAIL $ SOLD
LBS
PACKAGING / RETAIL $ SOLD
PROXY CATEGORY
DAIRY & EGGS
Butter, margarine, and substitutes
5.46% 5.78% 0.0206
Buttermilk 3.27% 3.38% 0.0381
Cheese 4.91% 5.16% 0.0127
Creams and creamers
5.07% 5.34% 0.0305
Dairy milk 1.70% 1.73% 0.0403
Egg nog 3.27% 3.38% 0.0256 Buttermilk
Eggs 2.54% 2.61% 0.0146
Lactose reduced/free milk
3.34% 3.46% 0.0348
Liquid egg mix 4.03% 4.20% 0.0170
Plant-based dairy alternatives
3.42% 3.55% 0.0414
Refrigerated doughs
8.54% 9.33% 0.0369
Sour cream 5.79% 6.14% 0.0311
Yogurt 8.80% 9.65% 0.0437
DELI & PREPARED FOODS
Appetizers6.36% 6.79% 0.0080
Deli & Prepared Foods Potatoes
Breakfast foods 5.21% 5.50% 0.0080 Prepared meals
Calzones or stromboli
5.21% 5.50% 0.0090 Prepared meals
Chilled salsa, dips, and spreads
7.90% 8.58% 0.0204 Hummus
Deli cheeses 0.00% 0.00% 0.0000 Assumed zero packaging
Deli lunchmeat 0.00% 0.00% 0.0000 Assumed zero packaging
Deli salads 7.52% 8.13% 0.0178
Table 3. Category Level Packaging to Product Ratios Continued

ReFED | U.S. GROCERY RETAIL FOOD PACKAGING TO PRODUCT RATIOS 8
REFED FOOD CATEGORY
PACKAGING % OF PRODUCT
WEIGHT
LBS PACKAGING / LBS FOOD + PACKAGING
PACKAGING TO PRODUCT
RATIO
LBS PACKAGING /
LBS FOOD
LBS OF PACKAGING PER RETAIL $ SOLD
LBS
PACKAGING / RETAIL $ SOLD
PROXY CATEGORY
DELI & PREPARED FOODS
Deli trays 15.63% 18.53% 0.0252
Fully cooked beef 5.21% 5.50% 0.0087 Prepared meals
Fully cooked chicken
4.91% 5.16% 0.0112
Fully cooked pork 5.21% 5.50% 0.0112 Prepared meals
Fully cooked turkey
5.21% 5.50% 0.0094 Prepared meals
Handheld entrees6.36% 6.79% 0.0224
Deli & Prepared Foods Potatoes
Hummus 7.90% 8.58% 0.0167
Lasagna 9.09% 10.00% 0.0179 Pasta
Mac and cheese 9.09% 10.00% 0.0129 Pasta
Meal kits 19.50% 24.22% 0.0473
Meat alternatives 5.21% 5.50% 0.0167 Prepared meals
Other meat 5.21% 5.50% 0.0111 Prepared meals
Pasta 9.09% 10.00% 0.0193
Pizza 21.41% 27.25% 0.0746
Pot pies 5.21% 5.50% 0.0102 Prepared meals
Potatoes 6.36% 6.79% 0.0239
Prepared fruit or vegetables
9.94% 11.03% 0.0283 Fruit or vegetable trays
Prepared meals 5.21% 5.50% 0.0084
Rice 5.21% 5.50% 0.0119 Prepared meals
Sandwiches 8.79% 9.63% 0.0124
Snack combos 11.32% 12.77% 0.0181
Soups, stews, and broth
6.75% 7.24% 0.0160
Sushi 5.84% 6.21% 0.0037
Table 3. Category Level Packaging to Product Ratios Continued

ReFED | U.S. GROCERY RETAIL FOOD PACKAGING TO PRODUCT RATIOS 9
REFED FOOD CATEGORY
PACKAGING % OF PRODUCT
WEIGHT
LBS PACKAGING / LBS FOOD + PACKAGING
PACKAGING TO PRODUCT
RATIO
LBS PACKAGING /
LBS FOOD
LBS OF PACKAGING PER RETAIL $ SOLD
LBS
PACKAGING / RETAIL $ SOLD
PROXY CATEGORY
DRY GOODS
Apple sauce 5.88% 6.25% 0.0397
Baby food 8.50% 9.29% 0.0201
Bagged or loose tea
35.23% 54.39% 0.2568
Baking chips and chocolate
1.80% 1.83% 0.0047
Baking cocoa 13.41% 15.48% 0.0224
Baking coconut 2.93% 3.02% 0.0091
Baking milks 17.02% 20.51% 0.1177
Baking mixes 7.48% 8.09% 0.0360
Baking nuts 4.18% 4.37% 0.0052
Baking powder 10.90% 12.24% 0.0345
Baking soda 5.20% 5.49% 0.0748
Baking sprinkles 19.17% 23.71% 0.0276
Baking yeast 15.38% 18.18% 0.0110
Bouillon 60.87% 155.56% 0.2512
Boxed dinners 12.68% 14.52% 0.0445
Breakfast syrups 4.90% 5.15% 0.0214
Broth 4.03% 4.19% 0.0238
Canned beans 11.32% 12.77% 0.1134
Canned fruit 12.01% 13.65% 0.0798
Canned meat and seafood
7.59% 8.21% 0.0183
Canned soup 12.06% 13.71% 0.0629
Canned vegetables
11.79% 13.36% 0.0908
Cereal 16.79% 20.18% 0.0649
Table 3. Category Level Packaging to Product Ratios Continued

ReFED | U.S. GROCERY RETAIL FOOD PACKAGING TO PRODUCT RATIOS 10
REFED FOOD CATEGORY
PACKAGING % OF PRODUCT
WEIGHT
LBS PACKAGING / LBS FOOD + PACKAGING
PACKAGING TO PRODUCT
RATIO
LBS PACKAGING /
LBS FOOD
LBS OF PACKAGING PER RETAIL $ SOLD
LBS
PACKAGING / RETAIL $ SOLD
PROXY CATEGORY
DRY GOODS
Cereal and granola bars
12.57% 14.38% 0.0215
Chocolate candy 5.69% 6.04% 0.0098
Coating mixes and crumbs
22.28% 28.67% 0.1038
Coffee 3.91% 4.07% 0.0054
Coffee enhancers 11.55% 13.05% 0.0524
Coffee pods 34.46% 52.59% 0.0335
Condiments 10.15% 11.29% 0.0411
Cookies 5.41% 5.72% 0.0216
Cooking oils 3.70% 3.84% 0.0219
Cooking syrups 5.78% 6.14% 0.0191
Cooking wine and vinegar
41.44% 70.77% 0.8033
Corn and other food starch
11.81% 13.39% 0.0805
Crackers 12.47% 14.25% 0.0368
Cranberry sauce 10.91% 12.24% 0.0730 Tomato sauce and paste
Dessert toppings 11.44% 12.92% 0.0403
Diet and nutrition 12.11% 13.78% 0.0290
Dried fruit and vegetables
2.87% 2.95% 0.0056
Dry beans 0.43% 0.43% 0.0035
Edible cake decoration
45.00% 81.82% 0.0804
Flour and meal 0.92% 0.93% 0.0133
Frosting 6.33% 6.75% 0.0322
Fruit snacks 14.71% 17.24% 0.0420
Table 3. Category Level Packaging to Product Ratios Continued

ReFED | U.S. GROCERY RETAIL FOOD PACKAGING TO PRODUCT RATIOS 11
REFED FOOD CATEGORY
PACKAGING % OF PRODUCT
WEIGHT
LBS PACKAGING / LBS FOOD + PACKAGING
PACKAGING TO PRODUCT
RATIO
LBS PACKAGING /
LBS FOOD
LBS OF PACKAGING PER RETAIL $ SOLD
LBS
PACKAGING / RETAIL $ SOLD
PROXY CATEGORY
DRY GOODS
Gift baskets 19.50% 24.22% 0.0179 Meal kits
Gnocchi and dumplings
2.80% 2.88% 0.0090
Grits 6.33% 6.75% 0.0418
Gum 30.37% 43.62% 0.1724
Hard shell tortillas 22.16% 28.47% 0.0857
Herbs, spices, and seasonings
68.75% 220.00% 0.1520
Hot cider 19.78% 24.65% 0.0278
Hot cocoa 13.26% 15.29% 0.0213
Jams and jellies 31.51% 46.00% 0.2311
Marshmallows 2.08% 2.12% 0.0105
Milk enhancers 17.20% 20.78% 0.1138
Mints 25.86% 34.88% 0.0539
Nut butters 7.74% 8.39% 0.0328
Nuts and seeds 15.18% 17.89% 0.0297
Oatmeal and hot cereal
11.16% 12.56% 0.0519
Other candy 1.56% 1.59% 0.0041
Other grains 46.58% 87.18% 0.1934
Other noodles 1.74% 1.77% 0.0054
Other sauce, gravy, and marinades
10.71% 12.00% 0.0433
Pasta 4.78% 5.02% 0.0237
Pasta sauce 35.48% 55.00% 0.3147
Pickles, olives, and pickled vegetables
30.84% 44.59% 0.1545
Table 3. Category Level Packaging to Product Ratios Continued

ReFED | U.S. GROCERY RETAIL FOOD PACKAGING TO PRODUCT RATIOS 12
REFED FOOD CATEGORY
PACKAGING % OF PRODUCT
WEIGHT
LBS PACKAGING / LBS FOOD + PACKAGING
PACKAGING TO PRODUCT
RATIO
LBS PACKAGING /
LBS FOOD
LBS OF PACKAGING PER RETAIL $ SOLD
LBS
PACKAGING / RETAIL $ SOLD
PROXY CATEGORY
DRY GOODS
Pie crusts 12.68% 14.53% 0.0318
Pie filling 10.74% 12.03% 0.0631
Pudding and gelatin
6.76% 7.25% 0.0100
Ramen 4.78% 5.02% 0.0077 Pasta
Rice 0.66% 0.66% 0.0050
Salad dressing 6.82% 7.32% 0.0291
Salad toppings 20.89% 26.40% 0.0390
Salty snacks 1.39% 1.41% 0.0029
Sauce, soup, and seasoning mixes
9.68% 10.71% 0.0093
Shake and smoothie mix
17.14% 20.69% 0.0517
Shelf-stable dips and salsa
36.03% 56.33% 0.2226
Shortening and lard
13.70% 15.87% 0.0950
Snack cakes 11.82% 13.40% 0.0307
Specialty wraps 3.84% 3.99% 0.0110
Sugar and sweeteners
0.76% 0.77% 0.0049
Toaster pastries 6.58% 7.04% 0.0260
Tomato sauce and paste
10.91% 12.24% 0.0866
FRESH MEAT & SEAFOOD
Bacon 4.52% 4.73% 0.0090
Beef ribs 6.23% 6.65% 0.0077 Beef roast
Beef roast 6.23% 6.65% 0.0064
Table 3. Category Level Packaging to Product Ratios Continued

ReFED | U.S. GROCERY RETAIL FOOD PACKAGING TO PRODUCT RATIOS 13
REFED FOOD CATEGORY
PACKAGING % OF PRODUCT
WEIGHT
LBS PACKAGING / LBS FOOD + PACKAGING
PACKAGING TO PRODUCT
RATIO
LBS PACKAGING /
LBS FOOD
LBS OF PACKAGING PER RETAIL $ SOLD
LBS
PACKAGING / RETAIL $ SOLD
PROXY CATEGORY
FRESH MEAT & SEAFOOD
Chicken breast 13.88% 16.11% 0.0324
Chicken legs 10.90% 12.24% 0.1564
Chicken thighs 6.89% 7.40% 0.0317
Chicken wings 10.90% 12.24% 0.0356 Chicken legs
Clams and mussels
0.00% 0.00% 0.0000 Assumed zero packaging
Crab 0.00% 0.00% 0.0000 Assumed zero packaging
Fowl and exotics 4.38% 4.58% 0.0064
Ground beef 6.86% 7.37% 0.0163
Ground chicken 9.38% 10.35% 0.0273 Ground turkey
Ground turkey 9.38% 10.35% 0.0256
Ham 0.88% 0.88% 0.0032
Lamb 2.27% 2.32% 0.0032
Lobster 0.00% 0.00% 0.0000 Assumed zero packaging
Lunchmeat 9.09% 10.00% 0.0218
Meat alternatives 18.51% 22.71% 0.0307
Other beef 6.86% 7.37% 0.0111 Ground beef
Other chicken 6.89% 7.40% 0.0128 Chicken thighs
Other fish 6.50% 6.95% 0.0083 Salmon
Other meat 7.84% 8.11% 0.0183 Department average
Other seafood 0.00% 0.00% 0.0000 Assumed zero packaging
Other shellfish 0.00% 0.00% 0.0000 Assumed zero packaging
Other turkey 9.38% 10.35% 0.0560 Ground turkey
Oysters 0.00% 0.00% 0.0000 Assumed zero packaging
Pork 10.32% 11.50% 0.0232
Salmon 6.50% 6.95% 0.0039
Table 3. Category Level Packaging to Product Ratios Continued

ReFED | U.S. GROCERY RETAIL FOOD PACKAGING TO PRODUCT RATIOS 14
REFED FOOD CATEGORY
PACKAGING % OF PRODUCT
WEIGHT
LBS PACKAGING / LBS FOOD + PACKAGING
PACKAGING TO PRODUCT
RATIO
LBS PACKAGING /
LBS FOOD
LBS OF PACKAGING PER RETAIL $ SOLD
LBS
PACKAGING / RETAIL $ SOLD
PROXY CATEGORY
FRESH MEAT & SEAFOOD
Sausage and franks
4.32% 4.52% 0.0139
Shrimp 0.00% 0.00% 0.0000 Assumed zero packaging
Steaks 6.54% 7.00% 0.0064
Whole chicken 9.32% 10.28% 0.0442
FROZEN
Frozen appetizers 9.27% 10.22% 0.0272
Frozen bagels 0.88% 0.88% 0.0031 Bagels
Frozen bakery desserts
10.67% 11.94% 0.0294
Frozen beans 2.73% 2.81% 0.0128
Frozen beef 1.07% 1.08% 0.0027 Frozen turkey
Frozen bread 14.08% 16.39% 0.0505
Frozen breakfast foods
21.35% 27.14% 0.0677
Frozen calzones and stromboli
14.48% 16.93% 0.0280
Frozen chicken 1.51% 1.53% 0.0049
Frozen dairy desserts
4.36% 4.56% 0.0311
Frozen dessert toppings
13.43% 15.52% 0.0562
Frozen dough and batters
1.06% 1.07% 0.0056
Frozen fruit 2.52% 2.59% 0.0084
Frozen fruit juice 6.61% 7.08% 0.0304
Frozen handheld entrees
1.39% 1.41% 0.0037
Table 3. Category Level Packaging to Product Ratios Continued

ReFED | U.S. GROCERY RETAIL FOOD PACKAGING TO PRODUCT RATIOS 15
REFED FOOD CATEGORY
PACKAGING % OF PRODUCT
WEIGHT
LBS PACKAGING / LBS FOOD + PACKAGING
PACKAGING TO PRODUCT
RATIO
LBS PACKAGING /
LBS FOOD
LBS OF PACKAGING PER RETAIL $ SOLD
LBS
PACKAGING / RETAIL $ SOLD
PROXY CATEGORY
FROZEN
Frozen lasagna 7.90% 8.58% 0.0285
Frozen mac and cheese
10.58% 11.83% 0.0274
Frozen meals 24.34% 32.17% 0.0799
Frozen meat alternatives
3.67% 3.81% 0.0062
Frozen pasta 1.65% 1.68% 0.0047
Frozen pie crust 9.86% 10.93% 0.0355
Frozen pizza 15.57% 18.45% 0.0583
Frozen pork 1.41% 1.43% 0.0050
Frozen pot pies 9.11% 10.02% 0.0282
Frozen potatoes 1.74% 1.77% 0.0104
Frozen rice 0.86% 0.87% 0.0021 Other frozen vegetables
Frozen rolls and buns
3.87% 4.03% 0.0105
Frozen sausage and franks
10.88% 12.21% 0.0348
Frozen seafood 2.43% 2.49% 0.0036
Frozen toaster pastries
11.08% 12.46% 0.0427
Frozen turkey 1.07% 1.08% 0.0046
Other frozen desserts
10.24% 11.41% 0.2023
Other frozen meat 1.41% 1.43% 0.0044 Frozen pork
Other frozen vegetables
0.86% 0.87% 0.0036
Table 3. Category Level Packaging to Product Ratios Continued
ReFED | U.S. GROCERY RETAIL FOOD PACKAGING TO PRODUCT RATIOS 16
REFED FOOD CATEGORY
PACKAGING % OF PRODUCT
WEIGHT
LBS PACKAGING / LBS FOOD + PACKAGING
PACKAGING TO PRODUCT
RATIO
LBS PACKAGING /
LBS FOOD
LBS OF PACKAGING PER RETAIL $ SOLD
LBS
PACKAGING / RETAIL $ SOLD
PROXY CATEGORY
PRODUCE
Apples 0.00% 0.00% 0.0000 Assumed zero packaging
Apricots 0.00% 0.00% 0.0000 Assumed zero packaging
Artichokes 0.00% 0.00% 0.0000 Assumed zero packaging
Asparagus 0.00% 0.00% 0.0000 Assumed zero packaging
Avocados 0.00% 0.00% 0.0000 Assumed zero packaging
Bananas 0.00% 0.00% 0.0000 Assumed zero packaging
Bell peppers 0.00% 0.00% 0.0000 Assumed zero packaging
Blackberries 10.47% 11.70% 0.0186
Blueberries 7.27% 7.84% 0.0170
Broccoli 1.68% 1.71% 0.0085
Brussel sprouts 1.68% 1.71% 0.0058 Broccoli
Cabbage 0.00% 0.00% 0.0000 Assumed zero packaging
Cantaloupe 0.00% 0.00% 0.0000 Assumed zero packaging
Carrots 0.63% 0.64% 0.0052
Cauliflower 1.68% 1.71% 0.0103 Broccoli
Celery 1.68% 1.71% 0.0085 Broccoli
Cherries 0.73% 0.74% 0.0023 Grapes
Chili peppers 0.00% 0.00% 0.0000 Assumed zero packaging
Clementines, mandarins, and tangerines
0.56% 0.56% 0.0039
Coconut 0.00% 0.00% 0.0000 Assumed zero packaging
Cranberries 0.73% 0.74% 0.0027 Grapes
Cucumbers 0.00% 0.00% 0.0000 Assumed zero packaging
Dipped fruit 9.94% 11.03% 0.0324 Fruit or vegetable trays
Eggplant 0.00% 0.00% 0.0000 Assumed zero packaging
Table 3. Category Level Packaging to Product Ratios Continued

ReFED | U.S. GROCERY RETAIL FOOD PACKAGING TO PRODUCT RATIOS 17
REFED FOOD CATEGORY
PACKAGING % OF PRODUCT
WEIGHT
LBS PACKAGING / LBS FOOD + PACKAGING
PACKAGING TO PRODUCT
RATIO
LBS PACKAGING /
LBS FOOD
LBS OF PACKAGING PER RETAIL $ SOLD
LBS
PACKAGING / RETAIL $ SOLD
PROXY CATEGORY
PRODUCE
Figs 0.00% 0.00% 0.0000 Assumed zero packaging
Fruit or vegetable trays
9.94% 11.03% 0.0249
Garlic 0.00% 0.00% 0.0000 Assumed zero packaging
Grapefruit 0.00% 0.00% 0.0000 Assumed zero packaging
Grapes 0.73% 0.74% 0.0035
Green beans 0.00% 0.00% 0.0000 Assumed zero packaging
Greens 0.00% 0.00% 0.0000 Assumed zero packaging
Honeydew 0.00% 0.00% 0.0000 Assumed zero packaging
Kale 1.70% 1.73% 0.0085 Packaged salads
Kiwis 5.93% 6.30% 0.0298
Leeks 0.00% 0.00% 0.0000 Assumed zero packaging
Lemons 0.00% 0.00% 0.0000 Assumed zero packaging
Lettuce 1.70% 1.73% 0.0090 Packaged salads
Limes 0.00% 0.00% 0.0000 Assumed zero packaging
Mangos 0.00% 0.00% 0.0000 Assumed zero packaging
Mixed vegetables 2.54% 2.60% 0.0094 Value added vegetables
Mushrooms 6.42% 6.85% 0.0158
Nectarines 0.00% 0.00% 0.0000 Assumed zero packaging
Onions 0.00% 0.00% 0.0000 Assumed zero packaging
Oranges 0.00% 0.00% 0.0000 Assumed zero packaging
Other beans 0.00% 0.00% 0.0000 Assumed zero packaging
Other berries 10.47% 11.70% 0.0190 Blackberries
Other citrus 0.00% 0.00% 0.0000 Assumed zero packaging
Other fruit 0.00% 0.00% 0.0000 Assumed zero packaging
Other melons 0.00% 0.00% 0.0000 Assumed zero packaging
Table 3. Category Level Packaging to Product Ratios Continued

ReFED | U.S. GROCERY RETAIL FOOD PACKAGING TO PRODUCT RATIOS 18
Table 3. Category Level Packaging to Product Ratios Continued
REFED FOOD CATEGORY
PACKAGING % OF PRODUCT
WEIGHT
LBS PACKAGING / LBS FOOD + PACKAGING
PACKAGING TO PRODUCT
RATIO
LBS PACKAGING /
LBS FOOD
LBS OF PACKAGING PER RETAIL $ SOLD
LBS
PACKAGING / RETAIL $ SOLD
PROXY CATEGORY
PRODUCE
Other squash 0.00% 0.00% 0.0000 Assumed zero packaging
Other vegetables 0.00% 0.00% 0.0000 Assumed zero packaging
Packaged salads 1.70% 1.73% 0.0039
Papayas 0.00% 0.00% 0.0000 Assumed zero packaging
Peaches 0.00% 0.00% 0.0000 Assumed zero packaging
Pears 0.00% 0.00% 0.0000 Assumed zero packaging
Peas 1.68% 1.71% 0.0032 Broccoli
Pineapples 0.00% 0.00% 0.0000 Assumed zero packaging
Plums 0.00% 0.00% 0.0000 Assumed zero packaging
Pomegranates 0.00% 0.00% 0.0000 Assumed zero packaging
Potatoes 0.59% 0.60% 0.0075
Pumpkins 0.00% 0.00% 0.0000 Assumed zero packaging
Radishes 0.00% 0.00% 0.0000 Assumed zero packaging
Raspberries 10.47% 11.70% 0.0153 Blackberries
Root vegetables 0.00% 0.00% 0.0000 Assumed zero packaging
Spinach 1.70% 1.73% 0.0060 Packaged salads
Sprouts 1.70% 1.73% 0.0034 Packaged salads
Squash 0.00% 0.00% 0.0000 Assumed zero packaging
Strawberries 5.39% 5.69% 0.0210
Sweet corn 0.00% 0.00% 0.0000 Assumed zero packaging
Tomatoes 6.37% 6.80% 0.0328
Value added fruit 7.87% 8.55% 0.0240
Value added vegetables
2.54% 2.60% 0.0081
Watermelons 0.00% 0.00% 0.0000 Assumed zero packaging

ReFED | U.S. GROCERY RETAIL FOOD PACKAGING TO PRODUCT RATIOS 19
Table 3. Category Level Packaging to Product Ratios Continued
REFED FOOD CATEGORY
PACKAGING % OF PRODUCT
WEIGHT
LBS PACKAGING / LBS FOOD + PACKAGING
PACKAGING TO PRODUCT
RATIO
LBS PACKAGING /
LBS FOOD
LBS OF PACKAGING PER RETAIL $ SOLD
LBS
PACKAGING / RETAIL $ SOLD
PROXY CATEGORY
READY-TO-DRINK BEVERAGES
Coffee 42.44% 73.72% 0.3062
Fruit and vegetable juice
4.39% 4.59% 0.0686
Other drinks 7.62% 8.12% 0.1067 Department average
Shakes and smoothies
3.88% 4.04% 0.0171
Sparkling juice 37.60% 60.27% 1.1132
Tea 3.75% 3.89% 0.0665

ReFED | U.S. GROCERY RETAIL FOOD PACKAGING TO PRODUCT RATIOS 20
APPENDIX Appendix A: ReFED Primary Research for Packaging to Product RatiosBecause there was no publicly available data on packaging to product ratios, ReFED conducted original research to develop proxy packaging to product ratios for each grocery retail category. One product was selected from each grocery retail department with the intent of selecting an archetype product that most closely represents the majority of sales and the most common type of packaging for each category. The following table describes the methodology used to calculate these packaging to product ratios using scale weight measurements of (1) the total product weight and (2) the weight of packaging alone, with food removed. The research team verified the scale accuracy with calibrated weights as a test prior to collecting the measurements. The scale was also tared to zero before each use. Careful care was taken to make sure that all food was removed before weighing the packaging. Towels and a hair dryer were used to remove the weight of water when washing was necessary. Table 4. Calculations Performed to Determine Item Packaging to Product Ratios
DATA ITEM DATA SOURCE OR CALCULATION EXAMPLE
Item Total Weight Total item weight, including packaging plus food, measured with scale
Package of pita bread weighs 513 grams
Item Packaging Weight Item packaging weight after food was removed, measured with scale
After removing the pita bread from the bag, the bag alone weighs 8 grams
Item Food Weight = Item Total Weight - Item Packaging Weight
= 513 grams - 8 grams= 505 grams
Item % Packaging by Weight
= Item Packaging Weight / Item Total Weight
= 8 grams packaging / 513 grams food plus packaging * 100 = 1.56%
Item Packaging to Product Ratio
= Item Packaging Weight / Item Food Weight * 100
= 8 grams packaging / 505 grams food * 100= 1.58%

ReFED | U.S. GROCERY RETAIL FOOD PACKAGING TO PRODUCT RATIOS 21
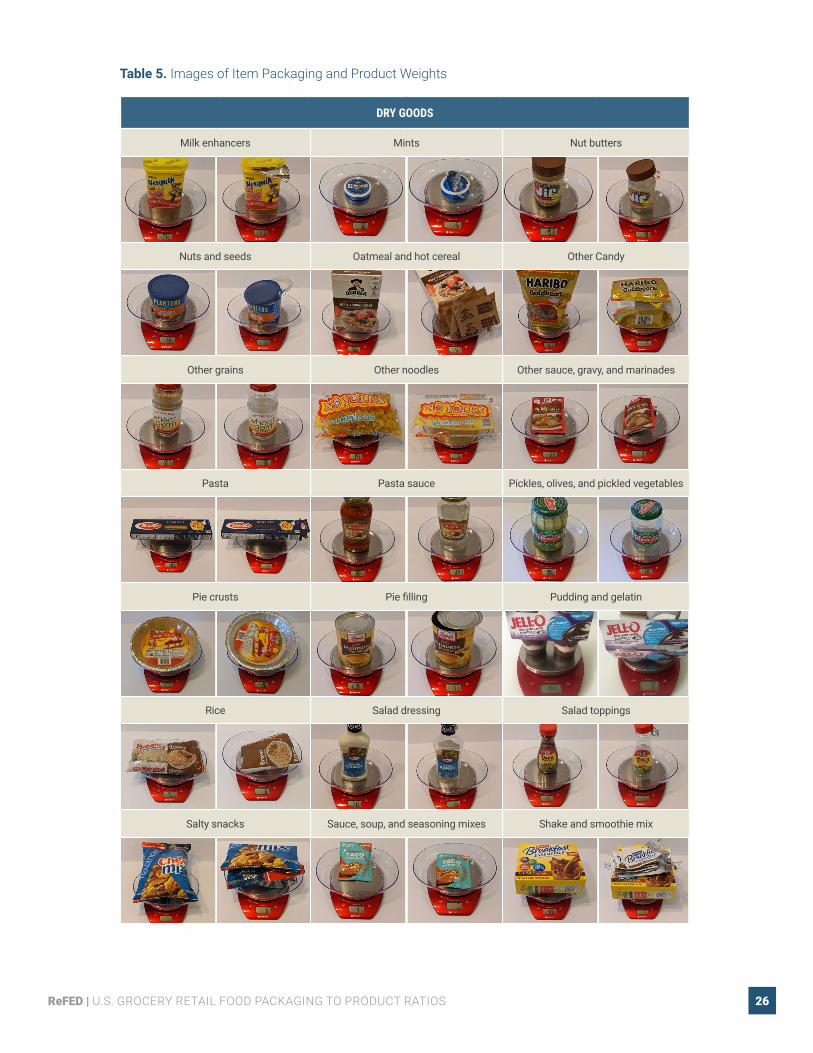
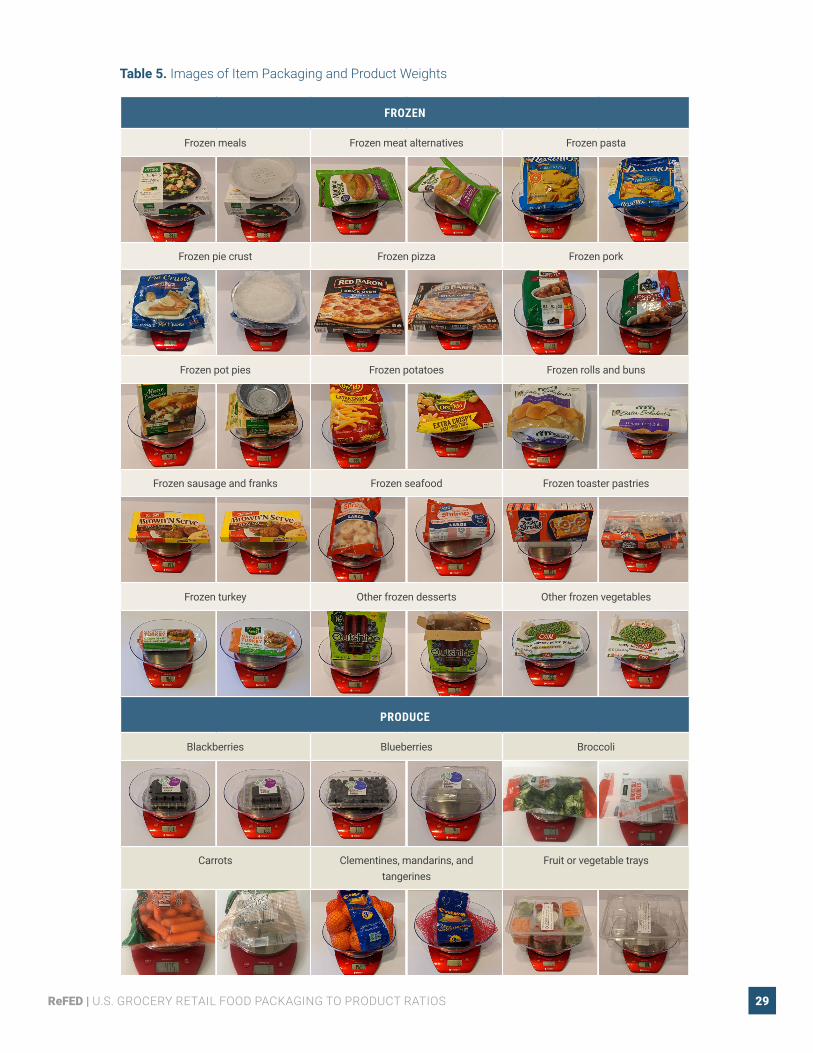
Table 5. Images of Item Packaging and Product Weights
The following table displays the proxy products that ReFED selected for each grocery retail category along with the weight measurements obtained from the scale. All of the food purchased for this project was consumed by the research team or acquaintances afterwards.
BREADS & BAKERY
Artisan and specialty bread Bagels Brownies
Cake Cheesecake Cookies
Cupcakes Donuts English muffins and crumpets
Flatbreads and pizza crusts Muffins Pies, cobblers, and crisps
Pita bread Rolls and buns Sliced bread
Soft tortillas Sweet goods

ReFED | U.S. GROCERY RETAIL FOOD PACKAGING TO PRODUCT RATIOS 22
DAIRY & EGGS
Butter, margarine, and substitutes Buttermilk Cheese
Creams and creamers Dairy milk Eggs
Lactose reduced/free milk Liquid egg mix Plant-based dairy alternatives
Refrigerated doughs Sour cream Yogurt
DELI & PREPARED FOODS
Deli salads Deli trays Fully cooked chicken
Hummus Meal kits Pasta
Table 5. Images of Item Packaging and Product Weights

ReFED | U.S. GROCERY RETAIL FOOD PACKAGING TO PRODUCT RATIOS 23
DELI & PREPARED FOODS
Pizza Potatoes Prepared meals
Sandwiches Snack combos Soups, stews, and broth
Sushi
DRY GOODS
Apple sauce Baby food Bagged or loose tea
Baking chips and chocolate Baking cocoa Baking coconut
Baking milks Baking mixes Baking nuts
Table 5. Images of Item Packaging and Product Weights

ReFED | U.S. GROCERY RETAIL FOOD PACKAGING TO PRODUCT RATIOS 24
DRY GOODS
Baking yeast Bouillon Boxed dinners
Breakfast syrups Broth Canned beans
Canned fruit Canned meat and seafood Canned soup
Canned vegetables Cereal Cereal and granola bars
Chilled cereal Chocolate candy Coating mixes and crumbs
Coffee Coffee enhancers Coffee pods
Condiments Cookies Cooking oils
Table 5. Images of Item Packaging and Product Weights

ReFED | U.S. GROCERY RETAIL FOOD PACKAGING TO PRODUCT RATIOS 25
DRY GOODS
Cooking syrups Cooking wine and vinegar Corn and other food starch
Crackers Dessert toppings Diet and nutrition
Dried fruit and vegetables Dry beans Edible cake decoration
Flour and meal Frosting Fruit snacks
Gnocchi and dumplings Grits Gum
Hard shell tortillas Herbs, spices, and seasonings Hot cider
Hot cocoa Jams and jellies Marshmallows
Table 5. Images of Item Packaging and Product Weights
ReFED | U.S. GROCERY RETAIL FOOD PACKAGING TO PRODUCT RATIOS 26
DRY GOODS
Milk enhancers Mints Nut butters
Nuts and seeds Oatmeal and hot cereal Other Candy
Other grains Other noodles Other sauce, gravy, and marinades
Pasta Pasta sauce Pickles, olives, and pickled vegetables
Pie crusts Pie filling Pudding and gelatin
Rice Salad dressing Salad toppings
Salty snacks Sauce, soup, and seasoning mixes Shake and smoothie mix
Table 5. Images of Item Packaging and Product Weights

ReFED | U.S. GROCERY RETAIL FOOD PACKAGING TO PRODUCT RATIOS 27
DRY GOODS
Shelf-stable dips and salsa Shortening and lard Snack cakes
Specialty wraps Sugar and sweeteners Toaster pastries
Tomato sauce and paste
FRESH MEAT & SEAFOOD
Bacon Beef roast Chicken breast
Chicken legs Chicken thighs Fowl and exotics
Ground beef Ground turkey Ham
Lamb Lunchmeat Meat alternatives
Table 5. Images of Item Packaging and Product Weights

ReFED | U.S. GROCERY RETAIL FOOD PACKAGING TO PRODUCT RATIOS 28
FRESH MEAT & SEAFOOD
Pork Salmon Sausage and franks
Steaks Whole chicken
FROZEN
Frozen appetizers Frozen bakery desserts Frozen beans
Frozen bread Frozen breakfast foods Frozen calzones and stromboli
Frozen chicken Frozen dairy desserts Frozen dessert toppings
Frozen dough and batters Frozen fruit Frozen fruit juice
Frozen handheld entrees Frozen lasagna Frozen mac and cheese
Table 5. Images of Item Packaging and Product Weights
ReFED | U.S. GROCERY RETAIL FOOD PACKAGING TO PRODUCT RATIOS 29
FROZEN
Frozen meals Frozen meat alternatives Frozen pasta
Frozen pie crust Frozen pizza Frozen pork
Frozen pot pies Frozen potatoes Frozen rolls and buns
Frozen sausage and franks Frozen seafood Frozen toaster pastries
Frozen turkey Other frozen desserts Other frozen vegetables
PRODUCE
Blackberries Blueberries Broccoli
Carrots Clementines, mandarins, and tangerines
Fruit or vegetable trays
Table 5. Images of Item Packaging and Product Weights

ReFED | U.S. GROCERY RETAIL FOOD PACKAGING TO PRODUCT RATIOS 30
PRODUCE
Grapes Kiwis Mushrooms
Packaged salads Potatoes Strawberries
Tomatoes Value added fruit Value added vegetables
READY-TO-DRINK BEVERAGES
Coffee Fruit and vegetable juice Shakes and smoothies
Sparkling juice Tea
Table 5. Images of Item Packaging and Product Weights