us fuel ethanol industry – a current snapshot presented by greg krissek september 26, 2007
TRANSCRIPT
US Fuel Ethanol Industry –
A Current Snapshot
Presented by
Greg Krissek
September 26, 2007
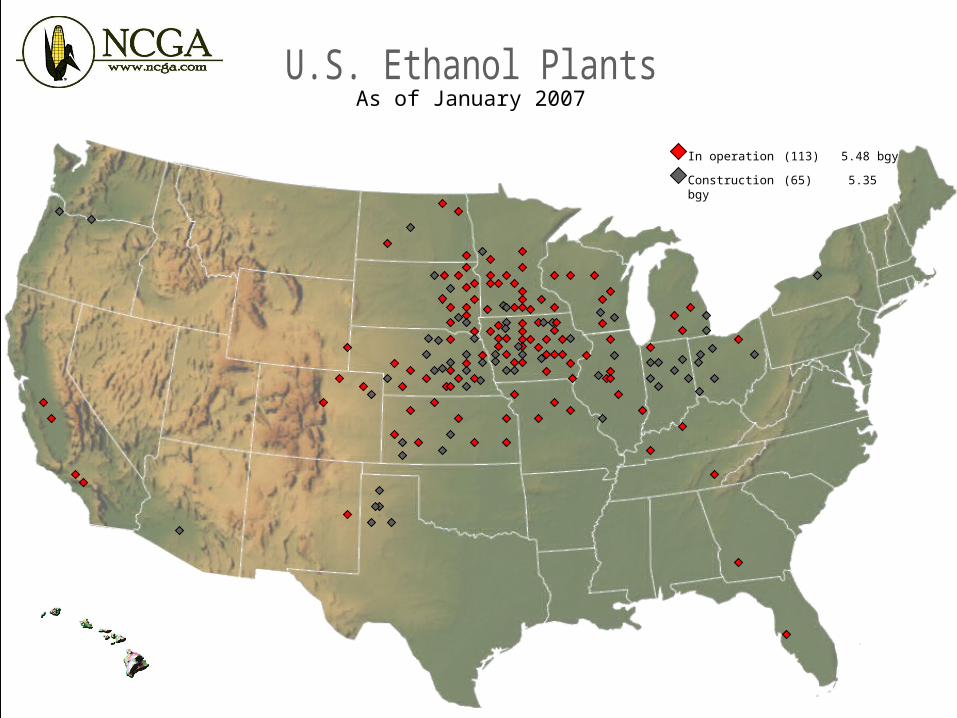
As of January 2007
In operation (113) 5.48 bgy
Construction (65) 5.35 bgy
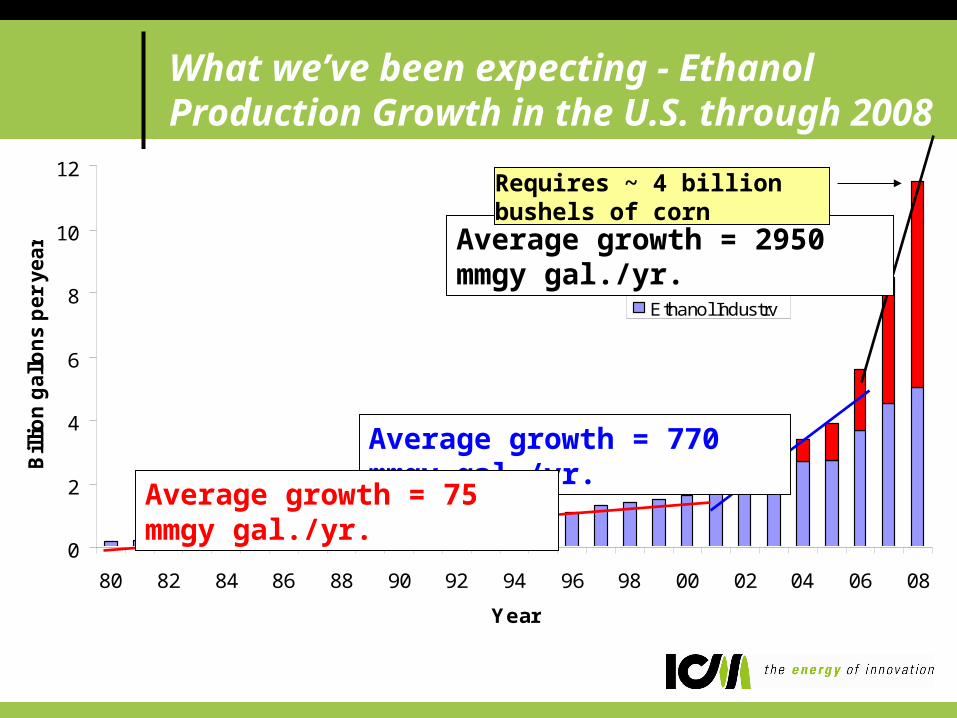
What we’ve been expecting - Ethanol Production Growth in the U.S. through 2008
0
2
4
6
8
10
12
80 82 84 86 88 90 92 94 96 98 00 02 04 06 08
Year
Bil
lio
n g
all
on
s p
er
yea
r
ICM Contribution
Ethanol Industry
Average growth = 2950 mmgy gal./yr.
Average growth = 770 mmgy gal./yr.
Average growth = 75 mmgy gal./yr.
Requires ~ 4 billion bushels of corn
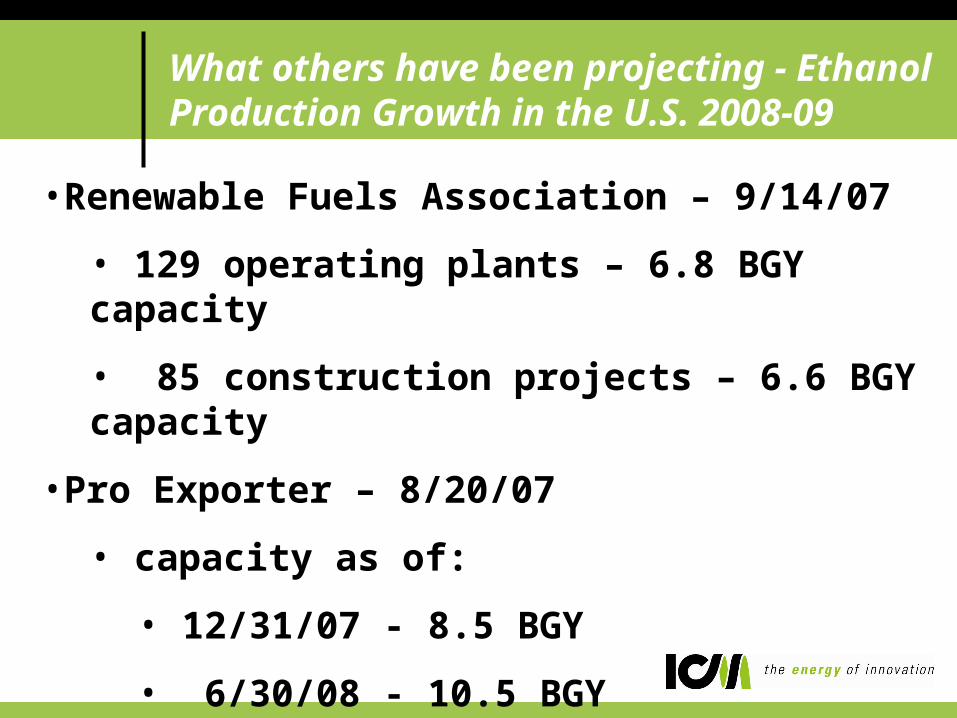
What others have been projecting - Ethanol Production Growth in the U.S. 2008-09
•Renewable Fuels Association – 9/14/07
• 129 operating plants – 6.8 BGY capacity
• 85 construction projects – 6.6 BGY capacity
•Pro Exporter – 8/20/07
• capacity as of:
• 12/31/07 - 8.5 BGY
• 6/30/08 - 10.5 BGY
• 12/31/08 – 11.5 BGY
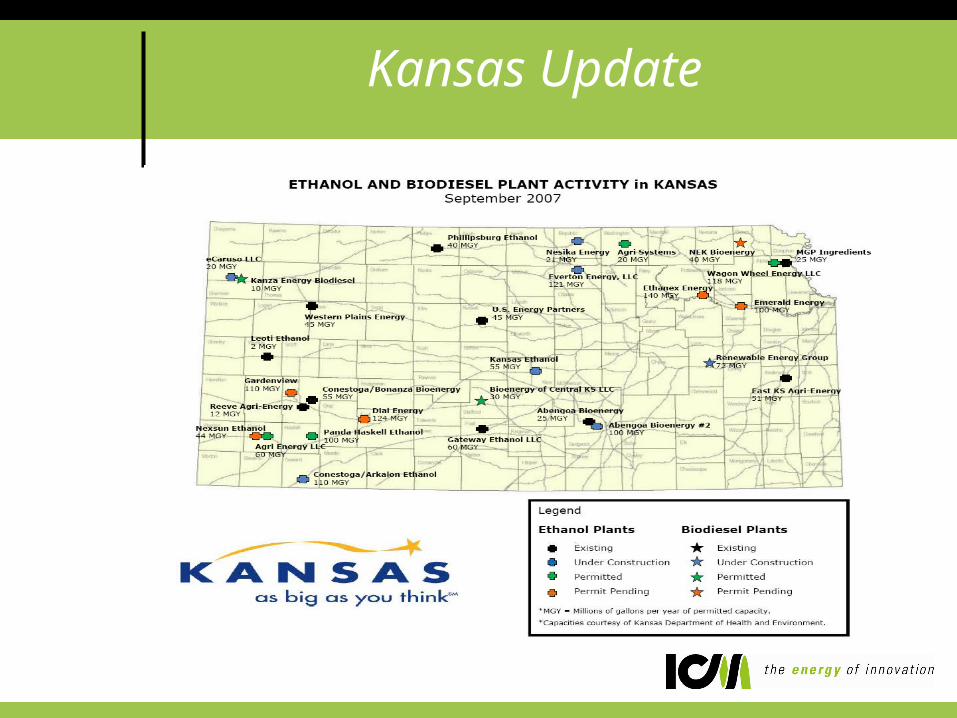
Kansas Update
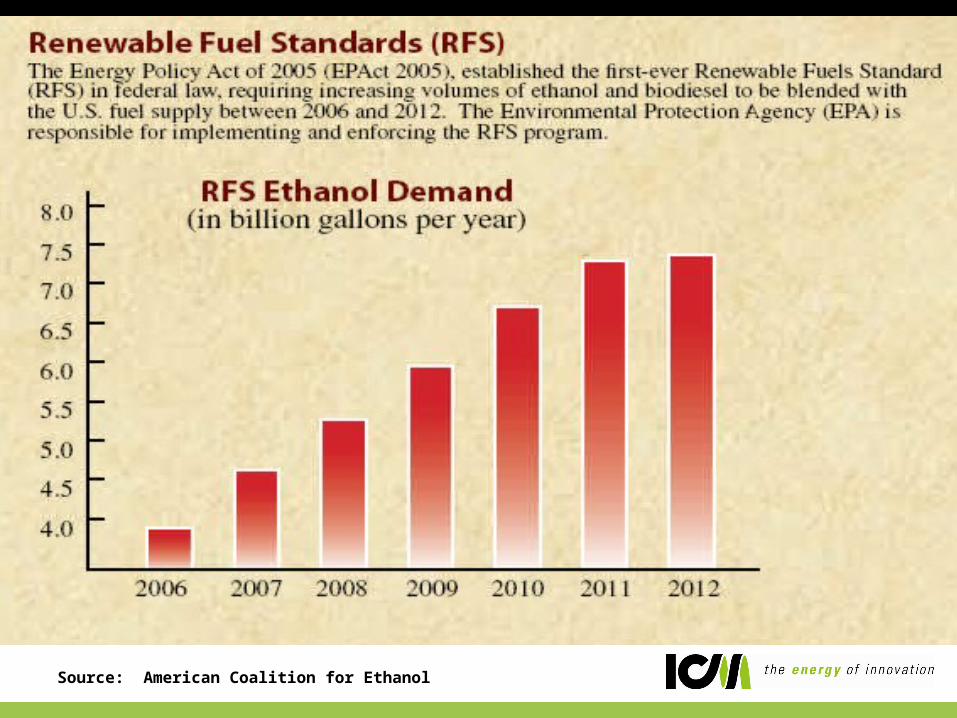
Source: American Coalition for Ethanol
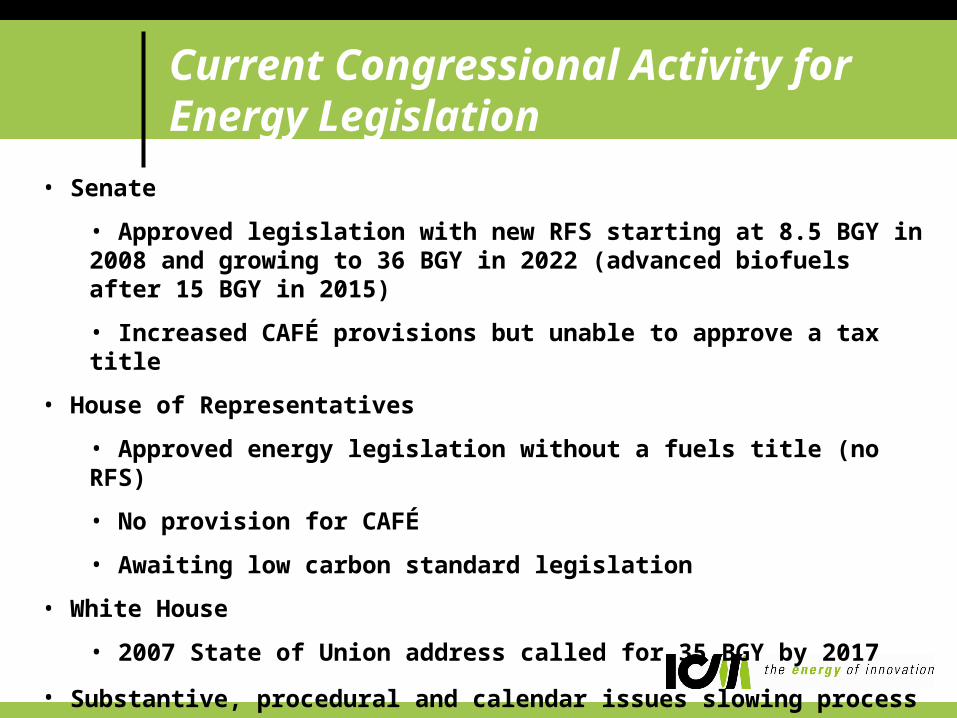
Current Congressional Activity for Energy Legislation
• Senate
• Approved legislation with new RFS starting at 8.5 BGY in 2008 and growing to 36 BGY in 2022 (advanced biofuels after 15 BGY in 2015)
• Increased CAFÉ provisions but unable to approve a tax title
• House of Representatives
• Approved energy legislation without a fuels title (no RFS)
• No provision for CAFÉ
• Awaiting low carbon standard legislation
• White House
• 2007 State of Union address called for 35 BGY by 2017
• Substantive, procedural and calendar issues slowing process - and next is the election cycle

Price Difference: Ethanol Spot Minus Regular Unleaded Chicago Spot Market ($/gallon)
-1
-0.5
0
0.5
1
1.5
2
1/3
/19
95
6/2
3/1
99
5
12
/15
/19
95
6/7
/19
96
11
/27
/19
96
5/2
2/1
99
7
11
/11
/19
97
5/7
/19
98
10
/27
/19
98
4/2
2/1
99
9
10
/12
/19
99
4/6
/20
00
9/2
8/2
00
0
3/2
3/2
00
1
9/1
8/2
00
1
3/1
4/2
00
2
9/5
/20
02
2/2
8/2
00
3
8/2
0/2
00
3
2/1
7/2
00
4
8/9
/20
04
2/3
/20
05
7/2
7/2
00
5
1/2
0/2
00
6
7/1
4/2
00
6
1/8
/20
07
Source: Chicago Board of Trade
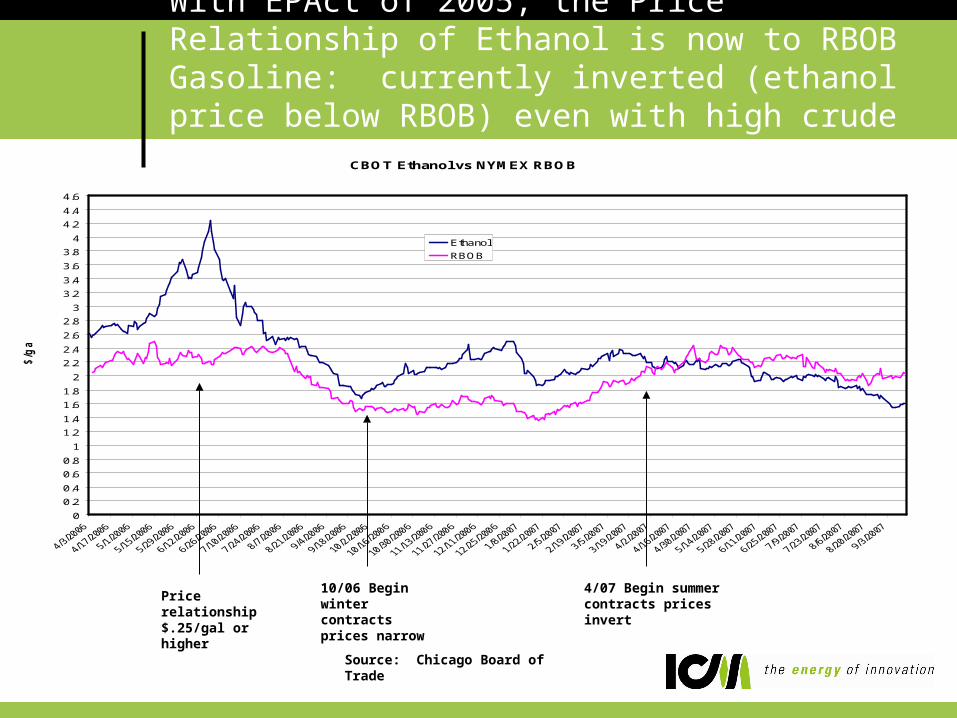
With EPAct of 2005, the Price Relationship of Ethanol is now to RBOB Gasoline: currently inverted (ethanol price below RBOB) even with high crude oil prices
Source: Chicago Board of Trade
10/06 Begin winter contracts prices narrow
4/07 Begin summer contracts prices invert
Price relationship $.25/gal or higher
CBOT Ethanol vs NYMEX RBOB
0
0.2
0.4
0.6
0.8
1
1.2
1.4
1.6
1.8
2
2.2
2.4
2.6
2.8
3
3.2
3.4
3.6
3.8
4
4.2
4.4
4.6
$/g
al
Ethanol
RBOB
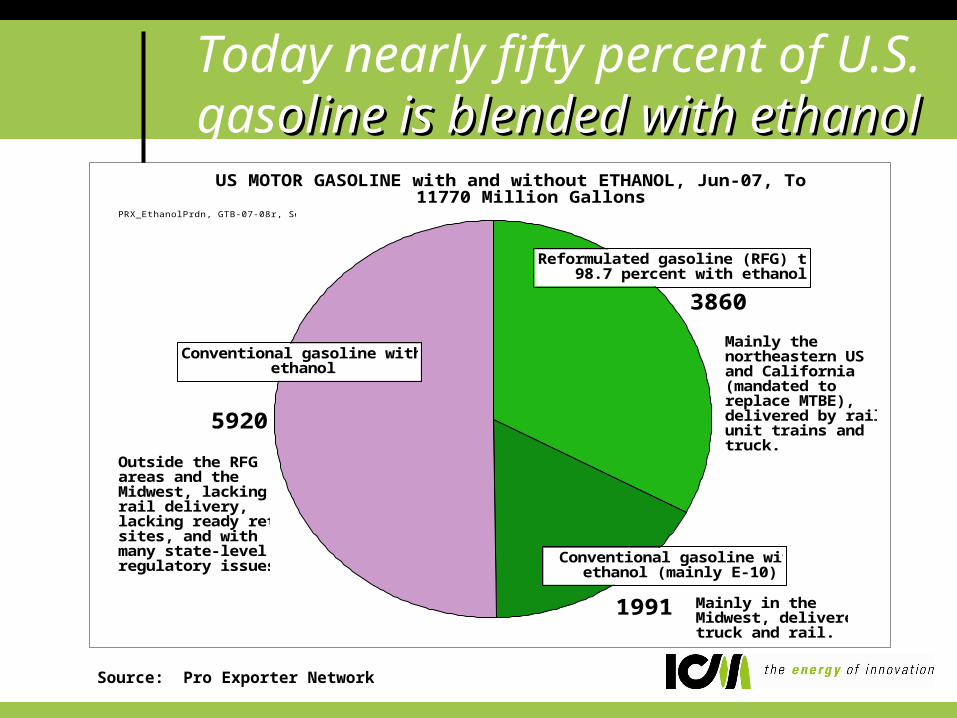
Today nearly fifty percent of U.S. gasoline is blended with ethanololine is blended with ethanol
3860
1991
5920
US MOTOR GASOLINE with and without ETHANOL, Jun-07, Total of 11770 Million Gallons
Reformulated gasoline (RFG) total, 98.7 percent with ethanol
Conventional gasoline with ethanol (mainly E-10)
Conventional gasoline without ethanol
Outside the RFG areas and the Midwest, lacking rail delivery, lacking ready retail sites, and with many state-level regulatory issues
Mainly in the Midwest, delivered truck and rail.
Mainly the northeastern US and California (mandated to replace MTBE), delivered by rail unit trains and truck.
PRX_EthanolPrdn, GTB-07-08r, Sep-05-07
Source: Pro Exporter Network
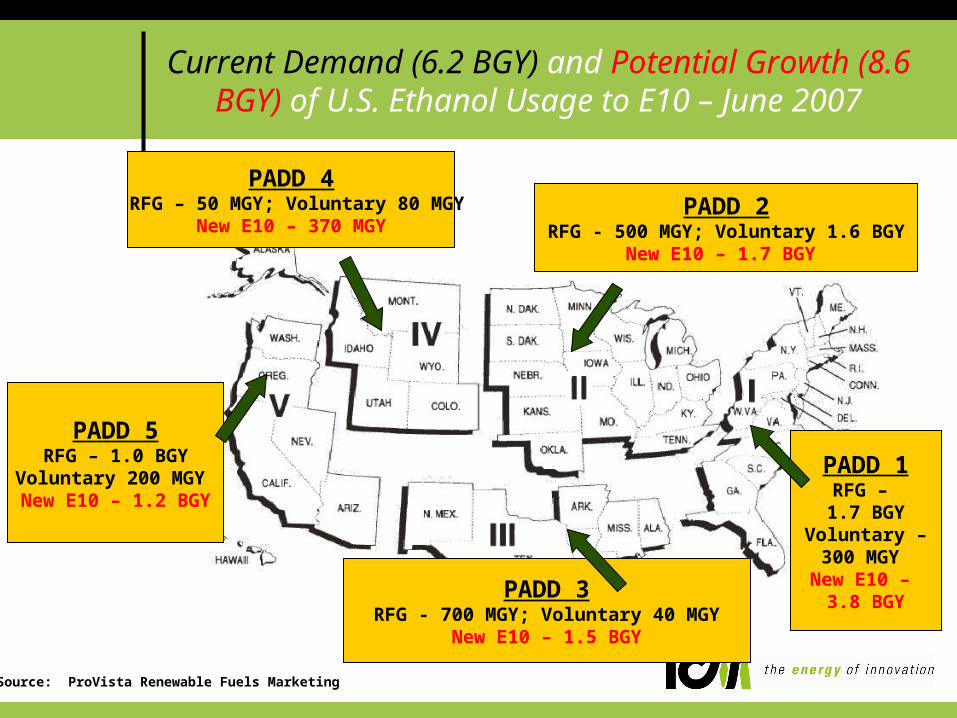
Current Demand (6.2 BGY) and Potential Growth (8.6 BGY) of U.S. Ethanol Usage to E10 – June 2007
PADD 1RFG –
1.7 BGYVoluntary –300 MGY
New E10 – 3.8 BGY
PADD 2RFG - 500 MGY; Voluntary 1.6 BGY
New E10 – 1.7 BGY
PADD 3RFG - 700 MGY; Voluntary 40 MGY
New E10 – 1.5 BGY
PADD 4 RFG – 50 MGY; Voluntary 80 MGY
New E10 – 370 MGY
PADD 5RFG – 1.0 BGY
Voluntary 200 MGY New E10 – 1.2 BGY
Source: ProVista Renewable Fuels Marketing

Beyond E10 - E85 and FFV’s – over 30 models available today
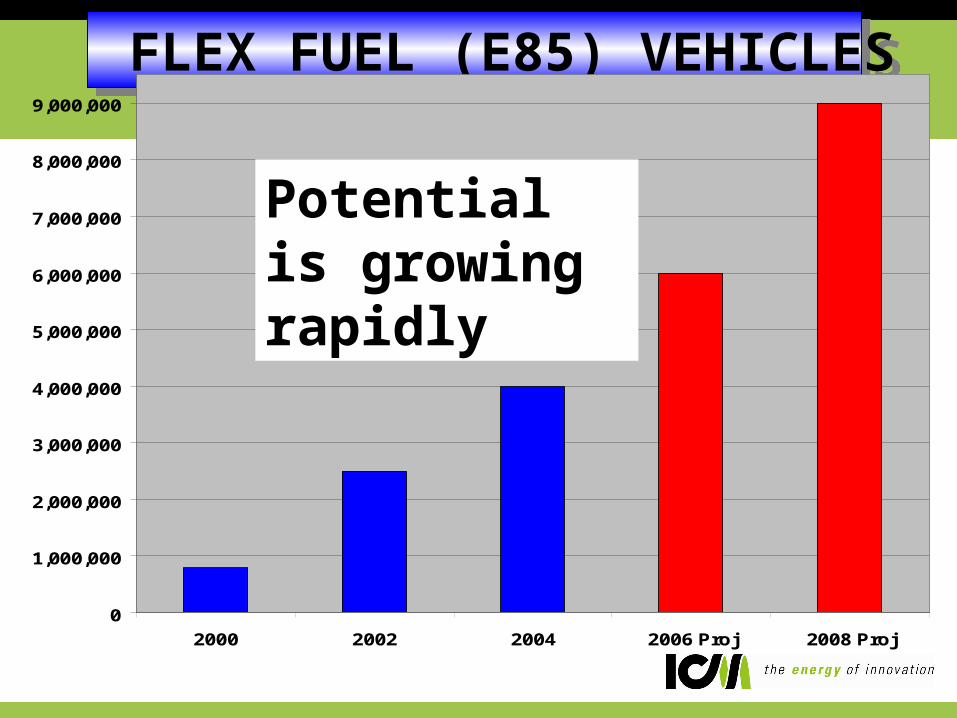
FLEX FUEL (E85) VEHICLES FLEX FUEL (E85) VEHICLES
0
1,000,000
2,000,000
3,000,000
4,000,000
5,000,000
6,000,000
7,000,000
8,000,000
9,000,000
2000 2002 2004 2006 Proj 2008 Proj
Potential is growing rapidly
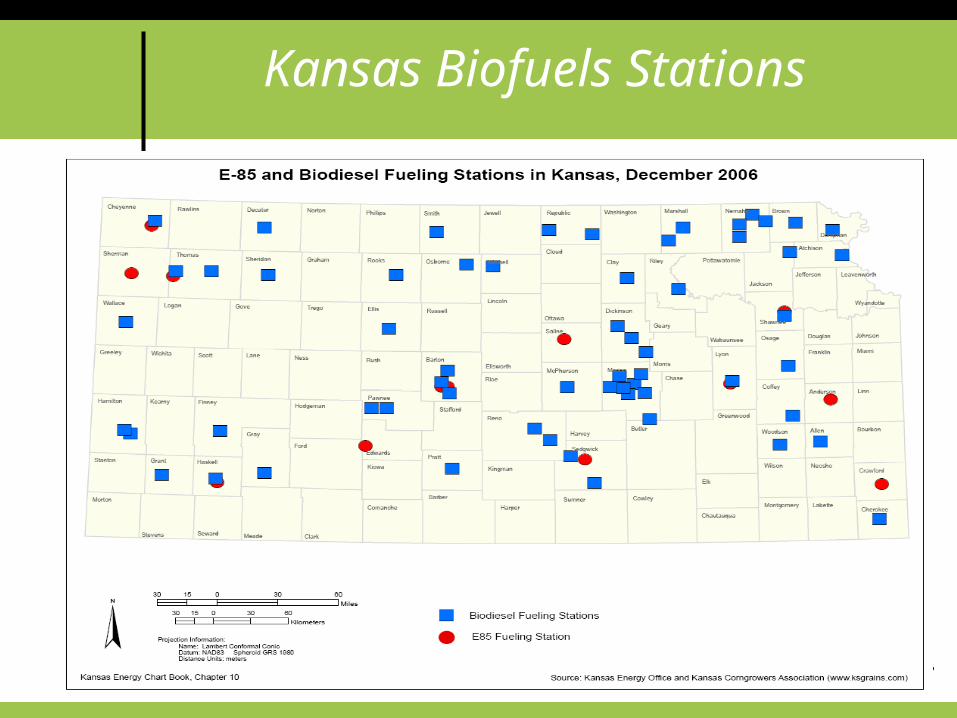
Kansas Biofuels Stations
The Face of Investors is Changing
● 1995 - 2005 – Farmer-owned cooperatives and LLC’s
Pool of investors able to raise more capital to build larger plants
Reduced risk Plant able to ride out market fluctuations
because of corn-delivery agreements with farmer/investors
● Today - Larger investors Market stabilization draws big investors
• Potential returns• Take advantage of economy of scale
● Banks being selective
Energy Prices Lead Plant Designers to Evaluate Alternative Energy Sources
● Land Fill Gas● Corn fiber● Biomass
Ag Residue Solid waste Wood chips
● Waste steam
… but reliability, consistent availability, conversion technology and cost are crucial
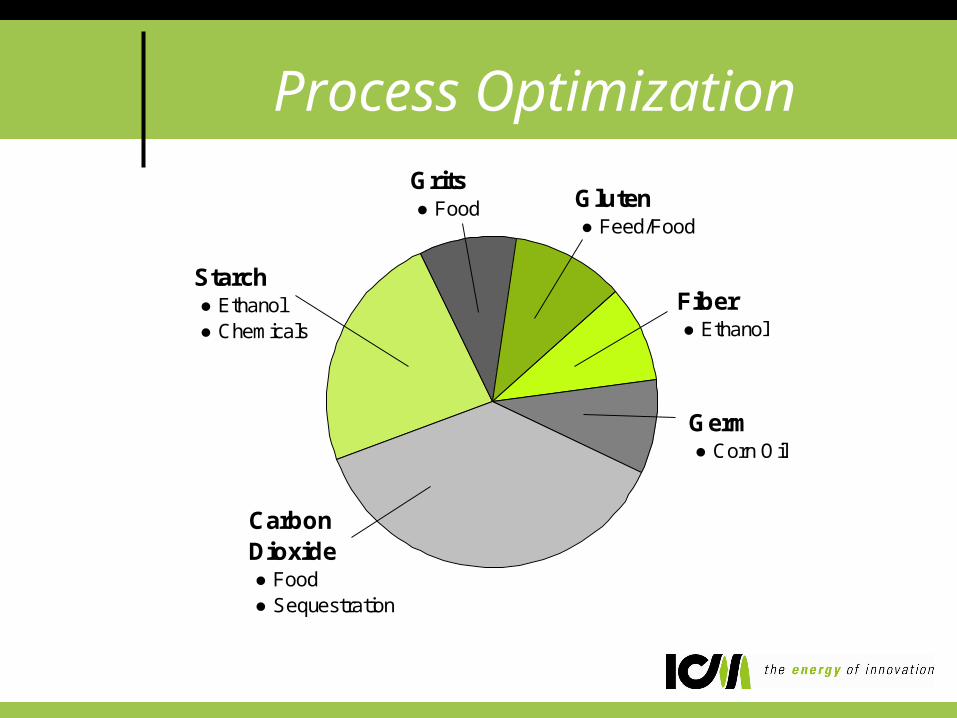
Process Optimization
Starch ● Ethanol ● Chemicals
Grits ● Food Gluten
● Feed/Food
Fiber ● Ethanol
Germ ● Corn Oil
Carbon Dioxide ● Food ● Sequestration

Industry Challenges and Opportunities
• Challenges
• Tight margins for ethanol plants
• Fuel terminal infrastructure and distribution shortfalls
• Vehicle engine technology
• Battling in the court of public opinion
• Opportunities
• Low prices cure low prices
• Blender pumps and high blend fuels
• Political support remains strong
• Additional feedstocks