us flu ve network and us hospitalized adult influenza ... hospitalized adult influenza vaccine...
TRANSCRIPT
National Center for Immunization & Respiratory Diseases
Influenza Vaccine Effectiveness, 2016-17
US Flu VE Network &
US Hospitalized Adult Influenza Vaccine Effectiveness Network (HAIVEN)
Jill Ferdinands, PhD
CDC Influenza Division
Meeting of the Advisory Committee on Immunization Practices (ACIP)
June 21, 2017
Objectives
Review end-of-season estimates of 2016-17 influenza vaccineeffectiveness (VE) from US Flu VE Network (outpatient flu, all ages)
Introduce US Hospitalized Adult Influenza Vaccine Effectiveness Network(HAIVEN) (inpatient flu, adults) and present preliminary 2016-17 VEestimates
2
3
UUSUS Flu VE Network VE Estiates,2016-17
OUTPATIENT
ALL AGES
US Flu VE Networks 2016-2017 Outpatients All Ages

US Flu VE Network and principal investigators
Kaiser Permanente Washington Health Research Institute
Mike JacksonLisa Jackson
Baylor Scott & White HealthManju Gaglani
Marshfield Clinic Research InstituteEd Belongia
Huong McLean University of MichiganArnold MontoEmily Martin
University of PittsburghRick Zimmerman
Tricia Nowalk
CDCBrendan Flannery
Alicia Fry
4

US Flu VE Network Methods
Enrollees: Outpatients aged ≥6 months with acute respiratory illness with cough ≤7 days duration
Design: Test-negative case-control design
Odds of PCR-confirmed influenza among vaccinated compared to unvaccinated enrollees
Vaccinated: at least one dose of 2016–17 flu vaccine according to medical records, immunization registries, and/or self-report with date and location
Analysis: VE = (1 – adjusted OR) x 100%
Adjusted for site, age, sex, race/ethnicity, self-rated general health status, days from onset to enrollment, and calendar time of onset
5
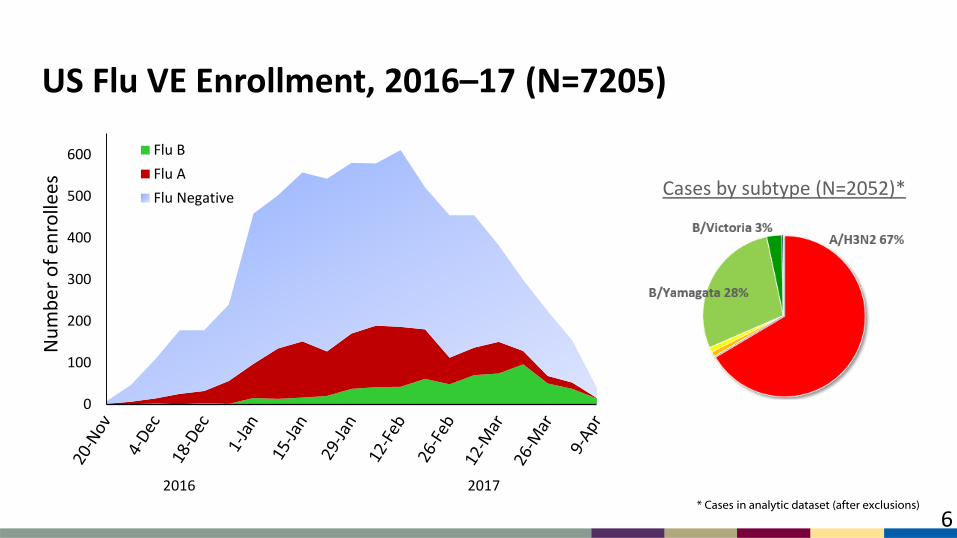
US Flu VE Enrollment, 2016–17 (N=7205)
0
100
200
300
400
500
600
Nu
mb
er o
f en
rolle
es
Flu B
Flu A
Flu Negative
2016 2017
6
Cases by subtype (N=2052)*
* Cases in analytic dataset (after exclusions)

US Flu VE Network:Vaccine effectiveness against influenza A/B, 2016–17
Vaccine Effectiveness
Influenza positive Influenza negative Unadjusted Adjusted*
Any influenza A or B virus
N vaccinated/Total (%) N vaccinated/Total (%) VE % 95% CI VE % 95% CI
All ages 883/2052 (43) 2761/5153 (54) 35 (27 to 41) 42 (35 to 48)
Age group (yr)
6 mo–8 yr 106/353 (30) 709/1318 (54) 63 (53 to 71) 61 (49 to 70)
9–17 123/402 (31) 245/606 (40) 35 (15 to 50) 35 (13 to 61)
18–49 203/529 (38) 716/1629 (44) 21 (3 to 35) 19 (-1 to 34)
50–64 203/442 (46) 537/909 (59) 41 (26 to 53) 42 (26 to 55)
≥65 248/326 (76) 554/691 (80) 21 (-8 to 43) 25 (-5 to 46)
* Multivariate logistic regression models adjusted for site, age, sex, race/ethnicity, self-rated general health status, days from illness onset to enrollment, and calendar time of illness onset
7
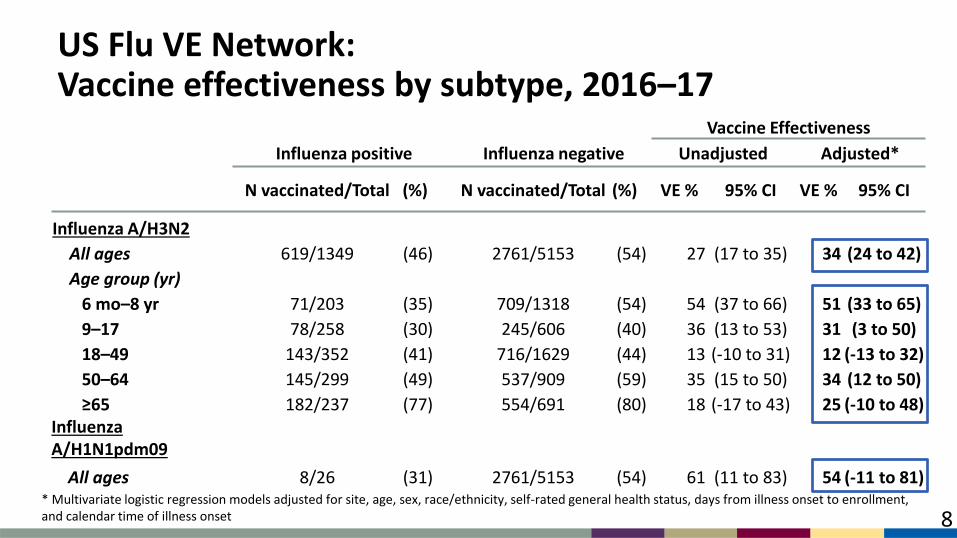
US Flu VE Network:Vaccine effectiveness by subtype, 2016–17
Vaccine Effectiveness
Influenza positive Influenza negative Unadjusted Adjusted*
N vaccinated/Total (%) N vaccinated/Total (%) VE % 95% CI VE % 95% CI
Influenza A/H3N2
All ages 619/1349 (46) 2761/5153 (54) 27 (17 to 35) 34 (24 to 42)
Age group (yr)
6 mo–8 yr 71/203 (35) 709/1318 (54) 54 (37 to 66) 51 (33 to 65)
9–17 78/258 (30) 245/606 (40) 36 (13 to 53) 31 (3 to 50)
18–49 143/352 (41) 716/1629 (44) 13 (-10 to 31) 12 (-13 to 32)
50–64 145/299 (49) 537/909 (59) 35 (15 to 50) 34 (12 to 50)
≥65 182/237 (77) 554/691 (80) 18 (-17 to 43) 25 (-10 to 48)Influenza A/H1N1pdm09
All ages 8/26 (31) 2761/5153 (54) 61 (11 to 83) 54 (-11 to 81)* Multivariate logistic regression models adjusted for site, age, sex, race/ethnicity, self-rated general health status, days from illness onset to enrollment, and calendar time of illness onset 8

US Flu VE Network:Vaccine effectiveness by B lineage, 2016–17
Vaccine Effectiveness
Influenza positive Influenza negative Unadjusted Adjusted*
N vaccinated/Total (%) N vaccinated/Total (%) VE % 95% CI VE % 95% CI
Influenza B
All ages 238/650 (37) 2761/5153 (54) 50 (41 to 58) 56 (47 to 64)
Influenza B/Yamagata
All ages 215/579 (37) 2761/5153 (54) 49 (39 to 57) 55 (45 to 63)
Influenza B/Victoria
All ages 21/63 (33) 2761/5153 (54) 57 (27 to 74) 60 (31 to 77)
* Multivariate logistic regression models adjusted for site, age, sex, race/ethnicity, self-rated general health status, days from illness onset to enrollment, and calendar time of illness onset 9

HAIVEN VE Estimates, 2016-17
10
HAIVEN VE Estimates, 2016-17INPATIENTADULTSINPATIENT
ADULS
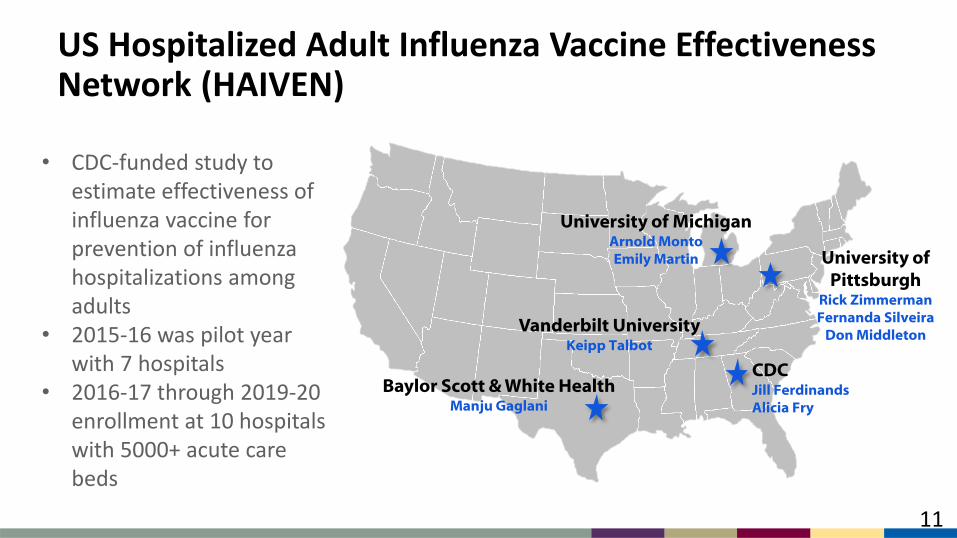
US Hospitalized Adult Influenza Vaccine Effectiveness Network (HAIVEN)
Baylor Scott & White HealthManju Gaglani
Vanderbilt UniversityKeipp Talbot
University of Pittsburgh
Rick ZimmermanFernanda Silveira
Don Middleton
University of MichiganArnold MontoEmily Martin
CDCJill FerdinandsAlicia Fry
11
• CDC-funded study to estimate effectiveness of influenza vaccine for prevention of influenza hospitalizations among adults
• 2015-16 was pilot year with 7 hospitals
• 2016-17 through 2019-20 enrollment at 10 hospitalswith 5000+ acute care beds
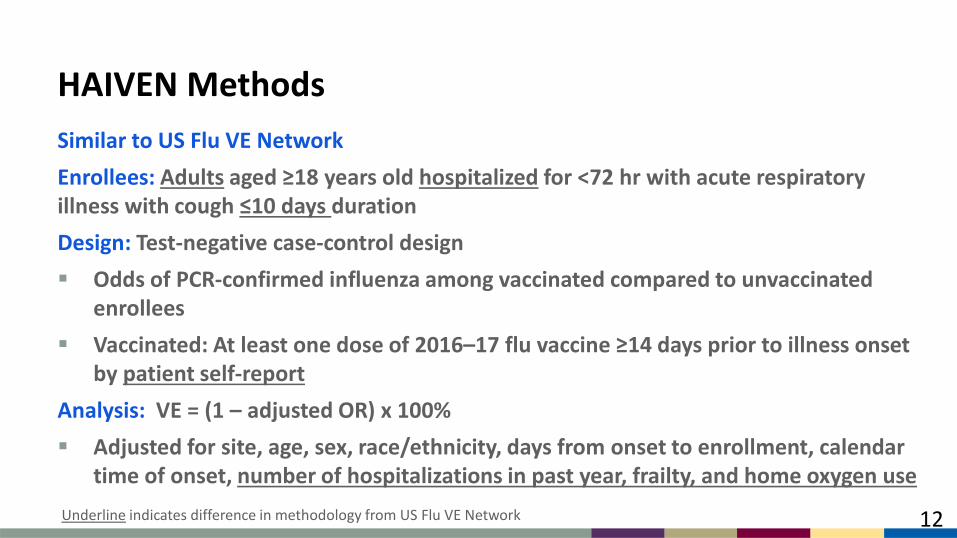
HAIVEN Methods
Similar to US Flu VE Network
Enrollees: Adults aged ≥18 years old hospitalized for <72 hr with acute respiratory illness with cough ≤10 days duration
Design: Test-negative case-control design
Odds of PCR-confirmed influenza among vaccinated compared to unvaccinated enrollees
Vaccinated: At least one dose of 2016–17 flu vaccine ≥14 days prior to illness onset by patient self-report
Analysis: VE = (1 – adjusted OR) x 100%
Adjusted for site, age, sex, race/ethnicity, days from onset to enrollment, calendar time of onset, number of hospitalizations in past year, frailty, and home oxygen use
Underline indicates difference in methodology from US Flu VE Network 12
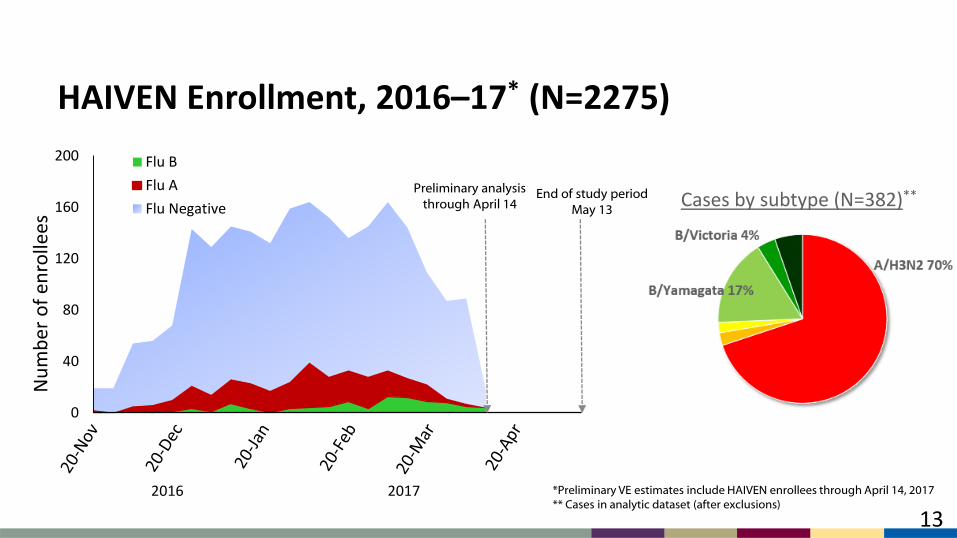
HAIVEN Enrollment, 2016–17* (N=2275)
0
40
80
120
160
200
Nu
mb
er o
f en
rolle
es
Flu B
Flu A
Flu Negative
2016 2017
Preliminary analysis through April 14
End of study periodMay 13
13
*Preliminary VE estimates include HAIVEN enrollees through April 14, 2017** Cases in analytic dataset (after exclusions)
Cases by subtype (N=382)**
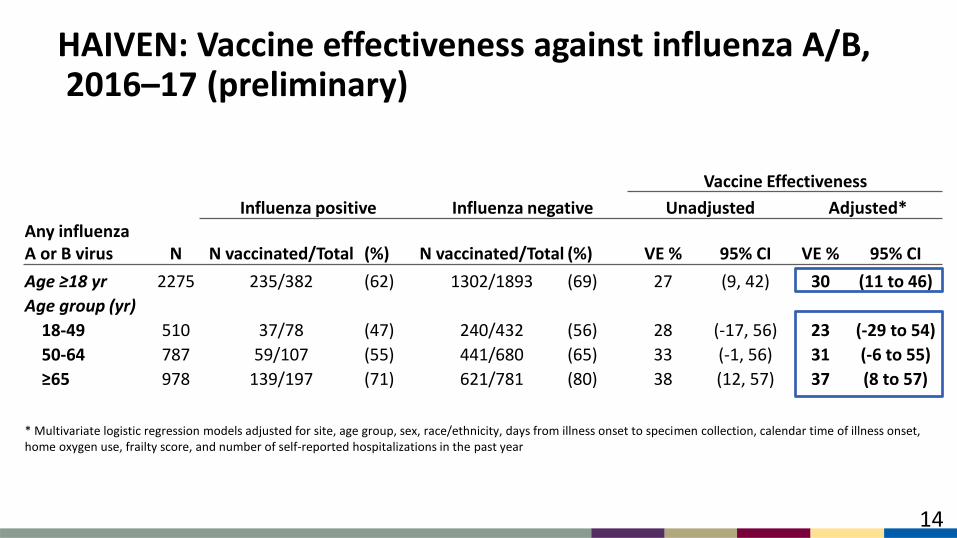
HAIVEN: Vaccine effectiveness against influenza A/B,2016–17 (preliminary)
Vaccine Effectiveness
Influenza positive Influenza negative Unadjusted Adjusted*Any influenza A or B virus N N vaccinated/Total (%) N vaccinated/Total (%) VE % 95% CI VE % 95% CI
Age ≥18 yr 2275 235/382 (62) 1302/1893 (69) 27 (9, 42) 30 (11 to 46)
Age group (yr)
18-49 510 37/78 (47) 240/432 (56) 28 (-17, 56) 23 (-29 to 54)
50-64 787 59/107 (55) 441/680 (65) 33 (-1, 56) 31 (-6 to 55)
≥65 978 139/197 (71) 621/781 (80) 38 (12, 57) 37 (8 to 57)
* Multivariate logistic regression models adjusted for site, age group, sex, race/ethnicity, days from illness onset to specimen collection, calendar time of illness onset, home oxygen use, frailty score, and number of self-reported hospitalizations in the past year
14
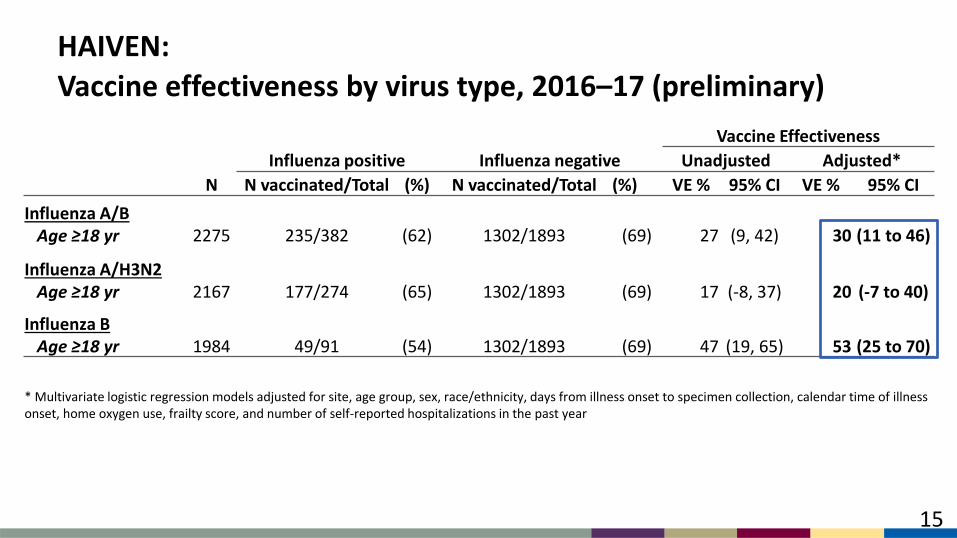
HAIVEN:Vaccine effectiveness by virus type, 2016–17 (preliminary)
Vaccine Effectiveness
Influenza positive Influenza negative Unadjusted Adjusted*
N N vaccinated/Total (%) N vaccinated/Total (%) VE % 95% CI VE % 95% CI
Influenza A/BAge ≥18 yr 2275 235/382 (62) 1302/1893 (69) 27 (9, 42) 30 (11 to 46)
Influenza A/H3N2Age ≥18 yr 2167 177/274 (65) 1302/1893 (69) 17 (-8, 37) 20 (-7 to 40)
Influenza BAge ≥18 yr 1984 49/91 (54) 1302/1893 (69) 47 (19, 65) 53 (25 to 70)
* Multivariate logistic regression models adjusted for site, age group, sex, race/ethnicity, days from illness onset to specimen collection, calendar time of illness onset, home oxygen use, frailty score, and number of self-reported hospitalizations in the past year
15
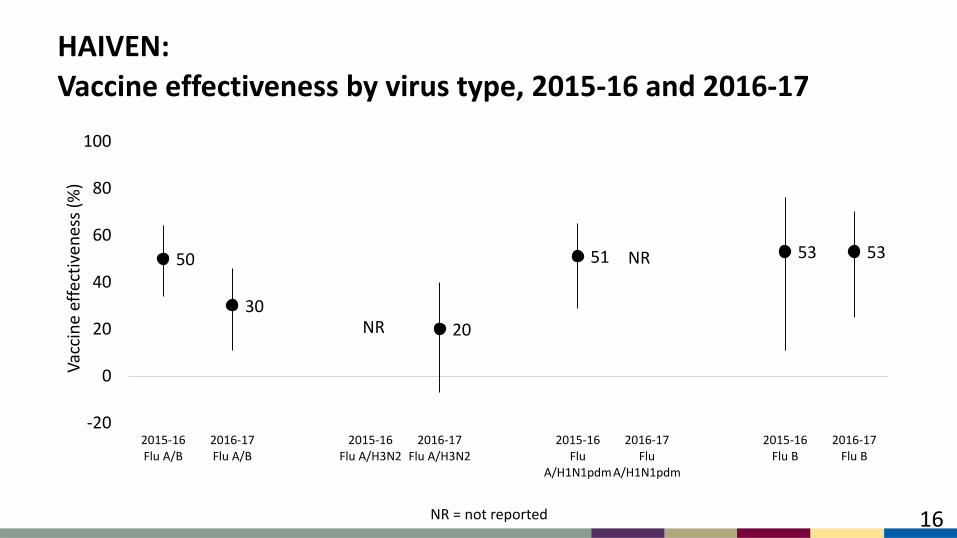
HAIVEN:Vaccine effectiveness by virus type, 2015-16 and 2016-17
50
30
20
51 53 53
-20
0
20
40
60
80
100
2015-16Flu A/B
2016-17Flu A/B
2015-16Flu A/H3N2
2016-17Flu A/H3N2
2015-16Flu
A/H1N1pdm
2016-17Flu
A/H1N1pdm
2015-16Flu B
2016-17Flu B
Vac
cin
e ef
fect
iven
ess
(%)
NR
NR
NR = not reported 16
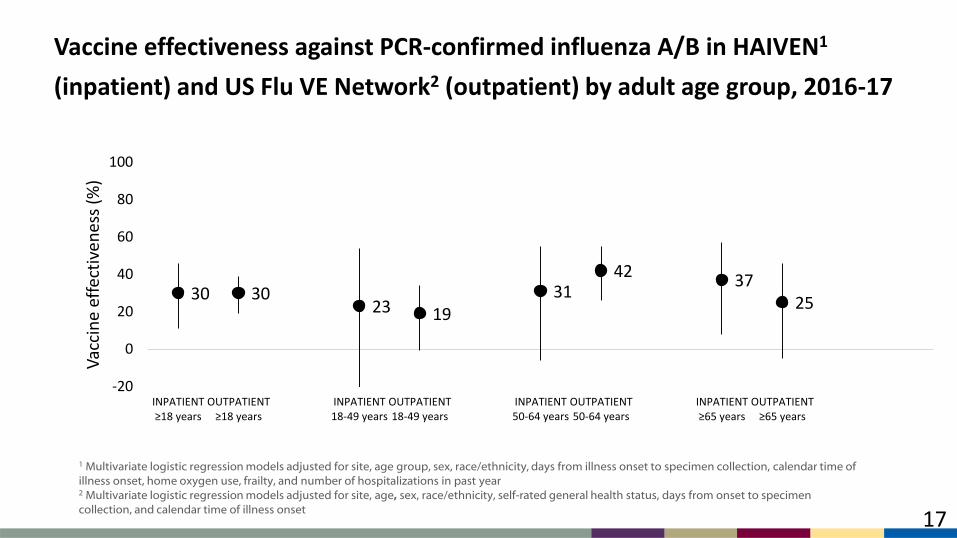
Vaccine effectiveness against PCR-confirmed influenza A/B in HAIVEN1
(inpatient) and US Flu VE Network2 (outpatient) by adult age group, 2016-17
1 Multivariate logistic regression models adjusted for site, age group, sex, race/ethnicity, days from illness onset to specimen collection, calendar time of illness onset, home oxygen use, frailty, and number of hospitalizations in past year2 Multivariate logistic regression models adjusted for site, age, sex, race/ethnicity, self-rated general health status, days from onset to specimen collection, and calendar time of illness onset
30 3023 19
3142
3725
-20
0
20
40
60
80
100
INPATIENT≥18 years
OUTPATIENT≥18 years
INPATIENT18-49 years
OUTPATIENT18-49 years
INPATIENT50-64 years
OUTPATIENT50-64 years
INPATIENT≥65 years
OUTPATIENT≥65 years
Vac
cin
e ef
fect
iven
ess
(%)
17
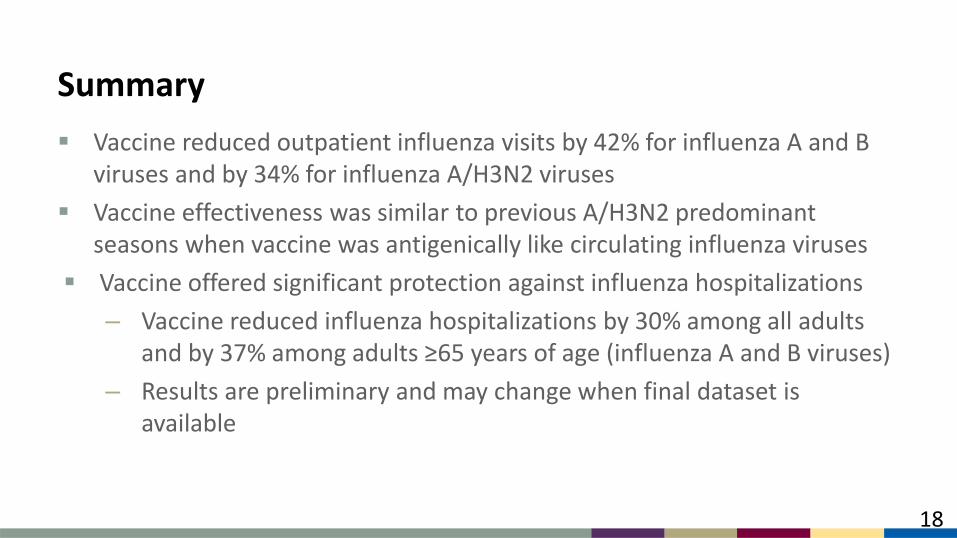
Summary
Vaccine reduced outpatient influenza visits by 42% for influenza A and B viruses and by 34% for influenza A/H3N2 viruses
Vaccine effectiveness was similar to previous A/H3N2 predominant seasons when vaccine was antigenically like circulating influenza viruses
Vaccine offered significant protection against influenza hospitalizations
–
–
Vaccine reduced influenza hospitalizations by 30% among all adults and by 37% among adults ≥65 years of age (influenza A and B viruses)
Results are preliminary and may change when final dataset is available
18
For more information, contact CDC1-800-CDC-INFO (232-4636)TTY: 1-888-232-6348 www.cdc.gov
The findings and conclusions in this report are those of the authors and do not necessarily represent the official position of the Centers for Disease Control and Prevention.
19