u.s. experiential traveler trends 2018 · u.s. experiential traveler trends 2018: skift...
TRANSCRIPT

U.S. EXPERIENTIAL TRAVELER TRENDS 2018: SKIFT RESEARCH’S ANNUAL SURVEY & DATA ANALYSIS ON TRAVELER BEHAVIOR, MOTIVATIONS & PREFERENCES
Report Overview
In its second year, Skift’s 2018 Experiential Traveler Survey aims to understand the mindset of modern travelers by diving into their behaviors, motivations, and preferences. With a particular emphasis on those who prioritize experiences in their travels above all else, the results of the survey offer an examination of the often-discussed, but rarely understood, experiential traveler. This report presents the results of the survey, along with brief analysis and trends we’ve observed. The survey was fielded via a trusted third-party consumer panel provider. Respondents were screened based on their travel history. Those who indicated that they had taken at least one leisure trip, one round-trip flight for non-business purposes, and stayed at a hotel for at least one night in the last 12 months qualified to complete the survey. A total of 1,208 respondents met this criteria and completed the entire survey (“Avid Travelers”). An additional 1,133 respondents completed only the screener but did not meet the above qualifications (“Non-Avid Travelers”). These groups are compared in the first section of the survey, and the aggregate of the groups is provided to reflect the general population (“U.S. Population”). Age quotas were also set to reflect the U.S. population.
2
The Experiential Traveler Today
In recent years, the travel industry has been abuzz with conversation surrounding the rise of “experiential travel.” How can travel brands take advantage of this trend? Who are experiential travelers? What exactly does this term even mean? At Skift, we have written about and researched how this trend has impacted different sectors and how brands have responded in varying ways. What has become clear from the stories and data we have compiled, including the results of this survey, is that while travelers are looking more and more for valuable travel experiences, this means different things to different people at different times. The definition of experiential travel is a personal one, defined by each traveler in accordance with their values and passions. To better encompass the personal nature of experiential travel, Skift has begun to refer to its evolution as “transformative travel,” where meaningful experiences help guide and empower travelers toward a new sense of self. While few travelers today are likely to identify as transformative or even experiential travelers on their own, this survey helps us understand the personal nature of travel that underscores both and how it continues to evolve.
3

Overview of Respondents: Avid Travelers, Non-Avid Travelers, and U.S. Population
4

5
Based on the survey’s screener questions, we are able to compare Avid Travelers and Non-Avid Travelers in terms of demographics and trip incidence. In this section, we present the comparison of these groups, along with the aggregate of them, which is representative of the general U.S. population.
Demographic Characteristics: Avid Travelers, Non-Avid Travelers, and U.S. Population
Source: Skift’s 2017 U.S. Experiential Traveler Survey 5

Survey question: What is your approximate age?
Age quotas were set to reflect the current U.S. population.
Demographic Characteristics: Avid Travelers, Non-Avid Travelers, and U.S. Population
6
11%
19%
19%
17%
18%
17%
16%
16%
15%
19%
18%
16%
13%
18%
17%
18%
18%
16%
18-24
25-34
35-44
45-54
55-64
65+
AvidTravelersNon-AvidTravelersU.S.PopulaAon
Source: Skift’s 2017 U.S. Experiential Traveler Survey 6

7 Source: Skift’s 2017 U.S. Experiential Traveler Survey 7
Survey question: What best describes your current work situation?
Demographic Characteristics: Avid Travelers, Non-Avid Travelers, and U.S. Population
Avid Travelers are more likely to be employed professionals or business owners compared to Non-Avid Travelers.
62%
7%
22%
10%
48%
4%
24%
24%
55%
5%
23%
17%
EmployedProfessional
BusinessOwner
ReAred
Unemployed
AvidTravelersNon-AvidTravelersU.S.PopulaAon

8 Source: Skift’s 2017 U.S. Experiential Traveler Survey 8
Survey question: What is your annual household income?
Demographic Characteristics: Avid Travelers, Non-Avid Travelers, and U.S. Population
The incomes of Avid Travelers tend to be higher than Non-Avid Travelers, indicating that travel incidence increases as income increases.
19%
22%
19%
12%
10%
5%
4%
8%
51%
21%
13%
7%
4%
2%
1%
2%
35%
22%
16%
10%
7%
3%
3%
5%
Under$50,000
$50,000-$74,999
$75,000-$99,999
$100,000-$124,999
$125,000-$149,999
$150,000-$174,999
$175,000-$199,999
$200,000andabove
AvidTravelersNon-AvidTravelersU.S.PopulaAon

9 Source: Skift’s 2017 U.S. Experiential Traveler Survey 9
Survey question: How many children under the age of 18 currently live in your household?
Demographic Characteristics: Avid Travelers, Non-Avid Travelers, and U.S. Population
Avid Travelers are slightly more likely than Non-Avid Travelers to have children under 18 in their household.
66%
14%
15%
3%
1%
0%
0%
72%
14%
10%
3%
1%
0%
0%
69%
14%
12%
3%
1%
0%
0%
Nonecurrentlyathome
1
2
3
4
5
Morethan5
AvidTravelersNon-AvidTravelersU.S.PopulaAon

While all respondents who qualified to complete the survey (Avid Travelers) took at least one leisure trip, one round-trip flight, and stayed at least one night in a hotel in the past 12 months, respondents in the Non-Avid Traveler group did not meet at least one of these criteria. In this section, we compare the incidence of these activities for each group, alongside the U.S. Population. In order to further emphasize experiential travel and to gain a better understanding of what it means, we asked all respondents about their use of alternative accommodation services including Airbnb, HomeAway/VRBO, and Booking.com for vacation rentals. The data collected show similar patterns for each platform. One factor that may impact the incidence of travel is one’s role in making travel decisions. For this reason, we end this section by comparing whether the respondents in each group are more likely to be the primary trip decision maker or not.
Travel Incidence
Source: Skift’s 2017 U.S. Experiential Traveler Survey 10
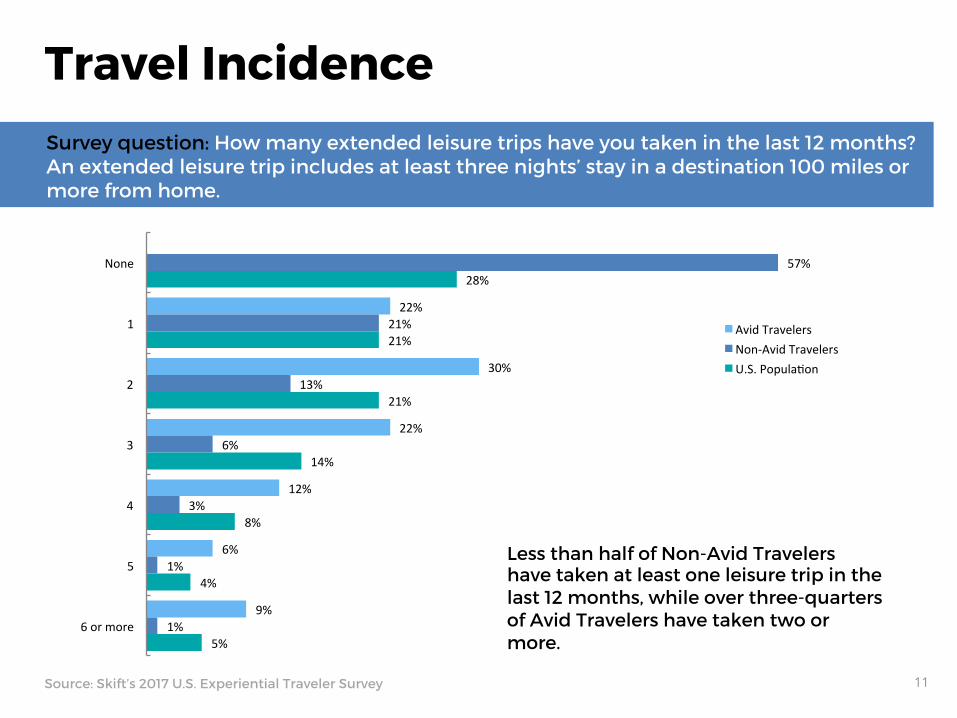
Travel Incidence Survey question: How many extended leisure trips have you taken in the last 12 months? An extended leisure trip includes at least three nights’ stay in a destination 100 miles or more from home.
11 Source: Skift’s 2017 U.S. Experiential Traveler Survey
Less than half of Non-Avid Travelers have taken at least one leisure trip in the last 12 months, while over three-quarters of Avid Travelers have taken two or more.
22%
30%
22%
12%
6%
9%
57%
21%
13%
6%
3%
1%
1%
28%
21%
21%
14%
8%
4%
5%
None
1
2
3
4
5
6ormore
AvidTravelersNon-AvidTravelersU.S.PopulaAon

58%
21%
10%
5%
2%
1%
2%
28%
24%
19%
12%
7%
4%
6%
None
1
2
3
4
5
6ormore
AvidTravelersNon-AvidTravelersU.S.PopulaAon
12 Source: Skift’s 2017 U.S. Experiential Traveler Survey
Just under half of the U.S. Population included a hotel stay during two or more leisure trips in the past 12 months, compared to three-quarters of Avid Travelers.
Travel Incidence Survey question: How many leisure trips have you taken in the last 12 months that included at least one night’s stay in a hotel?

13 Source: Skift’s 2017 U.S. Experiential Traveler Survey
Only 11% of Non-Avid Travelers have taken at least one round-trip flight for leisure trips in the last 12 months, making this the largest differentiator between this group and Avid Travelers.
Travel Incidence Survey question: How many round-trip flights have you taken for leisure trips (non-business) in the last 12 months?
36%
26%
15%
10%
5%
9%
89%
7%
3%
1%
0%
0%
0%
43%
22%
15%
8%
5%
3%
4%
None
1
2
3
4
5
6ormore
AvidTravelersNon-AvidTravelersU.S.PopulaAon

Survey question: Have you ever used Airbnb to book an apartment or home rental as part of a leisure trip?
Travel Incidence: Apartment & Home Rentals
While similar majorities of Avid and Non-Avid Traveler groups have never used Airbnb, Avid Travelers are over three times more likely to have used the service than Non-Avid Travelers.
18%
15%
63%
4%
5%
2%
76%
16%
12%
9%
69%
10%
Yes,once.
Yes,mulApleAmes.
No,never.
What'sAirbnb?
AvidTravelersNon-AvidTravelersU.S.PopulaAon
14 Source: Skift’s 2017 U.S. Experiential Traveler Survey
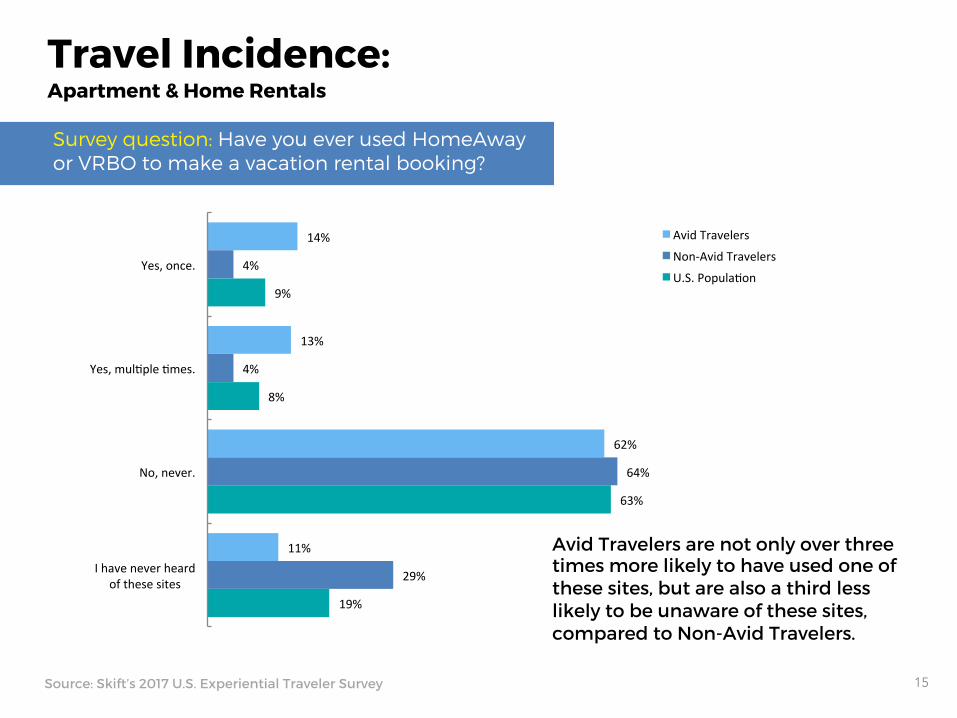
Survey question: Have you ever used HomeAway or VRBO to make a vacation rental booking?
Travel Incidence: Apartment & Home Rentals
Avid Travelers are not only over three times more likely to have used one of these sites, but are also a third less likely to be unaware of these sites, compared to Non-Avid Travelers.
15 Source: Skift’s 2017 U.S. Experiential Traveler Survey
14%
13%
62%
11%
4%
4%
64%
29%
9%
8%
63%
19%
Yes,once.
Yes,mulApleAmes.
No,never.
Ihaveneverheardofthesesites
AvidTravelers
Non-AvidTravelers
U.S.PopulaAon

Survey question: Have you ever booked a vacation rental on Booking.com?
Travel Incidence: Apartment & Home Rentals
16 Source: Skift’s 2017 U.S. Experiential Traveler Survey
20%
16%
61%
3%
9%
4%
77%
10%
15%
10%
69%
6%
Yes,once.
Yes,mulApleAmes.
No,never.
IhaveneverheardofBooking.com
AvidTravelers
Non-AvidTravelers
U.S.PopulaAon
The majority of Avid Traveler and Non-Avid Traveler groups have never used Booking.com to book a vacation rental. Avid Travelers, though, are nearly three times as likely to have used the site for this purpose.

Survey question: Thinking about your household, are you typically the primary decision maker when it comes to planning and booking vacations and trips?
Travel Incidence: Decision-Making Role
17 Source: Skift’s 2017 U.S. Experiential Traveler Survey
Most respondents from both groups identify themselves as the primary vacation decision maker, but this number is 20% higher for Avid Travelers compared to Non-Avid Travelers.
69%
6%
25%
49%
16%
35%
59%
11%
30%
Yes,Iamtheprimarydecisionmaker.
No,IamNOTtheprimarydecisionmaker
Isharethisresponsibilitywithanotherperson.
AvidTravelersNon-AvidTravelersU.S.PopulaAon

Overview of Respondents: Avid Travelers Only
18

Once Avid Travelers were identified by the travel incidence questions in the survey’s screener, further data was collected to illustrate this group’s past travel behavior, including the past frequency of international travel, as well as the occurrence of last-minute travel.
Travel Incidence
Source: Skift’s 2017 U.S. Experiential Traveler Survey 19

47%
30%
14%
4%
2%
2%
None
1
2
3
4
5 or more
Travel Incidence Survey question: How many international leisure trips (outside the U.S.) have you taken in the last 12 months?
20 Source: Skift’s 2017 U.S. Experiential Traveler Survey
Just over half of Avid Travelers have taken an international trip in the last 12 months.

38%
62%
Yes, I have taken a last-minute vacation.
No, I have NOT taken a last-minute vacation.
Travel Incidence Survey question: Have you taken a last-minute vacation in the past 12 months (e.g. a vacation planned within 48 hours of departure)?
21 Source: Skift’s 2017 U.S. Experiential Traveler Survey
Over one-third of Avid Travelers are open to taking a last-minute vacation.

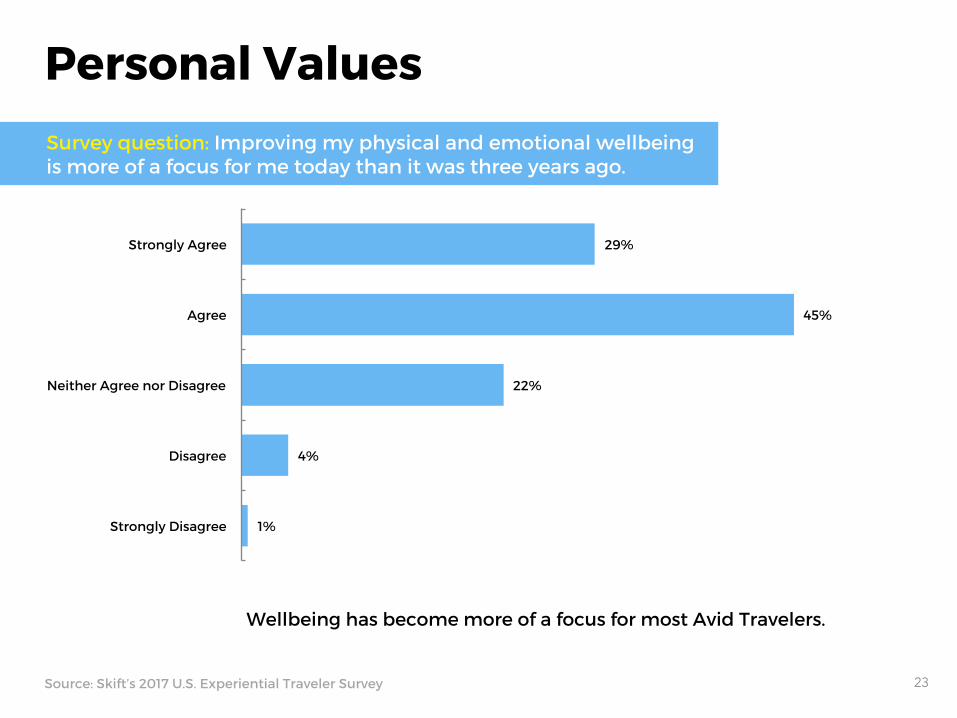
In the survey, we asked respondents questions about their personal values and attitudes that aren’t directly related to travel to understand how these things may influence their travel priorities and decisions. Specifically, we asked about the personal importance of wellness and learning new things. The results of these questions indicate a particularly strong focus on self-improvement among this group, which is indicative of a preference for certain types of travel experiences, especially those that would be considered transformative.
Personal Values
Source: Skift’s 2017 U.S. Experiential Traveler Survey 22
29%
45%
22%
4%
1%
Strongly Agree
Agree
Neither Agree nor Disagree
Disagree
Strongly Disagree
Personal Values Survey question: Improving my physical and emotional wellbeing is more of a focus for me today than it was three years ago.
23 Source: Skift’s 2017 U.S. Experiential Traveler Survey
Wellbeing has become more of a focus for most Avid Travelers.
27%
57%
15%
1%
0%
Strongly Agree
Agree
Neither Agree nor Disagree
Disagree
Strongly Disagree
24 Source: Skift’s 2017 U.S. Experiential Traveler Survey
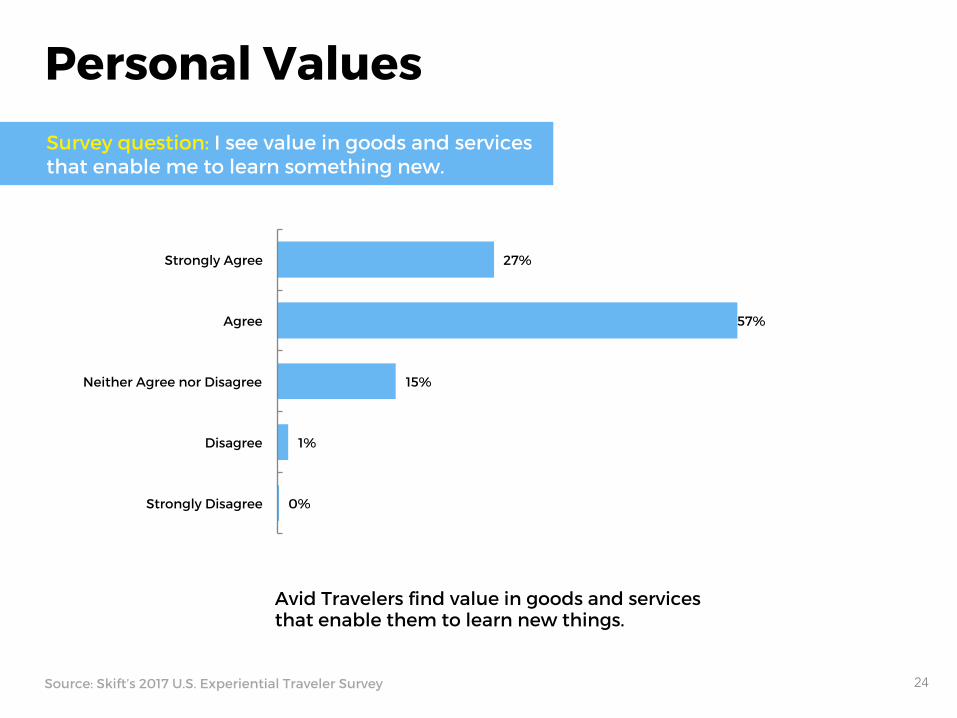
Personal Values Survey question: I see value in goods and services that enable me to learn something new.
Avid Travelers find value in goods and services that enable them to learn new things.

Travel Motivations & Planning
25

In an effort to understand what motivates Avid Travelers to travel and what they look for in an ideal trip, we asked them to select from a list of possible responses for each. The data reveal a mix of responses that connote experiential travel as well as more low-key vacationing. For Avid Travelers, it doesn’t seem that these types of travel conflict. They may want both at different times, even during the same vacation. When forced to make an “either-or” selection, however, we see that experience takes clear priority. After covering what motivates one to travel, we end this section by covering what holds Avid Travelers back from traveling the most, if anything: time or money.
Travel Motivations
Source: Skift’s 2017 U.S. Experiential Traveler Survey 26

67%
51%
38%
18%
9%
8%
5%
4%
Relaxation
Getting away from home
Experiencing different cultures
Enhancing relationships
Self-discovery
Meeting new people
Other (please specify)
Wellness
Travel Motivations Survey question: Which of the following are your top motivators for travel? Please select your TOP TWO motivators
27 Source: Skift’s 2017 U.S. Experiential Traveler Survey
Transformation and stepping outside of a daily routine are key motivators for travel.
63%
55%
47%
47%
39%
38%
37%
27%
23%
18%
3%
Relaxing
Exciting
Adventurous
Safe
Stimulating
Energizing
Restful
Calming
Thrilling
Tranquil
Other (please specify)
28 Source: Skift’s 2017 U.S. Experiential Traveler Survey
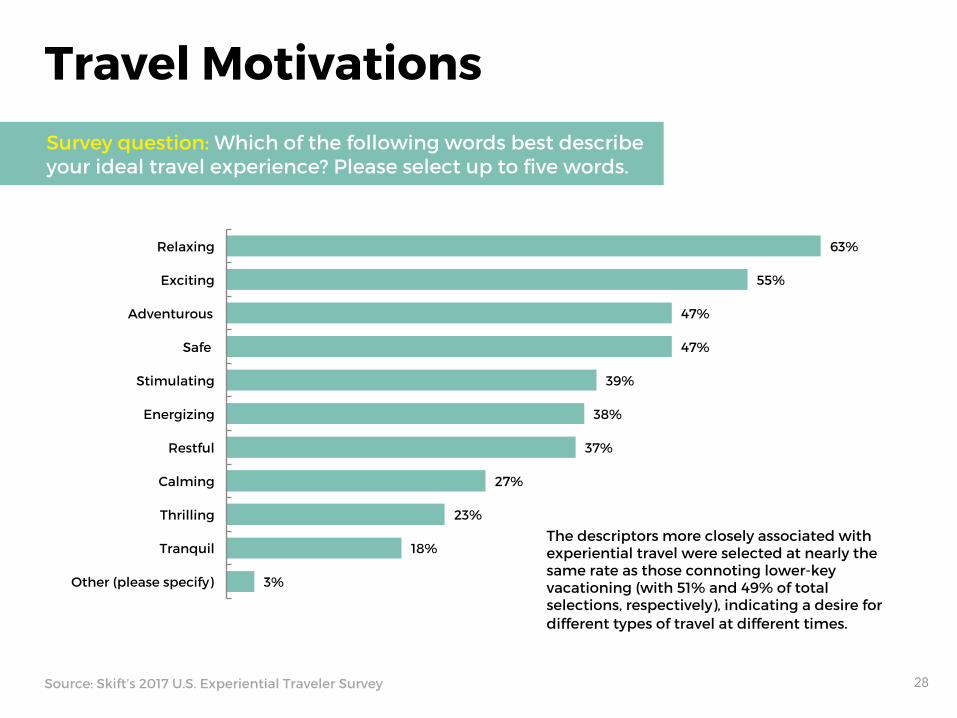
Travel Motivations Survey question: Which of the following words best describe your ideal travel experience? Please select up to five words.
The descriptors more closely associated with experiential travel were selected at nearly the same rate as those connoting lower-key vacationing (with 51% and 49% of total selections, respectively), indicating a desire for different types of travel at different times.
65%
35%
I want to come back having experienced something new.
I want to come back feeling rested and recharged.
29 Source: Skift’s 2017 U.S. Experiential Traveler Survey
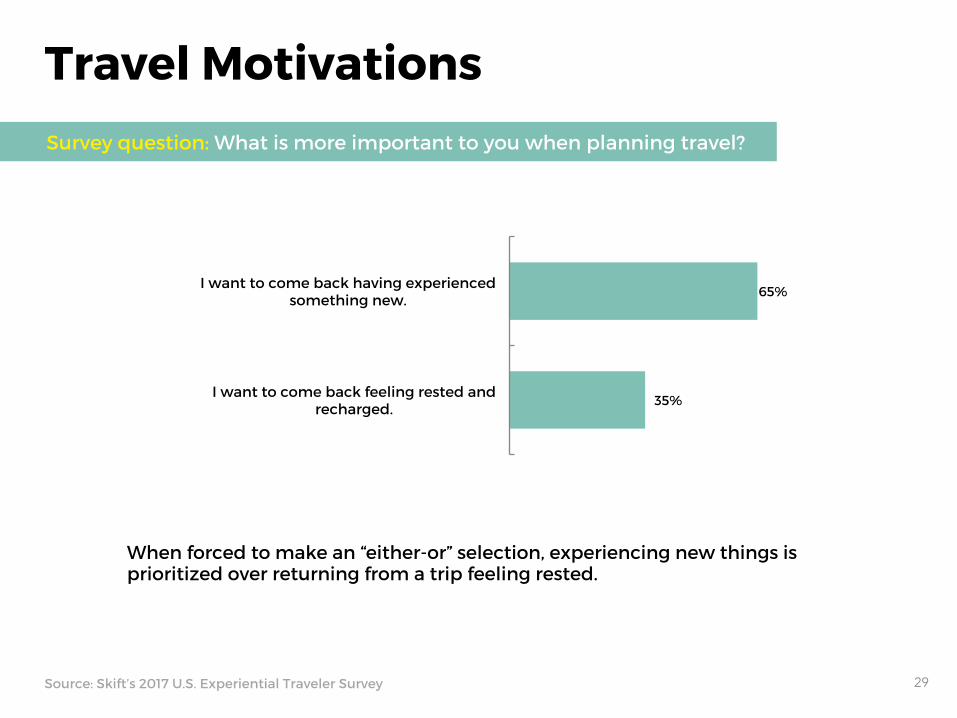
Travel Motivations Survey question: What is more important to you when planning travel?
When forced to make an “either-or” selection, experiencing new things is prioritized over returning from a trip feeling rested.

48%
30%
22%
Not enough money.
Not enough time.
Neither. I can travel whenever I want.
30 Source: Skift’s 2017 U.S. Experiential Traveler Survey
Travel Motivations Survey question: Which factor holds you back the most from traveling more?
Money is a more common barrier to traveling, but despite the realities of today’s economy, 22% of travelers feel they are unhindered financially and timewise.

In this section, we cover aspects of trip planning, from preferred information sources to personal attitudes that might affect how one plans a trip. Given that a majority (69%) of Avid Travelers report being the primary travel decision maker as discussed previously, it is likely that they are highly involved in this process, making their insight all the more valuable. The data in this section show the important role travel review sites like TripAdvisor play in the planning process. We also see opinions split over whether spending more money typically results in a more worthwhile trip.
Trip Planning
Source: Skift’s 2017 U.S. Experiential Traveler Survey 31

31%
40%
20%
7%
2%
Strongly Agree
Agree
Neither Agree nor Disagree
Disagree
Strongly Disagree
32 Source: Skift’s 2017 U.S. Experiential Traveler Survey
Trip Planning Survey question: I enjoy the trip planning process. This includes things like researching and booking accommodations, flights, and activities.
Most Avid Travelers enjoy the trip planning process, which makes sense given that a similar proportion take on the role of primary travel decision maker.
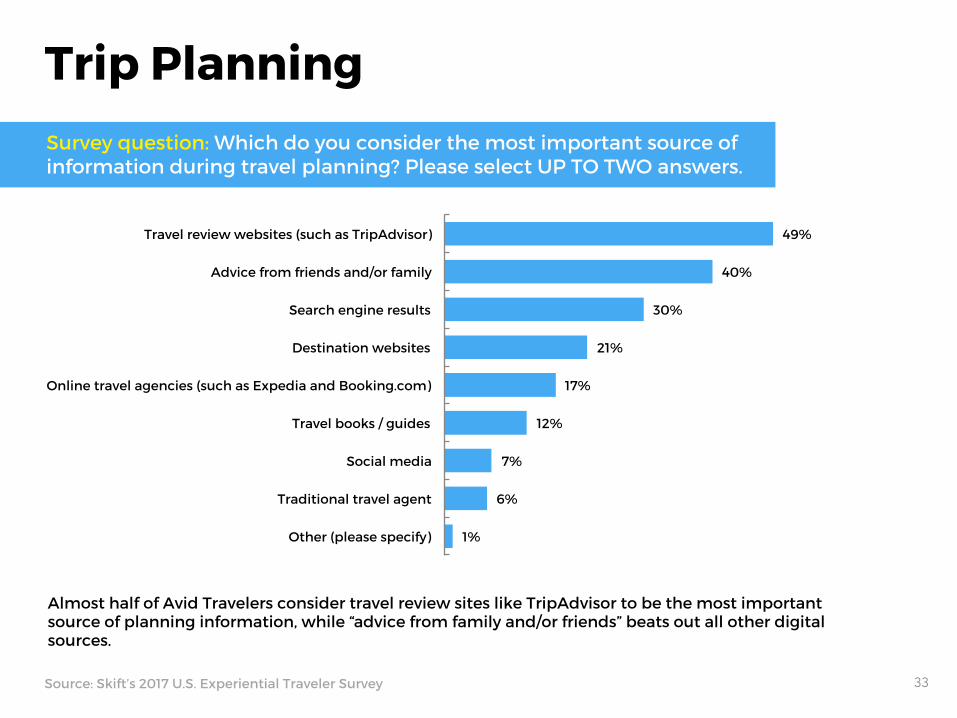
49%
40%
30%
21%
17%
12%
7%
6%
1%
Travel review websites (such as TripAdvisor)
Advice from friends and/or family
Search engine results
Destination websites
Online travel agencies (such as Expedia and Booking.com)
Travel books / guides
Social media
Traditional travel agent
Other (please specify)
33 Source: Skift’s 2017 U.S. Experiential Traveler Survey
Trip Planning Survey question: Which do you consider the most important source of information during travel planning? Please select UP TO TWO answers.
Almost half of Avid Travelers consider travel review sites like TripAdvisor to be the most important source of planning information, while “advice from family and/or friends” beats out all other digital sources.

69%
17%
14%
Reviews from fellow travelers on sites like TripAdvisor
Institutional reviews, such as AAA Diamond Rewards and Forbes Star Ratings
Neither
34 Source: Skift’s 2017 U.S. Experiential Traveler Survey
Trip Planning Survey question: Which source of reviews do you find the most trustworthy?
Avid Travelers see reviews from other travelers as more trustworthy than those that come from institutions.

29%
42%
23%
5%
1%
Strongly Agree
Agree
Neither Agree nor Disagree
Disagree
Strongly Disagree
35 Source: Skift’s 2017 U.S. Experiential Traveler Survey
Trip Planning Survey question: I love to talk about my upcoming leisure travel arrangements with my friends.
Almost three-quarters of Avid Travelers love to discuss their travel plans with their friends. As we saw previously, friends area valuable source of travel information.
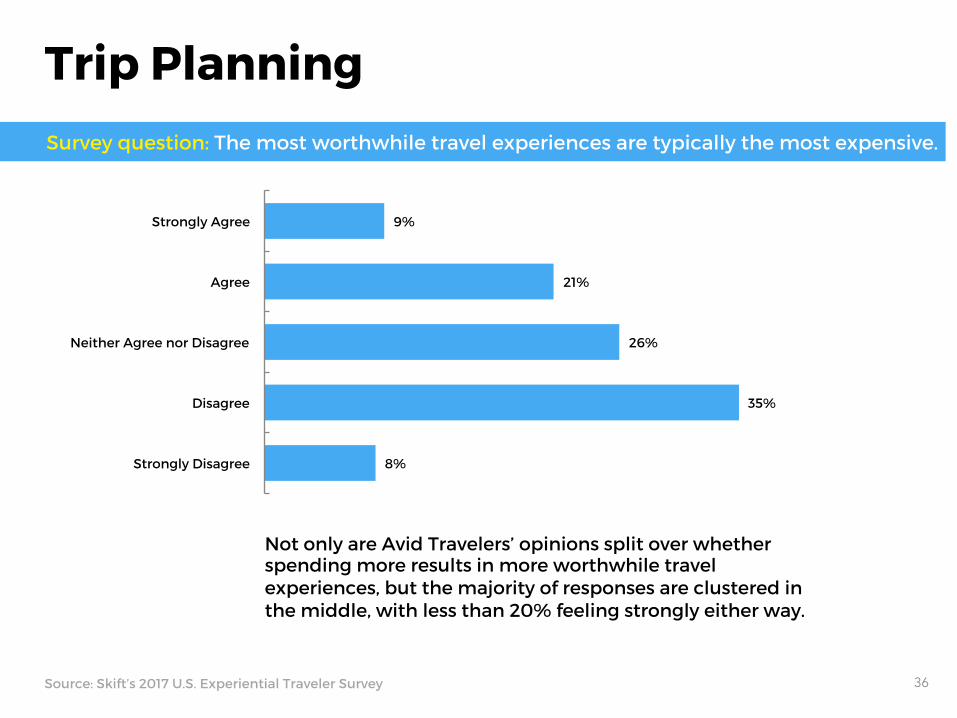
9%
21%
26%
35%
8%
Strongly Agree
Agree
Neither Agree nor Disagree
Disagree
Strongly Disagree
Trip Planning Survey question: The most worthwhile travel experiences are typically the most expensive.
36 Source: Skift’s 2017 U.S. Experiential Traveler Survey
Not only are Avid Travelers’ opinions split over whether spending more results in more worthwhile travel experiences, but the majority of responses are clustered in the middle, with less than 20% feeling strongly either way.

This section focuses on Avid Travelers’ preferences relating to their future travel destinations. The types of destinations this group prefers can help us understand the types of experiences they desire and where they can be found.
Destination Preferences
Source: Skift’s 2017 U.S. Experiential Traveler Survey 37

60%
40%
A new destination
A destination I have already visited
40% of Avid Travelers are more likely to return to a destination than go to a new one for their next trip, indicating that they can still find the experiences they desire somewhere they have already visited.
Destination Preferences Survey question: For your next trip, are you more likely to travel to a new destination, or a destination you’ve already visited?
38 Source: Skift’s 2017 U.S. Experiential Traveler Survey
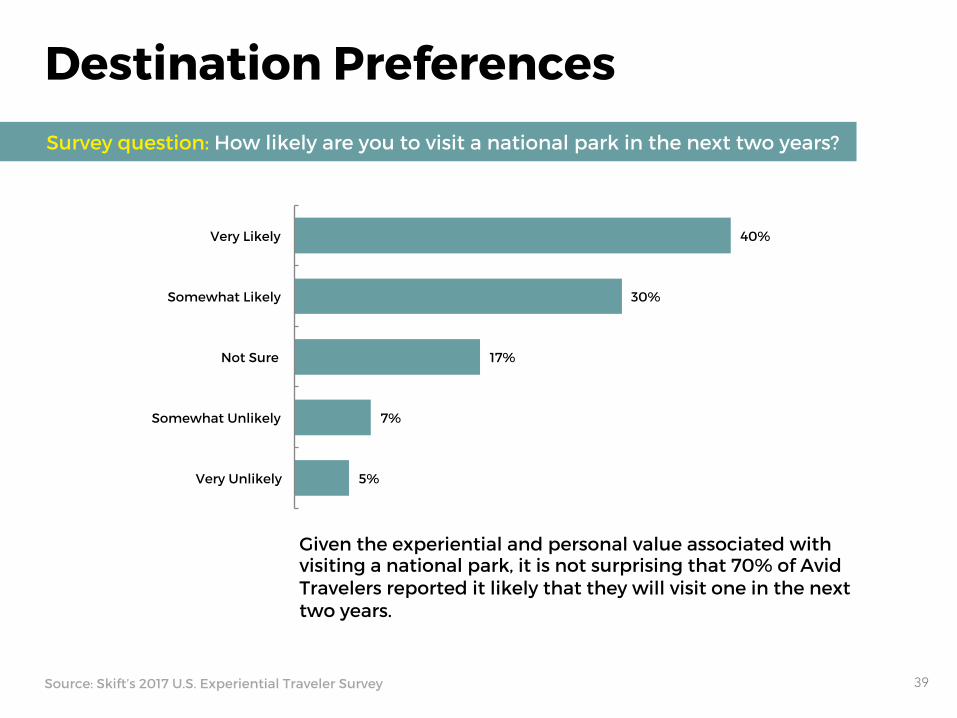
40%
30%
17%
7%
5%
Very Likely
Somewhat Likely
Not Sure
Somewhat Unlikely
Very Unlikely
Destination Preferences Survey question: How likely are you to visit a national park in the next two years?
39 Source: Skift’s 2017 U.S. Experiential Traveler Survey
Given the experiential and personal value associated with visiting a national park, it is not surprising that 70% of Avid Travelers reported it likely that they will visit one in the next two years.
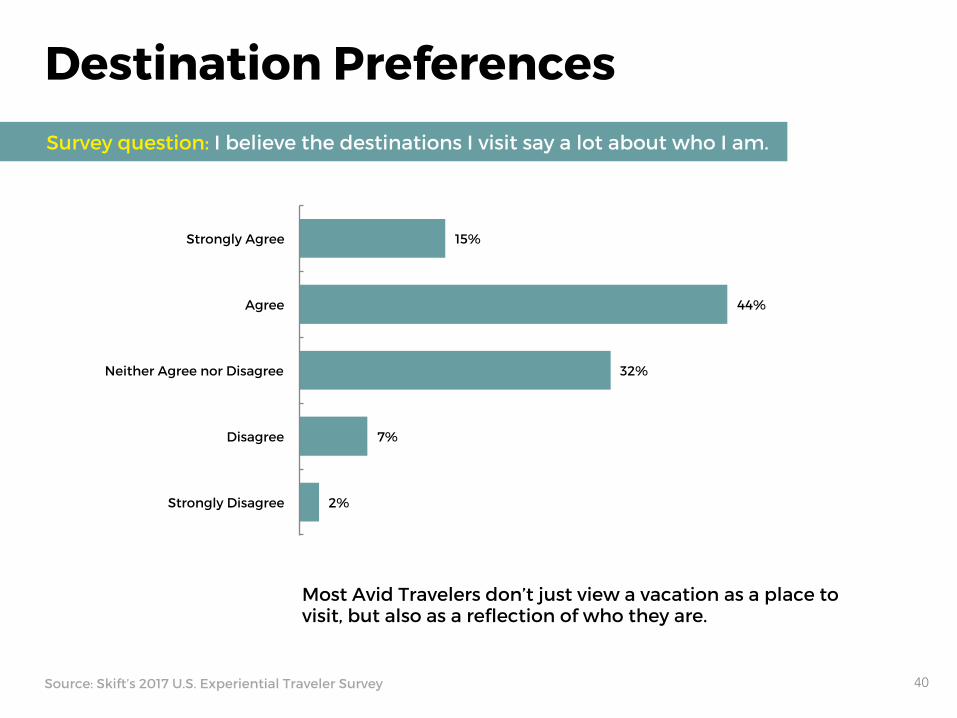
15%
44%
32%
7%
2%
Strongly Agree
Agree
Neither Agree nor Disagree
Disagree
Strongly Disagree
Destination Preferences Survey question: I believe the destinations I visit say a lot about who I am.
40 Source: Skift’s 2017 U.S. Experiential Traveler Survey
Most Avid Travelers don’t just view a vacation as a place to visit, but also as a reflection of who they are.

The next series of data relates to the attitudes and behaviors of Avid Travelers in-destination. Beginning with some basic preferences, we then move on to questions meant to understand how much of a local experience Avid Travelers are after. While previous data have illustrated the importance of experiences overall, when it comes to emphasizing the local, respondents were a bit more cautious with their agreement. The distribution of responses to these questions further indicates that it is still possible to achieve the new experiences they prioritize, without having to go too far outside of the tourist comfort zone. Another behavior where attitudes are split concerns the sharing of vacation photos on social media. The results collected show that this behavior cannot be generalized for all modern travelers.
In-Destination Attitudes
Source: Skift’s 2017 U.S. Experiential Traveler Survey 41
16%
84%
Alone
With other people
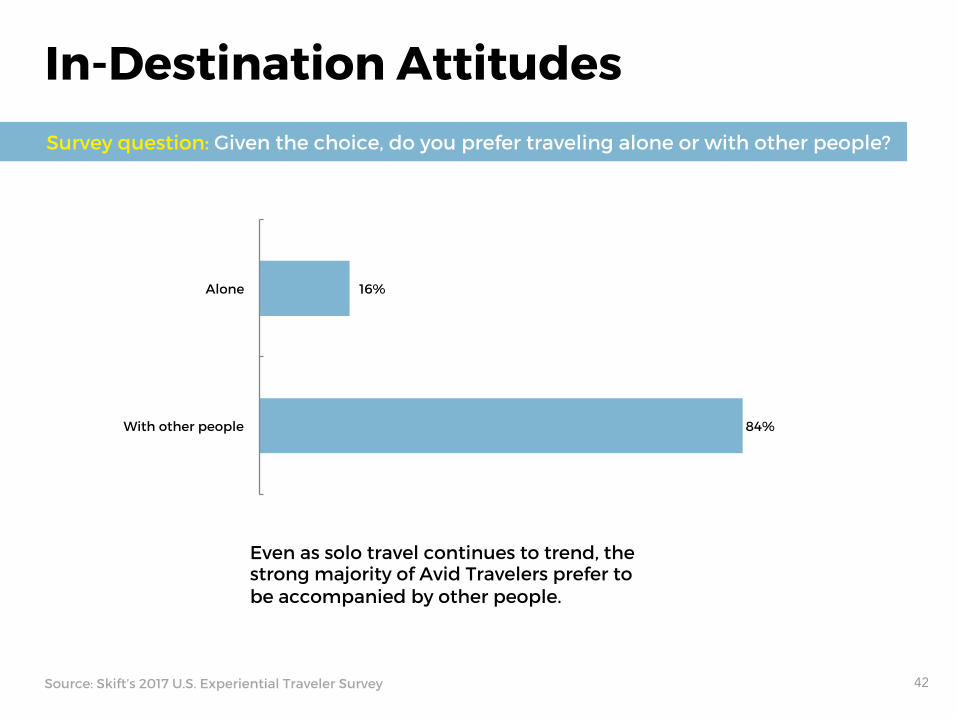
Even as solo travel continues to trend, the strong majority of Avid Travelers prefer to be accompanied by other people.
In-Destination Attitudes Survey question: Given the choice, do you prefer traveling alone or with other people?
42 Source: Skift’s 2017 U.S. Experiential Traveler Survey
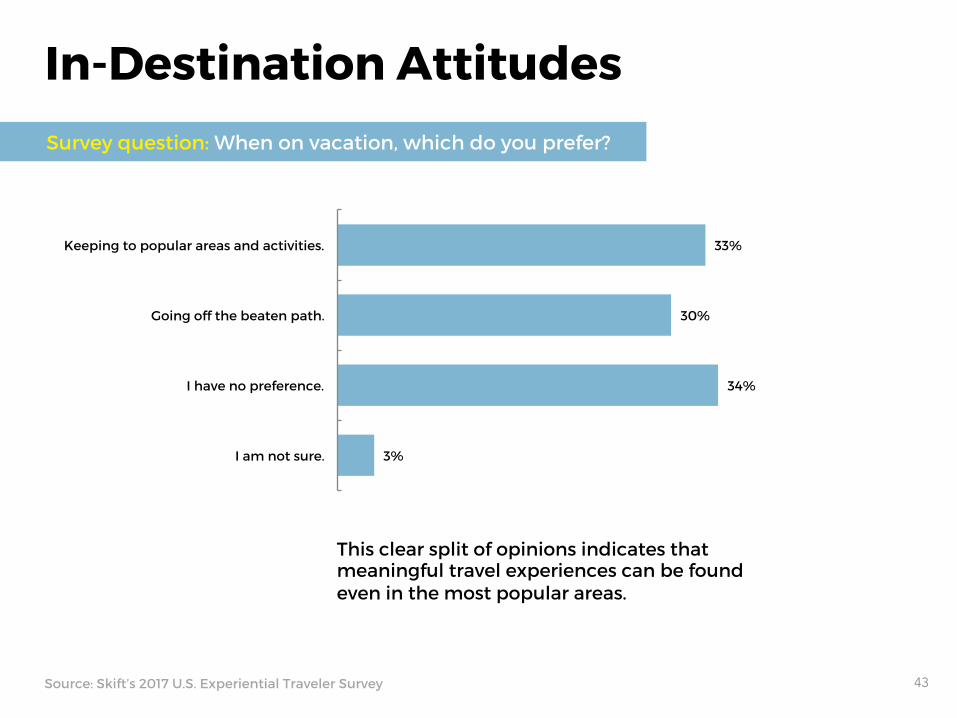
33%
30%
34%
3%
Keeping to popular areas and activities.
Going off the beaten path.
I have no preference.
I am not sure.
This clear split of opinions indicates that meaningful travel experiences can be found even in the most popular areas.
In-Destination Attitudes Survey question: When on vacation, which do you prefer?
43 Source: Skift’s 2017 U.S. Experiential Traveler Survey

16%
47%
29%
7%
1%
Strongly Agree
Agree
Neither Agree nor Disagree
Disagree
Strongly Disagree
World perspective-changing travel experiences are important to about six out of 10 Avid Travelers.
44 Source: Skift’s 2017 U.S. Experiential Traveler Survey
In-Destination Attitudes Survey question: I specifically look for travel experiences that give me a new perspective on the world.

14%
39%
35%
11%
1%
Strongly Agree
Agree
Neither Agree nor Disagree
Disagree
Strongly Disagree
45 Source: Skift’s 2017 U.S. Experiential Traveler Survey
In-Destination Attitudes Survey question: I don’t want to feel like a tourist while on vacation.
With the majority of responses clustering in the middle of the scale, this data indicate that Avid Travelers want new experiences, without stepping too far outside of the tourist bubble.
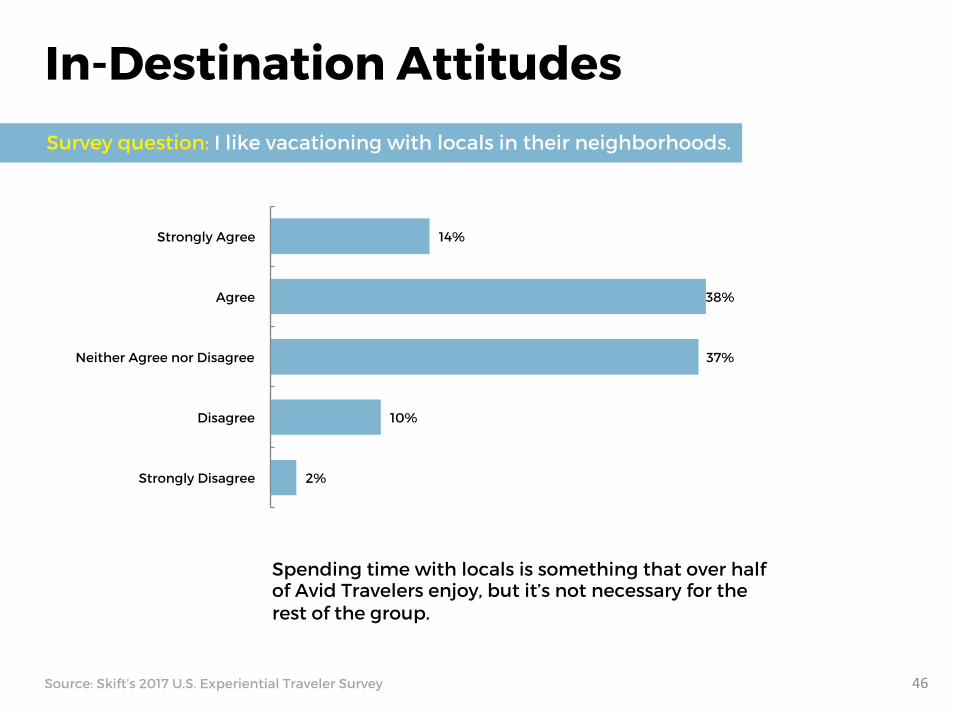
14%
38%
37%
10%
2%
Strongly Agree
Agree
Neither Agree nor Disagree
Disagree
Strongly Disagree
46Source: Skift’s 2017 U.S. Experiential Traveler Survey
In-Destination Attitudes Survey question: I like vacationing with locals in their neighborhoods.
Spending time with locals is something that over half of Avid Travelers enjoy, but it’s not necessary for the rest of the group.

20%
47%
27%
5%
1%
Strongly Agree
Agree
Neither Agree nor Disagree
Disagree
Strongly Disagree
In-Destination Attitudes Survey question: I hold a strong emotional connection to the places that I have visited on vacation.
Whether a vacation includes ultra-local, off-the-beaten path experiences or not, most respondents still feel that they hold a strong emotional connection with the destinations to which they travel.
47 Source: Skift’s 2017 U.S. Experiential Traveler Survey

16%
26%
21%
13%
23%
Strongly Agree
Slightly Agree
Neither Agree nor Disagree
Slightly Disagree
Strongly Disagree
48 Source: Skift’s 2017 U.S. Experiential Traveler Survey
In-Destination Attitudes: Social Media UseSurvey question: It is important for me to share photos of my travels on social media.
With responses distributed across the scale, it is clear that social media photo sharing is not a generalizable behavior for all modern travelers.

46%
32%
17%
3%
2%
1%
I don't share my vacation photos on social media.
Snapchat
Other (please specify)
49 Source: Skift’s 2017 U.S. Experiential Traveler Survey
In-Destination Attitudes: Social Media UseSurvey question: Which social media site do you prefer for sharing your vacation photos?
Instagram is often credited with changing the way people travel today, but only 17% of respondents reported using this platform to post vacation photos.
Travel Service Use & Preferences
50

Today, travelers have extensive options when it comes to choosing where to spend their money along the trip planning and booking process. With so many choices, spending preferences often reflect a traveler’s values.
Spending Preferences
Source: Skift’s 2017 U.S. Experiential Traveler Survey 51
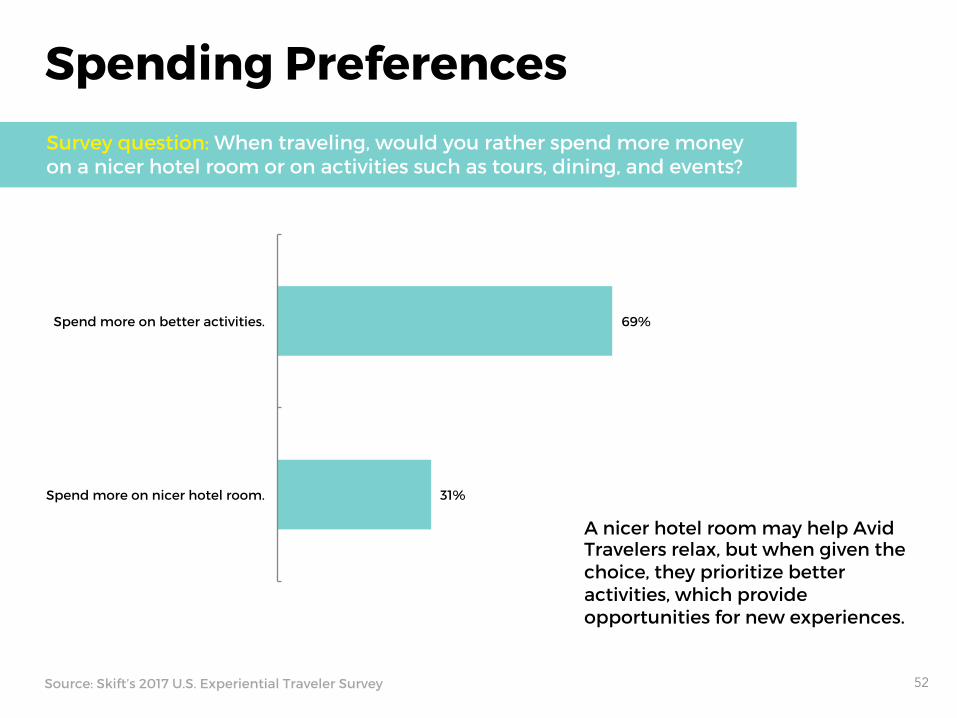
69%
31%
Spend more on better activities.
Spend more on nicer hotel room.
A nicer hotel room may help Avid Travelers relax, but when given the choice, they prioritize better activities, which provide opportunities for new experiences.
Spending Preferences Survey question: When traveling, would you rather spend more money on a nicer hotel room or on activities such as tours, dining, and events?
52 Source: Skift’s 2017 U.S. Experiential Traveler Survey

13%
27%
36%
18%
6%
Strongly Agree
Agree
Neither Agree nor Disagree
Disagree
Strongly Disagree While slightly more Avid Travelers are in agreement with this statement, most feel quite neutral about it, with less than 20% expressing a strong opinion either way.
53 Source: Skift’s 2017 U.S. Experiential Traveler Survey
Spending Preferences Survey question: I’m willing to pay higher rates/fares to use a travel service provider that demonstrates environmental responsibility (consider accommodations, airlines, etc.).
Modern travelers are inundated with choices from the beginning of the trip planning process. One area where this is especially true is when it comes to booking channels. Direct booking, online travel agencies (OTAs), and traditional travel agents, among others, are all at the disposal of travelers to help them book their accommodations, activities, and more. In this section, we cover Avid Travelers’ past use and preferences when it comes to booking channels.
Booking Channels
Source: Skift’s 2017 U.S. Experiential Traveler Survey 54
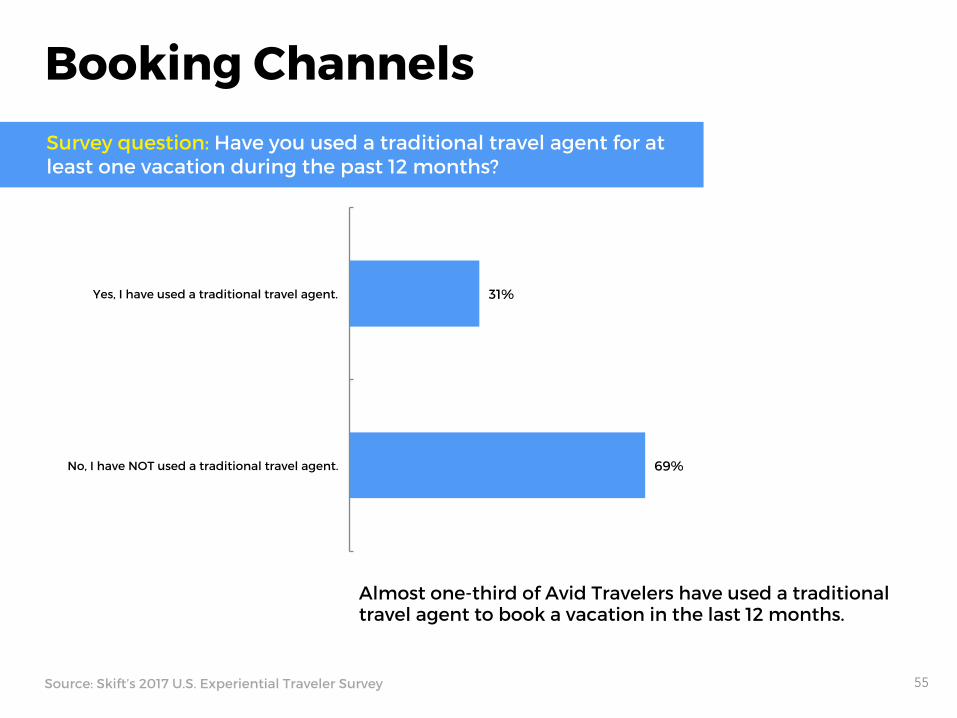
31%
69%
Yes, I have used a traditional travel agent.
No, I have NOT used a traditional travel agent.
Almost one-third of Avid Travelers have used a traditional travel agent to book a vacation in the last 12 months.
Booking Channels Survey question: Have you used a traditional travel agent for at least one vacation during the past 12 months?
55 Source: Skift’s 2017 U.S. Experiential Traveler Survey

18%
21%
22%
18%
21%
Very Likely
Somewhat Likely
Not Sure
Somewhat Unlikely
Very Unlikely
Close to one in four Avid Travelers are likely to consider using a traditional travel agent for a vacation in the next two years.
Booking Channels Survey question: How likely are you to use the services of a traditional travel agent for a vacation in the next two years?
56 Source: Skift’s 2017 U.S. Experiential Traveler Survey

10%
35%
33%
12%
2%
6%
2%
1
2
3
4
5
More than 5
I do not use the Internet to book anything.
Most respondents are relatively conservative with the number of websites they use to book all parts of their vacation, but 90% prefer to use more than one.
Booking Channels Survey question: How many websites do you typically use to book all the parts of your vacation? Consider booking flights, accommodations, and activities.
57 Source: Skift’s 2017 U.S. Experiential Traveler Survey

53%
35%
5%
7%
Through an online travel agency (such as Expedia or Booking.com)
Through a travel service provider directly (website, phone, in person)
Through a traditional travel agent
Other (please specify)
Over half of Avid Travelers report typically getting the best price on travel services through online travel agencies.
Booking Channels Survey question: Through which channel do you normally get the best prices for travel services (including accommodations, flight tickets, and attractions)?
58 Source: Skift’s 2017 U.S. Experiential Traveler Survey

56%
28%
8%
5%
3%
Through the attraction's website or app
In person, at the attraction
In person, from a discounter in the destination
I have never purchased tickets for in-destination attractions
Other (please specify) More than half of Avid Travelers tend to purchase attraction tickets directly through the attraction’s website or app, followed by in-person purchasing, which is used half as often.
Booking Channels Survey question: How do you typically purchase tickets for in-destination attractions (i.e. amusement parks, tours, museum and show tickets, etc.)?
59 Source: Skift’s 2017 U.S. Experiential Traveler Survey

49%
39%
8%
4%
Directly through the hotel (website, phone, in person)
Online travel agency (Expedia, Booking.com etc.)
Metasearch website (Kayak, Trivago, Momondo etc.)
Other (please specify)
Despite over half of Avid Travelers reporting getting the best prices from online travel agencies, only 39% typically use this channel to book a hotel. Direct booking is more common.
Booking Channels Survey question: What channel do you typically use to book a hotel?
60 Source: Skift’s 2017 U.S. Experiential Traveler Survey

49%
45%
3%
3%
Through the hotel directly (website, phone, in person)
Through an online travel agency (such as Expedia or Booking.com)
Through a traditional travel agent
Through a different channel (please specify)
Among those who have booked last-minute accommodations, direct booking and online travel agencies are used at nearly the same rate.
Booking Channels Survey question: How do you typically book last-minute accommodations (e.g. within 48 hours of departure)?
(Among those who have taken a last-minute vacation in the past 12 months)
61 Source: Skift’s 2017 U.S. Experiential Traveler Survey

The continuing rise in popularity of alternative lodging companies, exemplified by Airbnb, means that today’s travelers have more choices than ever when it comes to selecting their travel accommodations. In this section, we present the survey questions that uncover Avid Travelers’ accommodation preferences, in general, and more specifically with regards to hotels and Airbnb rentals.
Accommodations
Source: Skift’s 2017 U.S. Experiential Traveler Survey 62

74%
70%
25%
14%
Location
Price
Experience
Loyalty
Avid Travelers care more about the surrounding area of their accommodation and its price, perhaps allocating more money toward better activities.
Accommodations Survey question: What are your key motivators when booking a hotel?
Please select your TOP TWO.
63 Source: Skift’s 2017 U.S. Experiential Traveler Survey

8%
20%
24%
18%
10%
8%
5%
4%
1%
2%
$50-$75 per night
$76-$100 per night
$101-$125 per night
$126-$150 per night
$151-$175 per night
$176-$200 per night
$201-$250 per night
$251-$300 per night
$301- $350 per night
More than $350 per night
62% of respondents typically spend between $76 and $150 per night on leisure trip accommodations.
Accommodations Survey question: On a typical leisure trip, how much do you normally spend on your accommodation per night?
64 Source: Skift’s 2017 U.S. Experiential Traveler Survey
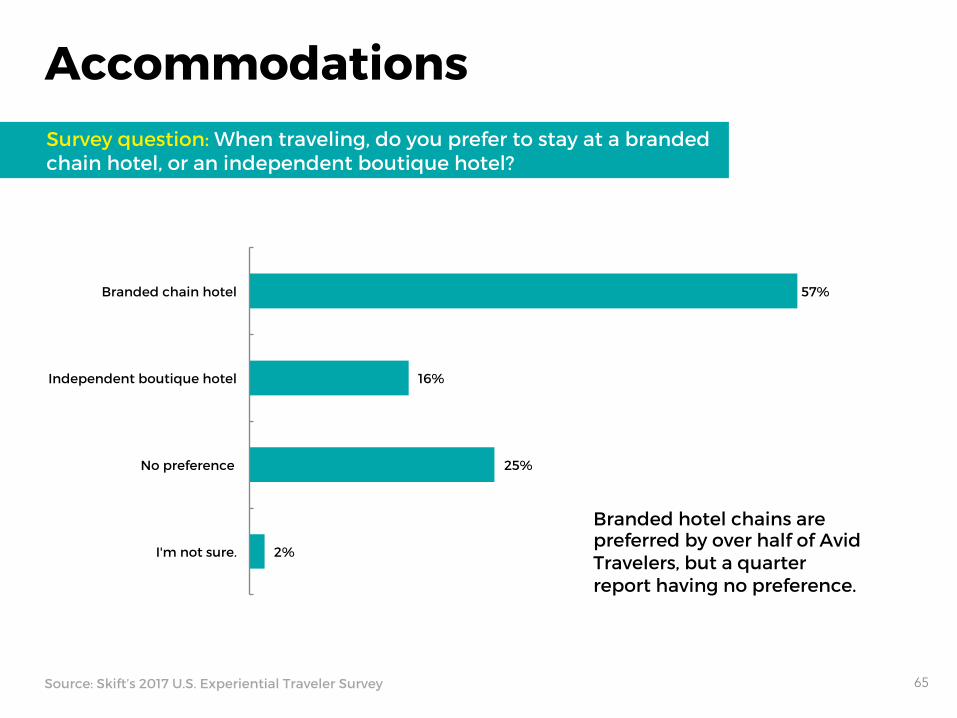
57%
16%
25%
2%
Branded chain hotel
Independent boutique hotel
No preference
I'm not sure.
Branded hotel chains are preferred by over half of Avid Travelers, but a quarter report having no preference.
65 Source: Skift’s 2017 U.S. Experiential Traveler Survey
Accommodations Survey question: When traveling, do you prefer to stay at a branded chain hotel, or an independent boutique hotel?

63%
17%
16%
4%
No, never.
Yes, once.
Yes, multiple times.
What is Airbnb?
One-third of Avid Travelers have used Airbnb at least once during a past leisure trip.
66 Source: Skift’s 2017 U.S. Experiential Traveler Survey
Accommodations: Airbnb Use & Attitudes Survey question: Have you ever used Airbnb to book an apartment or home rental as part of a leisure trip?

50%
38%
10%
1%
1%
Very Satisfied
Satisfied
Neutral
Dissatisfied
Very Dissatisfied
67 Source: Skift’s 2017 U.S. Experiential Traveler Survey
Accommodations: Airbnb Use & Attitudes Survey question: Overall, how satisfied were you with your last Airbnb experience?
(Among those who have used the service)
Almost nine out of 10 past Airbnb users reported being satisfied or very satisfied with their last Airbnb experience.
45%
38%
14%
2%
1%
Strongly Agree
Slightly Agree
Neither Agree nor Disagree
Slightly Disagree
Strongly Disagree
68 Source: Skift’s 2017 U.S. Experiential Traveler Survey
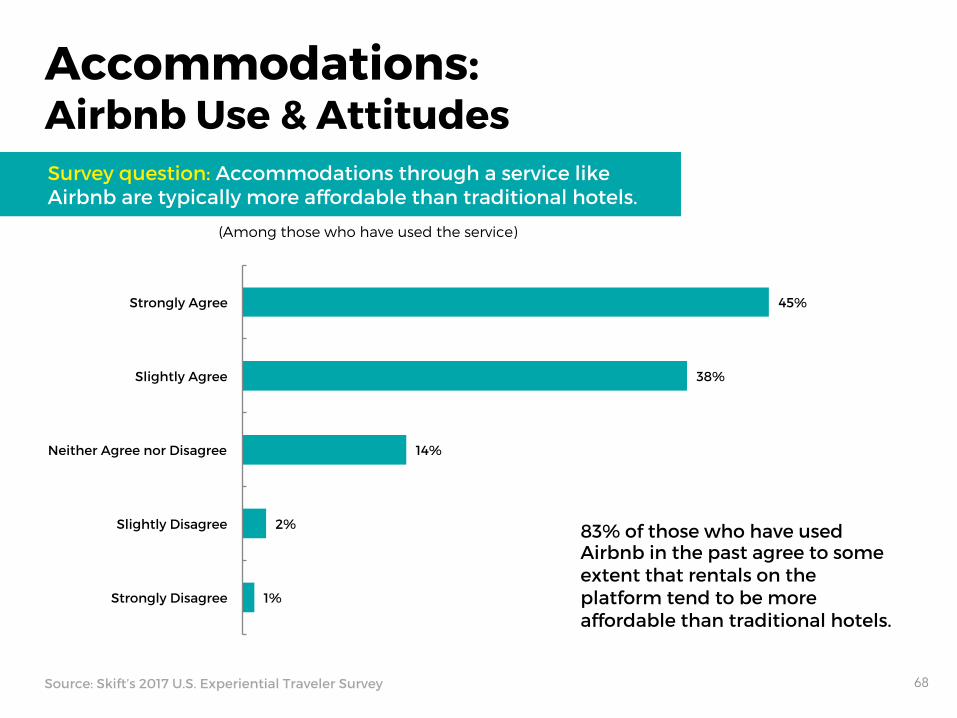
Accommodations: Airbnb Use & Attitudes Survey question: Accommodations through a service like Airbnb are typically more affordable than traditional hotels.
(Among those who have used the service)
83% of those who have used Airbnb in the past agree to some extent that rentals on the platform tend to be more affordable than traditional hotels.

39%
38%
20%
3%
The Airbnb experience.
The hotel experience.
I have no preference.
I am not sure.
69 Source: Skift’s 2017 U.S. Experiential Traveler Survey
Accommodations: Airbnb Use & Attitudes Survey question: Overall, what type of accommodations would you rather stay at?
(Among those who have used Airbnb)
Despite the high satisfaction and agreement on the affordability of Airbnb accommodations, just 39% prefer the Airbnb experience over the hotel experience, and another 20% have no preference.

18%
21%
30%
15%
16%
Very Likely
Somewhat Likely
Not Sure
Somewhat Unlikely
Very Unlikely
70 Source: Skift’s 2017 U.S. Experiential Traveler Survey
Accommodations: Airbnb Use & Attitudes Survey question: How likely are you to stay at an Airbnb accommodation on a vacation in the next 12 months?
(Excluding those who have never heard of Airbnb)
Among all Avid Travelers who are aware of Airbnb, about 4 in 10 report being at least somewhat likely on using the service in the next year, which another 3 in 10 expressing uncertainty.

In the final section, we cover survey data related to airlines. While airline selection tends to be dictated by regional availability, the data still reveal that Avid Travelers have clear opinions regarding airline preferences, as well as their level of satisfaction with their preferred airline, and how it compares to others.
Airlines
71 Source: Skift’s 2017 U.S. Experiential Traveler Survey

32%
19%
17%
13%
12%
7%
Southwest
Delta
American
United
No preference
Other (please specify)
Almost one-third of Avid Travelers prefer Southwest Airlines over other full-service carriers.
Airlines Survey question: Which full-service airline do you prefer?
72 Source: Skift’s 2017 U.S. Experiential Traveler Survey

(Among those who indicated a preference)
43%
45%
11%
1%
0%
Very Satisfied
Satisfied
Neutral
Dissatisfied
Very Dissatisfied
Despite the complaints and bad press that often surround airlines, nearly nine out of 10 Avid Travelers with a preferred airline report being satisfied or very satisfied with it.
Airlines Survey question: How satisfied are you with your preferred airline?
73 Source: Skift’s 2017 U.S. Experiential Traveler Survey

Airlines
9%
22%
23%
33%
12%
Strongly Agree
Agree
Neither Agree nor Disagree
Disagree
Strongly Disagree
Source: Skift’s 2017 U.S. Experiential Traveler Survey 74
More Avid Travelers disagree with this statement, but about half as many neither agree nor disagree.
Survey question: There is really no difference between the major full-service airlines.