u.s. economy picks up steam - hughes capital management · the lead from last weekend's wsj:...
TRANSCRIPT

October 2017
The lead from last weekend's WSJ:
U.S. Economy Picks Up Steam
Despite Hurricanes, U.S. consumers and businesses drove a six-month expansion
By Josh Mitchell
WASHINGTON—The U.S. economy posted its best six-month stretch of growth in three years despite two
hurricanes, a sign that it might be breaking out of its long-running slow-growth trend, with the help of soaring
stock prices and rising business and consumer confidence.
Gross domestic product, the broadest measure of goods and services produced in the U.S., expanded at a 3%
annual rate in the third quarter, the Commerce Department said Friday. That followed 3.1% annual growth in
the spring.
Though not a boom, that’s still the first time since mid-2014 that the economy has strung together two quarters
of at least 3% growth. Solid spending by consumers and businesses—along with higher sales of American
goods overseas—helped prevent the kind of slowdown some economists expected after hurricanes Harvey and
Irma shut down parts of Texas and Florida in August and September. ...
The economy has produced six-month growth bursts several times during this eight-year expansion, including a
period of near-5% growth in mid-2014. But it hasn’t been able to keep up that pace. The growth rate as a whole
for the expansion has averaged 2.2%.
A chunk of the third quarter’s growth reflected businesses’ replenishing of stockpiles, which had fallen earlier
this year, rather than higher sales. Stripping out inventory changes, which can be volatile, output grew at a 2.3%
rate, closer to the longer-running average. ...
The Commerce Department said hurricanes likely suppressed business activity such as oil-and-gas extraction in
Texas and agricultural production in Florida. But the storms likely boosted other types of activity, such as
emergency services and repair efforts.
“It is not possible to estimate the overall impact of Hurricanes Harvey and Irma on 2017 third-quarter GDP,”
the agency said.
Repair efforts could (will, as we previously noted) boost economic growth in coming quarters, particularly in
building sectors. The Commerce Department estimated that government and private insurance companies’
payouts resulting from the storms could total $102 billion. ...
Taken altogether, the report is likely to nudge the Federal Reserve closer to raising its benchmark short-term
interest rate—the federal funds rate—at its policy meeting in December. Inflation picked up this summer after
weakening earlier in the year, though it remains below the Fed’s 2% target. The price index for personal
consumption expenditures—the Fed’s preferred measure of inflation—rose at a 1.5% annual rate in the third
quarter, up from the second quarter’s 0.3% increase. ...
Four Bespoke posts Worth Sharing:
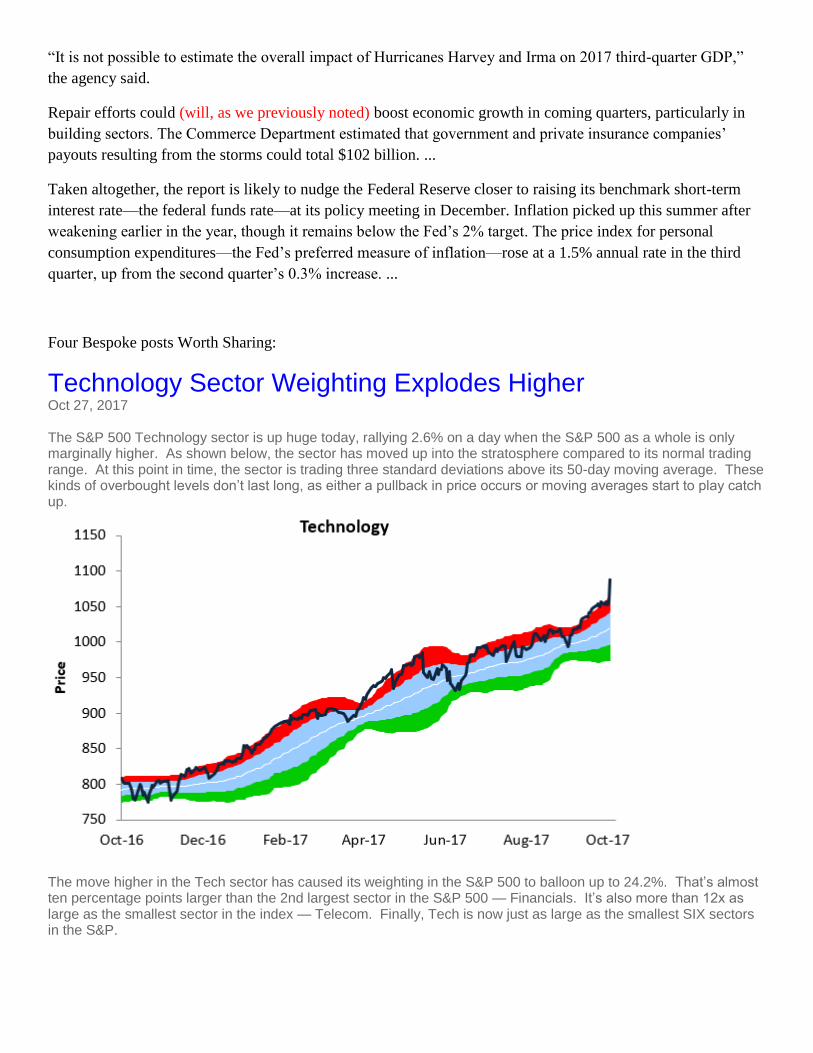
Technology Sector Weighting Explodes Higher Oct 27, 2017 The S&P 500 Technology sector is up huge today, rallying 2.6% on a day when the S&P 500 as a whole is only marginally higher. As shown below, the sector has moved up into the stratosphere compared to its normal trading range. At this point in time, the sector is trading three standard deviations above its 50-day moving average. These kinds of overbought levels don’t last long, as either a pullback in price occurs or moving averages start to play catch up.
The move higher in the Tech sector has caused its weighting in the S&P 500 to balloon up to 24.2%. That’s almost ten percentage points larger than the 2nd largest sector in the S&P 500 — Financials. It’s also more than 12x as large as the smallest sector in the index — Telecom. Finally, Tech is now just as large as the smallest SIX sectors in the S&P.
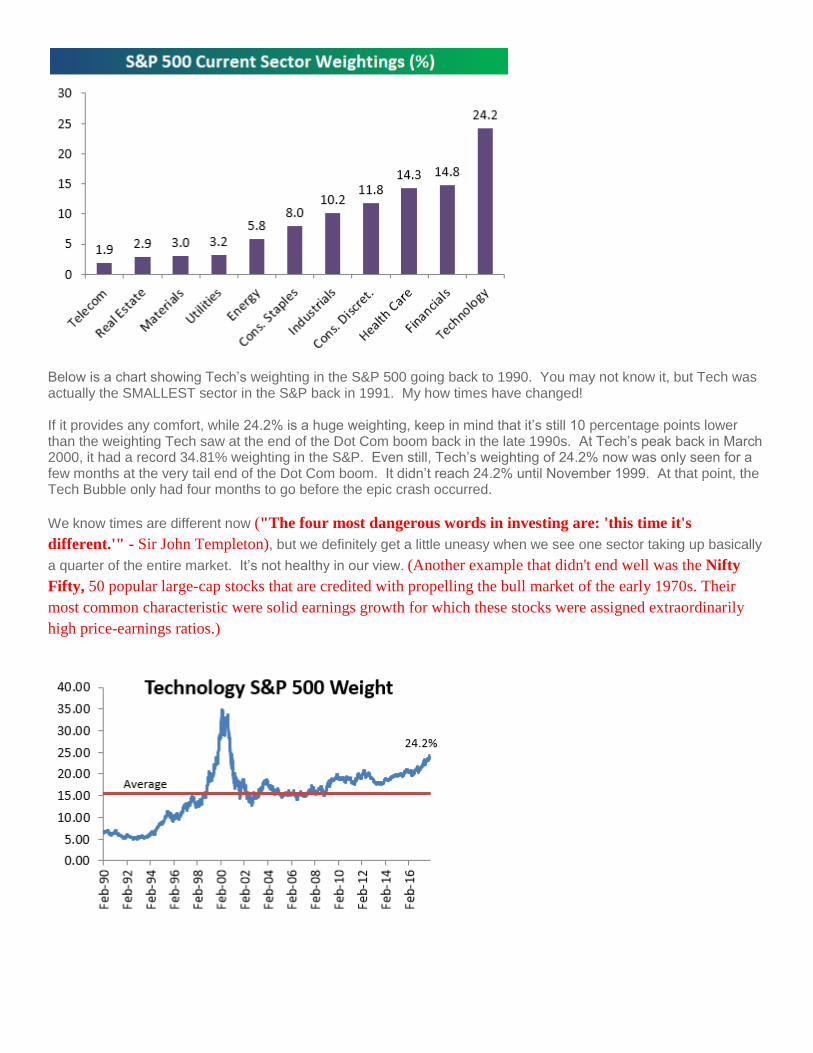
Below is a chart showing Tech’s weighting in the S&P 500 going back to 1990. You may not know it, but Tech was actually the SMALLEST sector in the S&P back in 1991. My how times have changed! If it provides any comfort, while 24.2% is a huge weighting, keep in mind that it’s still 10 percentage points lower than the weighting Tech saw at the end of the Dot Com boom back in the late 1990s. At Tech’s peak back in March 2000, it had a record 34.81% weighting in the S&P. Even still, Tech’s weighting of 24.2% now was only seen for a few months at the very tail end of the Dot Com boom. It didn’t reach 24.2% until November 1999. At that point, the Tech Bubble only had four months to go before the epic crash occurred.
We know times are different now ("The four most dangerous words in investing are: 'this time it's
different.'" - Sir John Templeton), but we definitely get a little uneasy when we see one sector taking up basically
a quarter of the entire market. It’s not healthy in our view. (Another example that didn't end well was the Nifty
Fifty, 50 popular large-cap stocks that are credited with propelling the bull market of the early 1970s. Their
most common characteristic were solid earnings growth for which these stocks were assigned extraordinarily
high price-earnings ratios.)

The Biggest Get Even Bigger Oct 27, 2017 Below is a look at the 5 largest companies in the S&P 500. Today has been a big day for the largest companies in the world. They’re all trading higher on the back of strong earnings reports from Alphabet (GOOGL), Microsoft (MSFT), and Amazon (AMZN). Apple (AAPL) remains in the lead as the largest public company in the world by more than $100 billion in market cap, but GOOGL is now worth $724 billion — larger than any company not named Apple has ever been. The 3rd, 4th, and 5th largest companies in the S&P are now all worth more than $500 billion as well. So far in 2017, the five largest companies — all Tech related names — have added close to a trillion in market cap. The remaining 495 stocks in the S&P 500 have added roughly 2 trillion. This means the five largest stocks have accounted for a third of the 2017 gains in market cap for the entire S&P 500.
Politics and Investing: Keep Them Separate Oct 30, 2017 A popular chart making the rounds today is the one below from Gallup, which shows the daily tracking of President Trump’s approval and disapproval ratings. As shown, just ahead of grand jury indictments concerning former members of his campaign staff, the President’s approval rating is sinking like JC Penney, while his disapproval rating looks closer to Apple as it just broke out to new highs.
While these charts always make for some good conversation, their utility stops right about there, especially when it comes to the market. The chart below compares the performance of the S&P 500 to Trump’s approval rating throughout his Presidency. Even as Trump’s popularity plumbs new lows, the S&P 500 has been going in the exact opposite direction. Sure, the President may be unpopular, and based on his approval ratings there’s only a one in three chance that anyone reading this approves of the job he is doing. Like him or not, though, never let politics

impact your investment decisions (in Developed Markets, as previously shared). Just as a lot of investors missed
out on the bulk of this bull market because they didn’t care for President Obama and his policies, another group of different investors has now likely missed out on another good year for the equity market just because they don’t care for President Trump.
Highest Confidence Since 2000 Oct 31, 2017 Consumer Confidence for the month of October surged to the highest level since December 2000. While economists were expecting the headline index to show a slight increase to 121.0 from last month’s level of 120.6, the actual reading rose to 125.9, taking out the 124.9 high from March. This month’s print was also the best reading relative to expectations since March.
Consumers aren’t as optimistic about the future as they are about the present, however.(And yet the U.S. Personal
Savings Rate fell to 3.1% in September, the lowest since before the Great Recession and well below the long

term average of 8.3%.) When it comes to the present, consumers haven’t been this optimistic since July 2001.
When it comes to the future, though, confidence levels still have yet to take out the recent highs from last March. As shown in the chart below, the divergence between sentiment towards the present and future tends to get wider the later you get into the economic cycle, so this kind of trend is closer to late-cycle than early cycle behavior.
From the Oct. 29th issue of Capitalist Times:
Are We Melting Up?
By Elliott H. Gue
The US stock market continues to show impressive momentum with strength supported by firm US economic
data. While the broader market remains overdue for a pullback ... stocks are entering the most seasonally strong
time of year. ...
As a rule of thumb, growth stocks tend to outperform the broader market when US economic growth (and
global growth) are lackluster or decelerating. The reason is that growth stocks–technology being a standout
example–don’t need support from the broader economy to generate earnings and revenue growth.
In contrast, value groups–like energy, financials and industrials–tend to be far more economy sensitive. Such
groups perform best when the broader economy is growing at a solid pace or accelerating. Recent economic
data suggest the latter scenario for the US economy right now; accordingly, we expect value groups to emerge
as market leaders over the coming months. ...
(As mentioned in a High Dividend Opportunities Oct. 29th post, a Merrill Lynch study found that over a 90-
year period growth stocks returned an average of 12.6% annually since 1926. However, value stocks generated
an average return of 17% per year over the same timeframe. Chief investment strategist Michael Hartnett:
"Value has outperformed Growth in roughly three out of every five years over this period." Not mentioned,
value stocks tended to outperform during periods of economic growth, while growth stocks proved better when
the economy is weak.)

While stocks are expensive based on most valuation metrics and the bull market in the S&P 500 is long in the
tooth by any historical yardstick, bull markets have historically ended with a bang, not a whimper.
Since 1937, there have been 12 bear markets in the S&P 500, defined as a total decline of 20 percent or more
from a closing high (the peak of the bull market) to a closing low (trough of the bear market).
In the chart above, we show the average performance of the S&P 500 in the 500 final trading days (roughly two
calendar years) prior to the peak of all 12 bull markets since 1937 and the first 250 days (1 year) of the ensuing
bear markets. To make these cycles comparable, the chart uses percentage gains/losses starting 500 days before
the top rather than the actual level of the stock market at the time.
In the 12 bull markets since 1937, the S&P 500 rallies an average of 48 percent in the final 500 days of a bull
market (58 percent including dividends).
The pattern has been remarkably consistent over the years: The worst return for the market in the final 500 days
of a bull market was 30 percent.
The best return in the final 500 days was 129 percent leading up to the 1937 top.
It’s become increasingly likely the US stock market is in one of these melt-up rally phases that could propel
stocks far beyond valuation norms, and far higher than many pundits believe, in coming months.
Positions
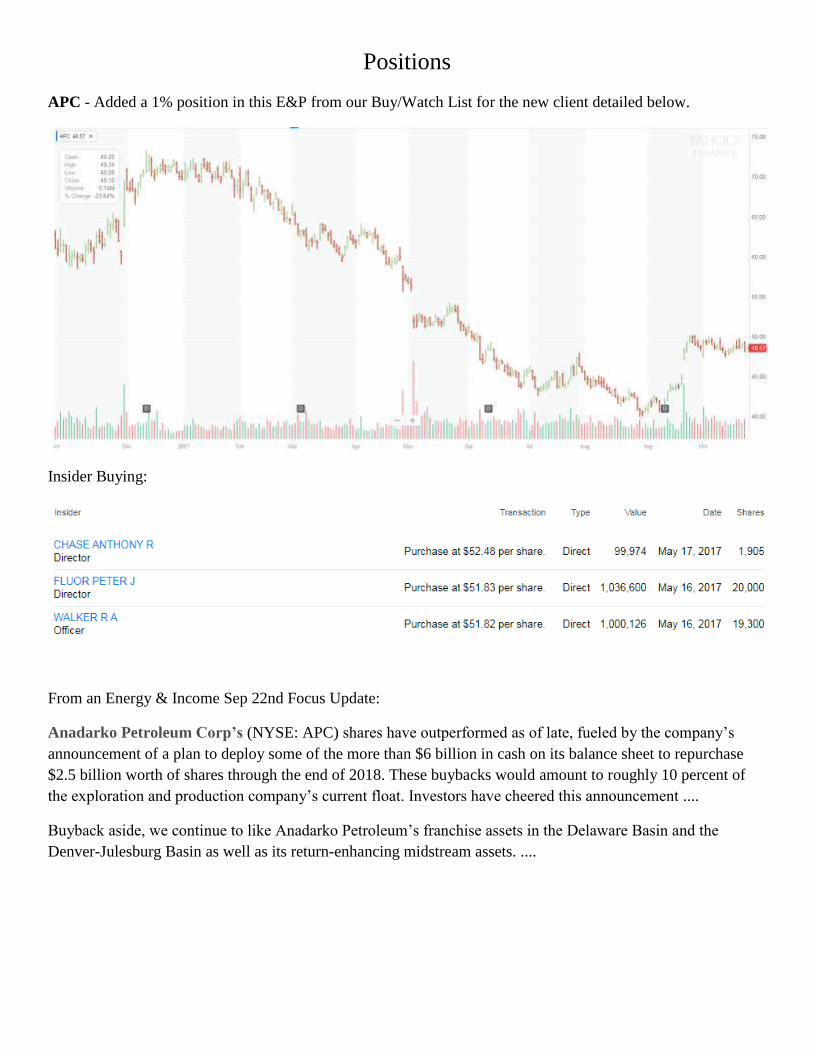
APC - Added a 1% position in this E&P from our Buy/Watch List for the new client detailed below.
Insider Buying:
From an Energy & Income Sep 22nd Focus Update:
Anadarko Petroleum Corp’s (NYSE: APC) shares have outperformed as of late, fueled by the company’s
announcement of a plan to deploy some of the more than $6 billion in cash on its balance sheet to repurchase
$2.5 billion worth of shares through the end of 2018. These buybacks would amount to roughly 10 percent of
the exploration and production company’s current float. Investors have cheered this announcement ....
Buyback aside, we continue to like Anadarko Petroleum’s franchise assets in the Delaware Basin and the
Denver-Julesburg Basin as well as its return-enhancing midstream assets. ....

BRX - Added a 2% position @ 18.6384 in this Shopping Center REIT from our Buy/Watch List for the new
client detailed below. Forbes Real Estate Investor rates BRX a Strong Buy with a $25/share Fair Value.
Insider Buying:
ISCF - Added a 10% Core position in this Multifactor (Value, Quality, Momentum, Size) Foreign Small/Mid
Blend ETF from our Buy/Watch List for the new client detailed below, instead of the IVAL (Value, orange line
in ISCF's Morningstar chart below) and IMTM (Momentum, green line) or IMOM (Momentum) Foreign ETFs
combination we had been using. ISCF has been on our Watch List while we waited for an acceptable level of
liquidity, which usually requires at least 20 mil in Total Assets. We have replaced the IVAL/IMTM or IMOM
combination with ISCF in portfolios where these ETFs were held in an IRA with GPIIX (not OBIOX, which
incorporates the Momentum Factor) and are in the process of doing so for clients with long-term capital gains in
the IVAL/IMTM combination. For clients with short-term capital gains in the IVAL/IMTM or IMOM
combination, we will reanalyze once those gains become long-term. For the DIYers out there, the decision to
replace IVAL in particular with ISCF needs to take into account other holdings and the potential tax
consequences.

A Suite of New Multifactor ETFs for Your Watchlist
By Ben Johnson, CFA | 08-21-15
In late April, iShares launched a crop of new multifactor strategic-beta exchange-traded funds, unveiling its
FactorSelect suite. The five funds are the latest in a wave of increasingly complex multifactor funds being rolled
off asset managers' assembly lines. By our count, 33 of the 88 multifactor strategic-beta ETFs that exist in the
U.S. market today were launched in the past 12 months. I think these are some of the best of the bunch.
Combining stand-alone factors in a multifactor format is a sensible strategy to the extent that the factors in
consideration are 1) credible; 2) well-constructed; and 3) combined in such a way as to improve the overall
risk/reward profile of the resulting portfolio relative to owning any of the factors in a stand-alone format, a
traditional cap-weighted index fund, or an actively managed peer. At first blush, the benchmarks underlying the
iShares FactorSelect ETFs appear to meet all three criteria.
These indexes look to combine the quality, momentum, value, and low-size factors. Quality has been vetted but
remains a relative newcomer. Low size has been called into question, but if nothing else, it can serve to magnify
the value (or Quality) effect. Value and momentum are the classics, the peanut butter and jelly of factor

investing. They have been tested across multiple time periods, geographies, and asset classes and have proved
their worth in out-of-sample tests as well.
MSCI takes the same approach to constructing these factor exposures in the context of the FactorSelect suite as
it does for their stand-alone versions .... There is a large gap to bridge between factor theory and investment
reality. The academics who first discovered and continue to explore and measure these factors don't have to deal
with the messy reality of transaction costs and taxes; as such, they are able to isolate and examine factors in
their purest form. MSCI has made good work of delivering investable versions of these factors with an eye
toward maintaining their "purity." From there, the firm's Diversified Multi-Factor Indexes combine these four
factors in such a way as to tamp down cyclicality (as compared with owning them on a stand-alone basis) and
maintain market like levels of volatility.
The FactorSelect ETFs are sensibly designed and competitively priced, but are they better mousetraps? Only
time will tell. These ETFs were launched just three months after MSCI began live calculations for the
underlying indexes. I've never met a bad-looking back-test (the ugly ones never see the light of day), and I
wouldn't suggest using a good-looking one as the sole basis for an investment decision. For now, I've got these
funds on my watchlist.
JCAP - Added a 2% position @ 21.47 in this formerly held Self Storage hybrid REIT from our Buy/Watch List
for the new client detailed below. Forbes Real Estate Investor rates JCAP a Buy with a $22/share Fair Value.

Insider Buying:
LNG - Added a 1% position @ 45.9201 in this LNG Terminals & Pipelines Energy play from our Buy/Watch
List for the new client detailed below.
Insider Buying:
From InsiderInsights Sep 11th issue:
With indices again looking more (technically) healthy than they perhaps deserve, we’re passing on stocks that
have surged in recent sessions and instead taking a stab at picking up stocks insiders are indicating as oversold
after recent sell-offs. Both of our New Recs this issue also share the trait of having statistically predictive
insiders acting bullish again with most of Q3 in the books. History has shown that significant bullish insider
buying at this point in a quarter translates into a lower probability of a quarter disappointing.
Shares of Cheniere Energy (LNG) certainly reacted with disappointment to its Q2 results, however. With
energy prices already under pressure, investors may have been exasperated at the reported loss of $1.23 per
share after getting used to newly minted bottom-line profits in the previous two quarters.
But Cheniere is the midst of a serious program to build out capacity, and lumpiness in reported EPS from non-
cash items is not a huge red flag. Most of the concerns raised in the company’s Q2 conference call were of more
mundane commodity issues related to price uncertainty, contract negotiations, and competition from Qatar.
Whatever the real objection was to Q2, it still held good news as management increased EBITDA guidance.
We’re viewing the pullback as a buying opportunity for both shorter-term and longer-term investors, and adding
LNG to our Recommended List.
Cheniere Energy is in the liquified natural gas (LNG) business, and is a first mover to export LNG out of the
U.S. after decades of regulations preventing foreign sales. The company owns and operates the Sabine Pass
LNG terminal in Louisiana, the Corpus Christi LNG terminal in Texas, and is actively constructing new
capacity.
The fact that Cheniere was able to get new capacity on line sooner-than expected “has led us to increase and
tighten the guidance range for adjusted EBITDA for full year 2017,” announced CFO Michael Wortley in his
Q2 conference call. The midpoint of EBITDA expectations were raised by $150 million, to $1.7 billion.
While not a major guidance increase, it shows this important metric moving in the right direction. That the
increase resulted from an infrastructure project being completed ahead of time is an even better sign considering
that Cheniere has a good couple years more in its present expansion phase.
With their stock reacting poorly, two executives picked up over $250k worth of LNG shortly after the earnings
event in mid-August. This was a reversal of behavior for CFO Wortley, who has sold LNG presciently in the
past and was last seen selling in August 2016 at prices similar to those he just bought for. General Counsel Sean
Markowitz bought well in the past, and increased his holdings by 11.1% with his latest buy. This duo couldn’t
have known about Harvey and Irma, however, and LNG traded lower after their purchases.
Both of these potential stormy upsets to Cheniere’s hard assets are past at this point, however, and it was the $1
million purchases of LNG by CEO Jack Fusco that finally generated a new “Significantly Bullish”
InsiderInsights Company Rating for LNG on September 12th, prompting our own buy. As relayed on Mr.
Fusco’s Statistical Scorecard ..., his track record is excellent in the short-term, perfect after just a six-month
period, and built on a solid sample size.
... Cheniere was able to report that there was no damage to its Corpus Christi construction site from Harvey, and
no interruption of LNG production at Sabine pass. ...
But Cheniere’s progress with its capacity buildout and revenue growth over the past year gives confidence that
its growth strategy will be well executed in coming years as well. Longer-term, Cheniere appears on the right
side of larger global trends with its focus on LNG exports. Shorter-term, the timing of Mr. Fusco’s 4.5%
increasing in total holdings cannot be discounted for its significance. The last time he bought was last
November, which was also the last time LNG was looking technically out of favor.
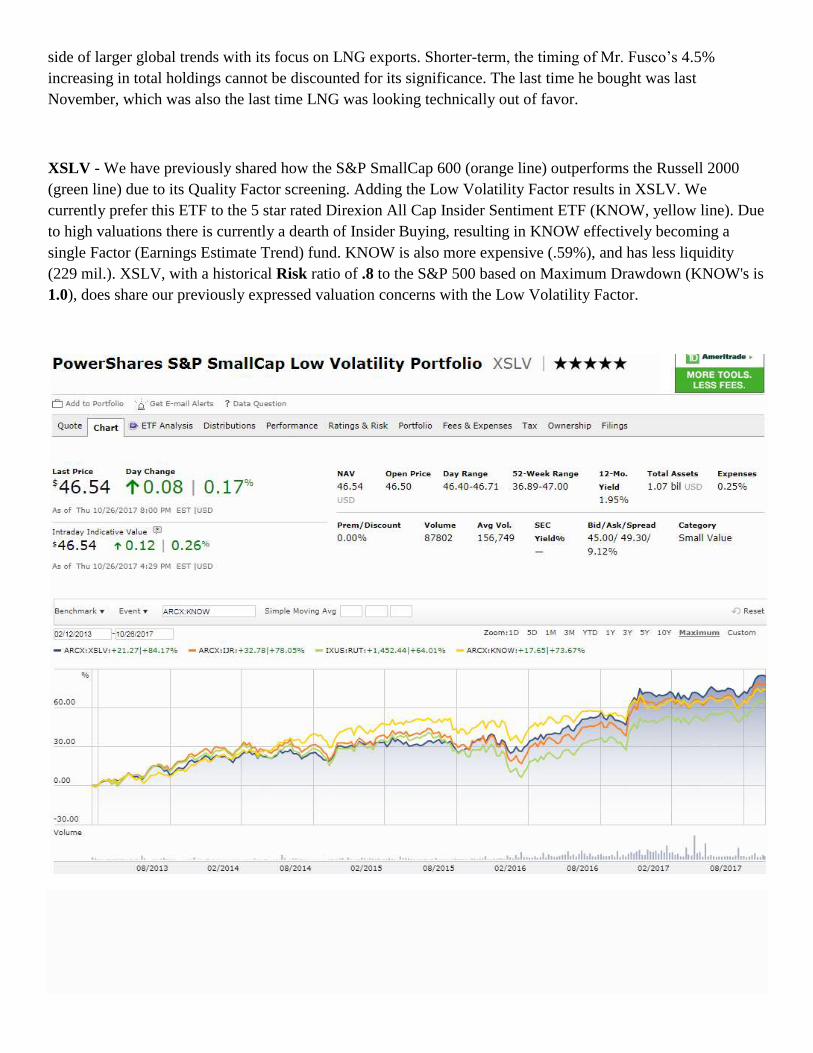
XSLV - We have previously shared how the S&P SmallCap 600 (orange line) outperforms the Russell 2000
(green line) due to its Quality Factor screening. Adding the Low Volatility Factor results in XSLV. We
currently prefer this ETF to the 5 star rated Direxion All Cap Insider Sentiment ETF (KNOW, yellow line). Due
to high valuations there is currently a dearth of Insider Buying, resulting in KNOW effectively becoming a
single Factor (Earnings Estimate Trend) fund. KNOW is also more expensive (.59%), and has less liquidity
(229 mil.). XSLV, with a historical Risk ratio of .8 to the S&P 500 based on Maximum Drawdown (KNOW's is
1.0), does share our previously expressed valuation concerns with the Low Volatility Factor.
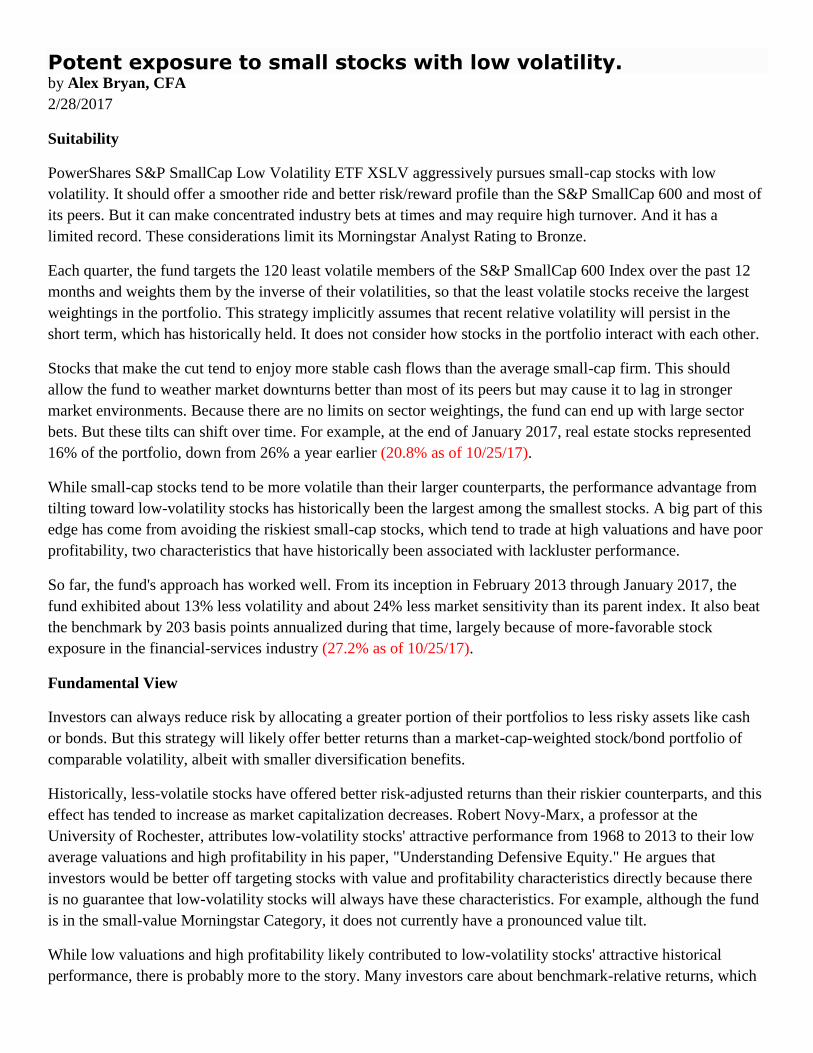
Potent exposure to small stocks with low volatility. by Alex Bryan, CFA
2/28/2017
Suitability
PowerShares S&P SmallCap Low Volatility ETF XSLV aggressively pursues small-cap stocks with low
volatility. It should offer a smoother ride and better risk/reward profile than the S&P SmallCap 600 and most of
its peers. But it can make concentrated industry bets at times and may require high turnover. And it has a
limited record. These considerations limit its Morningstar Analyst Rating to Bronze.
Each quarter, the fund targets the 120 least volatile members of the S&P SmallCap 600 Index over the past 12
months and weights them by the inverse of their volatilities, so that the least volatile stocks receive the largest
weightings in the portfolio. This strategy implicitly assumes that recent relative volatility will persist in the
short term, which has historically held. It does not consider how stocks in the portfolio interact with each other.
Stocks that make the cut tend to enjoy more stable cash flows than the average small-cap firm. This should
allow the fund to weather market downturns better than most of its peers but may cause it to lag in stronger
market environments. Because there are no limits on sector weightings, the fund can end up with large sector
bets. But these tilts can shift over time. For example, at the end of January 2017, real estate stocks represented
16% of the portfolio, down from 26% a year earlier (20.8% as of 10/25/17).
While small-cap stocks tend to be more volatile than their larger counterparts, the performance advantage from
tilting toward low-volatility stocks has historically been the largest among the smallest stocks. A big part of this
edge has come from avoiding the riskiest small-cap stocks, which tend to trade at high valuations and have poor
profitability, two characteristics that have historically been associated with lackluster performance.
So far, the fund's approach has worked well. From its inception in February 2013 through January 2017, the
fund exhibited about 13% less volatility and about 24% less market sensitivity than its parent index. It also beat
the benchmark by 203 basis points annualized during that time, largely because of more-favorable stock
exposure in the financial-services industry (27.2% as of 10/25/17).
Fundamental View
Investors can always reduce risk by allocating a greater portion of their portfolios to less risky assets like cash
or bonds. But this strategy will likely offer better returns than a market-cap-weighted stock/bond portfolio of
comparable volatility, albeit with smaller diversification benefits.
Historically, less-volatile stocks have offered better risk-adjusted returns than their riskier counterparts, and this
effect has tended to increase as market capitalization decreases. Robert Novy-Marx, a professor at the
University of Rochester, attributes low-volatility stocks' attractive performance from 1968 to 2013 to their low
average valuations and high profitability in his paper, "Understanding Defensive Equity." He argues that
investors would be better off targeting stocks with value and profitability characteristics directly because there
is no guarantee that low-volatility stocks will always have these characteristics. For example, although the fund
is in the small-value Morningstar Category, it does not currently have a pronounced value tilt.
While low valuations and high profitability likely contributed to low-volatility stocks' attractive historical
performance, there is probably more to the story. Many investors care about benchmark-relative returns, which

may cause them to favor riskier stocks that have higher expected returns in bull markets, reducing their
expected returns relative to their risk. Similarly, neglected lower-risk stocks can become undervalued relative to
their risk. This is not necessarily the same as the traditional value effect, as many of these stocks often trade at
comparable or even higher valuations than the market. Andrea Frazzini and Lasse Pedersen, two principals from
AQR, develop this argument in their paper, "Betting Against Beta."
There may also be an element of behavior-induced mispricing behind the low-volatility effect, where investors
may overpay for volatile stocks that offer a low probability of a high payoff. Much of the low-volatility
performance benefit has come from simply avoiding the most volatile stocks (including many small biotech
firms and junior miners), which tend to have low profitability and high valuations and may be mispriced.
The fund's narrow focus on recent volatility and frequent rebalancing allow it to effectively capture the low-
volatility effect documented in the academic literature. But it can also lead to high turnover and introduce some
indirect bets that investors may not anticipate. Turnover exceeded 50% in each of the past two years. In addition
to large and fluid sector tilts, the fund's exposure to value stocks may change over time.
The fund has greater exposure to the financial-services (a plus in a moderately rising interest rate environment),
utilities, and real estate sectors than the S&P SmallCap 600 Index, and less exposure to technology, consumer
cyclical, and healthcare stocks. While the fund often takes large sector bets, it effectively diversifies firm-
specific risk. It tends to favor profitable firms with conservative asset growth, which can translate into attractive
free cash flows (this results from the S&P SmallCap 600's Quality Factor).
Portfolio Construction
The fund employs full replication to track the S&P SmallCap 600 Low Volatility Index. It earns a Positive
Process rating because it offers pure exposure to stocks with low volatility, which have historically offered
superior risk-adjusted performance and should continue to do so. Each quarter, S&P ranks the constituents in
the S&P SmallCap 600 by their volatility over the past 12 months and selects the least volatile 120 for inclusion
in the index. It then weights these constituents by the inverse of their volatility, so that less-volatile stocks
receive larger weightings in the portfolio. This approach is laudably transparent, and it offers clean exposure to
the low-volatility effect. But because there are no constraints on sector weightings or turnover, the fund can end
up with large sector tilts that change over time. And because it does not consider valuations in its selection
process, the fund can drift across the Morningstar Style Box. It currently nets out in small-blend territory but
has exhibited a greater value tilt in the past. Unlike some of its peers, the fund does not consider correlations
among stocks, which can affect how the portfolio behaves.
Fees
PowerShares charges a low 0.25% expense ratio for this offering, which is reasonable for this strategy and low
relative to the small-value category, supporting the Positive Price Pillar rating. Over the trailing three years
through January 2017, the fund lagged its benchmark by 31 basis points annualized, slightly more than the
amount of its expense ratio. This was likely due to transaction costs.
Alternatives
SPDR SSGA US Small Cap Low Volatility ETF SMLV is the cheapest alternative (0.12% expense ratio). At
the end of December 2016, this fund switched to the SSGA US Small Cap Low Volatility Index from the
Russell 2000 Low Volatility Index. It now targets stocks representing the least volatile 30% of each sector in
the eligible universe and weights its holdings by the inverse of their volatility. This sector-relative approach
keeps the fund's sector weightings more in line with the broader small-cap market. SMLV also measures
volatility over a longer period (five years) than XSLV, which means it will be slower to adjust as volatility
changes. (XSLV, which includes the Quality Factor, is better designed, and has superior performance.)
IShares Edge MSCI Minimum Volatility USA Small-Cap ETF SMMV (0.20% expense ratio) takes a more
holistic approach to reduce volatility. It attempts to construct the least volatile portfolio possible with stocks
from the MSCI USA Small Cap Index. To do this, it uses an optimizer that takes into account each stock’s
volatility, factor exposures, how stocks interact with each other, as well as several constraints. These include
limiting sector tilts and turnover. (While this relatively new ETF, 9/9/16, is on our Watch List, its lack of
liquidity, just under 10 mil. Total Assets, precludes it from consideration for now despite its performance,
which has been nearly as good as XSLV with even less volatility.)
Actively managed Royce Special Equity RYSEX (1.15% expense ratio) may also be worth considering. This
fund carries a Morningstar Analyst Rating of Silver. Managers Charlie Dreifus and Steven McBoyle target
highly profitable small-cap businesses with attractive valuations and conservatively stated financials. They hold
a compact portfolio that has exhibited lower volatility than the S&P SmallCap 600 Index over the past decade.
More importantly, the fund has distinguished itself during market downturns and will likely continue to do so in
the future. (The much cheaper XSLV has significantly outperformed since inception. RYSEX is another
example of active management not adding value.)
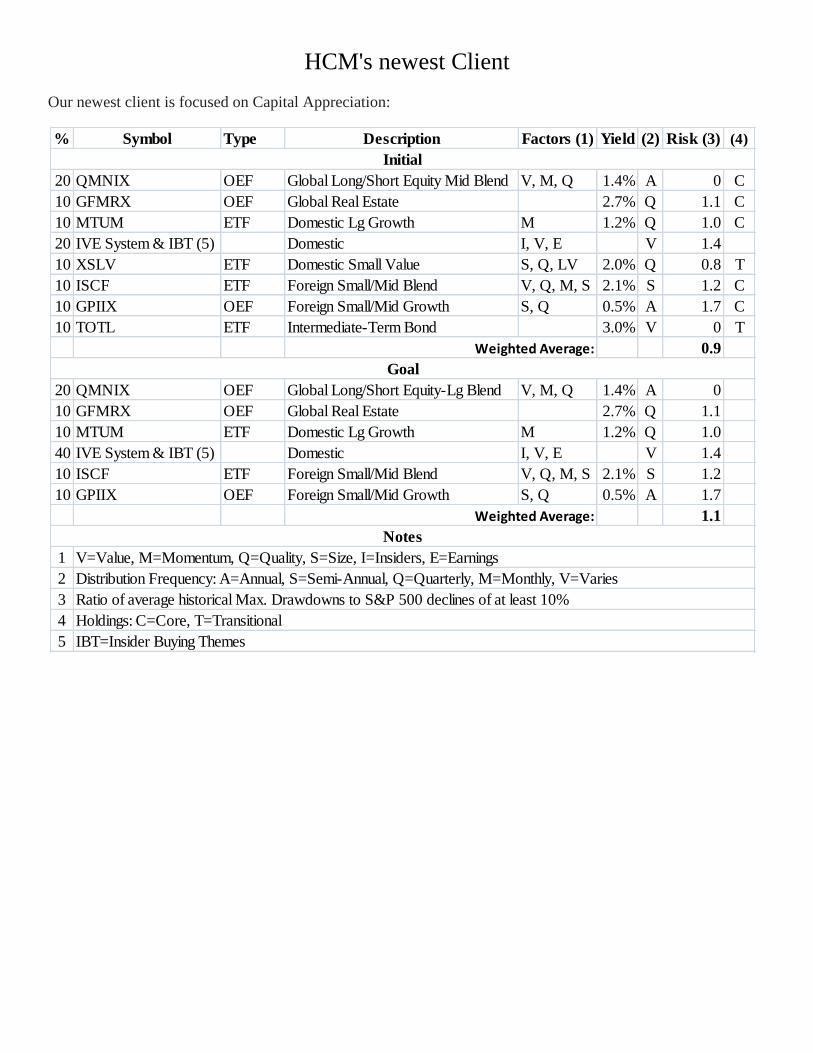
HCM's newest Client
Our newest client is focused on Capital Appreciation:
% Symbol Type Description Factors (1) Yield (2) Risk (3) (4)
20 QMNIX OEF Global Long/Short Equity Mid Blend V, M, Q 1.4% A 0 C
10 GFMRX OEF Global Real Estate 2.7% Q 1.1 C
10 MTUM ETF Domestic Lg Growth M 1.2% Q 1.0 C
20 IVE System & IBT (5) Domestic I, V, E V 1.4
10 XSLV ETF Domestic Small Value S, Q, LV 2.0% Q 0.8 T
10 ISCF ETF Foreign Small/Mid Blend V, Q, M, S 2.1% S 1.2 C
10 GPIIX OEF Foreign Small/Mid Growth S, Q 0.5% A 1.7 C
10 TOTL ETF Intermediate-Term Bond 3.0% V 0 T
0.9
20 QMNIX OEF Global Long/Short Equity-Lg Blend V, M, Q 1.4% A 0
10 GFMRX OEF Global Real Estate 2.7% Q 1.1
10 MTUM ETF Domestic Lg Growth M 1.2% Q 1.0
40 IVE System & IBT (5) Domestic I, V, E V 1.4
10 ISCF ETF Foreign Small/Mid Blend V, Q, M, S 2.1% S 1.2
10 GPIIX OEF Foreign Small/Mid Growth S, Q 0.5% A 1.7
1.1
1
2
3
4
5
Distribution Frequency: A=Annual, S=Semi-Annual, Q=Quarterly, M=Monthly, V=Varies
Ratio of average historical Max. Drawdowns to S&P 500 declines of at least 10%
Holdings: C=Core, T=Transitional
IBT=Insider Buying Themes
Initial
Weighted Average:
Goal
Weighted Average:
Notes
V=Value, M=Momentum, Q=Quality, S=Size, I=Insiders, E=Earnings