us economic briefing: social welfare in · pdf file · 2018-02-28table of contents...
TRANSCRIPT

US Economic Briefing:Social Welfare In America
Yardeni Research, Inc.
May 10, 2018
Dr. Edward Yardeni516-972-7683
Mali Quintana480-664-1333
Please visit our sites atwww.yardeni.comblog.yardeni.com
thinking outside the box

Table Of Contents Table Of ContentsTable Of Contents
May 10, 2018 / US Economic Briefing: Social Welfare In America www.yardeni.com
Yardeni Research, Inc.
Personal Income Relative to GDP 1-2Personal Income Shares 3-5US Government Social Benefits 6US Government Social Benefits Deficit 7US Treasury Social Benefits Outlays 8US Treasury FICA Receipts 9US Treasury Social Benefits Deficit 10Social Benefits Per Capita 11-12Dependency Ratios 13PCE: Health Care 14Medicare & Medicaid 15-17Federal Trust Funds 18-19Supplements in Compensation vs Gvt Social Benefits 20

47 49 51 53 55 57 59 61 63 65 67 69 71 73 75 77 79 81 83 85 87 89 91 93 95 97 99 01 03 05 07 09 11 13 15 17 1968
70
72
74
76
78
80
82
84
86
88
68
70
72
74
76
78
80
82
84
86
88
Q1
PERSONAL INCOME: TOTAL vs. EX GOVERNMENT BENEFITS PAYMENTS(percent of GDP)
Personal Income:TotalPersonal Income: ExcludingUS Government Social Benefitsto Persons
Source: Bureau of Economic Analysis.
yardeni.com
Figure 1.
47 49 51 53 55 57 59 61 63 65 67 69 71 73 75 77 79 81 83 85 87 89 91 93 95 97 99 01 03 05 07 09 11 13 15 17 1942
44
46
48
50
52
54
56
58
60
62
42
44
46
48
50
52
54
56
58
60
62
Q1
PERSONAL INCOME: COMPENSATION vs. WAGES & SALARIES(percent of GDP)
Personal Income:Compensation of Employees
Personal Income:Wage & Salary Disbursements
Source: Bureau of Economic Analysis.
yardeni.com
Figure 2.
Personal Income Relative to GDP
Page 1 / May 10, 2018 / US Economic Briefing: Social Welfare In America www.yardeni.com
Yardeni Research, Inc.

59 61 63 65 67 69 71 73 75 77 79 81 83 85 87 89 91 93 95 97 99 01 03 05 07 09 11 13 15 17 193.5
4.5
5.5
6.5
7.5
8.5
9.5
10.5
11.5
12.5
13.5
14.5
15.5
16.5
3.5
4.5
5.5
6.5
7.5
8.5
9.5
10.5
11.5
12.5
13.5
14.5
15.5
16.5
Q1
Q1
PERSONAL INCOME: SUPPLEMENTS vs. GOVERNMENT BENEFIT PAYMENTS(percent of GDP)
Personal Income:Supplements to Wages & Salaries*
Personal Income: US Government Social Benefits to Persons
* Included in compensation.Source: Bureau of Economic Analysis.
yardeni.com
Figure 3.
59 61 63 65 67 69 71 73 75 77 79 81 83 85 87 89 91 93 95 97 99 01 03 05 07 09 11 13 15 17 1950
55
60
65
70
50
55
60
65
70
Q1
PERSONAL INCOME: COMPENSATION OF EMPLOYEES WITH & WITHOUTGOVERNMENT BENEFITS(percent of GDP)
Personal Income:Compensation of Employees PlusUS Government Social Benefits to Persons
Personal Income: Compensation of Employees
Source: Bureau of Economic Analysis.
yardeni.com
Figure 4.
Personal Income Relative to GDP
Page 2 / May 10, 2018 / US Economic Briefing: Social Welfare In America www.yardeni.com
Yardeni Research, Inc.

59 61 63 65 67 69 71 73 75 77 79 81 83 85 87 89 91 93 95 97 99 01 03 05 07 09 11 13 15 17 1945
50
55
60
65
70
75
80
45
50
55
60
65
70
75
80
Mar
Mar
COMPENSATION OF EMPLOYEES(percent of personal income)
Total
Wages & Salaries
Source: Bureau of Economic Analysis.
yardeni.com
Figure 5.
59 61 63 65 67 69 71 73 75 77 79 81 83 85 87 89 91 93 95 97 99 01 03 05 07 09 11 13 15 17 195
10
15
20
5
10
15
20
Mar
Mar
SUPPLEMENTS IN COMPENSATION vs. GOVERNMENT SOCIAL BENEFITS TO PERSONS(percent of personal income)
Government Social Benefits
Supplements to Wages & Salaries
Source: Bureau of Economic Analysis.
yardeni.com
Figure 6.
Personal Income Shares
Page 3 / May 10, 2018 / US Economic Briefing: Social Welfare In America www.yardeni.com
Yardeni Research, Inc.

60 62 64 66 68 70 72 74 76 78 80 82 84 86 88 90 92 94 96 98 00 02 04 06 08 10 12 14 16 18 205
10
15
20
25
5
10
15
20
25
Mar
UNEARNED PERSONAL INCOME(percent of personal income)
Proprietors’ Income (with IVA & CCadj)Plus Rental Income (with CCAdj)
Personal Income on Assets
Source: Bureau of Economic Analysis.
yardeni.com
Figure 7.
60 62 64 66 68 70 72 74 76 78 80 82 84 86 88 90 92 94 96 98 00 02 04 06 08 10 12 14 16 18 2010
15
20
25
10
15
20
25
Mar
PERSONAL PAYROLL & INCOME TAXES(percent of personal income)
Source: Bureau of Economic Analysis.
yardeni.com
Figure 8.
Personal Income Shares
Page 4 / May 10, 2018 / US Economic Briefing: Social Welfare In America www.yardeni.com
Yardeni Research, Inc.

60 62 64 66 68 70 72 74 76 78 80 82 84 86 88 90 92 94 96 98 00 02 04 06 08 10 12 14 16 18 2070
75
80
85
90
95
70
75
80
85
90
95
Mar
COMPENSATION OF EMPLOYEES EXCLUDING GOVERNMENT SOCIAL BENEFITS TO PERSONS(percent of compensation of employees)
Source: Bureau of Economic Analysis.
yardeni.com
Figure 9.
60 62 64 66 68 70 72 74 76 78 80 82 84 86 88 90 92 94 96 98 00 02 04 06 08 10 12 14 16 18 2060
65
70
75
80
85
90
60
65
70
75
80
85
90
Mar
Mar
US GOVERNMENT SOCIAL BENEFITS TO PERSONS &COMPENSATION OF EMPLOYEES(percent of personal income)
Compensation of Employees
Compensation of Employees PlusGovernment Social Benefits to Persons
Source: Bureau of Economic Analysis.
yardeni.com
Figure 10.
Personal Income Shares
Page 5 / May 10, 2018 / US Economic Briefing: Social Welfare In America www.yardeni.com
Yardeni Research, Inc.

60 62 64 66 68 70 72 74 76 78 80 82 84 86 88 90 92 94 96 98 00 02 04 06 08 10 12 14 16 18 2020
520
1020
1520
202025203020
20
520
1020
1520
202025203020 MarUS GOVERNMENT SOCIAL BENEFITS TO PERSONS*
(billion dollars, ratio scale)
Government Social Benefits to Persons*(saar)
Federal Outlays on Social Security, Income Security,Veterans Benefits, Medicare, & Medicaid(12-month sum)
Source: Bureau of Economic Analysis and US Treasury.* Included in personal income.
yardeni.com
Figure 11.
60 62 64 66 68 70 72 74 76 78 80 82 84 86 88 90 92 94 96 98 00 02 04 06 08 10 12 14 16 18 205
10
15
20
5
10
15
20
Mar
US GOVERNMENT SOCIAL BENEFITS TO PERSONS*(percent of personal income)
* Included in personal income.Source: Bureau of Economic Analysis.
yardeni.com
Figure 12.
US Government Social Benefits
Page 6 / May 10, 2018 / US Economic Briefing: Social Welfare In America www.yardeni.com
Yardeni Research, Inc.

60 62 64 66 68 70 72 74 76 78 80 82 84 86 88 90 92 94 96 98 00 02 04 06 08 10 12 14 16 18 2020
420
820
1220
16202020242028203220
20
420
820
1220
16202020242028203220
MarUS GOVERNMENT SOCIAL BENEFITS OUTLAYS & RECEIPTS*(billion dollars, saar, ratio scale)
Contributions for Government Social Insurance plusEmployer Contributions for Government Social Insurance
Government Social Benefits to Persons
Source: Bureau of Economic Analysis.* Included in personal income.
yardeni.com
Figure 13.
60 62 64 66 68 70 72 74 76 78 80 82 84 86 88 90 92 94 96 98 00 02 04 06 08 10 12 14 16 18 20-200
0
200
400
600
800
1000
-200
0
200
400
600
800
1000
Mar
US GOVERNMENT SOCIAL BENEFITS DEFICIT*(billion dollars, saar)
* Government social benefits to persons less contributions for government social insurance plus employer contributions for government social insurance.Source: Bureau of Economic Analysis.
yardeni.com
Figure 14.
US Government Social Benefits Deficit
Page 7 / May 10, 2018 / US Economic Briefing: Social Welfare In America www.yardeni.com
Yardeni Research, Inc.

87 88 89 90 91 92 93 94 95 96 97 98 99 00 01 02 03 04 05 06 07 08 09 10 11 12 13 14 15 16 17 18 19 2060
160
260
360
460
560
660
7608609601060
60
160
260
360
460
560
660
760860960
1060AprUS TREASURY OUTLAYS ON SOCIAL SECURITY, INCOME
SECURITY, MEDICARE(billion dollars, 12-month sum, ratio scale)
Social Security
Income Security
Medicare
Medicaid
Source: US Treasury.
yardeni.com
Figure 15.
87 88 89 90 91 92 93 94 95 96 97 98 99 00 01 02 03 04 05 06 07 08 09 10 11 12 13 14 15 16 17 18 19 2035
45
55
65
35
45
55
65
Apr
Apr
US TREASURY OUTLAYS ON SOCIAL SECURITY, INCOME SECURITY,MEDICARE, & MEDICAID(percent of federal outlays)
Total
Total excluding Medicaid
Source: US Treasury.
yardeni.com
Figure 16.
US Treasury Social Benefits Outlays
Page 8 / May 10, 2018 / US Economic Briefing: Social Welfare In America www.yardeni.com
Yardeni Research, Inc.

87 88 89 90 91 92 93 94 95 96 97 98 99 00 01 02 03 04 05 06 07 08 09 10 11 12 13 14 15 16 17 18280
340
400
460
520
580
640
700
760
820
880
9401000106011201180
280
340
400
460
520
580
640
700
760
820
880
9401000106011201180 Apr
US TREASURY SOCIAL INSURANCE AND RETIREMENT RECEIPTS(billion dollars, 12-month sum, ratio scale)
Source: US Treasury Department, Summary of Receipts by Source, and Outlays by Function of the US Government, Table 9.
yardeni.com
Figure 17.
87 88 89 90 91 92 93 94 95 96 97 98 99 00 01 02 03 04 05 06 07 08 09 10 11 12 13 14 15 16 17 18-8
-6
-4
-2
0
2
4
6
8
10
12
14
16
18
20
-8
-6
-4
-2
0
2
4
6
8
10
12
14
16
18
20
Apr
yardeni.com
US TREASURY SOCIAL INSURANCE AND RETIREMENT RECEIPTS(yearly percent change in 12-month average)
Source: US Treasury Department, Summary of Receipts by Source, and Outlays by Function of the US Government, Table 9.
Figure 18.
US Treasury FICA Receipts
Page 9 / May 10, 2018 / US Economic Briefing: Social Welfare In America www.yardeni.com
Yardeni Research, Inc.
87 88 89 90 91 92 93 94 95 96 97 98 99 00 01 02 03 04 05 06 07 08 09 10 11 12 13 14 15 16 17 18 19 20250
450
650
850
1050
1250
1450
1650
250
450
650
850
1050
1250
1450
1650
Apr
yardeni.com
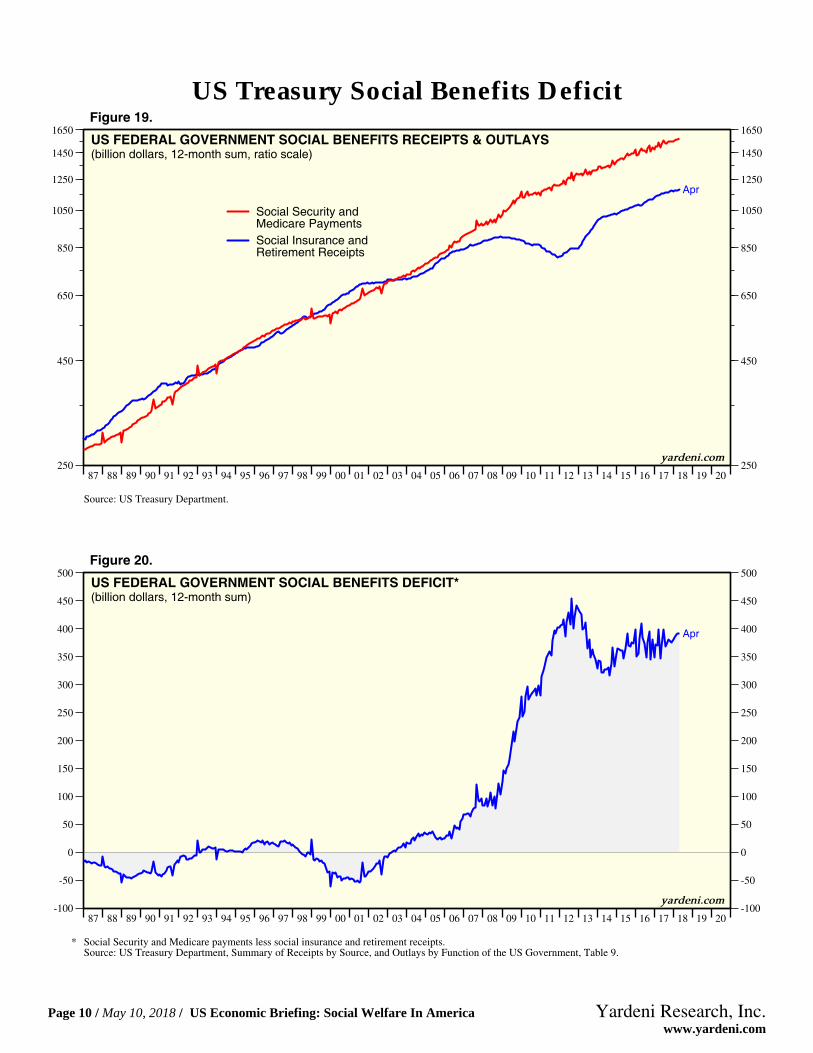
US FEDERAL GOVERNMENT SOCIAL BENEFITS RECEIPTS & OUTLAYS(billion dollars, 12-month sum, ratio scale)
Social Insurance andRetirement Receipts
Social Security andMedicare Payments
Source: US Treasury Department.
Figure 19.
87 88 89 90 91 92 93 94 95 96 97 98 99 00 01 02 03 04 05 06 07 08 09 10 11 12 13 14 15 16 17 18 19 20-100
-50
0
50
100
150
200
250
300
350
400
450
500
-100
-50
0
50
100
150
200
250
300
350
400
450
500
Apr
US FEDERAL GOVERNMENT SOCIAL BENEFITS DEFICIT*(billion dollars, 12-month sum)
Source: US Treasury Department, Summary of Receipts by Source, and Outlays by Function of the US Government, Table 9.* Social Security and Medicare payments less social insurance and retirement receipts.
yardeni.com
Figure 20.
US Treasury Social Benefits Deficit
Page 10 / May 10, 2018 / US Economic Briefing: Social Welfare In America www.yardeni.com
Yardeni Research, Inc.

48 50 52 54 56 58 60 62 64 66 68 70 72 74 76 78 80 82 84 86 88 90 92 94 96 98 00 02 04 06 08 10 12 14 16 18 20 2210
12
14
16
18
20
22
24
26
28
30
32
34
36
38
40
42
44
46
48
50
52
54
10
12
14
16
18
20
22
24
26
28
30
32
34
36
38
40
42
44
46
48
50
52
54
AprWORKING-AGE POPULATION*(millions, nsa)
Civilian Noninstitutional Population:65 & Older
Source: Bureau of Labor Statistics.* Civilian noninstitutional population.
yard
eni.
com
Figure 21.
90 91 92 93 94 95 96 97 98 99 00 01 02 03 04 05 06 07 08 09 10 11 12 13 14 15 16 17 182
4
6
8
10
12
14
16
18
20
2
4
6
8
10
12
14
16
18
20
Apr
AprUS TREASURY OUTLAYS ON SOCIAL SECURITY & MEDICARE DIVIDED BYPOPULATION 65 & OVER(thousand dollars)
Medicare OutlaysPer Senior Citizen
Social Security OutlaysPer Senior Citizen
Source: US Department of Commerce, Bureau of the Census and US Treasury Department.
yardeni.com
Figure 22.
Social Benefits Per Capita
Page 11 / May 10, 2018 / US Economic Briefing: Social Welfare In America www.yardeni.com
Yardeni Research, Inc.

90 91 92 93 94 95 96 97 98 99 00 01 02 03 04 05 06 07 08 09 10 11 12 13 14 15 16 17 1810
15
20
25
30
35
40
45
50
55
60
10
15
20
25
30
35
40
45
50
55
60
Apr
Apr
US TREASURY OUTLAYS ON SOCIAL SECURITY PLUS MEDICARE DIVIDED BYPOPULATION 65 & OVER(ratio scale)
Social Security & Medicare OutlaysPer Senior Citizen(12-month sum, thousand dollars)
Civilian Noninstitutional Population:65 & Older(millions)
Source: US Department of Commerce, Bureau of the Census, Bureau of Labor Statistics, and US Treasury Department.
yardeni.com
Figure 23.
1995 2000 2005 2010 2015 2020 2025 2030 2035 2040 2045 205030
40
50
60
70
80
90
30
40
50
60
70
80
90RESIDENT POPULATION PROJECTION: 65 YEARS OLD & OLDER(millions)
Actual
Forecast
Source: Census Bureau.
yard
eni.
com
Figure 24.
Social Benefits Per Capita
Page 12 / May 10, 2018 / US Economic Briefing: Social Welfare In America www.yardeni.com
Yardeni Research, Inc.

19952000
20052010
20152020
20252030
20352040
20452050
10
15
20
25
10
15
20
25US RESIDENT POPULATION PROJECTION:65 & OLDER DIVIDED BY TOTAL POPULATION(percent)
Actual
Forecast
Source: US Department Commerce, Bureau of the Census.
yard
eni.
com
Figure 25.
80 81 82 83 84 85 86 87 88 89 90 91 92 93 94 95 96 97 98 99 00 01 02 03 04 05 06 07 08 09 10 11 12 13 14 15 16 17 18 19 2014
16
18
20
22
24
26
28
30
32
34
36
14
16
18
20
22
24
26
28
30
32
34
36
Apr
US POPULATION 65 & OVER(percent)
As a Percent of:Total Population* (19.8)Labor Force (31.5)Payroll Employment (34.3)
Source: US Department Commerce, Bureau of the Census.* Civilian noninstitutional populuation.
yardeni.com
Figure 26.
Dependency Ratios
Page 13 / May 10, 2018 / US Economic Briefing: Social Welfare In America www.yardeni.com
Yardeni Research, Inc.

Figure 27.
2000 2001 2002 2003 2004 2005 2006 2007 2008 2009 2010 2011 2012 2013 2014 2015 2016 2017 2018800
1000
1200
1400
1600
1800
2000
2200
2400
800
1000
1200
1400
1600
1800
2000
2200
2400MarPERSONAL CONSUMPTION: HEALTH CARE GOODS & SERVICES
(billion dollars, 12-month sum, ratio scale)
Health Care Services
2000 2001 2002 2003 2004 2005 2006 2007 2008 2009 2010 2011 2012 2013 2014 2015 2016 2017 201890
140
190
240
290
340
390
440
490
90
140
190
240
290
340
390
440
490Mar
Prescription Drugs
2000 2001 2002 2003 2004 2005 2006 2007 2008 2009 2010 2011 2012 2013 2014 2015 2016 2017 2018900
1100
1300
1500
1700
1900
2100
2300
2500
27002900
900
1100
1300
1500
1700
1900
2100
2300
2500
27002900
Mar
Total
Source: Bureau of Economic Analysis.
yardeni.com
PCE: Health Care
Page 14 / May 10, 2018 / US Economic Briefing: Social Welfare In America www.yardeni.com
Yardeni Research, Inc.

1999 2000 2001 2002 2003 2004 2005 2006 2007 2008 2009 2010 2011 2012 2013 2014 2015 2016 2017 2018100
200
300
400
500
600
700
100
200
300
400
500
600
700
AprUS FEDERAL GOVERNMENT OUTLAYS ON MEDICARE & MEDICAID(billion dollars, 12-month sum, ratio scale)
Medicare
Medicaid
Source: US Treasury Department.
yardeni.com
Figure 28.
1999 2000 2001 2002 2003 2004 2005 2006 2007 2008 2009 2010 2011 2012 2013 2014 2015 2016 2017 2018350
450
550
650
750
850
950
1050
1150
1250
1350
1450
350
450
550
650
750
850
950
1050
1150
1250
1350
1450AprUS GOVERNMENT OUTLAYS ON MEDICARE & MEDICAID vs PRIVATE OUTLAYS ON HEALTH CARE
(billion dollars, 12-month sum, ratio scale)
Medicare Plus 2x Federal Medicaid
Private Outlays*
* Personal consumption on health care services plus prescription drugs minus federal outlays on Medicare plus 2x Federal Medicaid.Source: US Treasury Department.
yardeni.com
Figure 29.
Medicare & Medicaid
Page 15 / May 10, 2018 / US Economic Briefing: Social Welfare In America www.yardeni.com
Yardeni Research, Inc.

1999 2000 2001 2002 2003 2004 2005 2006 2007 2008 2009 2010 2011 2012 2013 2014 2015 2016 201740
45
50
55
40
45
50
55US GOVERNMENT OUTLAYS ON MEDICARE & MEDICAID(as a percent of total health care spending)
Medicare (12-month sum)Plus 2x Medicaid (12-month-sum)/PCE Health Care Servicesplus Prescription Drugs (12-month sum)
Source: US Treasury Department and Bureau of Economic Analysis.
yardeni.com
Figure 30.
1999 2000 2001 2002 2003 2004 2005 2006 2007 2008 2009 2010 2011 2012 2013 2014 2015 2016 2017-10
-5
0
5
10
15
20
25
-10
-5
0
5
10
15
20
25US GOVERNMENT & PRIVATE OUTLAYS ON MEDICARE & MEDICAID(yearly percent change)
PCE Health Care Servicesplus Prescription Drugs (12-month sum) MinusMedicare (12-month sum)Plus Medicaid 2x (12-month sum Medicaid)
Medicare (12-month sum)Plus Medicaid 2x (12-month sum Medicaid)
Source: US Treasury Department.
yardeni.com
Figure 31.
Medicare & Medicaid
Page 16 / May 10, 2018 / US Economic Briefing: Social Welfare In America www.yardeni.com
Yardeni Research, Inc.

1999 2000 2001 2002 2003 2004 2005 2006 2007 2008 2009 2010 2011 2012 2013 2014 2015 2016 2017-10
-5
0
5
10
15
20
25
-10
-5
0
5
10
15
20
25US GOVERNMENT MEDICARE & MEDICAID(yearly percent change)
Medicare Plus 2xFederal Medicaid
Source: US Treasury Department.
yardeni.com
Figure 32.
1999 2000 2001 2002 2003 2004 2005 2006 2007 2008 2009 2010 2011 2012 2013 2014 2015 2016 2017-20
-15
-10
-5
0
5
10
15
20
25
30
35
-20
-15
-10
-5
0
5
10
15
20
25
30
35US FEDERAL GOVERNMENT OUTLAYS ON MEDICARE & MEDICAID(yearly percent change)
Medicare
Medicaid
Source: US Treasury Department.
yardeni.com
Figure 33.
Medicare & Medicaid
Page 17 / May 10, 2018 / US Economic Briefing: Social Welfare In America www.yardeni.com
Yardeni Research, Inc.

1998 1999 2000 2001 2002 2003 2004 2005 2006 2007 2008 2009 2010 2011 2012 2013 2014 2015 2016 20170
500
1000
1500
2000
2500
3000
0
500
1000
1500
2000
2500
3000US FEDERAL GOVERNMENT TRUST FUNDS(billion dollars)
Federal Disability Insurance Trust FundFederal Hospital Insurance Trust Fund
Federal Old-Age and SurvivorsInsurance Trust Fund
Source: US Treasury Department, Detail Of Treasury Securities Outstanding, Table III.
yarden
i.com
Figure 34.
1998 1999 2000 2001 2002 2003 2004 2005 2006 2007 2008 2009 2010 2011 2012 2013 2014 2015 2016 2017-50
0
50
100
150
200
-50
0
50
100
150
200US FEDERAL GOVERNMENT TRUST FUNDS(billion dollars, yearly change)
Federal Disability Insurance Trust Fund
Federal Hospital Insurance Trust Fund
Federal Old-Age and Survivors Insurance Trust Fund
Source: US Treasury Department, Detail Of Treasury Securities Outstanding, Table III.
yardeni.com
Figure 35.
Federal Trust Funds
Page 18 / May 10, 2018 / US Economic Briefing: Social Welfare In America www.yardeni.com
Yardeni Research, Inc.

2002 2003 2004 2005 2006 2007 2008 2009 2010 2011 2012 2013 2014 2015 2016 2017 20182500
3000
3500
4000
4500
5000
5500
6000
6500
2500
3000
3500
4000
4500
5000
5500
6000
6500
Apr
US FEDERAL GOVERNMENT PUBLIC DEBT OUTSTANDING: NONMARKETABLE(billions of dollars)
Intergovernmental HeldTreasury Securities Outstanding:Nonmarketable
Source: US Treasury.
yardeni.com
Figure 36.
2002 2003 2004 2005 2006 2007 2008 2009 2010 2011 2012 2013 2014 2015 2016 2017-100
0
100
200
300
400
500
-100
0
100
200
300
400
500US FEDERAL GOVERNMENT PUBLIC DEBT OUTSTANDING: NONMARKETABLE(billions of dollars, yearly change)
Intergovernmental HeldTreasury Securities Outstanding:Nonmarketable
Source: US Treasury.
yardeni.com
Figure 37.
Federal Trust Funds
Page 19 / May 10, 2018 / US Economic Briefing: Social Welfare In America www.yardeni.com
Yardeni Research, Inc.

59 61 63 65 67 69 71 73 75 77 79 81 83 85 87 89 91 93 95 97 99 01 03 05 07 09 11 13 15 17 1910
15
20
25
30
35
10
15
20
25
30
35
Mar
SUPPLEMENTS IN COMPENSATION vs GOVERNMENT SOCIAL BENEFITS TO PERSONS(percent of personal income)
Government Social Benefits + Supplements to Wages & Salaries
Source: Bureau of Economic Analysis.
yardeni.com
Figure 38.
Supplements in Compensation vs Gvt Social Benefits
Page 20 / May 10, 2018 / US Economic Briefing: Social Welfare In America www.yardeni.com
Yardeni Research, Inc.

http://blog.yardeni.com
http://blog.yardeni.com
Copyright (c) Yardeni Research, Inc. 2018. All rights reserved. The informationcontained herein has been obtained from sources believed to be reliable, but is notnecessarily complete and its accuracy cannot be guaranteed. No representation orwarranty, express or implied, is made as to the fairness, accuracy, completeness, orcorrectness of the information and opinions contained herein. The views and the otherinformation provided are subject to change without notice. All reports posted onwww.yardeni.com, blog.yardeni.com, and YRI’s Apps for iPads and iPhones are issuedwithout regard to the specific investment objectives, financial situation, or particular needsof any specific recipient and are not to be construed as a solicitation or an offer to buy or sellany securities or related financial instruments. Past performance is not necessarily a guideto future results. Company fundamentals and earnings may be mentioned occasionally, butshould not be construed as a recommendation to buy, sell, or hold the company’s stock.Predictions, forecasts, and estimates for any and all markets should not be construed asrecommendations to buy, sell, or hold any security--including mutual funds, futurescontracts, and exchange traded funds, or any similar instruments.
The text, images, and other materials contained or displayed on any Yardeni Research, Inc.product, service, report, email or website are proprietary to Yardeni Research, Inc. andconstitute valuable intellectual property. No material from any part of www.yardeni.com, blog.yardeni.com, and YRI’s Apps for iPads and iPhones may be downloaded, transmitted,broadcast, transferred, assigned, reproduced or in any other way used or otherwisedisseminated in any form to any person or entity, without the explicit written consent ofYardeni Research, Inc. All unauthorized reproduction or other use of material from YardeniResearch, Inc. shall be deemed willful infringement(s) of this copyright and other proprietaryand intellectual property rights, including but not limited to, rights of privacy. YardeniResearch, Inc. expressly reserves all rights in connection with its intellectual property,including without limitation the right to block the transfer of its products and services and/orto track usage thereof, through electronic tracking technology, and all other lawful means,now known or hereafter devised. Yardeni Research, Inc. reserves the right, without furthernotice, to pursue to the fullest extent allowed by the law any and all criminal and civilremedies for the violation of its rights.
The recipient should check any email and any attachments for the presence of viruses.Yardeni Research, Inc. accepts no liability for any damage caused by any virus transmittedby this company’s emails, website, blog and Apps. Additional information available onrequest.