u.s. drought impacts on the u.s. and international rice...
TRANSCRIPT
1
U.S. Drought Impacts on the U.S. and International Rice Economy
Eddie C. Chaveza
Department of Agricultural Economics & Agribusiness, 217 Agriculture Building, University of Arkansas, Fayetteville, AR 72701; Phone: 479‐575‐6839; Email: [email protected]
and
Eric J. Wailes
Department of Agricultural Economics & Agribusiness, 217 Agriculture Building, University of Arkansas, Fayetteville, AR 72701; Phone: 479‐575‐2256; Email: [email protected]
a The authors are Senior Program Associate and L.C. Carter Endowed Chair and Distinguished Professor of Agricultural Economics at the Department of Agricultural Economics and Agribusiness ‐ University of Arkansas (Fayetteville), respectively. We gratefully acknowledge the funding for this research provided by the Arkansas Rice Research and Promotion Board and the L.C. Carter Endowment.
Selected Paper Prepared for Presentation at the Southern Agricultural Economics Association (SAEA) Meetings, Orlando, Florida, February 2‐5, 2013
Copyright 2013 by Eddie C. Chavez and Eric J. Wailes. All rights reserved. Readers may make verbatim copies of this document for non‐commercial purposes by any means, provided this copyright notice appears on all such copies.

2
Abstract
Impact of the U.S. drought on the global rice economy is limited because major exporters hold
large stocks, but food deficit nations face food security challenges. Relative prices of corn,
soybeans, and wheat to rice, result in rice consumption, trade, and supply responses notably in
China, U.S., and Indonesia.
Key Words: Drought, rice, relative prices, substitute crops, AGRM
Introduction
Extreme volatility of food commodity prices has been an overriding issue in various agricultural
forums since the occurrence of the food price crisis in 2007/08 season, which triggered riots in a
number of countries. The primary driver of concern is food security in developing countries, and
price and income effects in general. Food security and food self-sufficiency issues are typically a
priority for governments of many countries, especially the food-deficit economies in Asia.
The recent drought in the U.S. and other parts of the world caused spikes in prices of major
agricultural commodities such as corn, soybeans, and wheat. Figures 1 and 2 show two maps that
give color indication of the progression of the drought in the U.S. from August 21, 2012 to
January 8, 2013 (U.S. Drought Monitor, 2013).

The U.S. DrLincoln, the
Figure 1.
The U.S. DrLincoln, the
Figure 2.
ought Monitor is United States De
. Map of the
ought Monitor is United States De
. Map of the
produced in parepartment of Agr
extent of U.
produced in parepartment of Agr
extent of U.
rtnership betweenriculture, and the
.S. Drought
rtnership betweenriculture, and the
.S. Drought
n the National Dre National Ocean
as of Augus
n the National Dre National Ocean
as of Januar
rought Mitigationnic and Atmosph
st 21, 2012.
rought Mitigationnic and Atmosph
ry 8, 2013.
n Center at the Ueric Administrati
n Center at the Ueric Administrati
University of Nebron.
University of Nebron.
3
raska-
raska-
4
In December 2012, USDA reported that the most severe and extensive drought in at least 25
years is seriously affecting U.S. agriculture, with impacts on the crop and livestock sectors, with
the potential to affect food prices at the retail level. Crop production estimates for several major
crops declined throughout the summer as the drought intensified, and by November, production
estimates declined for corn by 27.5% and for soybeans by 7 percent, compared to the May
estimates—as substantial reductions in both crop yields and share of harvested acres occurred
(USDA, 2012).
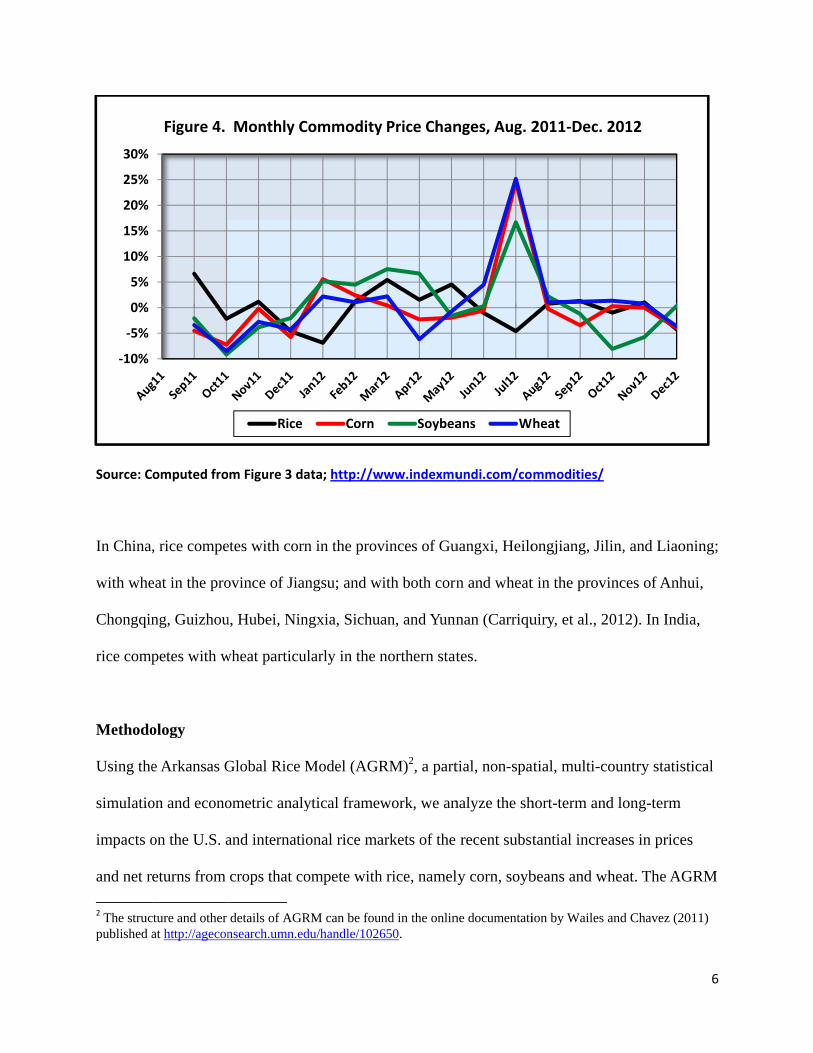
Consequently, global food prices jumped 10% from June to July 2012, driven primarily by the
severe Midwest drought (World Bank as cited by Lopez, 2012). Considering that the U.S. is the
world’s largest exporter of corn and soybeans, the current drought in the U.S. has global impacts.
The price of corn and wheat rose by 25%, and that of soybeans rose by 17% during the same
period. Surprisingly, rice price was relatively stable during the same period (Figures 3 and 4).
The reason is that rice is an irrigated crop and hence relatively unaffected by drought.
Figure 3 indicates the monthly average prices for rice and the other commodities. The average
rice price declined while the rest of the prices spiked and remained elevated at least through
October 2012. In fact, rice prices continued to remain stable at the lower prices; and even
declined further in December. Another reason for this rice price behavior is that world rice has
been a buyers’ market due to the abundant supplies in major exporting countries such as India,
Vietnam, and Thailand—mainly from surplus stocks. As such, strong price competition for
limited import market has emerged among the major players in global rice trade.
Soybean prices stabilized at the high level in August and September; and started to decline
thereafter but remained higher than the pre-drought level by December. Wheat prices continue

to climb
stabilized
level is st
This pape
on the U.
crops for
including
Mississip
Source: h
1 The estimmedium grhttp://agec
$20
$30
$40
$50
$60
$70
until Novem
d at the high
till much hig
er explores t
.S. and intern
r rice in the U
g soybeans, c
ppi, Texas, a
ttp://www.in
mated elasticitierain) and by loconsearch.umn.
00
00
00
00
00
00
Figure 3
mber albeit sl
level in Aug
gher than the
the impact o
national rice
U.S. and oth
corn, and co
nd Californi
ndexmundi.c
es of the relativcation; and can.edu/handle/10
Rice
3. Monthly
lowly before
gust and star
e pre-drough
f the recent
e markets, co
er countries
tton in rice-p
ia.1
com/commod
ve net returns fn be found in th2650.
Corn
Commodit
e declining s
rted a slight
ht level.
substantial p
onsidering th
. Rice area c
producing st
dities/
from substitutehe AGRM doc
Soybea
ty Prices, $/
slightly in De
downward t
price spikes
hat these com
competes wi
tates of Arka
e crops vary bycumentation pu
ans W
/MT, Aug. 2
ecember. Co
trend since th
in corn, soyb
mmodities ar
ith a number
ansas, Louis
y rice type (i.e.ublished online
heat
2011‐Dec. 2
orn prices
hen, althoug
beans, and w
re substitute
r of crops
iana, Missou
, long grain or e at
2012
5
gh the
wheat
uri,
Source: C
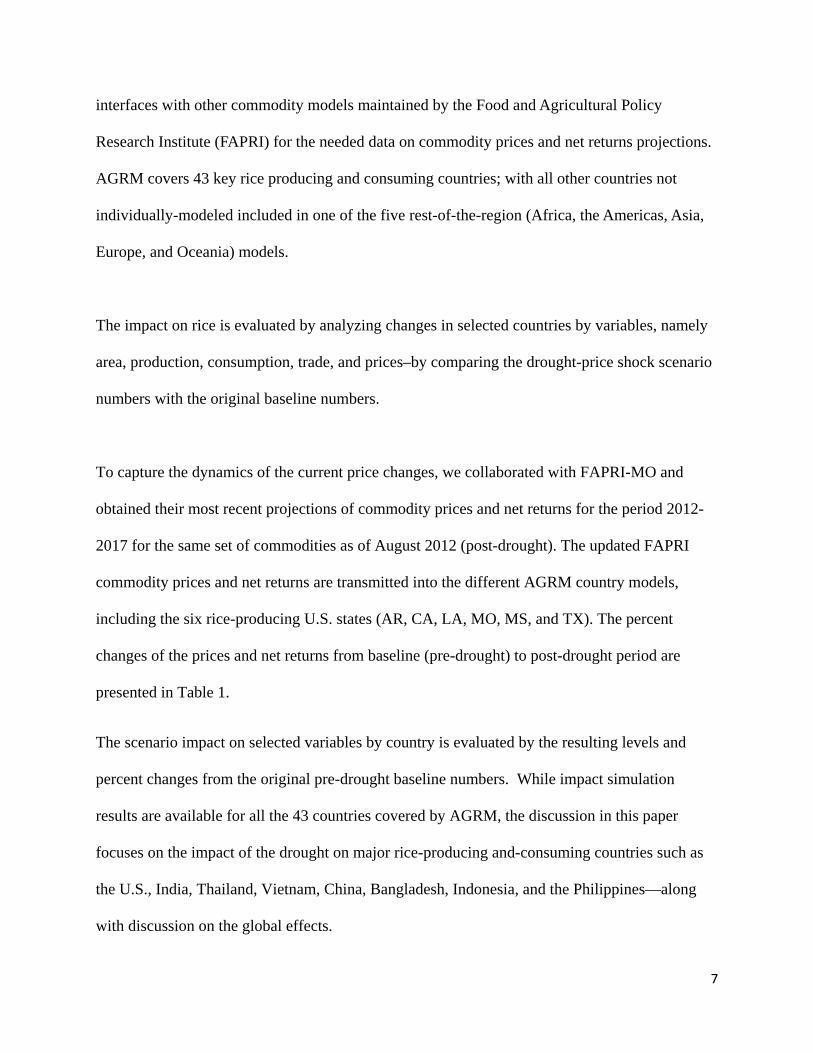
In China
with whe
Chongqin
rice comp
Methodo
Using the
simulatio
impacts o
and net r
2 The strucpublished a
‐10%
‐5%
0%
5%
10%
15%
20%
25%
30%
omputed fro
, rice compe
eat in the pro
ng, Guizhou
petes with w
ology
e Arkansas G
on and econo
on the U.S. a
eturns from
cture and other at http://agecon
Figure 4.
m Figure 3 da
etes with corn
ovince of Jia
u, Hubei, Nin
wheat particu
Global Rice
ometric analy
and internati
crops that co
details of AGR
nsearch.umn.ed
Rice
Monthly C
ata; http://w
n in the prov
angsu; and w
ngxia, Sichu
ularly in the n
Model (AGR
ytical framew
ional rice ma
ompete with
RM can be foudu/handle/1026
Corn
Commodity
www.indexmu
vinces of Gu
with both corn
an, and Yunn
northern stat
RM)2, a part
work, we an
arkets of the
h rice, namel
und in the onlin650.
Soybea
y Price Chan
undi.com/co
uangxi, Heilo
n and wheat
nan (Carriqu
tes.
tial, non-spa
nalyze the sh
recent subst
ly corn, soyb
ne documentati
ans W
nges, Aug. 2
mmodities/
ongjiang, Jil
t in the provi
uiry, et al., 2
atial, multi-co
hort-term and
tantial increa
beans and wh
ion by Wailes a
heat
2011‐Dec. 2
lin, and Liao
inces of Anh
012). In Ind
ountry statis
d long-term
ases in price
heat. The AG
and Chavez (2
2012
6
oning;
hui,
dia,
stical
es
GRM
011)
7
interfaces with other commodity models maintained by the Food and Agricultural Policy
Research Institute (FAPRI) for the needed data on commodity prices and net returns projections.
AGRM covers 43 key rice producing and consuming countries; with all other countries not
individually-modeled included in one of the five rest-of-the-region (Africa, the Americas, Asia,
Europe, and Oceania) models.
The impact on rice is evaluated by analyzing changes in selected countries by variables, namely
area, production, consumption, trade, and prices–by comparing the drought-price shock scenario
numbers with the original baseline numbers.
To capture the dynamics of the current price changes, we collaborated with FAPRI-MO and
obtained their most recent projections of commodity prices and net returns for the period 2012-
2017 for the same set of commodities as of August 2012 (post-drought). The updated FAPRI
commodity prices and net returns are transmitted into the different AGRM country models,
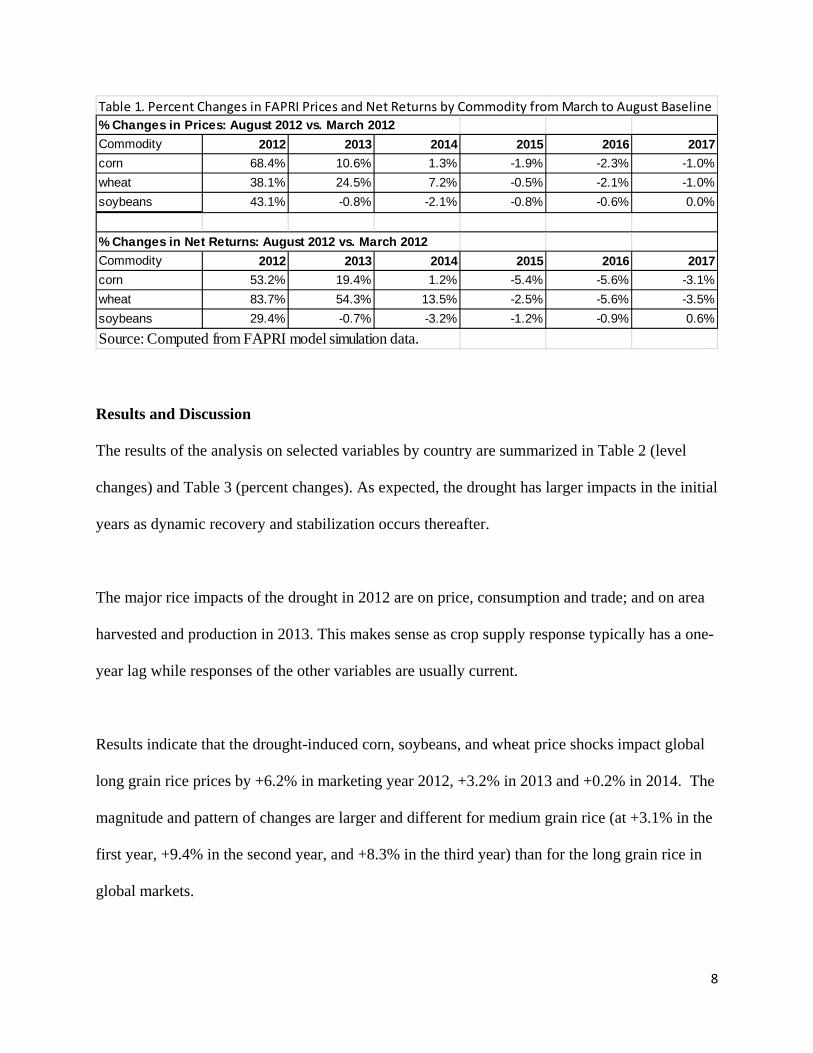
including the six rice-producing U.S. states (AR, CA, LA, MO, MS, and TX). The percent
changes of the prices and net returns from baseline (pre-drought) to post-drought period are
presented in Table 1.
The scenario impact on selected variables by country is evaluated by the resulting levels and
percent changes from the original pre-drought baseline numbers. While impact simulation
results are available for all the 43 countries covered by AGRM, the discussion in this paper
focuses on the impact of the drought on major rice-producing and-consuming countries such as
the U.S., India, Thailand, Vietnam, China, Bangladesh, Indonesia, and the Philippines—along
with discussion on the global effects.
8
Results and Discussion
The results of the analysis on selected variables by country are summarized in Table 2 (level
changes) and Table 3 (percent changes). As expected, the drought has larger impacts in the initial
years as dynamic recovery and stabilization occurs thereafter.
The major rice impacts of the drought in 2012 are on price, consumption and trade; and on area
harvested and production in 2013. This makes sense as crop supply response typically has a one-
year lag while responses of the other variables are usually current.
Results indicate that the drought-induced corn, soybeans, and wheat price shocks impact global
long grain rice prices by +6.2% in marketing year 2012, +3.2% in 2013 and +0.2% in 2014. The
magnitude and pattern of changes are larger and different for medium grain rice (at +3.1% in the
first year, +9.4% in the second year, and +8.3% in the third year) than for the long grain rice in
global markets.
Table 1. Percent Changes in FAPRI Prices and Net Returns by Commodity from March to August Baseline
% Changes in Prices: August 2012 vs. March 2012
Commodity 2012 2013 2014 2015 2016 2017
corn 68.4% 10.6% 1.3% -1.9% -2.3% -1.0%
wheat 38.1% 24.5% 7.2% -0.5% -2.1% -1.0%
soybeans 43.1% -0.8% -2.1% -0.8% -0.6% 0.0%
% Changes in Net Returns: August 2012 vs. March 2012
Commodity 2012 2013 2014 2015 2016 2017
corn 53.2% 19.4% 1.2% -5.4% -5.6% -3.1%
wheat 83.7% 54.3% 13.5% -2.5% -5.6% -3.5%
soybeans 29.4% -0.7% -3.2% -1.2% -0.9% 0.6%
Source: Computed from FAPRI model simulation data.
9
The long grain prices continue to decline after the third year and stabilize by 2020. However, the
medium grain prices remain relatively strong over the next seven years. These results indicate
that the medium grain rice price is more responsive to the scenario than the long grain rice price,
the reason being that international trade in medium grain is much smaller than the long grain and
increasingly more important in China’s rice consumption.
There is a lagged supply response of one year hence the impact in area harvested starts in 2013.
Rice area harvested in the U.S. contracts by -6.1% in 2013, -5.3% in 2014, and -2.8% in 2015,
before stabilizing in 2016. U.S. area harvested increases thereafter, as medium grain area
responds positively to the relatively strong medium grain prices.
The declines in U.S. rice area harvested in 2013 and 2014 are accounted for largely by the three
rice-producing states of California (-48 thousand acres in 2013 and -66 thousand acres in 2014),
Louisiana (-44 thousand acres in 2013 and -38 thousand acres in 2014), and Texas (-30 thousand
acres in 2013 and -38 thousand acres in 2014). These two-year area declines are equivalent to -
14% and -12% for California; -10% and -8% for Louisiana; and -22% and -24% for Texas.
The percent impact on Texas rice area harvested is relatively large because the positive impact of
increased returns from rice due to higher rice price is overshadowed by the negative impact of
increased returns from the substitute crop (corn) due to much higher corn price. The same story
is true for Louisiana (soybean as a substitute crop for rice) and California (corn as a substitute
crop for rice), albeit to a lesser degree. The rates of decline in the harvested area of Arkansas,
Missouri and Mississippi during the same period are much milder, ranging from 0.5% to 2.1%.
10
U.S. rice production declines by -6.6% in 2013, -5.8% in 2014, and -3.1% in 2015 and stabilizes
in 2016, after which it increases in tandem with area harvested.
China’s rice area harvested declines by -4.7% in 2013, -2.6% in 2014, and -1.0% in 2015—with
the 2013 impact alone amounting to a decline of 1.4 million hectares which translates to a
contraction of 6.7 million mt of production. China’s area stabilizes starting 2016.
About 80% of the decline in China’s rice area harvested is accounted for by long grain as a
result of substitution from both corn and wheat; medium grain rice is substituted by corn.
World rice area harvested declines by 1.3 million hectares (or -0.8%) in 2013 and 564 thousand
hectares (or -0.4%) in 2014, before relatively stabilizing thereafter. Global rice production is
down by 6.3 million mt (or -1.3%) in 2013 and 2.9 million mt (or -0.6%) before stabilizing.
The downward changes in world rice area and output are accounted for largely by the declines in
China and the U.S.—which are only partially offset by minor increases in the rest of the world
where there is less substitution between rice and corn, soybeans, and wheat.
The changes in relative international prices also induce an expansion in global rice net trade of
682 thousand mt (or +2.2%) in 2012 and 249 thousand mt (or +0.7%) in 2013. World net trade
declines in the following two years; before resuming expansion.
11
World rice consumption expands by 1.8 million mt (or 0.4%) in 2012, 725 thousand mt (or
0.2%) in 2013, then stabilizes thereafter.
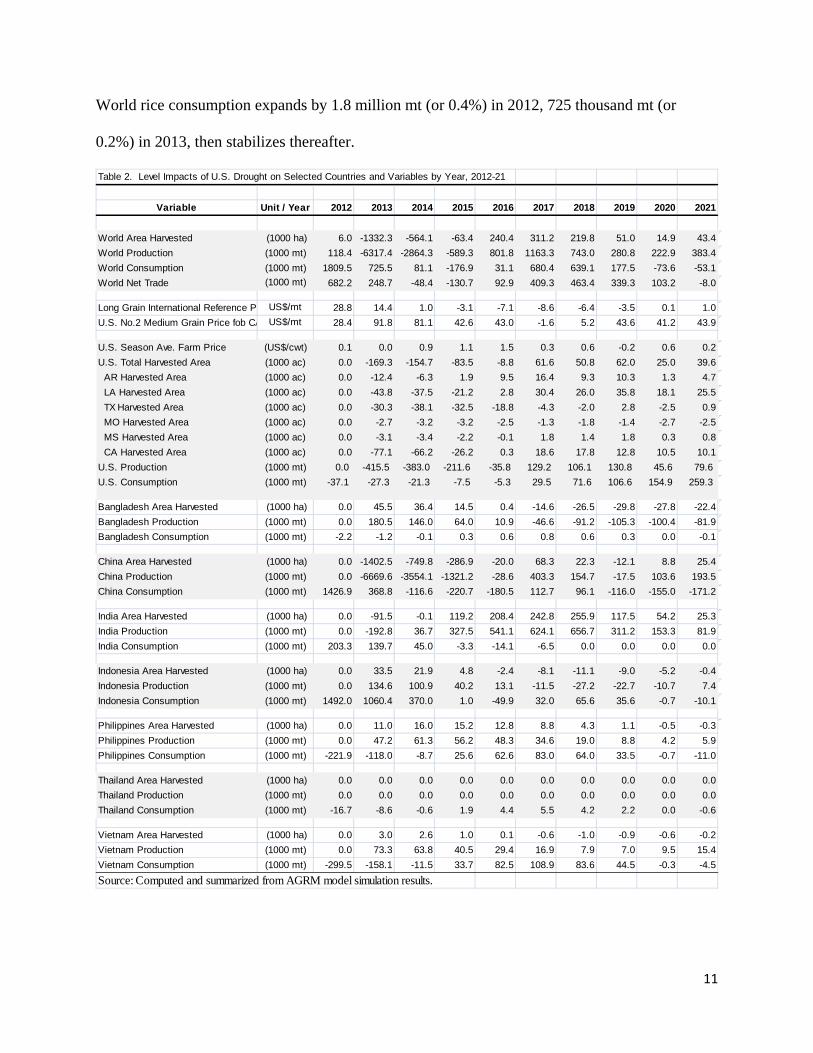
Table 2. Level Impacts of U.S. Drought on Selected Countries and Variables by Year, 2012-21
Variable Unit / Year 2012 2013 2014 2015 2016 2017 2018 2019 2020 2021
World Area Harvested (1000 ha) 6.0 -1332.3 -564.1 -63.4 240.4 311.2 219.8 51.0 14.9 43.4
World Production (1000 mt) 118.4 -6317.4 -2864.3 -589.3 801.8 1163.3 743.0 280.8 222.9 383.4
World Consumption (1000 mt) 1809.5 725.5 81.1 -176.9 31.1 680.4 639.1 177.5 -73.6 -53.1
World Net Trade (1000 mt) 682.2 248.7 -48.4 -130.7 92.9 409.3 463.4 339.3 103.2 -8.0
Long Grain International Reference P US$/mt 28.8 14.4 1.0 -3.1 -7.1 -8.6 -6.4 -3.5 0.1 1.0
U.S. No.2 Medium Grain Price fob CA US$/mt 28.4 91.8 81.1 42.6 43.0 -1.6 5.2 43.6 41.2 43.9
U.S. Season Ave. Farm Price (US$/cwt) 0.1 0.0 0.9 1.1 1.5 0.3 0.6 -0.2 0.6 0.2
U.S. Total Harvested Area (1000 ac) 0.0 -169.3 -154.7 -83.5 -8.8 61.6 50.8 62.0 25.0 39.6
AR Harvested Area (1000 ac) 0.0 -12.4 -6.3 1.9 9.5 16.4 9.3 10.3 1.3 4.7
LA Harvested Area (1000 ac) 0.0 -43.8 -37.5 -21.2 2.8 30.4 26.0 35.8 18.1 25.5
TX Harvested Area (1000 ac) 0.0 -30.3 -38.1 -32.5 -18.8 -4.3 -2.0 2.8 -2.5 0.9
MO Harvested Area (1000 ac) 0.0 -2.7 -3.2 -3.2 -2.5 -1.3 -1.8 -1.4 -2.7 -2.5
MS Harvested Area (1000 ac) 0.0 -3.1 -3.4 -2.2 -0.1 1.8 1.4 1.8 0.3 0.8
CA Harvested Area (1000 ac) 0.0 -77.1 -66.2 -26.2 0.3 18.6 17.8 12.8 10.5 10.1
U.S. Production (1000 mt) 0.0 -415.5 -383.0 -211.6 -35.8 129.2 106.1 130.8 45.6 79.6
U.S. Consumption (1000 mt) -37.1 -27.3 -21.3 -7.5 -5.3 29.5 71.6 106.6 154.9 259.3
Bangladesh Area Harvested (1000 ha) 0.0 45.5 36.4 14.5 0.4 -14.6 -26.5 -29.8 -27.8 -22.4
Bangladesh Production (1000 mt) 0.0 180.5 146.0 64.0 10.9 -46.6 -91.2 -105.3 -100.4 -81.9
Bangladesh Consumption (1000 mt) -2.2 -1.2 -0.1 0.3 0.6 0.8 0.6 0.3 0.0 -0.1
China Area Harvested (1000 ha) 0.0 -1402.5 -749.8 -286.9 -20.0 68.3 22.3 -12.1 8.8 25.4
China Production (1000 mt) 0.0 -6669.6 -3554.1 -1321.2 -28.6 403.3 154.7 -17.5 103.6 193.5
China Consumption (1000 mt) 1426.9 368.8 -116.6 -220.7 -180.5 112.7 96.1 -116.0 -155.0 -171.2
India Area Harvested (1000 ha) 0.0 -91.5 -0.1 119.2 208.4 242.8 255.9 117.5 54.2 25.3
India Production (1000 mt) 0.0 -192.8 36.7 327.5 541.1 624.1 656.7 311.2 153.3 81.9
India Consumption (1000 mt) 203.3 139.7 45.0 -3.3 -14.1 -6.5 0.0 0.0 0.0 0.0
Indonesia Area Harvested (1000 ha) 0.0 33.5 21.9 4.8 -2.4 -8.1 -11.1 -9.0 -5.2 -0.4
Indonesia Production (1000 mt) 0.0 134.6 100.9 40.2 13.1 -11.5 -27.2 -22.7 -10.7 7.4
Indonesia Consumption (1000 mt) 1492.0 1060.4 370.0 1.0 -49.9 32.0 65.6 35.6 -0.7 -10.1
Philippines Area Harvested (1000 ha) 0.0 11.0 16.0 15.2 12.8 8.8 4.3 1.1 -0.5 -0.3
Philippines Production (1000 mt) 0.0 47.2 61.3 56.2 48.3 34.6 19.0 8.8 4.2 5.9
Philippines Consumption (1000 mt) -221.9 -118.0 -8.7 25.6 62.6 83.0 64.0 33.5 -0.7 -11.0
Thailand Area Harvested (1000 ha) 0.0 0.0 0.0 0.0 0.0 0.0 0.0 0.0 0.0 0.0
Thailand Production (1000 mt) 0.0 0.0 0.0 0.0 0.0 0.0 0.0 0.0 0.0 0.0
Thailand Consumption (1000 mt) -16.7 -8.6 -0.6 1.9 4.4 5.5 4.2 2.2 0.0 -0.6
Vietnam Area Harvested (1000 ha) 0.0 3.0 2.6 1.0 0.1 -0.6 -1.0 -0.9 -0.6 -0.2
Vietnam Production (1000 mt) 0.0 73.3 63.8 40.5 29.4 16.9 7.9 7.0 9.5 15.4
Vietnam Consumption (1000 mt) -299.5 -158.1 -11.5 33.7 82.5 108.9 83.6 44.5 -0.3 -4.5
Source: Computed and summarized from AGRM model simulation results.

12
Table 3. Percent Impacts of U.S. Drought on Selected Countries and Variables by Year, 2012-21
Variable Unit / Year 2012 2013 2014 2015 2016 2017 2018 2019 2020 2021
World Area Harvested (1000 ha) 0.0 -0.8 -0.4 0.0 0.2 0.2 0.1 0.0 0.0 0.0
World Production (1000 mt) 0.0 -1.3 -0.6 -0.1 0.2 0.2 0.2 0.1 0.0 0.1
World Consumption (1000 mt) 0.4 0.2 0.0 0.0 0.0 0.1 0.1 0.0 0.0 0.0
World Net Trade (1000 mt) 2.2 0.7 -0.1 -0.4 0.3 1.1 1.3 0.9 0.3 0.0
Long Grain International Reference P US$/mt 6.2 3.2 0.2 -0.7 -1.6 -2.0 -1.5 -0.8 0.0 0.2
U.S. No.2 Medium Grain Price fob CA US$/mt 3.1 9.4 8.3 4.2 4.1 -0.1 0.5 4.1 4.0 4.3
U.S. Season Ave. Farm Price (US$/cwt) 1.0 0.2 6.1 8.1 11.6 1.9 4.6 -1.3 4.4 1.8
U.S. Total Harvested Area (1000 ac) 0.0 -6.1 -5.3 -2.8 -0.3 2.1 1.7 2.1 0.9 1.3
AR Harvested Area (1000 ac) 0.0 -1.0 -0.5 0.1 0.7 1.2 0.7 0.8 0.1 0.4
LA Harvested Area (1000 ac) 0.0 -10.1 -7.9 -4.3 0.6 6.5 5.6 7.9 3.9 5.6
TX Harvested Area (1000 ac) 0.0 -22.1 -23.6 -19.1 -11.6 -2.8 -1.2 1.8 -1.6 0.6
MO Harvested Area (1000 ac) 0.0 -1.3 -1.5 -1.5 -1.2 -0.6 -0.9 -0.7 -1.3 -1.2
MS Harvested Area (1000 ac) 0.0 -2.0 -2.1 -1.3 -0.1 1.0 0.8 1.0 0.2 0.5
CA Harvested Area (1000 ac) 0.0 -13.9 -11.7 -4.6 0.0 3.3 3.1 2.2 1.8 1.7
U.S. Production (1000 mt) 0.0 -6.6 -5.8 -3.1 -0.5 1.9 1.5 1.9 0.6 1.1
U.S. Consumption (1000 mt) -0.9 -0.6 -0.5 -0.2 -0.1 0.6 1.5 2.2 3.2 5.3
Bangladesh Area Harvested (1000 ha) 0.0 0.4 0.3 0.1 0.0 -0.1 -0.2 -0.3 -0.2 -0.2
Bangladesh Production (1000 mt) 0.0 0.5 0.4 0.2 0.0 -0.1 -0.3 -0.3 -0.3 -0.2
Bangladesh Consumption (1000 mt) 0.0 0.0 0.0 0.0 0.0 0.0 0.0 0.0 0.0 0.0
China Area Harvested (1000 ha) 0.0 -4.7 -2.6 -1.0 -0.1 0.2 0.1 0.0 0.0 0.1
China Production (1000 mt) 0.0 -4.7 -2.5 -0.9 0.0 0.3 0.1 0.0 0.1 0.1
China Consumption (1000 mt) 1.0 0.3 -0.1 -0.2 -0.1 0.1 0.1 -0.1 -0.1 -0.1
India Area Harvested (1000 ha) 0.0 -0.2 0.0 0.3 0.5 0.5 0.6 0.3 0.1 0.1
India Production (1000 mt) 0.0 -0.2 0.0 0.3 0.5 0.6 0.6 0.3 0.1 0.1
India Consumption (1000 mt) 0.2 0.1 0.0 0.0 0.0 0.0 0.0 0.0 0.0 0.0
Indonesia Area Harvested (1000 ha) 0.0 0.3 0.2 0.0 0.0 -0.1 -0.1 -0.1 0.0 0.0
Indonesia Production (1000 mt) 0.0 0.4 0.3 0.1 0.0 0.0 -0.1 -0.1 0.0 0.0
Indonesia Consumption (1000 mt) 3.7 2.6 0.9 0.0 -0.1 0.1 0.2 0.1 0.0 0.0
Philippines Area Harvested (1000 ha) 0.0 0.2 0.3 0.3 0.3 0.2 0.1 0.0 0.0 0.0
Philippines Production (1000 mt) 0.0 0.4 0.5 0.5 0.4 0.3 0.2 0.1 0.0 0.0
Philippines Consumption (1000 mt) -1.7 -0.9 -0.1 0.2 0.5 0.6 0.4 0.2 0.0 -0.1
Thailand Area Harvested (1000 ha) 0.0 0.0 0.0 0.0 0.0 0.0 0.0 0.0 0.0 0.0
Thailand Production (1000 mt) 0.0 0.0 0.0 0.0 0.0 0.0 0.0 0.0 0.0 0.0
Thailand Consumption (1000 mt) -0.2 -0.1 0.0 0.0 0.0 0.1 0.0 0.0 0.0 0.0
Vietnam Area Harvested (1000 ha) 0.0 0.0 0.0 0.0 0.0 0.0 0.0 0.0 0.0 0.0
Vietnam Production (1000 mt) 0.0 0.3 0.2 0.1 0.1 0.1 0.0 0.0 0.0 0.1
Vietnam Consumption (1000 mt) -1.5 -0.8 -0.1 0.2 0.4 0.5 0.4 0.2 0.0 0.0
Source: Computed and summarized from AGRM model simulation results.
Percent Impact
13
These results highlight the impact of possible area substitution from rice to corn, soybean, and
wheat--as the relative returns from growing rice become unfavorable.
For China, India, and Indonesia, wheat is a substitute staple food crop for rice. The impact of
drought in these countries is positive for rice consumption, as the higher prices of wheat
encourages shifting to rice. The increases in wheat prices in these countries dominate the
increases in rice prices.
In the Philippines and Vietnam, the impact of the drought on rice consumption is negative as
neither of the other crops is a substitute for rice. As expected, the higher rice prices dampen rice
consumption. The negative impacts of the drought in rice consumption in Bangladesh, Thailand
and the U.S. are relatively small.
As expected, the average impact of the drought is muted beyond the third year, as dynamic
adjustments occur in the rice market. There is a mild recovery in world rice area harvested,
production, and consumption during the same period.
As in any typical market shock, eventually the normal forces of supply and demand in the market
set in. This is evident in the much lower level of impact in most of the countries for the period
beyond the third year, with the exception of India. India’s area harvested comes back strongly
starting in 2015 driven by expansion in rice exports, as declining long grain prices makes the
country more competitive in the global rice market. This situation comes in tandem with
resumption of release of its larger-than-normal national rice stockpile.

14
In general, the deterministic impact of the recent U.S. drought appears to be relatively muted for
the global rice economy due to large stocks in China, India, and Thailand. Nevertheless, the
food-deficit economies including Bangladesh, Indonesia and Philippines remain faced with food
security challenges brought about by risks and uncertainties related to weather, government
policies, and politics, among other factors.
Conclusions
As expected, the impact of the U.S. drought is concentrated during the first few years after the
event. It takes about three years before the drought-induced impact on the rice sector stabilizes.
While the impact of the U.S. drought is relatively muted for the global rice economy due to large
stocks in China, India, and Thailand, there are nevertheless, challenges faced by key food deficit
nations regarding food security as rice prices increase.
The current price surges in corn, soybeans, and wheat as a result of the recent drought in the
U.S., and the relative stability in rice price during the same period have consequent changes in
relative net returns and competitiveness of the crops---with potential substantial rice supply
responses in the U.S. and China. Important demand responses also occur in the Philippines and
Vietnam—where rice consumption declines as rice price increases; and in Indonesia where
shifting to rice consumption occurs due to higher wheat prices.

15
References
Carriquiry, et al., 2012. "Impact of Removal of China’s Production and Input Subsidies and Price
Supports for Crops and Livestock on U.S. and World Agricultural Markets.” A special
joint study between Global Agricultural Market and Policy Research Services, Arkansas
Global Rice Economics Program, World Agricultural Economic and Environmental
Services, and Iowa State University.
Lopez, Ricardo. “World Food Prices Rose 10% in July, Pushed by Midwest Drought.”
L.A.Times, August 30, 2012. Published at: http://www.latimes.com/business/money/la-
fi-mo-world-food-prices-rose-10-percent-july-pushed-by-midwest-drought-
20120830,0,1812447.story
USDA. U.S. Drought 2012: Farm and Food Impacts. Published at http://www.ers.usda.gov/topics/in‐the‐news/us‐drought‐2012‐farm‐and‐food‐impacts.aspx
U.S. Drought Monitor. 2013. National Drought Mitigation Center at the University of Nebraska-
Lincoln, the United States Department of Agriculture, and the National Oceanic and
Atmospheric Administration. http://droughtmonitor.unl.edu/archive.html
Wailes, E.J. and E.C. Chavez. 2011. “2011 Updated Arkansas Global Rice Model”. University of
Arkansas Department of Agricultural Economics and Agribusiness, Division of
Agriculture Staff Paper 2011-01. Published at
http://ageconsearch.umn.edu/handle/102650.