u.s. domestic small modular reactor security by design
TRANSCRIPT

SANDIA REPORT SAND2021-0768
Printed March 2021
U.S. Domestic Small Modular
Reactor Security by Design
Alan S. Evans, Jordan M. Parks, Steven Horowitz, Luke Gilbert, Ryan Whalen
Prepared by Sandia National Laboratories Albuquerque, New Mexico 87185 and Livermore, California 94550

2
Issued by Sandia National Laboratories, operated for the United States Department of Energy by National
Technology & Engineering Solutions of Sandia, LLC.
NOTICE: This report was prepared as an account of work sponsored by an agency of the United States
Government. Neither the United States Government, nor any agency thereof, nor any of their employees, nor any of
their contractors, subcontractors, or their employees, make any warranty, express or implied, or assume any legal
liability or responsibility for the accuracy, completeness, or usefulness of any information, apparatus, product, or
process disclosed, or represent that its use would not infringe privately owned rights. Reference herein to any specific
commercial product, process, or service by trade name, trademark, manufacturer, or otherwise, does not necessarily
constitute or imply its endorsement, recommendation, or favoring by the United States Government, any agency
thereof, or any of their contractors or subcontractors. The views and opinions expressed herein do not necessarily
state or reflect those of the United States Government, any agency thereof, or any of their contractors.
Printed in the United States of America. This report has been reproduced directly from the best available copy.
Available to DOE and DOE contractors from
U.S. Department of Energy
Office of Scientific and Technical Information
P.O. Box 62
Oak Ridge, TN 37831
Telephone: (865) 576-8401
Facsimile: (865) 576-5728
E-Mail: [email protected]
Online ordering: http://www.osti.gov/scitech
Available to the public from
U.S. Department of Commerce
National Technical Information Service
5301 Shawnee Rd
Alexandria, VA 22312
Telephone: (800) 553-6847
Facsimile: (703) 605-6900
E-Mail: [email protected]
Online order: https://classic.ntis.gov/help/order-methods/

3
ABSTRACT
U.S. nuclear power facilities face increasing challenges in meeting dynamic security requirements caused by evolving and expanding threats while keeping cost reasonable to make nuclear energy competitive. The past approach has often included implementing security features after a facility has been designed and without attention to optimization, which can lead to cost overruns. Incorporating security in the design process can provide robust, cost-effective, and sufficient physical protection systems. The purpose of this work is both to develop a framework for the integration of security into the design phase of Small Modular Reactors (SMRs) and increase the use of modeling and simulation tools to optimize the design of physical protection systems. Specifically, this effort focuses on integrating security into the design phase of a model SMR that meets current Nuclear Regulatory Commission (NRC) physical protection requirements and providing advanced solutions to improve physical protection and decrease costs. A suite of tools, including SCRIBE3D©, PATHTRACE© and Blender© were used to model a hypothetical, generic domestic SMR facility. Physical protection elements such as sensors, cameras, barriers, and guard forces were added to the model based on best practices for physical protection systems. Multiple outsider sabotage scenario were examined with four-to-eight adversaries to determine security metrics. The results of this work will influence physical protection system designs and facility designs for U.S. domestic SMRs and demonstrate how a series of experimental and modeling capabilities across the Department of Energy (DOE) Complex can impact the design of and complete Safeguards and Security by Design (SSBD) for SMRs. The conclusions and recommendations in this document may be applicable to all SMR designs (pebble bed reactors, high-temperature gas reactors, etc.). Utilizing an offsite response and a denial strategy to prevent acts of sabotage is successful 78% of the time for adversaries of six or fewer in a sequential attack. Utilizing an offsite response and a denial strategy to prevent acts of sabotage is successful 95% of the time for adversaries of six or fewer in a split attack scenario. Utilizing a security-by-design process for SMRs creates a system to incorporate an effective security system, facility operations and facility safety.

4
ACKNOWLEDGEMENTS
The team would like to acknowledge the many subject matter experts who contributed their
expertise to the development of this facility, design and analysis.

5
CONTENTS
1. Introduction ............................................................................................................................................... 19
2. Hypothetical Small modular reactor facility .......................................................................................... 20 2.1. Site Description ............................................................................................................................... 20
2.1.1. Climate ................................................................................................................................ 20 2.1.2. Local Wildlife ..................................................................................................................... 20
2.2. SMRF Buildings .............................................................................................................................. 20 2.3. Reactor Description ........................................................................................................................ 22 2.4. SMR Facility Operations ................................................................................................................ 24
3. Overview of Vulnerability Assessment .................................................................................................. 30 3.1. Modeling Tools ............................................................................................................................... 30
3.1.1. PathTrace© ........................................................................................................................ 30 3.1.2. Blender ................................................................................................................................ 30 3.1.3. Scribe3D© – Tabletop Recorder and Automated Tabletop Data Tool ................... 30
3.2. System Effectiveness Analysis Assumptions .............................................................................. 31
4. Hypothetical SMR Physical Protection System .................................................................................... 32 4.1. PPS Design Process ........................................................................................................................ 32 4.2. Current Practices of Small Modular Reactor Facility Physical Protection ............................. 33
4.2.1. Perimeter Physical Protection System Design .............................................................. 33 4.2.2. Internal Physical Protection System ............................................................................... 35
5. Target Identification ................................................................................................................................. 38 5.1. Direct Sabotage Targets ................................................................................................................. 38
6. Response Force ......................................................................................................................................... 39 6.1. Response Force Assumptions ....................................................................................................... 39
7. Physical Security Vulnerability Assessment ........................................................................................... 40 7.1. The Vulnerability Assessment Process ........................................................................................ 40 7.2. Threat Assumptions and Characterization .................................................................................. 41
8. Path Analysis and Facility Upgrades ...................................................................................................... 43 8.1. Base Case Facility and Physical Protection System Design ...................................................... 43 8.2. Upgrade One – Additional Exterior Walls, Stairwell Portal, Battery Bank Relocation,
and Active Delay (Obscurants and Slippery Agents) .......................................................... 45 8.2.1. Active Delay Features – Obscurants and Slippery agents [3] ...................................... 45
8.2.1.1. Active Delay – Obscurants ............................................................................... 46 8.2.1.2. Active Delay – Slippery Agents ....................................................................... 46
8.3. Upgrade Two – Hardened Roll-Up Doors, Storage Building Door Mantrap, Hardened Mantraps at Battery Banks ...................................................................................................... 51
8.4. Upgrade Three – Active Delay for Hardened Doors, Extended Detection, Active delay along battery bank path ........................................................................................................... 55
8.4.1. Extended Detection – Fused Radar and Video motion detection using the deliberate motion algorithm4 ........................................................................................... 55
8.5. Upgrade Four – Below-Grade Reactor Wall .............................................................................. 60 8.6. Implementing Facility Safety and Security .................................................................................. 61
8.6.1. Multiple Ingress and Egress Points ................................................................................ 61 8.6.2. Safety Changes and Security System Analysis ............................................................... 64
9. Vulnerability Analysis of Facility Design ............................................................................................... 70

6
9.1. Definition of Adversary Path ........................................................................................................ 70 9.2. Adversary Attack Scenarios ........................................................................................................... 70
9.2.1. Sequential Attack Scenarios ............................................................................................. 71 9.2.1.1. Thirty-Minute Response Time ......................................................................... 71 9.2.1.2. Response Force Win Criteria ........................................................................... 71 9.2.1.3. Time Zero ........................................................................................................... 71 9.2.1.4. 00:00-01:50 – Adversaries Enters Facility ...................................................... 72 9.2.1.5. Time 01:50-14:35 – Adversaries Begin Inner Rollup Door Breach ........... 73 9.2.1.6. Time 30:00 – Response Force Arrives ............................................................ 74 9.2.1.7. Time 30:00-44:45 – Adversaries Proceeds Below Grade ............................. 75 9.2.1.8. Time 44:45-45:45 – Adversaries Begins Lower Stairwell Breach ............... 76 9.2.1.9. Time 45:45-46:20 – Adversaries Begin Breach of Reactor Building Door77 9.2.1.10. Time 46:20-65:20 – Adversaries Begin Reactor Sabotage ........................... 77 9.2.1.11. Time 65:20-87:15 – Adversary Begins PSIT Breach .................................... 78 9.2.1.12. Time 87:15-107:25 – Adversaries Begin Breaches of PSITs ....................... 78 9.2.1.13. Time 107:25-115:55 – Adversary begins Breach into Battery Bank/Diesel Generator Room ............................................................................................................... 79 9.2.1.14. Time 115:55-117:20 – Adversaries Begin Battery Bank/Generator Sabotage .............................................................................................................................. 80
9.2.2. Sabotage Results – All Scenarios..................................................................................... 81 9.2.2.1. Thirty-Minute Offsite Response Force with Manned Hardened Fighting Positions ............................................................................................................................. 83 9.2.2.2. Sixty-Minute Offsite Response Force Time .................................................. 86
9.2.2.2.1. Sixty-Minute Response Time with Manned Hardened Fighting Positions 88
9.2.3. Split Adversary Attack ...................................................................................................... 90 9.2.3.1. Thirty Minute Response Time ......................................................................... 90 9.2.3.2. Time Zero ........................................................................................................... 90 9.2.3.3. 00:00-01:50 – Adversaries Enters Facility ...................................................... 91 9.2.3.4. Time 01:50-14:35 – Adversaries Begin Inner Rollup Door Breach ........... 92 9.2.3.5. Time 12:40-13:16 – Team 2 Begins Breach to Below Grade ...................... 94 9.2.3.6. Time 13:16-16:55 – Team 2 Begins Breach into PSIT Hallway.................. 94 9.2.3.7. Time 30:00 – Response Force Arrives ............................................................ 95 9.2.3.8. Time 30:00-44:45 – Adversaries Proceed Below Grade .............................. 96 9.2.3.9. Time 44:45-45:45 – Adversaries Begin Lower Stairwell Breach ................. 97 9.2.3.10. Time 45:45-46:20 – Adversaries Begin Breach of Reactor Building Door98 9.2.3.11. Time 46:20-65:20 – Adversaries Begin Reactor Sabotage ........................... 99
9.2.4. Sabotage Results – All Scenarios................................................................................... 101 9.2.4.1. Thirty-Minute Offsite Response Force with Manned Hardened Fighting Positions .......................................................................................................................... 103 9.2.4.2. Sixty-Minute Offsite Response Force .......................................................... 105
9.2.4.2.1. Sixty-Minute Offsite Response Force with Manned Hardened Fighting Positions ........................................................................................... 107
10. Considerations ......................................................................................................................................... 109 10.1. Facility Considerations ................................................................................................................. 109 10.2. Physical Protection System Considerations .............................................................................. 110
11. Conclusion and Future Work ................................................................................................................ 112

7
LIST OF FIGURES
Figure 2-1. SMRF Facility ............................................................................................................................... 22 Figure 2-2. Above-Grade SMRF (top-2D image, bottom-3D image) ..................................................... 26 Figure 2-3. First Below-Grade Floor SMRF (top-2D image, bottom-3D image) .................................. 28 Figure 2-4. Second Below-Grade Floor SMRF ........................................................................................... 29 Figure 4-1. Security-by-Design DEPO Process [2] .................................................................................... 32 Figure 4-2. PIDAS Cross-section .................................................................................................................. 34 Figure 4-3. Baseline PPS Design – Ground Floor ...................................................................................... 36 Figure 4-4. Baseline PPS – Basement Level ................................................................................................. 37 Figure 8-1. Base Case Path to All Targets .................................................................................................... 43 Figure 8-2. Upgrade One – Walls and Doors at Vital Stairwells, plus active delay (obscurants and
slippery agents) .......................................................................................................................................... 47 Figure 8-3. Upgrade One – Walls and Doors at Vital Stairwells Paths, Battery Bank Basement ........ 48 Figure 8-4. Upgrade Two – Hardened Roll-Up Doors, Storage Building Mantrap ............................... 51 Figure 8-5. Upgrade Two – Hardened Mantraps at Battery Banks (Basement Level) .......................... 52 Figure 8-6. Upgrade Three – Roll-up Door Active Delay, Extended Detection, Active delay along
the battery bank path ................................................................................................................................ 56 Figure 8-7. Upgrade Three Sabotage Path – Battery Bank ........................................................................ 58 Figure 8-8. Below-Grade Reactor Wall ......................................................................................................... 60 Figure 8-9. Multiple Ingress and Egress Points Above-Grade ................................................................. 61 Figure 8-10. Safety Related Changes to Site Layout ................................................................................... 62 Figure 8-11: Above-Grade Security System ................................................................................................. 63 Figure 8-12: Below-Grade Security System .................................................................................................. 64 Figure 9-1. Adversary Team Breaching Vehicle Entry Control Point ..................................................... 72 Figure 9-2. Adversary Team Sabotages the Switchyard ............................................................................. 73 Figure 9-3. Adversary Team Begins Inner Door Breach ........................................................................... 74 Figure 9-4. Response Force Arrives Onsite ................................................................................................. 75 Figure 9-5. Adversary Team Begins Stairwell Mantrap Breach ................................................................. 75 Figure 9-6. Lower Stairwell Breach ............................................................................................................... 76 Figure 9-7. Adversary Team Breaches Reactor Door Building ................................................................. 77 Figure 9-8. Adversary Team Begins Reactor Breach .................................................................................. 77 Figure 9-9. Adversaries begin Breach into PSIT Room ............................................................................. 78 Figure 9-10. Adversaries begin Breach of PSITs ........................................................................................ 79 Figure 9-11. Adversaries Breach into Battery Bank/Diesel Generator Room ....................................... 80 Figure 9-12. Adversaries Sabotage Batteries and Generators.................................................................... 81 Figure 9-13. Hardened Fighting Positions ................................................................................................... 84 Figure 9-14. Adversary Team Breaching Vehicle Entry Control Point ................................................... 91 Figure 9-15. Adversary Team Sabotages the Switchyard ........................................................................... 92 Figure 9-16. Adversaries Begin Inner Door Breach ................................................................................... 93 Figure 9-17. Adversaries Begin Breach of Storage Building ...................................................................... 93 Figure 9-18. Team 2 Breaches Above Grade Storage Building Stairwell ................................................ 94 Figure 9-19. Team 2 Begins Breach into PSIT Hallway ............................................................................. 95 Figure 9-20. Response Force Arrives Onsite ............................................................................................... 96 Figure 9-21. Team 1 Begins Stairwell Mantrap Breach .............................................................................. 97 Figure 9-22. Team 1 Lower Stairwell Breach ............................................................................................... 98 Figure 9-23. Team 1 Breaches Reactor Door Building .............................................................................. 99 Figure 9-24. Team 1 Begins Reactor Breach ................................................................................................ 99

8
Figure 9-25. Team 2 Begins Sabotage of Battery Bank/Generator Room .......................................... 100 Figure 9-26. Team 2 Begins to Sabotage PSIT Tanks ............................................................................. 100 Figure 9-27. Hardened Fighting Positions ................................................................................................ 103
LIST OF TABLES
Table 5-1. Sabotage Targets ........................................................................................................................... 38 Table 7-1. Outsider High-Level Threat Assessment Used for Analysis .................................................. 42 Table 8-1. Base Case Timeline – Reactor Sabotage .................................................................................... 44 Table 8-2. Base Case Timeline – Battery Bank Sabotage ........................................................................... 44 Table 8-3. Base Case Physical Protection System Path Analysis .............................................................. 45 Table 8-4. Delay Multiplication Factors ....................................................................................................... 46 Table 8-5. Upgrade One – Sabotage Timeline – Reactor .......................................................................... 48 Table 8-6. Upgrade One – Sabotage Timeline – Battery Bank ................................................................. 49 Table 8-7. Facility Upgrade One Results ...................................................................................................... 50 Table 8-8. Upgrade Two – Sabotage Timeline – Reactor .......................................................................... 53 Table 8-9. Upgrade Two – Sabotage Timeline – Battery Room ............................................................... 54 Table 8-10. Facility Upgrade Two ................................................................................................................. 55 Table 8-11. Upgrade Three – Sabotage Timeline – Reactor ..................................................................... 57 Table 8-12. Upgrade Three – Sabotage Timeline – Battery Bank ............................................................ 58 Table 8-13. Facility Upgrade Three ............................................................................................................... 59 Table 8-14. Facility Upgrade Four ................................................................................................................. 60 Table 8-15. Safety Changes – Sabotage Timeline – Reactor ..................................................................... 64 Table 8-16: Safety Changes – Sabotage Timeline – Battery Bank ............................................................ 65 Table 8-17: Safety Changes – Sabotage Timeline – Control Room ......................................................... 65 Table 8-18: Safety Changes – Sabotage Timeline – Central Alarm Station ............................................. 66 Table 8-19: Safety Changes – Sabotage Timeline – Spent Fuel Pool ....................................................... 67 Table 8-20: Safety Changes – Sabotage Timeline – PSIT .......................................................................... 67 Table 8-21: Safety Changes and Physical Protection System Upgrades .................................................. 68 Table 9-1. Sabotage Targets ........................................................................................................................... 70 Table 9-2. Thirty Minute Sequential Results ................................................................................................ 82 Table 9-3. System Effectiveness by Threat .................................................................................................. 83 Table 9-4. Thirty-Minute Offsite Response with Manned Hardened Fighting Positions
(Sequential Results) ................................................................................................................................... 84 Table 9-5. Comparison of System Effectiveness with and without Hardened Fighting Positions
(30-Minute Response, Sequential Results)............................................................................................. 85 Table 9-6. Thirty-Minute Offsite Response (Sequential Results) ............................................................. 86 Table 9-7. System Effectiveness by Threat .................................................................................................. 87 Table 9-8. Comparison of System Effectiveness Based on 30- and 60-Minute Response Times
(Sequential Results) ................................................................................................................................... 88 Table 9-9. Sixty-Minute Offsite Response with Manned Hardened Fighting Positions (Sequential
Results) ....................................................................................................................................................... 88 Table 9-10. Comparison of System Effectiveness with and without Hardened Fighting Positions
(60-Minute Response) .............................................................................................................................. 90 Table 9-11. Thirty-Minute Split Results ..................................................................................................... 101 Table 9-12. System Effectiveness by Threat ............................................................................................. 102 Table 9-13. Thirty-Minute Offsite Response with Manned Hardened Fighting Positions (Split
Results) .................................................................................................................................................... 103

9
Table 9-14. Comparison of System Effectiveness with and without Hardened Fighting Positions (30-Minute Response, Split Results) .................................................................................................... 105
Table 9-15. Sixty-Minute Offsite Response (Split Results) ..................................................................... 105 Table 9-16. Comparison of System Effectiveness Based on 30- and 60-Minute Response Times
(Split Results) .......................................................................................................................................... 106 Table 9-17. Sixty-Minute Offsite Response with Manned Hardened Fighting Positions (Split
Results) .................................................................................................................................................... 107 Table 9-18. Comparison of System Effectiveness with and without Hardened Fighting Positions
(60-Minute Response, Split Results) .................................................................................................... 108

10
This page left blank
11
EXECUTIVE SUMMARY
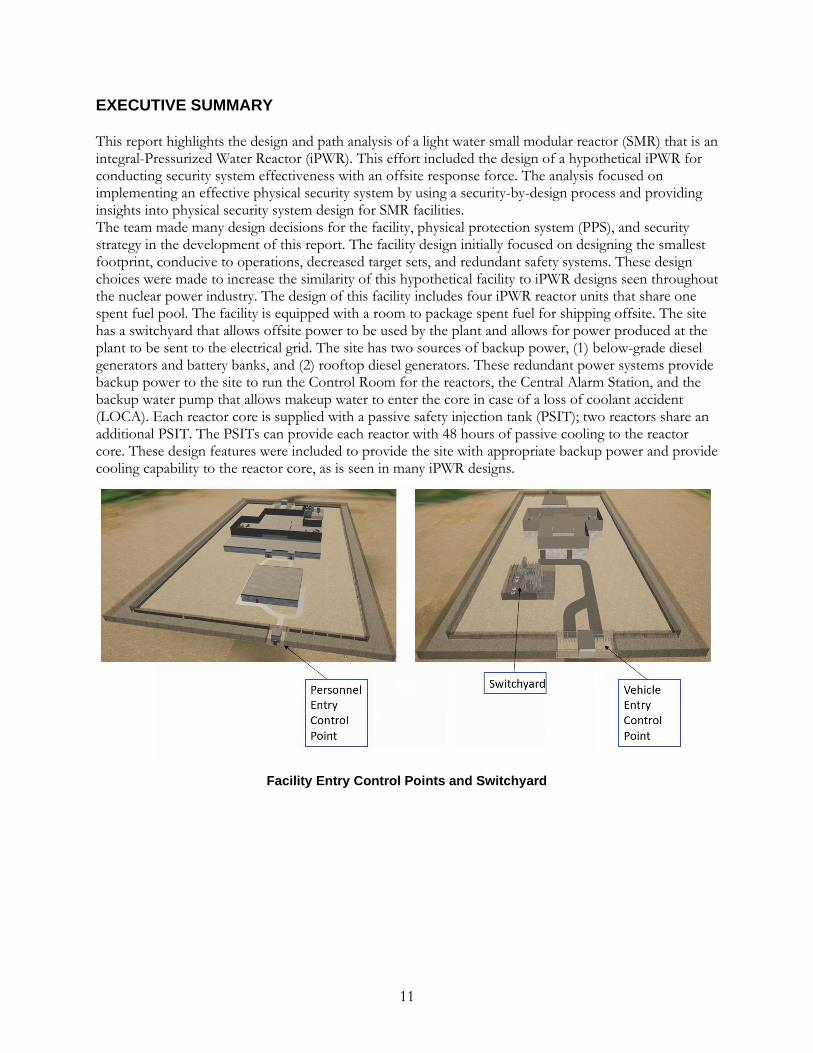
This report highlights the design and path analysis of a light water small modular reactor (SMR) that is an integral-Pressurized Water Reactor (iPWR). This effort included the design of a hypothetical iPWR for conducting security system effectiveness with an offsite response force. The analysis focused on implementing an effective physical security system by using a security-by-design process and providing insights into physical security system design for SMR facilities. The team made many design decisions for the facility, physical protection system (PPS), and security strategy in the development of this report. The facility design initially focused on designing the smallest footprint, conducive to operations, decreased target sets, and redundant safety systems. These design choices were made to increase the similarity of this hypothetical facility to iPWR designs seen throughout the nuclear power industry. The design of this facility includes four iPWR reactor units that share one spent fuel pool. The facility is equipped with a room to package spent fuel for shipping offsite. The site has a switchyard that allows offsite power to be used by the plant and allows for power produced at the plant to be sent to the electrical grid. The site has two sources of backup power, (1) below-grade diesel generators and battery banks, and (2) rooftop diesel generators. These redundant power systems provide backup power to the site to run the Control Room for the reactors, the Central Alarm Station, and the backup water pump that allows makeup water to enter the core in case of a loss of coolant accident (LOCA). Each reactor core is supplied with a passive safety injection tank (PSIT); two reactors share an additional PSIT. The PSITs can provide each reactor with 48 hours of passive cooling to the reactor core. These design features were included to provide the site with appropriate backup power and provide cooling capability to the reactor core, as is seen in many iPWR designs.
Facility Entry Control Points and Switchyard

12
Facility Layout
For this report, a PPS was designed to provide up to thirty minutes of delay to the following targets: - Two battery bank and diesel generator rooms
- The spent fuel pool
- The passive safety injection tanks
- The four reactor cores For an adversary force to reach a radioactive release or potential core damage at this site they must successfully sabotage the battery bank and diesel generator rooms, the PSITs associated with a reactor, and the containment for the corresponding iPWR. The base case PPS design was based on current Nuclear Regulatory Commission (NRC) regulations, with some exceptions made for the consideration of reduced on-site response force numbers by the SMR community1. The analysis focused on designing a PPS with thirty minutes of delay to an external adversary force attempting sabotage and an offsite response force time of between thirty and sixty minutes. The team also assumed an adversary team that had the ability to perform sequential attacks as well as split their forces into multiple teams, and scenarios in which two manned hardened fighting positions are onsite in collaboration with the offsite response force. The initial facility physical security system design following current NRC regulations produced a system with less than 95% probability of interruption. Many facility modifications had to be made and more advanced physical security techniques were implemented until a probability of interruption of 95% or higher was reached at each analyzed target. The facility designs included two additional external facility walls to decrease adversary ability to breach into stairwells that lead them to below grade target locations. It is important to note that all targets necessary for sabotage are located below grade, which increases

13
adversary task time. On the exterior of the facility all personnel doors were upgraded by installing a mantrap. The mantrap forces the adversary to breach both doors to gain access to the building internals. This process also creates additional security against an insider threat. Mantraps allow the Central Alarm Station (CAS) to lockout the mantrap and not allow access to those who should not have access into the building; it also enables the CAS to trap that person inside the mantrap until the response force arrives. Inside of the facility, added upgrades include the addition of a number of hallways and doorways. These hallways and doorways have additional active delay systems, such as slippery agents and obscurants, which act as delay multipliers and greatly increase the adversary task time. In addition to this, safety systems and target sets were located near each other but separated into different room locations. This increases the number of breaches an adversary force must accomplish in order to sabotage the necessary equipment. An additional concern with this facility design is the integration between security and safety at the
design phase. The initial facility design was based on providing a decreased footprint and improving
the effectiveness of the security system. Due to this focus, an additional ingress and egress point to
the building was not initially developed. Once the additional ingress and egress point was added, the
adversary pathway changed, requiring additional facility modifications like the introduction of
hallways and doors to increase the delay time to reach the target location. One of the major
conclusions of this work is that at the facility design phase both security and safety must be
considered. When safety and security are considered at the beginning of the design phase, the overall
cost of the facility may decrease, and the increased integration will allow operations, safety, and
security missions succeed at the facility.
Thirty-Minute Offsite Response System Effectiveness Analysis
As can be seen in the figure above, system effective analysis was evaluated for various response force strategies and adversary attack types. The data shows that as the adversary force increases, the system effectiveness decreases. When the adversary team splits into multiple teams, the system effectiveness increases as compared to when the adversary teams stays in one group and performs a
0%
20%
40%
60%
80%
100%
4 5 6 7 8
Thirty-Minute Offsite Response System Effectiveness Analysis
30 Minute Offsite Response - Sequential Attack
30 Minute Offsite Response - Split Attack
30 Minute Offsite Response - Sequential Attack (Hardened Fighting Positions)
30 Minute Offsite Response - Split Attack (Hardened Fighting Positions)

14
sequential attack. This result is largely due to the number of targets (four) that the adversary must sabotage in order to cause a potential core melt or radioactive release, and when the adversary team splits into teams the response force has a force advantage against the responders. This advantage for the response force allows them to prevent the adversary from sabotaging all necessary target sets. The analysis also shows that when two manned hardened fighting positions with armed responders was on site, the system effectiveness increased, regardless of the attack type chosen by the adversary. With a thirty-minute offsite response force, having some presence of armed guards may drastically increase security system effectiveness at potential SMR sites.
Sixty-Minute Offsite Response System Effectiveness Analysis
From the figure above, the same trend can be seen with increased system effectiveness when the adversary force splits into teams to conduct the sabotage attack. In these scenarios, incorporating manned hardened fighting positions into the facility and security system strategy increases the system effectiveness. The addition of hardened fighting positions, whether for a thirty- or sixty-minute response time, improves system effectiveness as they allow the response force to neutralize some members of the adversary force. The manned hardened fighting positions also allow the response force to increase the time it takes the adversary team to reach the target location. This increase in time allows the offsite response force to have adequate time to reach the site and aid in the neutralization of the adversary team. In the thirty-minute scenarios, the adversary team in most scenarios is unable to sabotage most of the systems because they are interrupted before this can be completed. In most of the sixty-minute scenarios, the adversary is able to sabotage most of the targets but not all of the targets. This analysis provided some insights into the security of iPWRs. These insights include that additional delay must be provided for SMR facilities that use an offsite response force. The use of active delay features will increase adversary task times and increase the overall adversary timeline. Increasing the number of doorways and barriers and introducing mantraps aids in the security of the facility from both internal and external adversaries. The decreased footprint of SMR facilities will increase the need for both passive and active delay systems to create the necessary probability of interruption and allow the response force to properly interrupt the adversary force. When offsite
0%
20%
40%
60%
80%
100%
4 5 6 7 8
Sixty-Minute Offsite Response System Effectiveness Analysis
60 Minute Offsite Response - Sequential Attack
60 Minute Offsite Response - Split Attack
60 Minute Offsite Response - Sequential Attack (Hardened Fighting Positions)
60 Minute Offsite Response - Split Attack (Hardened Fighting Positions)

15
response forces are used, especially local law enforcement, it will be important to train and coordinate with the offsite responders to increase their understanding of the facility. The offsite law enforcement agency must be experienced and conduct exercises at the facility on a regular basis. It will also be important for the site to consider the route of travel the offsite responders must take to reach the facility. Weather on the roadways can significantly increase the amount of time for the responders to reach the site as can circumstances like traffic or adversaries acting as a blocking force on the roadways needed to reach the facility. Additional considerations include the factors presented by the operations, safety, and security organizations at an SMR facility.

16
This page left blank
17
ACRONYMS AND DEFINITIONS
Abbreviation Definition
ASD Adversary sequence diagram
BAS Backup alarm station
BMS Balanced magnetic switch
CAS Central alarm station
CCTV Closed circuit television
CDP Critical detection point
CVCT Chemical volume control tank
DBA Design basis accident
DBT Design basis threat
DEPO Design and evaluation process outline
DMA Deliberate motion algorithm
DOE Department of Energy
ECCS Emergency core cooling system
ECP Entry control point
iPWR Integral-Pressurized Water Reactor
KIA Killed in action
LAA Limited access area
LEU Low-enriched uranium
LLEA Local law enforcement agency
LOCA Loss of coolant accident
LSWMR Light Water Small Modular Reactor
LWR Light water reactor
MVP Most vulnerable path
NRC Nuclear Regulatory Commission
PA Protected area
PIDAS Perimeter intrusion detection and assessment system
PIN Personal identification number
PPB Power production building
PPS Physical Protection System
PSIT Passive safety injection tank
18
Abbreviation Definition
RF Response force
RFT Response force time
RPV Reactor pressure vessel
RWMT Residual water makeup tanks
SMR Small Modular Reactor
SMRF Small modular reactor facility
SNL Sandia National Laboratories
SSBD Safeguards and Security by Design
UPS Uninterruptible power supply
URC Unacceptable radiological consequence
VA Vital area
VA Vulnerability analysis

19
1. INTRODUCTION
Nuclear facilities around the world face stringent requirements for security, particularly for nuclear power generating facilities, including planned small modular reactors (SMRs). Nuclear power plant facilities must meet these stringent regulatory requirements for physical protection due to the threat posed by theft and sabotage of nuclear material. This places nuclear power at a significant disadvantage compared to other energy sources since it requires more upfront, operational, and maintenance costs in physical protection systems (PPS) and protective force personnel. Some SMR vendors claim that due to the robust passive safety features of the nuclear reactors, an onsite security force is not necessary. By only using offsite local law enforcement, operational costs may be significantly reduced. Furthermore, future nuclear facilities will need to incorporate Safeguards and Security by Design (SSBD) to optimize the performance of the PPS within reasonable cost constraints while meeting stakeholder objectives. Historically, the design of nuclear facilities has been retrofitted to accomplish the performance objectives of safeguards and security. Incorporating these factors into the design phase of the facility can significantly decrease implementation and operational costs throughout the facility’s lifetime. As part of this design process, it is important to assess the vulnerabilities of the facility through modeling and simulation to identify potential upgrades to address those vulnerabilities before the facility is built. In this report, this design process is demonstrated by identifying a hypothetical design basis threat (DBT) along with employing path and scenario analysis to identify weaknesses in a hypothetical facility’s PPS. Specifically, a hypothetical SMR facility is modeled to evaluate whether a reduced security posture is justified given the robust passive security features. The SMR facility described in this report is hypothetical. In order to avoid potential sensitivities, various individual characteristics of planned SMR facilities were selected and/or slightly modified for the hypothetical model. The report documents the reactor, design of the facility, operations, and PPS. The goal of the system is to achieve an effective physical security system with a response time of 30-minutes and 60-minutes, which were used as a benchmark for offsite local law enforcement agency (LLEA) response. The modeling and simulation effort describe the process to develop a physical security system using the security-by-design process, including an offsite response force.

20
2. HYPOTHETICAL SMALL MODULAR REACTOR FACILITY
The hypothetical small modular reactor facility (SMRF) developed for this design and analysis encompasses features and capabilities of multiple U.S. domestic SMRs currently in development. This provides a framework for the design and analysis to capture SSBD for domestic SMR applications. The hypothetical SMR facility in this study is located 15 miles outside of Portland, Oregon, in an area with a population of approximately 650,000 people.
2.1. Site Description
2.1.1. Climate
The region surrounding the facility has a moderate, wet climate. Its summers are warm and dry, and its winters are cool and wet. The warm season starts in June and lasts until September with an average daily high temperature above 76°F.1 The cold season is between November and February and has an average daily high temperature below 52°F.1 As temperatures rarely exceed 95°F, the temperature should not affect any passive infrared technologies. The region generally has a low level of humidity1 but receives an average of 43 inches of rain and three inches of snow per year.2 This level of precipitation may induce noise in sensors and cause the degradation of security elements (mold/rust/mineral deposits/electrical shorts). Portland is cloudy about 60% of the time and foggy about 34% of the time.3 This may impact assessment via electronic means or visual inspection by patrols or response forces.
2.1.2. Local Wildlife
Oregon has a large variety of wildlife that may affect day-to-day operations at a nuclear facility. These include multiple species of deer, elk, antelope, and moose.4 These animals are not intimidated by fences and can jump up to seven or eight feet.5,6 While these animals are not a danger to nuclear materials they may impact staff movement, disrupt operations, and set off nuisance alarms. The Pacific Northwest is also home to black bears and multiple species of foxes.4 Bears7 and foxes8 can climb fences or tunnel underneath them, which may cause nuisance alarms and, in the case of bears, significantly impact operations and the safety of staff. Oregon is also home to many species of large birds including the Trumpeter Swan9, which may exceed 30 lbs., wild turkeys that may weigh as much as 30 lbs., and the American White Pelican, which while weighing only 14 lbs., can have a wingspan of over nine feet. These birds may induce nuisance alarms as they move throughout the property, including on motion detectors and fence vibration sensors.
2.2. SMRF Buildings
The site consists of two primary building structures and two separate entry control points (ECPs).
1 https://weatherspark.com/y/757/Average-Weather-in-Portland-Oregon-United-States-Year-Round 2 https://www.bestplaces.net/climate/city/oregon/portland 3 https://www.currentresults.com/Weather/US/cloud-fog-city-annual.php 4 https://myodfw.com/wildlife-viewing/species/hoofed-mammals 5 https://www.adn.com/uncategorized/article/alaska-mansions-fence-kills-another-moose-fourth-three-years/2012/07/20/ 6 https://pss.uvm.edu/ppp/articles/deerfences.html 7 https://www.youtube.com/watch?v=daQ_O8mHm8Y 8 https://www.wildlifeonline.me.uk/articles/view/red-fox-deterrence 9 https://myodfw.com/wildlife-viewing/species/trumpeter-swan

21
• Office Building – The office building contains the office spaces that can be used by site
personnel.
• Switchyard – This fenced in area is where the switching substation is located. This substation
allows for offsite power to be connected to the site and the power produced by the SMRF to
be transmitted to the local electrical grid.
• Power Production Building – The Power Production Building (PPB) consists of one above-
grade floor and two below-grade floors. The above-grade floor is 15-feet tall, and the below-
grade floors are 20-feet tall. The above grade floor consists of:
- Two turbine and battery bank rooms (59’ x 52’6”)
- The reactor building (77’5” x 61’3”)
- A storage building (39’ x 148’)
o The below-grade floor of the storage building houses the response force
barracks, reactor control room, and the Central Alarm Station (CAS)
- Nuclear receiving building (39’10” x “42’1”)
- A non-nuclear receiving building (39’10” x 42’1”)
The PPB also houses the spent fuel pool, four reactor cores, and a spent fuel processing
area.
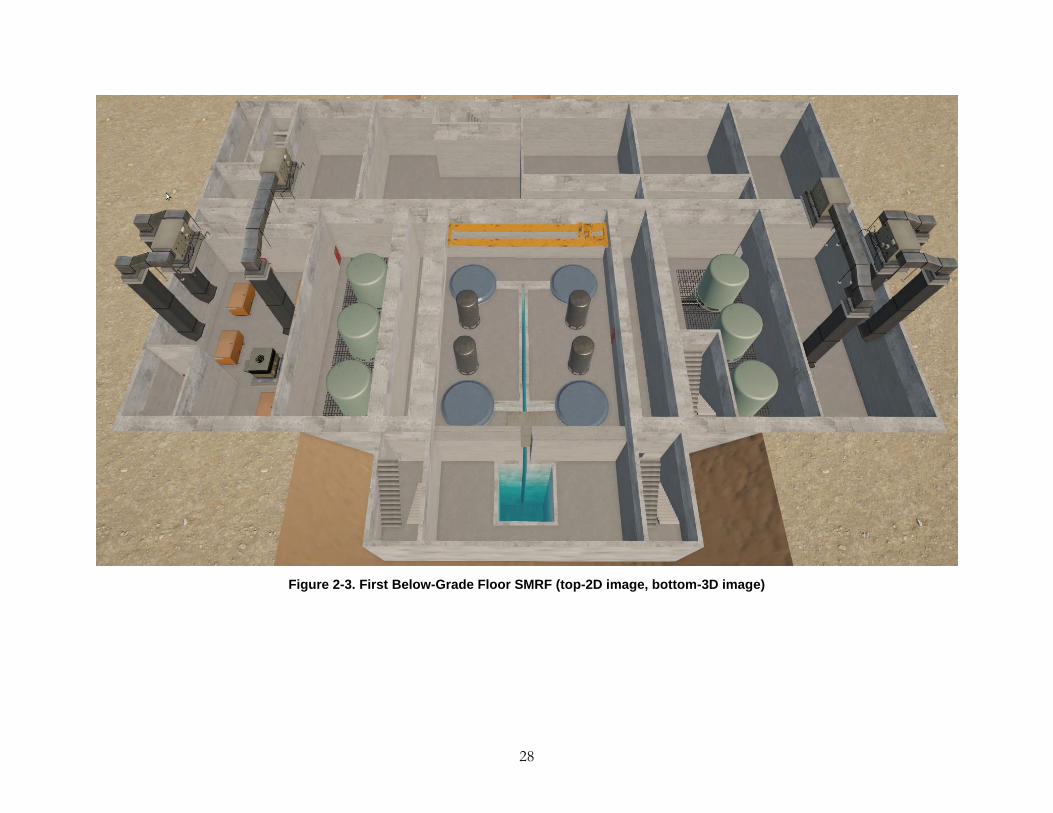
The first below-grade floor consists of:
- Reactor Control Room
- Two battery bank and diesel generator rooms
- Below-grade nuclear receiving building
- The reactor building
The second below-grade floor also consists of the reactor building. Figure 2-2, Figure 2-3,
and Figure 2-4 (below) display the site layout and buildings.

22
Figure 2-1. SMRF Facility
2.3. Reactor Description
Based on numerous U.S. domestic SMR designs, the reactor for this design and analysis is an integral-Pressurized Water Reactor (iPWR). This iPWR houses the reactor core, reactor core coolant pumps, pressurizer, and the steam generators inside of the reactor pressure vessel. Housing these items inside of the pressure vessel creates a smaller plant design and reduces the number of potential sabotage targets. The iPWR design also decreases the number of large connection pipes to the

23
pressure vessel, which removes the risk of a primary loop large-break loss of coolant accident (LOCA). Removing primary system large-break LOCAs can reduce the risk of sabotage at an SMR facility. The reactor is fueled by low enriched uranium (LEU) UO2 pellets that are enriched to 4.9% U-235 for proliferation resistance. The site operates four reactor units simultaneously. The whole reactor core is replaced every 24 months via an underwater refueling system, and the spent fuel core is stored onsite for 10 years in a spent fuel pool. The expected design lifetime of the plant is 60 years. Some key reactor descriptions include:
• Each reactor core produces 140 MWth
• Each reactor system can produce 49 MWe
• A total of 39 fuel assemblies are arranged in a 17x17 rod bundle (typical of a PWR)
• The fuel is enriched to 5% U-235
• Primary cooling is completed with natural circulation
• The site can produce 196 MWe
The reactors are cooled and moderated by light water with boric acid for reactivity control. The reactor pressure vessel (RPV) contains all primary system components, including the reactor core, control rod drive system, integral helical coil steam generators, reactor coolant pumps, and pressurizer. The primary coolant inside of the RPV is liquid borated water maintained by the pressurizer at 15 MPa. Cooling in the primary system is performed by forced circulation with 10 internal canned motor coolant pumps. The water is forced upward through the core by the coolant pumps and flows downward through the helical coil once-through steam generators. There are two steam generators per reactor core, which combine steam before it moves to the turbine. On the secondary side, the water and steam at an average pressure of 6 MPa is heated in the steam generator in a countercurrent flow, resulting in some superheating of the steam beyond saturation. The steam then travels to a high-pressure turbine, followed by a series of low-pressure turbines. There is one high-pressure turbine per reactor core, for a total of four turbines per plant. The steam and any letdown water is collected and sent to a condenser to completely condense the steam-water mixture into liquid, then pumped back to the steam generator for heating. The condenser is cooled by the ocean for ultimate heat rejection.
Reactivity control and safe shutdown is mainly performed by the B4C control rods. The Quad-Power RPV is 20 cm thick, 16 m high, and 3.5 m in inner diameter. The RPV is located within a 1.3-m thick concrete containment vessel located below-grade. The containment vessel inner height is 21 m, with a 5 m inner diameter. Containment is cooled with an integral water tank in direct contact outside of the concrete shell, which acts passively to transfer heat to a heat exchanger via natural circulation.
The entire reactor building, which holds the four reactors as well as the spent fuel pool, is below-grade, as is the main control room building. Both of these buildings are also seismic category I structures. The reactor building is only expected to be accessed during refueling operations or safeguards inspections, when maintenance is needed, or when security inspections are needed. The main control room onsite operates all four reactors and is staffed at all times by one operator and one shift supervisor.
The SMR is capable of passive cooling after a loss-of-onsite power design-basis accident (DBA) without operator action for 48 hours before any fuel melting occurs. Following a loss of on-site

24
power, the reactor is automatically tripped, inserting its control rods and shutting down the nuclear chain reaction. In the case of a LOCA, the emergency core cooling system (ECCS) automatically initiates. The ECCS consists of passive safety injection tanks (PSITs), which inject gravity-driven water passively into the RPV following depressurization from automatic depressurization valves. Each reactor core is equipped with one PSIT, located outside the containment vessel and within the below grade-level floor of the reactor building. Each tank can maintain 48 hours of cooling. Each reactor core is equipped with its own dedicated PSIT; however, if one PSIT is lost, each reactor core can draw cooling from another PSIT in a “pair.” This is performed via an operator-actioned valve that does not permit reverse flow of water. Because there are four cores, there are two “pairs” of PSITs for this redundancy. A pair of two PSITs sits on each side of the reactors, with each pair providing emergency cooling capabilities to two cores. Each PSIT is surrounded by grating, which allows leaking water to escape to the second below-grade floor. This grate allows water to flow into a holding tank where it can then be pumped into the reactor core to provide cooling in the event the PSIT is lost. The batteries and diesel generators are elevated six feet above the ground to reduce the impact flooding would have on the safe operation of the batteries and diesel generators. Primary offsite power is transferred to battery banks and diesel generators using uninterruptable power supplies (UPS) that allow for instantaneous transition from offsite power to the onsite backup power capabilities. A ventilation system exists to expel hydrogen buildup and toxic gases from the battery bank and diesel generators to reduce the risk of potential hydrogen buildup that is produced when the batteries are recharged. The ventilation system is regulated by hydrogen gas monitors in the diesel generator and battery bank room. Before the concentration of hydrogen reaches an unsafe level, the ventilation system expels hydrogen and toxic gases from the battery bank and diesel generator rooms. All safety systems are entirely passive.
Each reactor core has its own chemical volume control tank (CVCT). These tanks are used to control the boric acid within the reactor core in case the chemical volumes in the reactor core need to change. Access to all areas within this section require a two-person rule.
2.4. SMR Facility Operations
To model recent developments within the domestic and international SMR community, the site is designed with minimal operational personnel on site. Two reactor operators (one operator and one shift supervisor) will be located onsite within the main control room. One control room operator can safely operate four reactors at one time. During emergencies, operational control can be shifted from the main control room to an offsite control room located at a secure location in the operator’s corporate engineering office. One CAS with two security operators is located onsite. One operator can successfully assess alarm points and communicate to an offsite response force. The backup alarm station (BAS) is at the same location as the offsite control room. This first facility design and layout can be seen in Figure 2-2. Above-Grade SMRF, Figure 2-3. First Below-Grade Floor SMRF and Figure 2-4. Second Below-Grade Floor SMRF.

25
Non-Nuclear Material Receiving Area
Spent Fuel Packaging Area
Nuclear Material Receiving Building
Switchyard
Personnel Entry Control Point
Vehicle Entrance (Top) Guard Booth (Middle) Vehicle Exit (Bottom)
Storage Building

26
Figure 2-2. Above-Grade SMRF (top-2D image, bottom-3D image)

27
28
Figure 2-3. First Below-Grade Floor SMRF (top-2D image, bottom-3D image)

29
Figure 2-4. Second Below-Grade Floor SMRF
30
3. OVERVIEW OF VULNERABILITY ASSESSMENT
The evaluation of an existing or proposed physical protection system (PPS) requires a methodical approach that measures the ability of the security system to meet defined protection objectives. Without this kind of careful assessment, valuable resources might be wasted on unnecessary protection or, worse yet, fail to provide adequate protection of material against a theft or sabotage attack by the defined threat. The vulnerability assessment (VA) methodology was developed to implement performance-based physical security concepts at nuclear sites and facilities.
3.1. Modeling Tools
3.1.1. PathTrace©
PathTrace© is a path analysis tool that is used to analyze all facility paths adversaries may take to achieve their goal. This tool was used in this analysis to determine the PI using a hypothetical PPS.
To determine the potential adversary paths, the software identifies multiple pathways adversaries may take. Specifically, the tool develops three paths:
• The quickest adversary path, where decreasing the task time is prioritized over decreasing the probability of detection
• The stealthiest path, where decreasing the probability of detection is prioritized over decreasing the task time
• The most vulnerable path (MVP), where the path is optimized considering the probabilities of detection, adversary task time, and response timelines
3.1.2. Blender
Blender10 is a free and open source 3D creation suite that is widely used throughout the 3D modeling community. It supports the entirety of the 3D pipeline and is designed to create efficient, highly detailed 3D models that can be ingested by any engine. The Blender toolset enables the creation of detailed, to-scale models of facilities, vehicles, and equipment that can be used for visualization, analysis, and training. The team used Blender to create the facility 3D model for this project.
3.1.3. Scribe3D© – Tabletop Recorder and Automated Tabletop Data Tool
Scribe3D© is a 3D tabletop recording and scenario visualization software created by Sandia National Laboratories (SNL). It was developed for use by other national laboratories, government organizations, and international partners using the Unity11 game engine (which has been used for a number of other training and analysis tools within the DOE complex). Unity is a commercial game engine built for developers and non-developers to create a wide variety of games and applications. It features a fully customizable framework and set of development tools.
Scribe3D© is used to create, record, and play back scenarios developed during tabletop exercises or as a planning tool for performance testing, force-on-force, and other security analysis-related applications. The capabilities offered by Scribe 3D© can help open discussions and capture their results, visualize consequences, collect data, and record events, as well as help make decisions while
10 Blender Foundation, available at www.blender.org/about/ (2019). 11 Unity Technologies, available at unity3d.com/unity (2019).

31
users develop scenarios. Data can be viewed in 2D or 3D and be played back in real-time or at various speeds. Transcript reports are automatically generated from the recorded data. The automated functions of Scribe3D© enable recorded scenarios to be run in a Monte Carlo fashion to collect large quantities of data for analysis purposes after initial scenarios are defined in the traditional tabletop exercise.
3.2. System Effectiveness Analysis Assumptions
The vulnerability assessment process uses the following assumptions:
• Pathways are determined using tabletop analysis and SME judgement
• Target areas and operational states are all accurately identified
• Adversary acts are planned and executed at a time that provides maximum opportunity for success for the adversary
• Facility security features function as-designed, and RF respond as-defined
• Appropriate threat attributes and capabilities are identified
• When data are limited or missing and the analyst must rely on subjective expert opinion, the analysis is conducted conservatively, with the advantage weighted toward the adversary
• Adversaries and response force are assumed to be equal with regard to training and combat ability
• Adversaries are willing to die to achieve their mission
• Only sabotage scenarios are analyzed
• RF strategy is denial only

32
4. HYPOTHETICAL SMR PHYSICAL PROTECTION SYSTEM
4.1. PPS Design Process
In the physical protection world, the Design and Evaluation Process Outline (DEPO) 1 has been used for several decades for the design of a PPS. The DEPO process is shown in Figure 4-1. Security-by-Design DEPO Process [2]. The process begins by defining the PPS requirements, which involves defining regulatory requirements, characterizing the facility, identifying targets, and identifying the threat. From there, the PPS is designed with appropriate elements for detection, delay, and response. Then various tools are used to evaluate the PPS, including both path analysis and performance testing. These tools have increasingly moved toward single-analyst modeling capabilities. Based on performance and identified gaps or vulnerabilities, the PPS will be redesigned. In this effort, the traditional DEPO approach was altered for the implementation of the security-by-design process. For this analysis, the first step was defining the PPS requirements. This includes identifying the regulatory requirements, characterizing the facility, identifying targets, and identifying the implementation of the design basis threat. Once the requirements were defined, initial safety and operational considerations were reviewed. The PPS was then initially designed to fit the requirements as well as the safety and operational considerations. The PPS was evaluated using path analysis and force-on-force analysis to determine overall system effectiveness. Once the system is assessed, safety and operations are considered, and the system is continually redesigned and evaluated until an effective PPS is implemented that creates the least impact to facility and safety and operations.
Figure 4-1. Security-by-Design DEPO Process [2]

33
Analysis will be conducted using current Nuclear Regulatory Commission (NRC) practices for physical protection and current technologies; a separate analysis will be conducted using advanced technologies and practices. This method will provide insights regarding the effectiveness of current practices and the possible effectiveness of using more advanced concepts and technologies.
4.2. Current Practices of Small Modular Reactor Facility Physical Protection
The base case used for the analysis includes the implementation of an Exclusion Area (EA) that functions as a limited access area (LAA), a protected area (PA), and vital areas (VA) according to current NRC Recommendations found in NRC 10 Code of Federal Regulations Part 73 (10 CFR 73). This methodology will evaluate the PPS effectiveness of current 10 CFR 73 regulations for SMRs under proposed operating conditions and methods. As part of the analyzing the efficacy of these regulations, minimal guards and response force sizes will be present.
4.2.1. Perimeter Physical Protection System Design
The site includes an EA, which functions as the site’s LAA. The EA encompasses an eight-foot high fence that functions as demarcation, is not manned by guards, and does not contain any detection or assessment technologies. The entry point for the fence is usually unlocked during standard work hours. Since the EA does not include any sensing or entry control technology, it is excluded from this analysis.
The site’s PA is controlled by a perimeter intrusion detection and assessment system (PIDAS) consisting of an outer and inner fence line (eight-feet tall with outriggers) that are separated by an isolation zone with sensing, see Figure 4-2. PIDAS Cross-section. The isolation zone sensing technology consists of bistatic microwave sensing, and the inner fence includes a vibration sensor. The entire isolation zone is covered by closed-circuit television (CCTV) cameras for assessment from the CAS. All on-site CCTV cameras are on a loop recording and automatically save 10 seconds before and after an alarm.

34
Figure 4-2. PIDAS Cross-section
The PA has two points of entry, one for personnel and one for vehicles, which are also both assessed with CCTV. The vehicle entrance is only operational during the receipt of new reactor fuel or equipment. Inner and outer hydraulic vehicle barriers are raised when the access point is not operational. The personnel entrance is manned 24/7 by two guards who perform detection of prohibited items before allowing personnel entry into the PA. Pedestrians must pass through a metal detector, an explosives detection portal, and have their on-person items sent through an x-ray machine. Once through contraband detection, pedestrians are granted access with a proximity card and the entering of a personal identification number (PIN). When receiving new reactor fuel or equipment to the site, the facility is notified ahead of time and the vehicle entry point is manned by two guards. The vehicle access control point consists of an inner and outer gate, with vehicle barriers on the outer side of each. The hydraulic vehicle barriers are maintained in a raised position when operational and only lowered one at a time as an authorized vehicle passes through as follows:
1. The driver and all other vehicle passengers must stop at the access point at the outer gate.
2. One of the guards at the access point steps out of the guardhouse and verifies the driver’s and any passengers’ credentials, as well as the shipment authorization forms. ‘
3. If authorized, the outer gate is opened, and the inner vehicle barrier lowered by the second guard.
4. The driver is then instructed to drive inside the gate and stop before the second vehicle barrier.
5. The outer vehicle barrier is raised, and the outer gate is closed.

35
6. The passengers and driver then exit the vehicle process through the personnel entrance in the same manner as described above.
7. During this time, one of the guards at the vehicle access point visually inspects the vehicle for contraband and explosives.
8. Once validated and granted access, the driver and any passengers return to the vehicle.
9. The inner hydraulic barrier is lowered by the second guard and the inner gate opened by the first guard, and the vehicle passes through.
10. The inner gate is closed, the inner vehicle barrier is raised, and the process repeats.
4.2.2. Internal Physical Protection System
All building entrances inside the PA are armed with balanced magnetic switches (BMSs) and all entrance doors are monitored by security cameras. Building entrances, except for VAs, are secured by proximity card reader access controls. The site operates four vital areas: the reactor building, two battery bank and diesel generator rooms, and the nuclear receiving building. The VAs are secured by two-factor authentication using a hand geometry reader and a PIN entrance to allow access into the VAs. All access to the reactor building, the battery bank and diesel generators, as well as the PSIT rooms requires the implementation of the two-person rule and direct visual observation to mitigate the insider threat risk. See Figure 4-3. Baseline PPS Design – Ground Floor and Figure 4-4. Baseline PPS – Basement Level for a layout of the baseline PPS design.

36
Figure 4-3. Baseline PPS Design – Ground Floor

37
Figure 4-4. Baseline PPS – Basement Level

38
5. TARGET IDENTIFICATION
The analysis will focus on adversary attacks on four target locations. These target locations will focus on direct sabotage attacks of nuclear material and indirect sabotage attacks of safety equipment at the SMR facility. The direct sabotage attacks will prioritize target locations at the reactor cores and spent fuel pools. The indirect attack scenarios will focus on attacks to the emergency battery power banks and the emergency core cooling system tanks located in the reactor building.
5.1. Direct Sabotage Targets
The hypothetical SMR operates nuclear fuel in all four reactor cores. The site also houses spent nuclear fuel within the spent fuel pool. For the purposes of this analysis, a direct sabotage attack on the below locations (Table 5-1. Sabotage Targets) is postulated to result in an Unacceptable Radiological Consequence (URC) event.
Table 5-1. Sabotage Targets
Transfer of fresh fuel into the reactor core requires a crane operator in the basement of the reactor building. The reactor must be shut down and radiation levels reduced to an operable amount from inside of the control room. Once the reactor is shut down, the crane operator will position the crane to pick up the fresh fuel and move it into the reactor core. Only one reactor unit can be opened at a time and the crane is set to a weight limit so no more than one reactor core can be fueled at a time.
Spent fuel is moved in a similar fashion. The reactor is shut down and the fuel is removed from the core by the crane operator. The fuel is then placed in the spent fuel pool. Only spent fuel from one reactor can be removed at a time based on the weight limits set by the crane.
The third target considered in this analysis is the locations that house the battery banks. The battery banks are used for emergency power to operate safety systems needed for the reactor in case offsite power is lost.
Facility Location Form of
Material
Amount of Material
On-site
(% enrichment)
Total Isotope
Amounts
Level of
Radiation
SMR
Facility
Reactor
Core
UO2 pellets in rods:
17x17 rods in an
assembly; 73 assemblies
13,478 kg U (4.9% U-
235) 660 kg U-235 High
SMR
Facility
Spent
Fuel
Pool
UO2 pellets in rods:
17x17 rods in an
assembly; 292 assemblies
53,192 kg U (4.9% U-
235)
2,606 kg U-
235 High

39
6. RESPONSE FORCE
National requirements are used as a first step to define the response force roles and responsibilities. In an actual design, the roles and responsibilities will be based on the facility’s design and site requirements.
The site will have two onsite guards to conduct personnel and package searches into the facility. The site will also have two guards in the CAS, with one shift commander present to relieve CAS operators. These guard decisions were based on the premise of reducing onsite guard members to decrease operational cost. Guards are equipped as follows:
• Handguns with approximately 45 rounds of 9-mm ammunition
• Batons
• Pepper spray
• Handcuffs with keys
• Handheld radios
The response force members are required to complete certification and training on selected weaponry and equipment that may be necessary for use in the event of an adversary attack. Weaponry and equipment for the response force members includes:
• Handguns with approximately 45 rounds of 9-mm ammunition
• Access to shoulder-fired weapons (i.e. 9-mm H&K MP-5s and 5.56-mm type rifles)
• Batons
• Pepper spray
• Handcuffs with keys
• Handheld radios
6.1. Response Force Assumptions
Due to the uncertainty in future SMR security designs and regulations, the analysis will focus on a PPS that does not use onsite armed response force personnel. Based on this assumption, no armed responders are on site12.
The first response at the site will be analyzed at 30 minutes, additional increased response times are also considered.
12 10 Code of Federal Regulations 73 “Physical Protection of Plants and Materials.”

40
7. PHYSICAL SECURITY VULNERABILITY ASSESSMENT
The concept of the design basis threat (DBT) is used to establish the threat to which the PPS of a facility is designed against. For this study (a notional facility with a notional threat) a DBT will not be used. Rather, the section below will characterize the threat spectrum used for the security study. In this vulnerability assessment, the number of adversaries were varied from four to eight. It is assumed that a passive, nonviolent insider is providing facility knowledge for the outsider threat group.
7.1. The Vulnerability Assessment Process
The evaluation of an existing or proposed PPS requires a methodical approach that measures the ability of the security system to meet defined protection objectives. Without this kind of careful assessment, valuable resources might be wasted on unnecessary protection or, worse yet, fail to provide adequate protection of material against a theft attack by the defined threat. The Vulnerability Assessment (VA) methodology was developed to implement performance-based physical security concepts at nuclear sites and facilities.
The measure of overall security effectiveness is described as system effectiveness and expressed as a probability (PE). PE is determined using two terms: the probability of interruption (PI) and the probability of neutralization (PN). Analysis techniques are based on the use of adversary paths, which assume that a sequence of adversary actions is required to complete an attack on an asset. It is important to note that PE will vary with the threat. As the threat capability increases, performance of individual security elements or the system will decrease.
Interruption is defined as the probability of arrival by the security force at a deployed location to halt adversary progress. Interruption may lead to the initiation of a combat event; however, it does not mean the task has been literally interrupted, simply that security forces have arrived before completion of the adversary task.
Neutralization is defined as the defeat of the adversaries by the security forces in a combat engagement or by other means. PN is a measure of the likelihood that the security force will be successful in overpowering or defeating the adversary, given interruption. This defeat could take many forms; it could mean the adversaries are rendered task-incapable because a vital vehicle is disabled, or key personnel are neutralized. It could mean that all adversaries are neutralized. Neutralization is simply the ability of the security force to prevent the adversary from completing its mission.
These probabilities are treated as independent variables when the defined threat:
1. Selects a path that exploits vulnerabilities in the system, and
2. Is willing to use violence against the security forces.
In this case, the effectiveness of the system (PE) against violent adversaries, expressed as the probability of interrupting and neutralizing the adversaries, is calculated by the following formula:
It is important to stress the conditional probability. Interruption (PI) is meaningless without neutralization (PN). If a system has a very high probability of interruption but lacks the firepower to respond to the given threat, the system fails. Conversely, if the system lacks the timely detection to get responders to the fight, it does not matter how well staffed and armed the response is.
41
7.2. Threat Assumptions and Characterization
The DBT assumed for this analysis is based on information from the 10 Code of Federal Regulations Part 73.1 (10 CFR 73.1). The adversary team members were assumed to have the following characteristics:
• A determined violent external assault
o Attack by stealth or deceptive actions
o Operate in groups through a single-entry point
o multiple groups attacking through multiple entries
• Military training and skills, willing to kill or be killed, enough knowledge to identify specific equipment or locations necessary for a successful attack
• Active or passive insider
• Land or water vehicles, which could be used for transporting personnel and their hand-carried equipment to the proximity of VAs
• Land vehicle bomb assault, which may be coordinated with an external assault
• Cyber attack
• Able to perform any of the tasks needed to steal or sabotage critical assets
• Armed with a 7.62 mm rifle or 7.62 mm belt-fed machine-guns (2), a pistol, ammunition, grenades, satchel charges containing bulk high explosives (not to exceed 10 kg total), detonators, bolt cutters, and miscellaneous other tools13
• Each able to carry a man-portable total load (29.5 kg [65 lb.])
• Adversary run speeds are assumed to be 3 m/s
For all scenarios, it was assumed each attack would start when the adversaries verified that no response force element (e.g., roving patrol) was within visual range of the initial breach. They would also avoid hardened and manned response positions if possible.
13 10 Code of Federal Regulations “Physical Protection of Plants and Materials.”

42
Table 7-1. Outsider High-Level Threat Assessment Used for Analysis

43
8. PATH ANALYSIS AND FACILITY UPGRADES
The analysis focused on developing a PPS that creates an effective probability of interruption (PI) for the entire site with an offsite response. PathTrace© was used to identify potential outsider adversary pathways that could be used to commit a sabotage act at the SMRF. The first portion of the analysis centered on a dedicated onsite response force with a response time of five minutes, focusing specifically on identifying the PI and improving it to 95% or greater. The second analysis focused on identifying and improving the PI to 95% or greater for an offsite response time of 30 minutes. The team concentrated on impactful facility design changes and implementation of physical protection technologies to improve the PI.
8.1. Base Case Facility and Physical Protection System Design
The offsite response force analysis focused on the implementation of building designs and PPSs that increased the probability of detection and adversary task time to improve the overall PI of the SMRF system design. For this analysis the Most Vulnerable Path (MVP) will be used for path analysis and upgrading the facility layout and the physical protection system.
For the base case and all subsequent upgrades, the MVP for three targets was analyzed. Those targets are the reactor core itself, the spent fuel pool, and the battery bank. The goal of this analysis was to reach the 95% PI threshold at 30 minutes for all three targets.
Figure 8-1. Base Case Path to All Targets
Figure 8-1. Base Case Path to All Targets shows the adversary paths to each target. For the spent fuel pool and reactor targets, the paths are largely the same (identified in orange); adversaries breach the PIDAS, move on foot to the stairwell wall, and breach it. They then move downstairs to the sabotage targets, reactor (red), and spent fuel pool (yellow). Breaching the wall allows them to avoid

44
sensing along all the doors leading to the stairwell, and though the wall breach takes an extended amount of time, it is the more vulnerable path.
Table 8-1. Base Case Timeline – Reactor Sabotage
Element Crossed PD Delay (s) At Time (s) Distance Traveled (m)
Outer Fence 0 30 0 0.08
Exclusion Zone 0.9 5.16 30 5.16
Inner Fence 0 30 35.16 0.08
Protected Area 0.02 22.69 65.16 22.69
Wall 0.75 480 87.85 0.08
Stairwell Upper 0.9 2.03 567.85 2.03
Stairwell 0.75 10 569.88 0.24
Stairwell Lower 0.9 3.65 569.88 3.65
Door 0.75 10 573.53 0.12
Reactor Area 0.9 3.88 583.53 3.88
Reactor Sabotage 0.9 900 587.41 0.12
Cumulative PD PI Time to Complete
Traversal Distance
0.99 0 1497.391 38.1
Table 8-1. Base Case Timeline – Reactor Sabotage shows the PathTrace© data output from the base case scenario for sabotage of the reactor. Though detection probability nears 100%, the path is not timely with a 30-minute RFT. Additional upgrades will be needed to force the adversary through a longer path with additional delay.
Table 8-2. Base Case Timeline – Battery Bank Sabotage shows the timeline for the Battery bank sabotage attack. The adversary breaches the PIDAS, proceeds to the Storage Building, and then to the battery bank room (identified in purple in Figure 8-1). The path lacks delay, and most of the task time is spent at the target on the sabotage action.
Table 8-2. Base Case Timeline – Battery Bank Sabotage
Element Crossed PD Delay (s) At Time (s) Distance Traveled (m)
Outer Fence 0 30 0 0.08
Exclusion Zone 0.9 5.16 30 5.16
Inner Fence 0 30 35.16 0.08
Protected Area 0.02 30.9 65.16 30.9
Door 0.75 10 96.06 0.08
Storage Building 0.8 19.98 106.1 19.98
Door 0.75 10 126 0.08

45
Battery Bank Room
0.8 8.38 136 8.38
Battery Bank Sabotage
0.9 600 144.4 0.08
Cumulative PD PI Delay After CDP
Total Time Traversal Distance
0.99 0 0 744.4 64.85
Table 8-3. Base Case Physical Protection System Path Analysis
Target
Task
Time
(s)
Cumulative
Probability
of
Detection
(%)
Probability of
Interruption
(%)
Response
Time (s)
Reactor 1497 99 0 1800
Spent
Fuel
Pool 1380 99 0 1800
Battery
Bank 744 99 0 1800
As seen in Table 8-3. Base Case Physical Protection System Path Analysis, the PI for the SMRF does not lead to an effective PPS with a 30-minute off-site response force for any target. A PI of 0% would effectively lead to a system effectiveness (PE) of 0%. Upgrades are necessary.
8.2. Upgrade One – Additional Exterior Walls, Stairwell Portal, Battery Bank Relocation, and Active Delay (Obscurants and Slippery Agents)
8.2.1. Active Delay Features – Obscurants and Slippery agents [3]
In order to achieve additional levels of delay, active (non-lethal) delay agents will be added to the PPS design. Active delay agents are those that must be deployed via a CAS action in or order to impede adversary progress. They function in concert with passive delay features in that they multiply delay times by making normal breaching techniques much harder to accomplish. These delay multiplication factors have been tested and documented with international partners in an open forum and are thus unclassified. Two less intrusive active delay features are obscurants and slippery agents.

46
8.2.1.1. Active Delay – Obscurants
Obscurants work by removing or limiting the adversary’s vision, forcing the adversary to complete a breaching task by feel only. A common obscurant is pyrotechnic smoke fired from a commercial security fogger, which can fill a small space in seconds and can be controlled and deployed by a CAS operator.
8.2.1.2. Active Delay – Slippery Agents
Slippery agents can be deployed in confined spaces to make it much harder to interact with tools or surfaces or even to stand up and move. However, when active delay features are most powerful are when they are combined. For example, if an adversary is attempting to breach a door using a charge, they enter a mantrap filled with smoke, and are immediately doused with an incredibly slippery liquid. They must feel around to find the door, attach a slippery charge to a slippery surface, and retreat across the slippery floor to detonate it. If at any time they drop a necessary tool, it becomes much harder to find, because they cannot see. In training exercises, it was observed that these features have the following delay multiplication factors, see Table 8-4. Delay Multiplication Factors. Column 3 shows how a 30-second delay feature can become a 76 second delay feature by adding active delay to it.
Table 8-4. Delay Multiplication Factors
Active
Delay
Type
Delay Multiplication
Factor
Example
Delay time (s)
Baseline 1 30
Obscurant 1.66 49.8
Slippery
Agent
1.55 46.5
Combined
Obscurant
and
Slippery
Agent
2.54 76.2
It is assumed that upon assessed detection of an adversary attack, the CAS operator will activate the obscurant features, limiting all visuals within certain areas (to be described below). The slippery agent will be deployed strategically as soon as adversaries enter key locations, in order to lengthen breach time.

47
Figure 8-2. Upgrade One – Walls and Doors at Vital Stairwells, plus active delay (obscurants and
slippery agents)
For the base case reactor and spent fuel sabotage path, the adversary enters the PA through the fence-line and isolation zone, proceeds to and breaches the wall into the reactor building stairwell, and gains access below grade. A facility design change was implemented to add an additional wall between the non-nuclear receiving building, the nuclear receiving building, and the reactor building made of the same material as the facility exterior walls. A second change was to add a secondary door to the stairwells below grade to enable the implementation of active delay features (e.g., obscurants and slippery agents) in between the two doorways of the stairwell that lead into the below-grade reactor building floor.
Figure 8-3. Upgrade One – Walls and Doors at Vital Stairwells Paths, Battery Bank Basement shows the path with the wall and active delay upgrades. The reactor and spent fuel path now takes the adversaries through two roll-up doors and the door into the stairwell.

48
Figure 8-3. Upgrade One – Walls and Doors at Vital Stairwells Paths, Battery Bank Basement
Table 8-5. Upgrade One – Sabotage Timeline – Reactor shows that this path does not add delay for reactor and spent fuel pool targets, as those breaches combined are still quicker than the initial wall breach from base case. Further upgrades are necessary for these paths.
Table 8-5. Upgrade One – Sabotage Timeline – Reactor
Element Crossed PD Delay (s) At Time (s) Distance Traveled (m)
Outer Fence 0 30 0 0.08
Exclusion Zone 0.9 5.16 30 5.16
Inner Fence 0 30 35.16 0.08
Protected Area 0.02 27.09 65.16 27.09
Roll Up Door 0.75 60 92.25 0.08
Non-Nuclear RA 0.8 12.95 152.3 12.95
Roll Up Door 0.75 60 165.2 0.08
Upper Reactor Area 0.9 6.18 225.2 6.18
Door 0.75 10 231.4 0.08
Stairwell Mantrap 0.9 1.86 241.4 1.86
Door Upgrade 2 0.75 24.5 243.3 0.08
Upper Stairwell area 0.9 1.52 267.8 1.52
Stairwell 0.75 25.4 269.3 0.24
Lower Stairwell Area 0.9 3.65 269.3 3.65
Door 0.75 10 272.9 0.12
Lower reactor Area 0.9 3.88 282.9 3.88

49
Reactor Sabotage 0.9 900 286.8 0.12
Cumulative PD PI Total Time Traversal Distance
0.99 0 1212 63.24
The battery bank path was extremely delay deficient. To remedy this, the battery bank was shifted to the basement floor to lengthen the attack path, and utilize all upgrades designed for the other targets. Additionally, mantraps were added in the stairwell leading to the battery banks. Table 8-6. Upgrade One – Sabotage Timeline – Battery Bank shows the path timeline for sabotage of the battery banks. This upgrade package still requires a great deal more delay to reach 30 minutes.
Table 8-6. Upgrade One – Sabotage Timeline – Battery Bank
Element Crossed
PD Delay (s)
At Time (s) Distance Traveled (m)
Outer Fence 0 30 0 0.08
Exclusion Zone 0.9 5.16 30 5.16
Inner Fence 0 30 35.16 0.08
Protected Area 0.02 30.81 65.16 30.81
Door 0.75 10 95.98 0.08
Storage Building
0.8 31.49 106 31.49
Door 0.75 10 137.5 0.08
Foyer 0.8 6.86 147.5 6.86
Door 0.75 10 154.3 0.08
Upper Stairwell 0.9 0.76 164.3 0.76
Door Upgrade 2 0.75 24.5 165.1 0.08
Mantrap Area 0.9 1.52 189.6 1.52
Stairwell 0.75 10 191.1 0.24
Lower Stairwell 0.9 0.82 191.1 0.82
Door Upgrade 2 0.75 24.5 191.9 0.12
Mantrap Area 0.9 0.82 216.4 0.82
Door 0.75 10 217.3 0.12
Hall 0.9 7.29 227.3 7.29
Battery Bank Door
0.75 10 234.6 0.12
Battery Bank Room
0.9 5.17 245.1 5.17
Battery Bank Sabotage
0.9 600 250.2 0.12
Cumulative PD PI Delay After CDP
Total Time Traversal Distance
.99 0 0 860.2 92.58

50
The effects of this facility upgrade can be seen below, in Table 8-7. Facility Upgrade One Results.
Table 8-7. Facility Upgrade One Results
Target
Task
Time
(s)
Probability of
Detection (%)
Probability of
Interruption
(%)
Response
Time (s)
Reactor 1212 99 0 1800
Spent
Fuel
Pool 1096 99 0 1800
Battery
Bank 860 99 0 1800
Upgrade package one, summarized in Table 8-7. Facility Upgrade One Results, increased the adversary task time. However, this increase in task time did not increase the PI. The analysis showed the probability of detection was not impacted; however, an increase in delay time was needed to improve the PI
to allow the responders sufficient time to interrupt the adversary.
51
8.3. Upgrade Two – Hardened Roll-Up Doors, Storage Building Door Mantrap, Hardened Mantraps at Battery Banks
Figure 8-4. Upgrade Two – Hardened Roll-Up Doors, Storage Building Mantrap

52
Figure 8-5. Upgrade Two – Hardened Mantraps at Battery Banks (Basement Level)
From the previous upgrade for spent fuel pool and reactor targets, the adversaries enter the facility through the roll-up doors at the receiving area and then the roll-up door at the reactor building. The roll-up doors do not provide adequate delay; therefore, they require upgrades. Concrete blocks on rails are placed behind the roll-up doors. These blocks would be locked in place when not in use to provide extra delay. For spent fuel and rector targets, the physical path remained the same; however, delay time increased. The increase was not enough to reach 30 minutes, so additional design changes were necessary.
The paths for all targets were the same, in that the adversaries took the same routes to each respective target (see Figure 8-3). For this reason, screenshots of the upgrade two paths were not included.

53
Table 8-8. Upgrade Two – Sabotage Timeline – Reactor
Element Crossed PD Delay (s) At Time (s) Distance Traveled (m)
Outer Fence 0 30 0 0.08
Exclusion Zone 0.9 5.16 30 5.16
Inner Fence 0 30 35.16 0.08
Protected Area 0.02 27.09 65.16 27.09
Roll Up Door w/ Block 0.75 180 92.25 0.08
Non-Nuclear RA 0.8 12.95 272.3 12.95
Roll Up Door w/ Block 0.75 180 285.2 0.08
Upper Reactor Area 0.9 6.18 465.2 6.18
Door 0.75 10 471.4 0.08
Stairwell Mantrap 0.9 1.86 481.4 1.86
Door Upgrade 2 0.75 24.5 483.3 0.08
Upper Stairwell area 0.9 1.52 507.8 1.52
Stairwell 0.75 25.4 509.3 0.24
Lower Stairwell Area 0.9 3.65 509.3 3.65
Door 0.75 10 512.9 0.12
Lower reactor Area 0.9 3.88 522.9 3.88
Reactor Sabotage 0.9 900 526.8 0.12
Cumulative PD PI Total Time Traversal Distance
0.99 0 1452 63.24
For the battery bank, shifting the location to the basement level and adding mantraps increased delay time, but did not reach 30 minutes. Mantraps were added at the storage building door entryway and at the entry doors to the battery bank rooms. In addition, a pair of concrete sliding barriers were added at the entrance to each battery bank room. Under normal operating conditions these barriers will both be closed, forming a mantrap just inside the battery bank access doors

54
Table 8-9. Upgrade Two – Sabotage Timeline – Battery Room
Element Crossed PD Delay (s) At Time (s) Distance Traveled (m)
Outer Fence 0 30 0 0.08
Exclusion Zone 0.9 5.16 30 5.16
Inner Fence 0 30 35.16 0.08
Protected Area 0.02 30.81 65.16 30.81
Door 0.75 10 95.98 0.08
Mantrap Area Storage Building Door
0.9 1.02 106 1.02
Door Upgrade 2 0.75 25.4 107 0.08
Storage building Building
0.9 31.49 132.4 31.49
Door 0.75 10 163.9 0.08
Foyer 0.8 6.86 173.9 6.86
Door 0.75 10 180.7 0.08
Upper Stairwell 0.9 0.93 190.7 0.93
Door Upgrade 2 0.75 25.4 191.7 0.08
Mantrap Area 0.9 2.12 217.1 2.12
Stairwell 0.75 25.4 219.2 0.24
Lower Stairwell 0.9 1.76 219.2 1.76
Door Upgrade 2 0.75 25.4 221 0.12
Mantrap Area 0.9 0.71 246.4 0.71
Door 0.75 10 247.1 0.12
Hall 0.9 6.35 257.1 6.35
Door 0.75 10 263.4 0.12
Mantrap area 0.9 0.82 273.4 0.82
Door Upgrade 2 0.75 25.4 274.2 0.12
Inner Area 0.9 2.47 300.1 2.47
Roll Up Door With Barricade Plus Retreat
0.75 210 302.6 0.12
Hardened Inner Area 0.9 2.12 512.6 2.12
Roll Up Door With Barricade Plus Retreat
0.75 210 514.7 0.12
Battery Bank Room 0.9 0.35 724.7 0.35
Battery Bank 0.9 600 725.1 0.12
Cumulative PD PI
Total Time Traversal Distance
0.99 0
1350 95.26

55
The effect of upgrade two can be seen in Table 8-10. Facility Upgrade Two below. For all targets, delay is increased but fails to reach any PI at 30 minutes RFT.
Table 8-10. Facility Upgrade Two
Target Task Time (s)
Probability of
Detection (%)
Probability
of
Interruption
(%)
Response
Time (s)
Reactor 1452 99 0 1800
Spent Fuel
Pool 1335 99 0 1800
Battery Bank 1350 99 0 1800
8.4. Upgrade Three – Active Delay for Hardened Doors, Extended Detection, Active delay along battery bank path
8.4.1. Extended Detection – Fused Radar and Video motion detection using the deliberate motion algorithm4
Using a combination of radar and video motion detection that reaches far beyond the facility perimeter, the deliberate motion algorithm (DMA) is able to decipher motion moving toward the facility, while minimizing nuisance alarms from weather or traffic in the area. It is assumed that detection begins between 200 and 300 meters from the walls of the facility. This in effect allows the RF to muster and get into position even sooner on the timeline.

56
Figure 8-6. Upgrade Three – Roll-up Door Active Delay, Extended Detection, Active delay along the
battery bank path

57
To further upgrade this system, active delay measures (slippery agents and obscurants) are added to hardened roll-up doors as well as along the path leading to the battery banks, see Figure 8-6. Upgrade Three – Roll-up Door Active Delay, Extended Detection, Active delay along the battery bank path. This upgrade is only practical on interior doors, meaning the hardened roll-up doors on the material receiving exterior walls are not upgraded. The upgrade is also applied to the hardened mantraps leading into the battery bank rooms. In addition, offsite detection capabilities using LIDAR, RADAR, and the DMA are applied to detect adversary motion in the Exclusion Area of the facility (outside of the PA). By using extended detection capabilities, it is assumed that the detection timeline begins 100 seconds earlier, which adds 100 seconds of delay.
Table 8-11. Upgrade Three – Sabotage Timeline – Reactor shows the attack timeline for the reactor path.
Table 8-11. Upgrade Three – Sabotage Timeline – Reactor
Element Crossed PD Delay (s)
At Time (s)
Distance Traveled (m)
Outer Fence 0 30 0 0.08
Exclusion Zone 0.9 5.16 30 5.16
Inner Fence 0 30 35.16 0.08
Protected Area 0.02 27.09 65.16 27.09
Roll Up Door w/ Block 0.75 180 92.25 0.08
Non-Nuclear RA 0.8 12.95 272.3 12.95
Roll Up Door w/ Block 0.75 457 285.2 0.08
Upper Reactor Area 0.9 6.18 742.2 6.18
Door 0.75 10 748.4 0.08
Stairwell Mantrap 0.9 1.86 758.4 1.86
Door Upgrade 2 0.75 24.5 760.3 0.08
Upper Stairwell area 0.9 1.52 784.8 1.52
Stairwell 0.75 25.4 786.3 0.24
Lower Stairwell Area 0.9 3.65 786.3 3.65
Door 0.75 10 789.9 0.12
Lower reactor Area 0.9 3.88 799.9 3.88
Reactor Sabotage 0.9 900 803.8 0.12
Cumulative PD PI
Total Time Traversal Distance
0.99 0
1729 63.24
For the battery bank target the active delay and hardened mantraps forced the adversary into drastic action, see Figure 8-7. Upgrade Three Sabotage Path – Battery Bank.

58
Figure 8-7. Upgrade Three Sabotage Path – Battery Bank
The path shifts and the adversary breaches the reinforced concrete wall on the exterior of the facility to gain access to the stairwell. Then, rather than braving the hardened mantrap, breaches the reinforced concrete wall into the battery bank room. These wall breaches push the timeline out to 2,567 seconds, well beyond 30 minutes, see Table 8-12. Upgrade Three – Sabotage Timeline – Battery Bank.
Table 8-12. Upgrade Three – Sabotage Timeline – Battery Bank
Element Crossed
PD Delay (s) At Time (s) Distance Traveled (m)
Outer Fence 0 30 0 0.08
Exclusion Zone 0.9 5.93 30 5.93
Inner Fence 0 30 35.93 0.08
Protected Area 0.02 9.06 65.93 9.06
Exterior Wall 0.9 900 74.98 0.08
Stairwell Upper
0.75 4.23 975 2.12
Stairwell Upper
0.75 25.4 979.2 0.24
Stairwell Lower 0.75 3.53 979.2 1.76
Door Upgrade 2
0.75 25.4 982.8 0.12
Mantrap Area 0.75 1.41 1008 0.71
Door 0.75 10 1010 0.12

59
Active Delay 0.75 16.46 1020 8.23
Wall 0.9 900 1036 0.12
Battery Bank Area
0.9 5.64 1936 5.64
Battery Bank 0.9 600 1942 0.12
Cumulative PD PI Delay After CDP
Total Time Traversal Distance
1 0.99 1700 2567 34.49
The effect of this upgrade can be seen in Table 8-13. Facility Upgrade Three. For reactor and spent fuel targets, delay times now approach 30 minutes but still fall short. A final upgrade package is necessary.
Table 8-13. Facility Upgrade Three
Target Task Time (s)
Probability of
Detection (%)
Probability
of
Interruption
(%)
Response
Time (s)
Reactor 1729 99 0 1800
Spent Fuel
Pool 1612 99 0 1800
Battery Bank 2567 99 99% 1800
These upgrades greatly increased the task time required for an adversary to complete acts of sabotage. However, even the high probability of detection did not increase the probabilities of interruption along the sabotage path for the reactor and the spent fuel pool.
However, for the battery bank path, the active delay features added to the concrete barrier mantrap in the battery bank room and along the path leading to the room push the timeline beyond 30 minutes, with a PI of 99%.

60
8.5. Upgrade Four – Below-Grade Reactor Wall
Figure 8-8. Below-Grade Reactor Wall
An additional upgrade was implemented that includes a wall placed in the below-grade of the reactor building to separate the reactor containment structures inside the reactor building. The wall was created with hardened personnel access points that allow personnel to enter the reactor building if work or maintenance is needed. The results from this upgrade can be seen in Table 8-14. Facility Upgrade Four.
Table 8-14. Facility Upgrade Four
Target Task Time (s)
Probability of
Detection (%)
Probability
of
Interruption
(%)
Response
Time (s)
Reactor 2345 99 100 1800
Spent Fuel
Pool 2228 99 100 1800

61
Target Task Time (s)
Probability of
Detection (%)
Probability
of
Interruption
(%)
Response
Time (s)
Battery Bank 2567 99 100 1800
8.6. Implementing Facility Safety and Security
8.6.1. Multiple Ingress and Egress Points
The facility design originally used a security-based approach and as a result, the facility did not have multiple ingress and egress points for emergency evacuation of the power production building. When revisiting the facility design, a second ingress and egress point and a secondary stairwell for exiting the below grade floor were added. This can be seen in Figure 8-9. Multiple Ingress and Egress Points Above-Grade.
Figure 8-9. Multiple Ingress and Egress Points Above-Grade
These changes influenced which new security system design parameters were chosen. From previous analysis the CAS and Response Force Barracks were moved into the power production area near the Control Room. This allows all targets and VAs to be located in one building. This change decreases the complexity of the RF regaining control of the site and increases adversary task time to reach the CAS while also reducing the facility footprint by removing the below-grade portion of the office building. Changes were also made to include the separation of the PSITs from the battery bank. The separation created by using multiple walls can be used to mitigate the consequences of an adversary

62
sabotage attack or leaking PSITs, which may incapacitate the battery banks and diesel generators. The inclusion of grating around the PSITs also enables proper draining of sabotaged or leaking PSITs to further mitigate this risk. These changes can be seen in Figure 8-10. Safety Related Changes to Site Layout.
Figure 8-10. Safety Related Changes to Site Layout
These changes to the facility layout resulted in a slight alteration to the PPS, creating a more effective security system. An additional change to the facility design was to place ankle-breakers into the PA. Vehicle and walking paths were also put into place. The changes can be seen in Figure 8-11: Above-Grade Security System and Figure 8-12: Below-Grade Security System.

63
Figure 8-11: Above-Grade Security System

64
Figure 8-12: Below-Grade Security System
8.6.2. Safety Changes and Security System Analysis
The following section discusses the safety and security changes and their impact on the PPS. Table 8-15. Safety Changes – Sabotage Timeline – Reactor shows the sabotage timeline for the reactor.
Table 8-15. Safety Changes – Sabotage Timeline – Reactor
Element Crossed PD Delay (s)
At Time (s)
Distance Traveled (m)
Walking/Vehicle Path 0.02 2.99 0 8.96
Protected Area 0.02 187.32 8.96 93.66
Wall 0.75 480 196.28 0.19
Multiple Complementary 0.8 2.11 676.28 6.34
Thick Wall 0.75 1440 682.62 0.19
Active Delay 0.8 3.35 2122.62 1.31
Stairwell Upper 0.8 25.4 2125.97 0.4
Active Delay 0.8 7.25 2125.97 2.83
Thick Wall 0.75 1440 2133.22 0.2
Multiple Complementary 0.8 3.23 3573.22 9.69
Hardened Roll Up Door (CDP Reached) 0.75 480 3582.91 0.2
Multiple Complementary 0.8 1.68 4062.91 5.05
Reactor 3 0.99 1440 4067.96 0.2

65
Cumulative PD PI
Total Time
Traversal Distance
0.99 0.99
5513 129
Table 8-16: Safety Changes – Sabotage Timeline – Battery Bank shows the sabotage timeline for the battery bank.
Table 8-16: Safety Changes – Sabotage Timeline – Battery Bank
Element Crossed PD Delay (s)
At Time (s)
Distance Traveled (m)
Walking/Vehicle Path 0.02 2.99 0 8.96
Protected Area 0.02 92.17 8.96 46.08
Reinforced Door with Active Delay 0.8 1219 101.12 0.19
Active Delay 0.8 8.13 1320.12 3.17
Jump 0.8 25.4 1328.26 0.4
Active Delay 0.8 5.69 1328.26 2.22
Reinforced Door with Active Delay 0.8 1219 1333.95 0.2
Active Delay 0.8 32.62 2552.95 12.72
Reinforced Door with Active Delay (CDP Reached) 0.8 1219 2585.57 0.2
Multiple Complementary 0.8 0.54 3804.57 1.62
Wall 0.75 480 3806.19 0.2
Multiple Complementary 0.8 4.17 4286.19 12.52
Battery Bank 1 0.99 300 4298.72 0.2
Cumulative PD PI
Total Time
Traversal Distance
0.99 0.99
4609 89
Table 8-17: Safety Changes – Sabotage Timeline – Control Room shows the sabotage timeline for the Control Room
Table 8-17: Safety Changes – Sabotage Timeline – Control Room
Element Crossed PD Delay (s)
At Time (s)
Distance Traveled (m)
Walking/Vehicle Path 0.02 2.99 0 8.96
Protected Area 0.02 85.82 8.96 47.2
Walking/Vehicle Path 0.02 2.55 94.78 0.19
Protected Area 0.02 14.18 102.43 2.05

66
Reinforced Door with Active Delay 0.8 1219 116.61 0.4
Active Delay (CDP Reached) 0.8 3.35 1335.61 0.4
Stairwell Upper 0.8 25.4 1338.96 0.2
Active Delay 0.8 3.62 1338.96 1.01
Door with Active Delay 0.8 25.4 1342.58 0.2
Active Delay 0.8 2.07 1367.98 7.47
Door with Active Delay 0.8 25.4 1370.05 0.2
Active Delay 0.8 64.71 1395.45 0.2
Reinforced Door with Active Delay 0.8 1219 1460.17 1.21
Active Delay 0.8 22.26 2679.17 0.2
Door with Active Delay 0.8 25.4 2701.43 7.27
Multiple Complementary 0.8 1.88 2726.83 5.65
Control Room 0.99 300 2732.48 0.2
Cumulative PD PI
Total Time
Traversal Distance
0.99 0.99
3043 111
Table 8-18: Safety Changes – Sabotage Timeline – Central Alarm Station shows the sabotage timeline for the Central Alarm Station.
Table 8-18: Safety Changes – Sabotage Timeline – Central Alarm Station
Element Crossed PD Delay (s)
At Time (s)
Distance Traveled (m)
Walking/Vehicle Path 0.02 2.99 0 8.96
Protected Area 0.02 85.82 8.96 42.91
Walking/Vehicle Path 0.02 2.55 94.78 7.65
Protected Area 0.02 14.18 102.43 7.09
Reinforced Door with Active Delay 0.8 1219 116.61 0.19
Active Delay (CDP Reached) 0.8 3.35 1335.61 1.31
Jump 0.8 25.4 1338.96 0.4
Active Delay 0.8 3.62 1338.96 1.41
Door with Active Delay 0.8 25.4 1342.58 0.2
Active Delay 0.8 2.07 1367.98 0.81
Door with Active Delay 0.8 25.4 1370.05 0.2
Active Delay 0.8 60.57 1395.45 23.62
Reinforced Door with Active Delay 0.8 1219 1456.02 0.2

67
Active Delay 0.8 20.19 2675.02 7.87
Door with Active Delay 0.8 25.4 2695.22 0.2
Multiple Complementary 0.8 2.89 2720.62 8.68
CAS 0.99 300 2729.3 0.2
Cumulative PD PI
Total Time Traversal Distance
0.99 0.99
3037 111
Table 8-19: Safety Changes – Sabotage Timeline – Spent Fuel Pool shows the sabotage timeline for the spent fuel pool.
Table 8-19: Safety Changes – Sabotage Timeline – Spent Fuel Pool
Element Crossed PD Delay (s) At Time (s) Distance Traveled (m)
Walking/Vehicle Path 0.02 2.99 0 8.96
Protected Area 0.02 187.32 8.96 42.91
Wall 0.75 480 196.28 7.65
Multiple Complementary 0.8 2.11 676.28 7.09
Thick Wall 0.75 1440 682.62 0.19
Active Delay 0.8 3.35 2122.62 1.31
Jump 0.8 25.4 2125.97 0.4
Active Delay 0.8 6.21 2125.97 1.41
Thick Wall (CDP Reached) 0.75 1440 2132.18 0.2
Multiple Complementary 0.8 4.78 3572.18 0.81
Spent Fuel Pool 0.99 1440 3586.52 0.2
Cumulative PD PI
Total Time Traversal Distance
0.99 0.99
5032 128
Table 8-20: Safety Changes – Sabotage Timeline – PSIT shows the sabotage timeline for the PSIT for a reactor.
Table 8-20: Safety Changes – Sabotage Timeline – PSIT
Element Crossed PD Delay (s)
At Time (s) Distance Traveled (m)
Walking/Vehicle Path 0.02 2.99 0 8.96
Protected Area 0.02 92.17 8.96 42.91

68
Reinforced Door with Active Delay 0.8 1219 101.12 7.65
Active Delay 0.8 8.13 1320.12 7.09
Jump 0.8 25.4 1328.26 0.19
Active Delay 0.8 5.69 1328.26 1.31
Reinforced Door with Active Delay 0.8 1219 1333.95 0.4
Active Delay 0.8 32.62 2552.95 1.41
Reinforced Door with Active Delay (CDP Reached) 0.8 1219 2585.57 0.2
Multiple Complementary 0.8 2.83 3804.57 0.81
Reactor 3 PSIT 0.99 480 3813.05 0.2
Cumulative PD PI
Total Time Traversal Distance
0.99 0.99
4307 83
Table 8-21: Safety Changes and Physical Protection System Upgrades summarizes the results of these targets.
Table 8-21: Safety Changes and Physical Protection System Upgrades
Target Task Time (s)
Probability of
Detection (%)
Probability
of
Interruption
(%)
Response
Time (s)
Reactor 5513 99 99 1800
Spent Fuel
Pool 5032 99 99 1800
Battery Bank 2567 99 100 1800
Control Room 3043 99 99 1800
Reactor PSIT 4307 99 99 1800
CAS 3037 99 99 1800

69
The PPS modified to reflect changes made in the facility designs that were impacted by safety. The safety changes impacted both the facility layout and the PPS; through integration of these changes, the facility can meet a high level of probability of interruption while maintaining safe operations.

70
9. VULNERABILITY ANALYSIS OF FACILITY DESIGN
Vulnerability assessment (VA) results are based on analysis of the physical paths that the adversary follows to achieve its objective or a set of objectives. The protection functions of detection and delay along the paths are key factors in determining the adversary attack scenario that is most likely to succeed. There are many possible combinations of potential paths to get to a target location and sabotage specific targets; therefore, all possible adversary paths must be considered. The following steps were taken in this analysis to determine system effectiveness (and ultimately system vulnerability) and facility risk.
1. An adversary timeline was constructed and all physical protection elements in the system were identified.
2. Detection and delay values for each protection layer and path elements in the Adversary Sequence Diagram (ASD) were incorporated.
3. The most vulnerable paths (MVPs) were identified by analyzing the effectiveness of detection and delay along each possible path.
4. Scenarios of concern were developed, response timelines and effectiveness were evaluated, and system effectiveness was determined.
After completing the system effectiveness analysis, the VA team examined the paths and scenarios that had lower-than-desired system effectiveness (i.e., high vulnerability) and scenarios of interest that posed a risk to the facility. The goal was to identify the system’s greatest vulnerabilities to theft so they could be mitigated.
9.1. Definition of Adversary Path
An adversary path is an ordered series of actions against a facility that, if completed, will result in a successful radiological sabotage event. Protection elements along the path potentially detect and delay the adversary so the dedicated response force can interrupt the series of events. The performance capabilities of detection, assessment, delay, and response are used in path analysis to determine the probability of interruption (PI). Key performance measures included in estimating PI
are the probability of detection (PD), delay time, and response force time (RFT).
9.2. Adversary Attack Scenarios
This hypothetical SMR facility was designed with several redundant systems to encompass the inherent safety features typical of iPWR designs. These redundant systems require the adversaries to sabotage multiple areas within the facility. Table 9-1. Sabotage Targets below describes the targets considered in this analysis.
Table 9-1. Sabotage Targets
Target Location Safety Related Purpose
Switchyard Switchyard Provides offsite power to the safety systems, reactor controls, CAS, etc.

71
Target Location Safety Related Purpose
Reactor Containment Reactor Building Provides containment of radioactive products produced in the reactor core
PSIT PSIT Room
Provide passive water injection into the reactor core (and provides forced water injection into the core)
Battery Bank/Diesel Generators
Battery Bank/Diesel Generator Room
Provide backup power to the control room, central alarm station, and reactor safety components
For this analysis two scenarios were analyzed with varying adversary team numbers and varying response force timelines. These scenarios include the adversary team attempting acts of sabotage on the three targets in a sequential order and with the adversary team splitting to accomplish the act of sabotaging the targets.
9.2.1. Sequential Attack Scenarios
The following sections describe the results of a sequential adversary attack with varying adversary team size.
9.2.1.1. Thirty-Minute Response Time
This scenario analyzes an adversary team breaching the facility and attempting to sabotage the previously identified equipment in a sequential order. The response force arrives at the 30-minute mark at the exterior of the site and begins to recapture the site. The following subsections will describe the scenario in more detail and provide results.
9.2.1.2. Response Force Win Criteria
At the end of each simulation, a response force win is awarded in the event that the adversary is unable to successfully sabotage all three targets due to attrition of adversary personnel and/or lack of required equipment to complete the necessary breaches or sabotage acts.
9.2.1.3. Time Zero
The adversary timeline begins with up to thirty minutes during which the adversary begins their attack on the facility. At this time the adversary has breached the vehicle entry control point to the site and is attempting to breach the vehicle barriers at the facility entrance. At this point an alarm would have been triggered, notifying the CAS operators of adversary movement on site (Figure 9-1. Adversary Team Breaching Vehicle Entry Control Point).

72
Figure 9-1. Adversary Team Breaching Vehicle Entry Control Point
9.2.1.4. 00:00-01:50 – Adversaries Enters Facility
Once the adversary team breaches the facility, two simultaneous actions occur: half of the adversary team begins to breach the hardened, outer rollup door into the non-nuclear receiving building and the other half of the team attempts to destroy the switchyard, which allows offsite power to reach the site (Figure 9-2. Adversary Team Sabotages the Switchyard).

73
Figure 9-2. Adversary Team Sabotages the Switchyard
9.2.1.5. Time 01:50-14:35 – Adversaries Begin Inner Rollup Door Breach
Once the outer door to the non-nuclear receiving building is breached, the adversary team begins to breach the inner rollup door. When the adversaries enter this room, they will encounter active delay such as smoke and slippery agents that drastically increase the time required to breach the hardened rollup door (Figure 9-3. Adversary Team Begins Inner Door Breach). As two members begin the breach, the remaining team members act as security for the team performing the breach.

74
Figure 9-3. Adversary Team Begins Inner Door Breach
9.2.1.6. Time 30:00 – Response Force Arrives
At thirty minutes into the scenario, the offsite response force team arrives at the site. The arrival of the response force will cause the adversary team to forgo their breach of the inner rollup door in the non-nuclear receiving building and instead the adversary team will start to engage the response force (Figure 9-4. Response Force Arrives Onsite).

75
Figure 9-4. Response Force Arrives Onsite
9.2.1.7. Time 30:00-44:45 – Adversaries Proceeds Below Grade
Once the inner rollup door into the non-nuclear receiving building is breached, the adversary team begins to proceed below grade. The adversary team must breach the man trap stairwell that leads below grade (Figure 9-5. Adversary Team Begins Stairwell Mantrap Breach).
Figure 9-5. Adversary Team Begins Stairwell Mantrap Breach

76
9.2.1.8. Time 44:45-45:45 – Adversaries Begins Lower Stairwell Breach
After the first mantrap, the adversary team will have triggered the active delay features. This causes the adversary team to proceed with caution below grade and attempt to breach the mantrap that leads into the reactor building (Figure 9-6. Lower Stairwell Breach).
Figure 9-6. Lower Stairwell Breach

77
9.2.1.9. Time 45:45-46:20 – Adversaries Begin Breach of Reactor Building Door
Once the adversary team breaches the below grade stairwell, they begin to move to the outer reactor building door. Once at this location, the adversary team begins the breach of the door into the reactor building (Figure 9-7. Adversary Team Breaches Reactor Door Building).
Figure 9-7. Adversary Team Breaches Reactor Door Building
9.2.1.10. Time 46:20-65:20 – Adversaries Begin Reactor Sabotage
Once the adversary team breaches the door into the reactor building, they begin their sabotage act on a reactor inside of the reactor building (Figure 9-8. Adversary Team Begins Reactor Breach).
Figure 9-8. Adversary Team Begins Reactor Breach

78
9.2.1.11. Time 65:20-87:15 – Adversary Begins PSIT Breach
Once the adversary team has breached the reactor, they begin to move to breach into the PSIT room. Here, the adversaries must breach into the room to gain access to sabotage the PSIT tanks. Two members of the team perform the breach while the remaining team members act as security for those performing the breach (Figure 9-9. Adversaries begin Breach into PSIT Room).
Figure 9-9. Adversaries begin Breach into PSIT Room
9.2.1.12. Time 87:15-107:25 – Adversaries Begin Breaches of PSITs
Once the adversary team has gained access into the PSIT room, they must successfully sabotage the reactor PSIT tank as well as the backup PSIT tank. This causes the reactors to lose the emergency cooling capabilities the PSIT sends into the reactor core via natural injection of water (Figure 9-10. Adversaries begin Breach of PSITs).

79
Figure 9-10. Adversaries begin Breach of PSITs
9.2.1.13. Time 107:25-115:55 – Adversary begins Breach into Battery Bank/Diesel Generator Room
Once the PSIT tanks have been breached, the adversary team begins to breach into the battery bank and diesel generator room. The adversaries must be successful, here, to not allow the water from the PSIT tanks to reach the basement floor, where the water will actively be pumped into the reactor core (Figure 9-11. Adversaries Breach into Battery Bank/Diesel Generator Room).

80
Figure 9-11. Adversaries Breach into Battery Bank/Diesel Generator Room
9.2.1.14. Time 115:55-117:20 – Adversaries Begin Battery Bank/Generator Sabotage
Once inside the battery bank and diesel generator room, the adversaries begin to sabotage the batteries and diesel generators within the room. This removes all offsite and onsite emergency power (Figure 9-12. Adversaries Sabotage Batteries and Generators).
81
Figure 9-12. Adversaries Sabotage Batteries and Generators
9.2.2. Sabotage Results – All Scenarios
A total of 100 simulations were conducted for each scenario, to evaluate the success of an adversary attack against the SMRF. In all scenarios, the adversary can gain access to the site and gain access into the non-nuclear receiving building. During the tabletop scenario process, the decision was made that the response force would immediately try to recapture the facility from the adversary team to stop the adversary team from performing acts of sabotage on the facility.
Table 9-2. Thirty Minute Sequential Results shows that as the adversary team size increases the probability of neutralization decreases. It can also be seen that as the average Blue Force killed in action (KIA) increases, the probability of neutralization decreases. In the scenario using four adversaries, the response force was successful in 99% of the scenarios. As adversary team size increases the chance of response force success decreases. As the adversary team approached six and grew to eight, on average the response loss increased to four (50% KIA), five (63% KIA), and six (75% KIA), respectively. As the adversary team size grew, the number of engagements (times any entity fired its weapon) also increased.

82
Table 9-2. Thirty Minute Sequential Results
Name Results: 4
Adversaries Results: 5
Adversaries Results: 6
Adversaries Results: 7
Adversaries Results: 8
Adversaries
Number of Runs 100 100 100 100 100
Blue Wins 99 93 78 65 41
Red Wins 1 7 22 35 59
Average Time (s)/(mm:ss) 1802/(30:02) 1803/(30:03) 1804/(30:04) 1804/(30:04) 1804/(30:04)
Average Engagements 16 20 26 29 30
Average KIA Engagements 5 7 10 11 12
Blue Force Count 8 8 8 8 8
Average Blue Force KIA 1 2 4 5 6
Average Blue KIA in Win 1 2 3 4 4
Red Force Count 4 5 6 7 8
Average Red KIA 4 5 5 6 5
Average Red KIA in Win 3 3 3 3 4
Utilizing an offsite response and a denial strategy to prevent acts of sabotage is successful 78% of the time for threats of six or fewer. Utilizing offsite response force only decreases the security system effectiveness if a specific number of offsite responders is used against a growing adversary threat. General best practice is to maintain a 3-to-1 ratio of responders to adversaries. However, utilizing local law enforcement may not always allow for this. Results for adversary threats higher than six was 65% for seven adversaries and 41% for eight adversaries (see Table 9-3. System Effectiveness by Threat). This reveals that the system fails gradually, rather than suffering a steep

83
drop at any single step. This is useful when considering the possibility of adversary attacks that may exceed the DBT. The system, as designed, offers some protection against large scale threats.
Table 9-3. System Effectiveness by Threat
In the cases in which the response force team neutralized the adversary (i.e. blue wins), the adversary team is only able to sabotage the switchyard. This is the area in which offsite power reaches the site and power produced by the turbines is sent offsite. These scenarios would not result in a radiological release. In the cases in which the response force loses (i.e. red wins), the adversary team is able to sabotage the switchyard, backup battery/diesel generators, the passive safety injection tanks, as well as breach reactor containment and the primary coolant system.
9.2.2.1. Thirty-Minute Offsite Response Force with Manned Hardened Fighting Positions
In this analysis, two hardened fighting positions were added to understand the influence a decreased onsite RF would have on the probability of neutralization and system effectiveness. Figure 9-13. Hardened Fighting Positions (below) highlights where two onsite responders are positioned based on the results from the path analysis. The first hardened fighting position is located between the two entrances that lead into the storage building. The second hardened fighting position is located between the two high-bay door openings from the nuclear receiving building and non-nuclear receiving building that leads into the reactor building.
0%
10%
20%
30%
40%
50%
60%
70%
80%
90%
100%
4 Adversaries 5 Adversaries 6 Adversaries 7 Adversaries 8 Adversaries
SYSTEM EFFECTIVENESS BY THREAT
Probability of Interruption Probability of Neutralization System Effectiveness

84
Figure 9-13. Hardened Fighting Positions
Table 9-4. Thirty-Minute Offsite Response with Manned Hardened Fighting Positions (Sequential Results)
Name Results: 4
Adversaries Results: 5
Adversaries Results: 6
Adversaries Results: 7
Adversaries Results: 8
Adversaries
Number of Runs 100 100 100 100 100
Blue Wins 99 97 88 74 61
Red Wins 1 3 12 26 39
Average Engagements 16 21 26 32 37
Average KIA Engagements 6 8 10. 12 14
Blue Force Count 10 10 10 10 10
Average Blue Force KIA 2 3 4 6 7
Average Blue KIA in Win 2 3 4 5 6

85
Name Results: 4
Adversaries Results: 5
Adversaries Results: 6
Adversaries Results: 7
Adversaries Results: 8
Adversaries
Red Force Count 4 5 6 7 8
Average Red KIA 4 5 6 6 6
Average Red KIA in Win 3 2 4 4 4
Utilizing an offsite response, two armed responders onsite in hardened fighting positions and a denial strategy to prevent acts of sabotage is successful 74% of the time for threats of seven or fewer. Utilizing offsite response force only decreases the security system effectiveness if a specific number of offsite responders is used against a growing adversary threat. General best practice is to maintain a 3-to-1 ratio of responders to adversaries. However, utilizing local law enforcement may not always allow for this. Results for adversary threats higher than seven was 61% for eight adversaries (see Table 9-4. Thirty-Minute Offsite Response with Manned Hardened Fighting Positions (Sequential Results)). This reveals that the system fails gradually, rather than suffering a steep drop at any single step. This is useful when considering the possibility of adversary attacks that may exceed the DBT. The system, as designed, offers some protection against large scale threats. In the cases in which the response force team neutralized the adversary (i.e. blue wins), the adversary team is only able to sabotage the switchyard (the area in which offsite power reaches the site and power produced by the turbines is sent offsite). These scenarios would not result in a radiological release. Table 9-5. Comparison of System Effectiveness with and without Hardened Fighting Positions (30-
Minute Response, Sequential Results)
0%
10%
20%
30%
40%
50%
60%
70%
80%
90%
100%
4 Adversaries 5 Adversaries 6 Adversaries 7 Adversaries 8 Adversaries
System Effectiveness Comparison
Without Hardened Fighting Positions With Hardened Fighting Positions

86
As the adversary team size grows larger than four members, the system effectiveness increases when using two armed responders in coordination with an offsite response force. This increase in system effectiveness is due to the response force having additional members inside of the facility. The responders located in the hardened fighting positions allow the response to engage adversary team members before entering below-grade floors. This engagement increases the number of adversaries neutralized before any sabotage acts are conducted and acts as a delay multiplier to increase the adversary task time to reach target locations. This allows the offsite response force the ability to effectively engage with the adversary team.
9.2.2.2. Sixty-Minute Offsite Response Force Time
This scenario analyzes an adversary team breaching the facility and attempting to sabotage the previously identified equipment in a sequential attack scenario. In this scenario, the offsite response force arrives on the scene sixty minutes into the attack scenario. The following tables and discussion provide insights into the effectiveness of an offsite response force with a sixty-minute response time.
Table 9-6. Thirty-Minute Offsite Response (Sequential Results)
Name Results: 4
Adversaries Results: 5
Adversaries Results: 6
Adversaries Results: 7
Adversaries Results: 8
Adversaries
Number of Runs 100 100 100 100 100
Blue Wins 96 95 85 67 59
Red Wins 4 5 15 33 41
Average Engagements 16 21 25 28 31
Average KIA Engagements 6 8 10 11 12
Blue Force Count 8 8 8 8 8
Average Blue Force KIA 2 3 4 5 6
Average Blue KIA in Win 2 3 4 4 4
Red Force Count 4 5 6 7 8

87
Name Results: 4
Adversaries Results: 5
Adversaries Results: 6
Adversaries Results: 7
Adversaries Results: 8
Adversaries
Average Red KIA 4 5 6 6 6
Average Red KIA in Win 3 3 3 4 4
Table 9-7. System Effectiveness by Threat
Utilizing an offsite response force, with a response time of sixty minutes, the response force was successful 84% of the time or greater for threats of six or fewer. Results for adversary threats higher than seven was 66% for seven adversaries and 58% for eight adversaries. In the cases where the response force team won (i.e. blue wins), the adversary team was only able to sabotage the switchyard and breach into the reactor building. No radiological release would be possible in these scenarios.
0%
10%
20%
30%
40%
50%
60%
70%
80%
90%
100%
4 Adversaries 5 Adversaries 6 Adversaries 7 Adversaries 8 Adversaries
SYSTEM EFFECTIVENESS BY THREAT
Probability of Interruption Probability of Neutralization System Effectiveness

88
Table 9-8. Comparison of System Effectiveness Based on 30- and 60-Minute Response Times (Sequential Results)
As can be seen from Table 9-8. Comparison of System Effectiveness Based on 30- and 60-Minute Response Times (Sequential Results) (above), the system effectiveness is greater for a system with an offsite response time of sixty minutes. This result is insightful in understanding how response force times effect scenarios and the results of those scenarios. In the sixty-minute response force scenario, the adversary team can leave members as security to protect the members attempting breaches. This scenario allows the response force to engage the adversary team in larger ratios such as 8:2. These larger response force sizes allow the response force to win these engagements at higher rates and allow the responders to move on the adversary team conducting breaches. The response force also has the ability to move on the target locations with more responders and neutralize the adversary team more effectively. These larger ratios of responders to adversaries allows the response force to interrupt the adversary before they are able to complete sabotage on all the required targets to cause an offsite release. This is an important insight for site security personnel and designers to understand and be familiar with when considering their physical security system.
9.2.2.2.1. Sixty-Minute Response Time with Manned Hardened Fighting Positions
Table 9-9. Sixty-Minute Offsite Response with Manned Hardened Fighting Positions (Sequential Results)
Name Results: 4
Adversaries Results: 5
Adversaries Results: 6
Adversaries Results: 7
Adversaries Results: 8
Adversaries
Number of Runs 100 100 100 100 100
Blue Wins 98 94 93 89 87
Red Wins 2 6 7 11 13
0%
10%
20%
30%
40%
50%
60%
70%
80%
90%
100%
4 Adversaries 5 Adversaries 6 Adversaries 7 Adversaries 8 Adversaries
System Effectiveness Comparison
Thirty Minute Response Sixty Minute Response

89
Name Results: 4
Adversaries Results: 5
Adversaries Results: 6
Adversaries Results: 7
Adversaries Results: 8
Adversaries
Average Engagements 20 28 34 40 43
Average KIA Engagements 5 8 9 10 12
Blue Force Count 9 9 9 9 9
Average Blue Force KIA 1 3 3 3 4
Average Blue KIA in Win 1 2 2 3 3
Red Force Count 4 5 6 7 8
Average Red KIA 4 5 6 7 7
Average Red KIA in Win 3 3.5 3.857143 4.818182 5.307693
An offsite response force time of sixty minutes with two armed responders in hardened fighting positions increases system effectiveness for a sequential attack when compared to a site without armed responders in hardened fighting positions. System effectiveness in these situations is greater than 87% for all adversary sizes. What can be seen is that this increase in system effectiveness is large enough to consider a small armed response force on site.

90
Table 9-10. Comparison of System Effectiveness with and without Hardened Fighting Positions (60-Minute Response)
9.2.3. Split Adversary Attack
The following sections describe the results of a split adversary attack with varying adversary team size.
9.2.3.1. Thirty Minute Response Time
This scenario analyzes an adversary team breaching the facility and attempting to sabotage the previously identified equipment in a split attack scenario. The response force arrives at the 30-minute mark at the exterior of the site and begins to recapture the site. The following subsections will describe the scenario in more detail and provide results.
9.2.3.2. Time Zero
The adversary timeline begins with up to thirty minutes during which the adversary begins their attack on the facility. At this time the adversary has breached the vehicle entry control point to the site and is attempting to breach the vehicle barriers at the facility entrance. At this point an alarm would have been triggered, notifying the CAS operators of adversary movement on site (Figure 9-14. Adversary Team Breaching Vehicle Entry Control Point).
0%
10%
20%
30%
40%
50%
60%
70%
80%
90%
100%
4 Adversaries 5 Adversaries 6 Adversaries 7 Adversaries 8 Adversaries
System Effectiveness Comparison
Without Hardened Fighting Positions With Hardened Fighting Positions

91
Figure 9-14. Adversary Team Breaching Vehicle Entry Control Point
9.2.3.3. 00:00-01:50 – Adversaries Enters Facility
Once the adversary team breaches the facility, two simultaneous actions occur: half of the adversary team begins to breach the hardened, outer rollup door into the non-nuclear receiving building (Team 1) and the other half of the adversary team attempts to destroy the switchyard, which allows offsite power to reach the site (Team 2) (Figure 9-15. Adversary Team Sabotages the Switchyard).

92
Figure 9-15. Adversary Team Sabotages the Switchyard
9.2.3.4. Time 01:50-14:35 – Adversaries Begin Inner Rollup Door Breach
Once the outer door to the non-nuclear receiving building is breached, Team 1 begins to breach the inner rollup door. When the adversaries enter this room, they will encounter active delay such as smoke and slippery agents that drastically increase the time required to breach the hardened rollup door (Figure 9-16. Adversaries Begin Inner Door Breach). Once the switchyard has been sabotaged, Team 2 moves around the facility toward the entrance of the storage building, which occurs at 12:40 into the timeline (Figure 9-17. Adversaries Begin Breach of Storage Building).

93
Figure 9-16. Adversaries Begin Inner Door Breach
Figure 9-17. Adversaries Begin Breach of Storage Building

94
9.2.3.5. Time 12:40-13:16 – Team 2 Begins Breach to Below Grade
As Team 1 continues its breach into the above grade floor of the reactor building, Team 2 begins its breach on the above grade stairwell mantrap. This will allow the team access to the below grade floor in the storage building (Figure 9-18. Team 2 Breaches Above Grade Storage Building Stairwell).
Figure 9-18. Team 2 Breaches Above Grade Storage Building Stairwell
9.2.3.6. Time 13:16-16:55 – Team 2 Begins Breach into PSIT Hallway
Team 2 begins the initial door breach into the hallway that allows access into the battery bank/diesel generator room and the PSIT room (Figure 9-19. Team 2 Begins Breach into PSIT Hallway). While conducting these breaches, the team will encounter active delay features.

95
Figure 9-19. Team 2 Begins Breach into PSIT Hallway
9.2.3.7. Time 30:00 – Response Force Arrives
At thirty minutes into the scenario, the offsite response force team arrives at the site. The arrival of the response force will cause the adversary team to forgo their breach of the inner rollup door in the non-nuclear receiving building and instead the adversary team will start to engage the response force (Figure 9-20. Response Force Arrives Onsite). Once inside the stairwell, Team 2 will encounter active delay features.

96
Figure 9-20. Response Force Arrives Onsite
9.2.3.8. Time 30:00-44:45 – Adversaries Proceed Below Grade
Once the inner rollup door into the non-nuclear receiving building is breached, the adversary team begins to proceed below grade. The adversary team must breach the man trap stairwell that leads below grade (Figure 9-21. Team 1 Begins Stairwell Mantrap Breach).

97
Figure 9-21. Team 1 Begins Stairwell Mantrap Breach
9.2.3.9. Time 44:45-45:45 – Adversaries Begin Lower Stairwell Breach
After the first mantrap, the adversary team will have triggered the active delay features. This causes the adversary team to proceed with caution below grade and attempt to breach the mantrap that leads into the reactor building (Figure 9-22. Team 1 Lower Stairwell Breach).

98
Figure 9-22. Team 1 Lower Stairwell Breach
9.2.3.10. Time 45:45-46:20 – Adversaries Begin Breach of Reactor Building Door
Once the adversary team breaches the below grade stairwell, they begin to move to the outer reactor building door. When they’ve arrived at this location, the adversary team begins the breach of the door into the reactor building (Figure 9-23. Team 1 Breaches Reactor Door Building).

99
Figure 9-23. Team 1 Breaches Reactor Door Building
9.2.3.11. Time 46:20-65:20 – Adversaries Begin Reactor Sabotage
Once the adversary team breaches the door into the reactor building, they begin their sabotage act on a reactor inside the building (Figure 9-24. Team 1 Begins Reactor Breach). At 47:00, Team 2 begins its sabotage of the battery bank/diesel generators (Figure 9-25. Team 2 Begins Sabotage of Battery Bank/Generator Room). Team 2 will then move to sabotage both PSIT tanks needed to finalize the sabotage event at 60:05 (Figure 9-25. Team 2 Begins Sabotage of Battery Bank/Generator Room).
Figure 9-24. Team 1 Begins Reactor Breach

100
Figure 9-25. Team 2 Begins Sabotage of Battery Bank/Generator Room
Figure 9-26. Team 2 Begins to Sabotage PSIT Tanks

101
9.2.4. Sabotage Results – All Scenarios
As Table 9-11. Thirty-Minute Split Results shows, as the adversary team size increases the probability of neutralization decreases. That can also be seen as the average Blue Force KIA increases. As adversary team size increases, the chance of response force success decreases. As the adversary team approached six and grew to eight, on average the response loss increased to two (25% KIA), two (25% KIA), and three (38% KIA), respectively. As the adversary team size grew, the number of engagements (times any entity fired its weapon) also increased. When the adversary force splits into two teams to achieve an act of sabotage, the number of responders KIA is much less than when the adversary team attempts a sequential attack. The number of adversaries KIA also increases when the adversary team attempts to complete the act as split teams, as compared to a sequential attack.
Table 9-11. Thirty-Minute Split Results
Name Results: 4
Adversaries Results: 5
Adversaries Results: 6
Adversaries Results: 7
Adversaries Results: 8
Adversaries
Number of Runs 100 100 100 100 100
Blue Wins 100 100 96 90 85
Red Wins 0 0 4 10 15
Average Time (s)/(mm:ss) 1863/(31:03) 1863/(31:03) 1863/(31:03) 1873/(31:13) 1863/(31:03)
Average Engagements 18 23 26 32 37
Average KIA Engagements 5 7 8 10 11
Blue Force Count 8 8 8 8 8
Average Blue Force KIA 1 2 2 4 4
Average Blue KIA in Win 1 2 2 3 3
Red Force Count 4 5 6 7 8
Average Red KIA 4 5 6 7 7
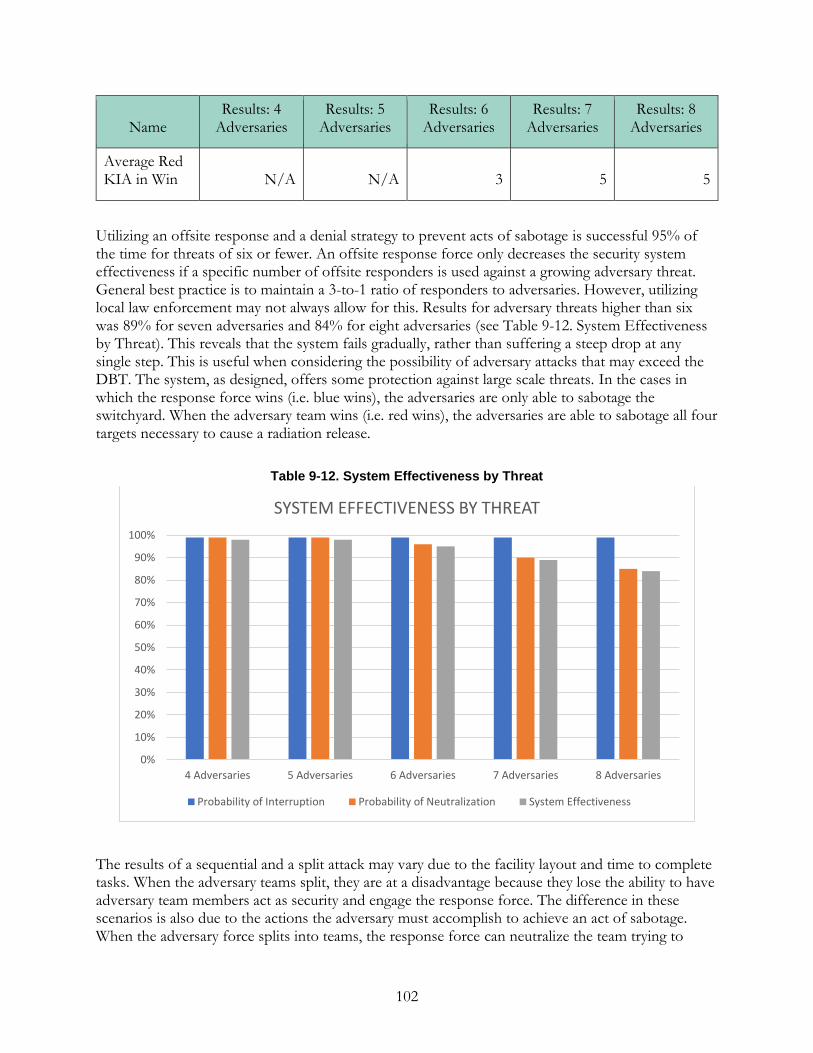
102
Name Results: 4
Adversaries Results: 5
Adversaries Results: 6
Adversaries Results: 7
Adversaries Results: 8
Adversaries
Average Red KIA in Win N/A N/A 3 5 5
Utilizing an offsite response and a denial strategy to prevent acts of sabotage is successful 95% of the time for threats of six or fewer. An offsite response force only decreases the security system effectiveness if a specific number of offsite responders is used against a growing adversary threat. General best practice is to maintain a 3-to-1 ratio of responders to adversaries. However, utilizing local law enforcement may not always allow for this. Results for adversary threats higher than six was 89% for seven adversaries and 84% for eight adversaries (see Table 9-12. System Effectiveness by Threat). This reveals that the system fails gradually, rather than suffering a steep drop at any single step. This is useful when considering the possibility of adversary attacks that may exceed the DBT. The system, as designed, offers some protection against large scale threats. In the cases in which the response force wins (i.e. blue wins), the adversaries are only able to sabotage the switchyard. When the adversary team wins (i.e. red wins), the adversaries are able to sabotage all four targets necessary to cause a radiation release.
Table 9-12. System Effectiveness by Threat
The results of a sequential and a split attack may vary due to the facility layout and time to complete tasks. When the adversary teams split, they are at a disadvantage because they lose the ability to have adversary team members act as security and engage the response force. The difference in these scenarios is also due to the actions the adversary must accomplish to achieve an act of sabotage. When the adversary force splits into teams, the response force can neutralize the team trying to
0%
10%
20%
30%
40%
50%
60%
70%
80%
90%
100%
4 Adversaries 5 Adversaries 6 Adversaries 7 Adversaries 8 Adversaries
SYSTEM EFFECTIVENESS BY THREAT
Probability of Interruption Probability of Neutralization System Effectiveness

103
sabotage the reactor before the second team may come back to offer assistance. This allows the response team to win these scenarios and stop the adversary team from completing its act of sabotage. Understanding system effectiveness is vital when determining the physical protection system, the physical protection system strategy, and response force strategy. The site may see increased system effectiveness when the adversary team decides to complete the act of sabotage in a split scenario rather than in a sequential attack.
9.2.4.1. Thirty-Minute Offsite Response Force with Manned Hardened Fighting Positions
In this analysis, two hardened fighting positions were added to understand the influence of a decreased onsite response force would have on the probability of neutralization and system effectiveness. Figure 9-27. Hardened Fighting Positions below highlights where two onsite responders are positioned based on the results from the path analysis. The first hardened fighting position is located between the two entrances that lead into the storage building. The second hardened fighting position is located between the two high-bay door openings from the nuclear receiving building and non-nuclear receiving building that leads into the reactor building.
Figure 9-27. Hardened Fighting Positions
Table 9-13. Thirty-Minute Offsite Response with Manned Hardened Fighting Positions (Split Results)
Name Results: 4
Adversaries Results: 5
Adversaries Results: 6
Adversaries Results: 7
Adversaries Results: 8
Adversaries
Number of Runs 100 100 100 100 7100
Blue Wins 100 100 100 99 97

104
Name Results: 4
Adversaries Results: 5
Adversaries Results: 6
Adversaries Results: 7
Adversaries Results: 8
Adversaries
Red Wins 0 0 0 1 3
Average Engagements 15 19 25 32 37
Average KIA Engagements 7 8 9 12 12
Blue Force Count 10 10 10 10 10
Average Blue Force KIA 2 3 3 5 5
Average Blue KIA in Win 2 3 3 5 5
Red Force Count 4 5 6 7 8
Average Red KIA 4 5 6 7 8
Average Red KIA in Win 0 0 0 4 5
Utilizing an offsite response, two armed responders onsite in hardened fighting positions and a denial strategy to prevent acts of sabotage is successful 97% of the time or greater for all threats considered. Utilizing offsite response force only decreases the security system effectiveness if a specific number of offsite responders is used against a growing adversary threat. However, the system effectiveness increases in this scenario much greater than it did in the sequential attack. In the sequential attack only one of the manned hardened fighting positions is engaging the adversary. In a split scenario, both hardened manned hardened fighting positions engages the adversary teams. This allows for increased engagements with the adversary team and increases the adversary task time to reach target locations. In the cases in which the response force wins (i.e. blue wins), the adversaries are only able to sabotage the switchyard. When the adversary team wins (i.e. red wins), the adversaries are able to sabotage all four targets necessary to cause a radiation release.

105
Table 9-14. Comparison of System Effectiveness with and without Hardened Fighting Positions (30-Minute Response, Split Results)
9.2.4.2. Sixty-Minute Offsite Response Force
Table 9-15. Sixty-Minute Offsite Response (Split Results)
Name Results: 4
Adversaries Results: 5
Adversaries Results: 6
Adversaries Results: 7
Adversaries Results: 8
Adversaries
Number of Runs 100 100 100 100 100
Blue Wins 100 100 100 99 97
Red Wins 0 0 0 1 3
Average Engagements 15 19 25 32 37
Average KIA Engagements 7 8 9 12 12
Blue Force Count 10 10 10 10 10
Average Blue Force KIA 2 3 3 5 5
75%
80%
85%
90%
95%
100%
4 Adversaries 5 Adversaries 6 Adversaries 7 Adversaries 8 Adversaries
System Effectiveness Comparison
Without Hardened Fighting Positions With Hardened Fighting Positions

106
Name Results: 4
Adversaries Results: 5
Adversaries Results: 6
Adversaries Results: 7
Adversaries Results: 8
Adversaries
Average Blue KIA in Win 2 3 3 5 5
Red Force Count 4 5 6 7 8
Average Red KIA 4 5 6 7 8
Average Red KIA in Win 0 0 0 4 5
This analysis shows that the overall system effectiveness does not change drastically between a thirty-minute response time and a sixty-minute response time. The reason for this is the adversary is split into teams; the response force can therefore overwhelm the adversary at one sabotage target location and neutralize the adversary before they can complete the full act of sabotage in most cases. When the response force wins (i.e. blue wins), the adversary team is able to sabotage the switchyard (causing a loss of offsite power), sabotage the battery bank and diesel generators (decreasing the amount of onsite power at the site), and has sabotaged a portion of the PSIT tanks. However, the adversary team has not been able to sabotage the necessary targets to cause a loss of coolant to the core or cause a radiation release.
Table 9-16. Comparison of System Effectiveness Based on 30- and 60-Minute Response Times (Split Results)
0%
20%
40%
60%
80%
100%
120%
4 Adversaries 5 Adversaries 6 Adversaries 7 Adversaries 8 Adversaries
System Effectiveness Comparison
Thirty Minute Response Time Sixty Minute Response Time

107
9.2.4.2.1. Sixty-Minute Offsite Response Force with Manned Hardened Fighting Positions
Table 9-17. Sixty-Minute Offsite Response with Manned Hardened Fighting Positions (Split Results)
Name Results: 4
Adversaries Results: 5
Adversaries Results: 6
Adversaries Results: 7
Adversaries Results: 8
Adversaries
Number of Runs 100 100 100 100 100
Blue Wins 100 100 100 99 98
Red Wins 0 0 0 1 2
Average Engagements 14 21 26 34 40
Average KIA Engagements 5 6 7 9 10
Blue Force Count 10 10 10 10 10
Average Blue Force KIA 1 2 2 2 2
Average Blue KIA in Win 1 2 2 2 2
Red Force Count 4 5 6 7 8
Average Red KIA 4 5 6 7 8
Average Red KIA in Win 0 0 0 2 5
The implementation of manned hardened fighting positions does lead to improved system effectiveness at the facility. This improved system effectiveness also decreases the amount of plant capital sabotage that occurs, as the adversary teams are significantly delayed.

108
Table 9-18. Comparison of System Effectiveness with and without Hardened Fighting Positions (60-Minute Response, Split Results)
0%
20%
40%
60%
80%
100%
120%
4 Adversaries 5 Adversaries 6 Adversaries 7 Adversaries 8 Adversaries
System Effectiveness Comparison
Without Hardened Fighting Positions With Hardened Fighting Positions

109
10. CONSIDERATIONS
The results from this analysis are useful for analyzing and designing an SMR facility for domestic applications. Specifically, this analysis proved valuable in determining facility designs and physical protection systems that can be applied to improve the probability of interruption and may lead to a higher physical protection system effectiveness. Several aspects of facility and physical protection system design have been identified that should be considered when designing and siting a domestic SMR facility.
10.1. Facility Considerations
SMR facility designers must consider the effects of their building layout when designing an SMR facility. In the design of this hypothetical facility, there was a direct pathway for the adversary to breach the walls of the reactor building that directly led to a below-grade access stairwell. This design may save on initial costs; however, security effectiveness may be impacted. The upgraded design choice was to implement an additional wall that increased the adversary task time and did not allow immediate access to the stairwells. It is important in the design phase of an SMR to consider the building material that is used in the design. Building materials can have an impact on the adversary task time and their ability to achieve their objectives. Building materials that are designed with security applications can be more cost-effective at improving security performance than industrial building materials.
An additional concept that can be implemented in facility designs to increase adversary task time is long hallways including several doors or other barriers. Hallways and doors require longer adversary movements to reach target locations, and doors present another barrier that the adversary must defeat in order to gain access to target locations. Extended hallways with multiple doors also create multiple areas in which facility operators can introduce physical protection system technologies such as active delay technologies. CAS operators also can introduce mechanisms such as magnetic locks and door strikes that force adversaries to breach doors or walls in order to get to target locations or retreat out of an SMR facility.
Another consideration is federal and local building requirements that the facility must be designed to meet. In this design, for what was within scope, it needed to be changed near the storage rooms of the facility to allow for multiple ingress and egress points. The addition of this doorway and stairwell impacted the security system and its effectiveness. These types of facility issues would be best be understood at the outset of a design. Given the wide variety of operational locations for SMRs, it may be advantageous for SMR vendors to account for the building requirements that need to be met in various operating locations.
Facility siting is also important when understanding and designing SMR facilities and their physical protection systems. Use of advanced detection capabilities such as LIDAR and RADAR detection in the EA requires optimal conditions such as flat terrain with low amounts of visual obscurants. Designers may also consider siting SMR facilities in locations that present advantages to the response force. This may include placing facilities in locations where the response force would have the higher ground to force the adversaries to advance uphill. Berms may also be placed in strategic locations where they may be effective against standoff attacks.
One of the advantages of SMRs, including iPWRs, is the redundant safety features that increase the complexity of an adversary sabotage attack on the facility. In this particular hypothetical facility, the redundancy of both onsite and offsite power increases the number of targets necessary for the adversary force to sabotage the facility to cause a release of radiation and potential core damage. It is

110
important for a site to identify all potential targets within their facility that if sabotaged could lead to potential radioactive material release or core damage at the facility that could lead to radioactive release. Site security personnel, especially offsite response force.
If offsite response forces are to be used as a dedicated response force or to augment an onsite response force, siting may consider the proximity of the site to the offsite response force location. This may aid in decreasing the response time from an offsite location to the site.
10.2. Physical Protection System Considerations
SMR facility designers must consider physical protection system elements in the design phase of their facility. These elements should include access controls, intrusion detection technologies, assessment technologies, access delay (passive and active), and response force capabilities. In this analysis we focused on understanding the probabilities of interruption when using onsite and offsite response forces and the benefits and potential vulnerabilities with offsite and onsite response forces.
Physical protection systems for SMR facilities should be designed to provide adversary detection as early as possible when using both onsite and offsite response forces. For example, the use of the LIDAR and RADAR detection technologies in the EA provides early detection before traditional detection begins at the protected area boundary. This improves and initiates the response force timeline earlier than if this detection capability did not exist on the site.
Site designers may also consider the use of active delay systems onsite such as vehicle barriers at entry control points, and potentially along the protected area perimeter to mitigate the effects vehicles pose to the site. Active access delay systems also include obscurants and slippery agents that may be used as delay multipliers. These are agents that multiply the task time of an adversary to accomplish a task such as breaching a wall or gaining access through a doorway. In combination with systems such as magnetic locks or door strikes, these methods can drastically increase delay time inside of a facility and potentially halt adversary progress. However, active delay technologies such as these can also hinder the ability of response force members to respond. Therefore, site designers must consider that if these active systems are used, the response force members may need another access point to target locations to interrupt an adversary along their path to a target location. Facility designers may introduce choke points, or locations in which an adversary must pass the response force members to reach a target location. These choke points can be used to increase the response force probability of neutralizing an adversary before they can reach their target location.
When determining the strategy of a physical protection system, the site should consider the type of attack the adversary team is capable of. The system effectiveness was greatly increased when the adversary team attempted a split attack compared to that of a sequential attack. It will be important for site security personnel to understand the potential scenarios and the response force strategy that is chosen to defend the site against each scenario. The site should also consider regular full and limited-scope performance testing and operational testing of the physical protection system and its component technologies. On a site with a reduced footprint, each element is critical in implementing an effective physical protection system. These technologies must remain in an operable and functional state to ensure there are no significant vulnerabilities in the physical protection system.
Some additional considerations may include the ability for CAS operators to lock doors and entry points inside of the facility. Increased locking mechanisms and access controls should be applied to interior doors of SMR facilities. These mechanisms can increase the potential adversary task time and force adversaries to breach facility walls and barriers that may lead to an increase in the probability of interruption and therefore the system effectiveness used on a site. These locking

111
mechanisms also increase the probability that doors within an SMR facility are locked automatically through access control systems, rather than relying on the use of guards or response force members to lock doors and entry points.
It is also important that site security personnel and response force members are intimately familiar with the site and the target locations on site. This will increase the ability of response force members to respond to adversary actions and interrupt the adversary in a timely manner. The site should conduct regular exercises with onsite response force members and/or offsite response force members and correct deficiencies as soon as possible to increase the effectiveness of the response force. SMR facilities should also consider the roadways and paths necessary for the offsite response force to reach the site. Weather on these roadways may increase the time it takes the response force to reach the site. The site should also consider if the road is blocked by either a traffic jam or the adversary acting as a blocking force on these roadways. Either of these scenarios increases the time it may take for the responders to reach the site. This increase in response force time can negatively impact the system effectiveness and the ability of the site to properly defend itself against an adversary threat.

112
11. CONCLUSION AND FUTURE WORK
Several main conclusions can be drawn from this analysis. The hypothetical facility design for this study was an iPWR facility that was designed to reduce its physical footprint and therefore construction and operational cost. A SSBD approach allows for the development of security by design in the design phase of a facility. In doing this, the site footprint can remain small; the physical protection system should be designed to minimize normal operational impact but also be effective.
Offsite response forces require a facility and physical protection system design that implements enough delay time against the adversary for the offsite response to interrupt and neutralize the adversary. From the analysis conducted, it can be determined that active access delay measures with multiplication effects on adversary task time can be impactful in improving the physical protection system probability of interruption by allowing offsite response sufficient time to travel to the site and interrupt the adversary’s progress. However, as discussed previously, active access delay features may pose a risk to operations due to their need for consistent testing and maintenance. These systems may also impact the response force’s ability to respond. The site designers should consider alternative entrance points that the response force may use to interrupt the adversary before the adversary reaches the target location.
Another important factor is the location in which an SMR facility is sited. If offsite response force members are used, the designers may consider the site location and its proximity to the offsite response force location. Designers must also consider using natural landmark features to protect the site from potential standoff attacks and provide a strategic advantage for responders.
An important note on the current design is that it was created to maximize delay time but does not consider response force ability to recapture the site. Furthermore, a 30-minute offsite response time may not be adequate for most locations, so sites should build their physical protection system timeline on the response force time needed by an offsite team.
This analysis highlighted the impact of an adversary team attempting to breach the facility in a sequential and split attack scenario. Sites should determine the adversary capabilities and understand all potential pathways and scenarios with each attack type. The system effectiveness drastically changes based on the adversary attack type. Sites should implement performance testing, limited-scope performance testing, regular force-on-force exercises, and tabletop exercises to ensure the success of their physical protection system strategy. Force-on-force exercises and tabletop exercises should be conducted regularly to ensure site responders have an adequate understanding of the potential threat and how to best implement the response force strategy under each circumstance. In this analysis, hardened fighting position locations were identified along key adversary pathways to interrupt and neutralize an adversary force. Facility designers and security personnel should consider, when using a reduced response force size, hardened fighting positions along a choke point to interrupt an adversary. This effort can reduce onsite response force staffing and improve physical security system effectiveness.
Future efforts in this area include analyzing the effectiveness of the current physical protection system strategy while implementing hardened fighting positions and analyzing increased response force times of sixty minutes and ninety minutes. Additional work could consider a SSBD approach for various SMR reactor types such as pebble bed reactors, or molten salt reactors. These reactors have unique designs in which physical protection systems must be designed considering the unique characteristics of these facilities.

113

114
REFERENCES
[1] Nuclear Regulatory Commission. 10 Code of Federal Regulations. Part 73: Physical
Protection of Plants and Materials.
[2] Garcia, M.L. 2008. Design and Evaluation of Physical Protection Systems, 2nd edition, Sandia National Laboratories.
[3] Sandia National Laboratories Determining Delay Multiplication Factors Exercise
(SAND2006-4605P)
[4] Light Water Reactor Sustainability Program, “Evaluate Tools and Technologies that Would
Benefit the Advancement of Risk-Informed Models” (2020) SAND 202-9055

115
DISTRIBUTION
Click here, then press delete to remove this guidance statement.
Required. Must be on an odd-numbered page. SAND Reports submitted through R&A are
automatically sent to the Technical Library; however, it still needs to be included on the
distribution.
Ensure a blank odd-numbered page is inserted prior to the back cover.
Click here, then press delete to remove this guidance statement.
If emailing a copy internally, include the recipient’s name, org., and Sandia email address. List in
ascending order by org. number, then alphabetize by the recipient’s last name. The Technical
Library will not be listed by org. and will be the last entry. At a minimum, the Technical Library
will be listed.
Email—Internal
Name Org. Sandia Email Address
Technical Library 01977 [email protected]
Click here, then press delete to remove this guidance statement.
If emailing a copy externally, include the recipient’s name, company email address, and
company name. OUO SAND Reports must be sent via encrypted email. List by first name, then
last name (e.g., John Doe), then alphabetize by the recipient’s last name. Delete the table if not
emailing externally.
Email—External (encrypt for OUO)
Name
Company Email
Address Company Name

116

117
Click here, then press delete to remove this guidance statement.
If sending a hardcopy internally, indicate the number of copies being sent and list the
recipient’s name, org., and mailstop. List mailstops in ascending order, then alphabetize by the
recipient’s last name. Delete the table if not sending hardcopy.
Hardcopy—Internal
Number of
Copies Name Org. Mailstop
Click here, then press delete to remove this guidance statement.
If sending hardcopies externally, indicate the number of copies being sent and list the
recipient’s name, company name, and full company mailing address. List by first name, then
last name (e.g., John Doe), then alphabetize by the recipient’s last name. Delete the table if not
sending hardcopy.
Hardcopy—External
Number of
Copies Name
Company Name and
Company Mailing Address

118
This page left blank

119
This page left blank

Sandia National Laboratories is a multimission laboratory managed and operated by National Technology & Engineering Solutions of Sandia LLC, a wholly owned subsidiary of Honeywell International Inc. for the U.S. Department of Energy’s National Nuclear Security Administration under contract DE-NA0003525.