u.s. department surface-aggregate forest service ... · this project analyzes the use of calcium...
TRANSCRIPT
Surface-Aggregate Stabilization with Chloride Materials
FOREST SERVICE
DEP A RTMENT OF AGRICU L T UR
E
U.S. Department of Agriculture
Forest Service
National Technology and Development Program
0677 1805—SDTDC
7700—Transportation Management
December 2006


Information contained in this document has been developed for the guidance of employees of the U.S. Department of Agriculture (USDA) Forest Service, its contractors, and cooperating Federal and State agencies. The USDA Forest Service assumes no responsibility for the interpretation or use of this information by other than its own employees. The use of trade, firm, or corporation names is for the information and convenience of the reader. Such use does not constitute an official evaluation, conclusion, recommendation, endorsement, or approval of any product or service to the exclusion of others that may be suitable.
The U.S. Department of Agriculture (USDA) prohibits discrimination in all its programs and activities on the basis of race, color, national origin, age, disability, and where applicable, sex, marital status, familial status, parental status, religion, sexual orientation, genetic information, political beliefs, reprisal, or because all or part of an individual’s income is derived from any public assistance program. (Not all prohibited bases apply to all programs.) Persons with disabilities who require alternative means for communication of program information (Braille, large print, audiotape, etc.) should contact USDA’s TARGET Center at (202) 720-2600 (voice and TDD). To file a complaint of discrimination, write USDA, Director, Office of Civil Rights, 1400 Independence Avenue, S.W., Washington, D.C. 20250-9410, or call (800) 795-3272 (voice) or (202) 720-6382 (TDD). USDA is an equal opportunity provider and employer.
Surface-Aggregate Stabilization with Chloride Materials
bySteve Monlux, P.E., Materials Engineer (Retired), USDA Forest Service, Northern Region, Missoula, MT
Michael R. Mitchell, P.E., Civil Engineer (Retired), National Technology and Development Program, San Dimas Technology and Development Center, San Dimas, CA
December 2006


v
Table of Contents
Executive Summary .......................................................................................................................1
Introduction ........................................................................................................................................3
Project Scope ....................................................................................................................................4
Road Selection .................................................................................................................................7
Test Road Construction ...............................................................................................................7
Project Monitoring
Road Surface Performance Monitoring ....................................................................8
Soil, Water, and Tree Monitoring .................................................................................9
Weather Monitoring ..........................................................................................................10
Construction Monitoring ................................................................................................10
Road Blading Maintenance ........................................................................................... 11
Road Use ......................................................................................................................................... 11
Laboratory Testing of Aggregate and Chloride Materials ...................................... 11
User Guide for Chloride Stabilization Projects .............................................................12
Cost and Performance Analysis ............................................................................................13
Intangible Benefits .......................................................................................................................16
Conclusions
Treated Sections versus Untreated Sections ....................................................17
Treated Sections ................................................................................................................18
Construction ........................................................................................................................19
Recommendations
Design ......................................................................................................................................21
Construction .........................................................................................................................21
Maintenance .........................................................................................................................22
Additional Studies .......................................................................................................................23
Acknowledgements ......................................................................................................................23

vi
Surface-Aggregate Stabilization with Chloride Materials
Appendixes (on enclosed CD)
A—Project Characteristics and Performance
1—Project Area Map
2—Project Characteristic Summaries
3—Two-year Performance Curves
4—Project Characteristics and Performance Curves
5—Performance Life Ratios
6—Performance Equation (RESERVED)
B—Cost Analysis
1—Construction Cost Estimate
2—Blading Maintenance Costs
3—Construction and Maintenance Costs Analysis
4—Average Vehicle Speed
5—Road User Costs
6—Aggregate Loss by Vertical Survey
7—Aggregate Loss by Loss of Dust
8—CostBenefitSummaryandAnalysis
9—Life Cycle Costs
C—Construction and Maintenance
1—ConstructionSpecification
2—Chloride Quality and Quantity Assurance
3—Maintenance Methods
D—Project Photos, Power Point Presentation
1—Project Photos
2—PowerPoint® Presentation
vii
Table of Contents
E—Test Results
1—Aggregate Test Results
2—Chloride Mix Design Curves
3—Roadside Soil Chloride Content
4—Stream Water Quality
5—Chloride Content in Roadside Trees
6—Chloride Product Quality
F—Measurement Methods
1—Performance Measurement Form
2—Aggregate Loss Measurement
3—Tree Sampling
4—Chloride Mix Design Method
5—Aggregate Fracture
G—Supporting Analysis Spreadsheets
1—TrafficCountandClassification
2—Weather Summary
3—2003and2004ConditionIndex,TrafficSpeed,andCountAnalysis
4—Condition Index versus Blading Needed-Critical
H—Unsurfaced Road Condition Index (URCI)
U.S. Army Corps of Engineers Special Report 87-15
I—Test Road Plan
J—Implementation Guide

1
Executive Summary Road managers should consider chloride stabilization as a cost-effective method when selecting maintenance options and strategies for aggregate-surface roads. This stabilization technique also is a viable option for newly crushed aggregate. With proper maintenance, stabilized aggregate-surfaced roads have a projected life of 10 years, resulting in an annual maintenance cost savings of $3,300 per mile when compared tountreatedaggregatesurfacing.Additionalbenefitsofchloridestabilization include improved ride, reduced sedimentation in streams, reduced aggregate resource depletion, reduced inhalation health hazards, reduced vehicle maintenance, and increased road-user safety.
This publication provides Federal, State, county, and local road managers information on the performance and cost effectiveness of road-mixing high applications of calcium and magnesium chloride that are applied in a one-time construction process. Stabilization provides a much higher standard of road surface performance by improving ride quality and reducing dust, washboarding, and raveling (loose aggregate). Road managers can expect similar results when using this process with newly crushed aggregate.
The purpose of this project was to develop guidelines for chloride-stabilization and aggregate-surfacing materials in various environments. Road maintenance engineers monitored construction and maintenance costs, road surface deterioration, weather conditions, environmental effects, and construction materials for 2 years. The data collection and analysis provides a valuable tool for road managers.
Benefitsandcosteffectivenessofchloridestabilizationweremeasuredon 12 projects constructed in 2003 and monitored for two seasons in four Western States. Thirty-nine treated and 40 untreated sections were built with magnesium and calcium chloride mixed at two concentrations (1.5-percent and 2-percent pure chloride based on the dry weight of aggregate) with crushed aggregate surfacing 2 inches deep. Detailed periodic distress measurements of road surface conditions have shown significantreductionsindusting,raveling,andwashboardingforthestabilized sections.
Construction costs for inplace stabilization are about $8,000 to $10,000 per mile depending on the chloride, construction process, and project location. Construction costs are offset by cost reductions for maintenance grading (blading), aggregate loss, and vehicle-use. Based on the projected life of the treated sections, the average annual savings for the 12 projects was $3,300 per mile. The greatest savings are realized on projects where aggregate-surfacing replacement costs and average daily trafficvolumesarehigh.Additionalqualitativebenefitsareincreased
2
Surface-Aggregate Stabilization with Chloride Materials
road-user safety, higher standard of road surface, reduced sedimentation in streams, reduced aggregate resource depletion, and reduced inhalation health hazard (dust). Cost analysis indicates treatment methods pay for themselves by the second season and, with proper maintenance treatments, will last 10 years.
After 2 seasons, monitoring indicates that, on average, treated surfacing needed blading after 25,500 vehicles, where untreated surfacing needed blading after only 3,200 vehicles; thus treated sections initial performance life was 8 times greater than untreated sections.
Based on 2 years of monitoring and analysis, chloride stabilization works wellinmoderatelydryclimates(semiarid),wheredailytrafficvolumesare less than 250, and where crushed aggregate surfacing is well graded and has more than 11-percent minus #200 material. Performance is also influencedbytheamountof0.02-millimetermaterialandtheplasticityindex.
Performance of both magnesium chloride and calcium chloride was similar after 2 years. They are both hygroscopic (moisture absorbing) and deliquescent (moisture retaining). They attract moisture from air andpromotegreaterdensityandcapillarytensionoffinesinaggregatesurfacing that helps bond the materials together. There are some significantconstructionadvantagesandresultingcostsavingswithdryorsolid chlorides versus liquid chlorides. Although blade-mixing chlorides with a grader works, it costs more than mixing with a cross-shaft mixer or tractor-tiller.
Adverse environmental effects from the chloride on roadside trees and streams, along with lateral migration in the soil, were not shown to be a significantproblem.Staffcollected96soilsamples,20watersamples,and 202 tree samples and tested them for chloride content.
Thirty-six appendixes (on the enclosed CD) provide detailed cost and performance analysis, testing protocols and results, and construction and maintenancespecifications.Theinformationandtoolsintheappendixeswill help road managers determine if stabilization is a cost-effective option.
3
Introduction Each year, U.S. Department of Agriculture (USDA) Forest Service road managers maintain thousands of miles of unpaved roads by surface grading (blading). Blading is a high-cost activity typically done up to three times per year on heavily traveled roads. Aggregate-surface blading is a maintenance activity that also contributes to the increase of stream sediment and contamination and breakdown of expensive aggregate surfacing.
With road-surface stabilizers, the frequency of blading can be reduced significantlyandresultsinfinancialsavingsandreducedenvironmentaleffects. Prior to this project, the USDA Forest Service’s Northern Region completed a total of four projects that mixed calcium chloride into the road surface 2 inches deep. These projects had excellent results in stabilizing the aggregate-road surface and extending the service life between maintenance blading.
This project analyzes the use of calcium chloride and magnesium chloride as an aggregate-surface stabilizer with the following objectives:
nRefineachloridestabilizationprocessforcrushed-aggregateroadsurfaces that road managers can implement to reduce blading maintenance, sediment generation, and road-surface defects, including dust, washboards, loose aggregate, and potholes.
n Determine long-term cost-effectiveness of the treatment in various conditionssuchasenvironment,traffic,roadsurfacematerials,roadgeometric, construction techniques, chloride types, and concentration percentage of the chloride treatment.
n Determine if streamwater quality and roadside vegetation are adversely affected.
n Develop tools for road managers to implement stabilization. These tools include:
n Cost estimating guide.
n Guidelines for predicting performance in various conditions.
n Design guide for appropriate stabilization thickness, con- centration percentage, product type, and construction process.
n Constructionspecification.
n Quality control and quality assurance procedures.
n Maintenance procedures for blading.

4
Surface-Aggregate Stabilization with Chloride Materials
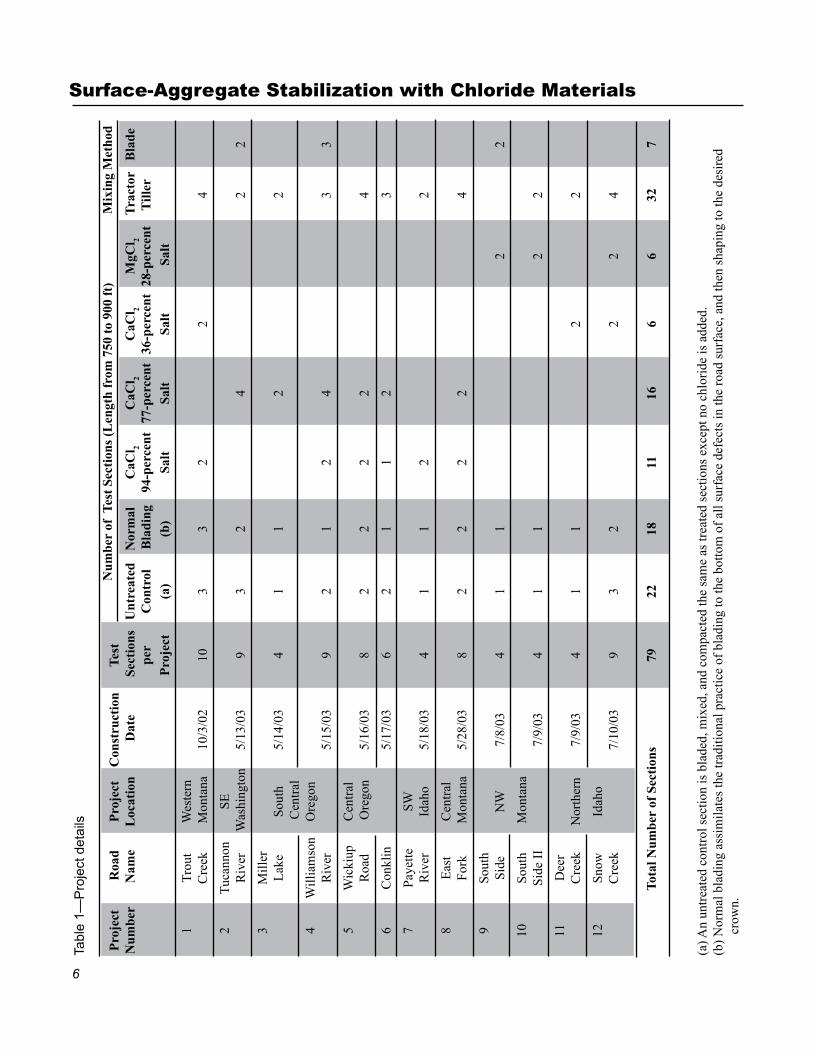
Project Scope Staff engineers selected 12 roads in relatively dry-climate areas of Montana, Washington, Idaho, and Oregon. Appendix A1 shows the 12 roads plotted on an area map. Then, they divided each road into similar test sections ranging in length from 750 to 900 feet--79 test sections in all. For each project, the contractor constructed three types of sections, using four types of chlorides at concentration rates of 1.5- and 2.0-percent pure chloride salt based on the dry weight of aggregate. They mixed the treated sections with chloride using the blade and with a tractor-tiller (cross-shaft mixer). The contractor mixed at least one untreated control section with the blade or tractor-tiller to see if the constructionprocessprovidedsignificantbenefitsbyitself.Theybuiltatleast one section to model the normal maintenance blading that is done oneachroad.Projectlocationsareshowninfigure1andprojectdetailsare in the table 1.
Performancemonitoring,measurements,andtestingareasignificantpartof this project. Engineers measured road surface defects three to four times each season to determine the effective life of each test section. The treatment life and costs for aggregate loss, construction, maintenance, and road user costs are the primary inputs for a lifecycle cost analysis. Theyalsomeasuredenvironmentalinfluencesbytestingchloridemigration, roadside tree chloride concentration, and adjacent streams for streamwater contamination.
This publication provides project characteristics for the 12 projects, allowing forest road managers to determine if roads they want to stabilizearesimilar.Thesecharacteristicsaretrafficvolume,ambienttemperature, relative humidity, rainfall, road geometrics, aspect, canopy, and aggregate surface.

5
Figure 1—Project location map.
6
Surface-Aggregate Stabilization with Chloride MaterialsTa
ble
1—P
roje
ct d
etai
ls
Pro
ject
R
oad
Pro
ject
C
onst
ruct
ion
Tes
t
Num
ber
of T
est
Sect
ions
(L
engt
h fr
om 7
50 t
o 90
0 ft
) M
ixin
g M
etho
d
Num
ber
Nam
e L
ocat
ion
Dat
e S
ecti
ons
Unt
reat
ed
Nor
mal
C
aCl 2
CaC
l 2 C
aCl 2
MgC
l 2 T
ract
or
Bla
de
per
Con
trol
B
ladi
ng
94-p
erce
nt
77-p
erce
nt
36-p
erce
nt 2
8-pe
rcen
t T
iller
Pro
ject
(a
) (b
) Sa
lt
Salt
Sa
lt
Sal
t
1
Tro
ut
Wes
tern
Cre
ek
Mon
tana
10
/3/0
2 10
3
3 2
2
4
2
Tuc
anno
n
SE
R
iver
W
ashi
ngto
n 5/
13/0
3 9
3 2
4
2 2
3
Mill
er
Lak
e
Sout
h 5/
14/0
3 4
1 1
2
2
Cen
tral
4
Will
iam
son
O
rego
n
Riv
er
5/
15/0
3 9
2 1
2 4
3 3
5
Wic
kiup
C
entr
al
R
oad
Ore
gon
5/16
/03
8 2
2 2
2
4
6
Con
klin
5/17
/03
6 2
1 1
2
3
7
Paye
tte
SW
R
iver
Id
aho
5/18
/03
4 1
1 2
2
8
Eas
t C
entr
al
Fo
rk
Mon
tana
5/
28/0
3 8
2 2
2 2
4
9
Sout
h
Si
de
NW
7/
8/03
4
1 1
2
2
10
So
uth
M
onta
na
Si
de I
I
7/9/
03
4 1
1
2 2
11
D
eer
C
reek
N
orth
ern
7/
9/03
4
1 1
2
2
12
Sn
ow
Idah
o
Cre
ek
7/
10/0
3 9
3 2
2 2
4
T
otal
Num
ber
of S
ecti
ons
79
22
18
11
16
6
6 32
7
(a) A
n un
trea
ted
cont
rol s
ectio
n is
bla
ded,
mix
ed, a
nd c
ompa
cted
the
sam
e as
trea
ted
sect
ions
exc
ept n
o ch
lori
de is
add
ed.
(b)
Nor
mal
bla
ding
ass
imila
tes
the
trad
ition
al p
ract
ice
of b
ladi
ng to
the
botto
m o
f al
l sur
face
def
ects
in th
e ro
ad s
urfa
ce, a
nd th
en s
hapi
ng to
the
desi
red
crow
n.

7
Road Selection The goal in road selection was to get a broad cross section of roads—that were in relatively dry climates—in three USDA Forest Service western regions. Within each road, test sections have similar aggregate, exposure, canopy, aspect, grade, and curvature. There were problems achieving similartestsectionsonthreeprojects:thefirstsegmentoftheTucannonRiver Road had different aggregate; sections of the East Fork Road had minimal aggregate thickness; and road curvature and vehicle-speed variations were problems on the Conklin Road.
Test Road Construction Moline Grading, Sandpoint, ID, was awarded a service contract for
construction in September 2002. Oxford Inc., Moyie Springs, ID, provided, applied, and mixed all chloride materials. Moline Grading built the Trout Creek Road project as a pilot project in October 2002. They built the remaining 11 projects between mid May and early July 2003. The general construction process was as follows (see appendix D1 for photos of the construction process):
n Water all sections to assist the initial blading and shaping.
n Blade all sections to remove ruts, washboards, potholes, and process in loose aggregate. The road surface was shaped to a 4-percent crown.
n Water the road surface to ensure that the aggregate would be at optimum moisture during mixing where solid (dry) products were used. Do not apply water to the road surface prior to mixing liquid products for fear of exceeding optimum moisture.
n Apply and till chloride into the top 2 inches of aggregate for tractor-tiller mixed sections. Lightly shape the surface to ensure a 4-percent crown and then compact with a loaded watertruck. Note that the constructionspecificationinappendixC1requiresapneumaticroller,whichismoreproficientandcosteffectiveonlongerprojects.Applyalightsurfaceapplicationofchloridetothefinishedsurface.
nBuild,size,andflattenwindrowsforblade-mixedsections.Basethesize of the windrow on a 2-inch compacted depth times a 1.25-swell factor.Spreadchloridematerialsontheflattenedwindrowandmixby moving material from one side of the road to the other, two times. Then, shape the mixed surfacing to a 4-percent crown and compact withaloadedwatertruck.NotethattheconstructionspecificationinappendixC1requiresapneumaticroller,whichismoreproficientand cost effective on longer projects. Finally, spread a light surface applicationofchlorideonthefinishedsurface.
n Use application rates shown in table 2 for stabilization and surface application.
8
Surface-Aggregate Stabilization with Chloride Materials
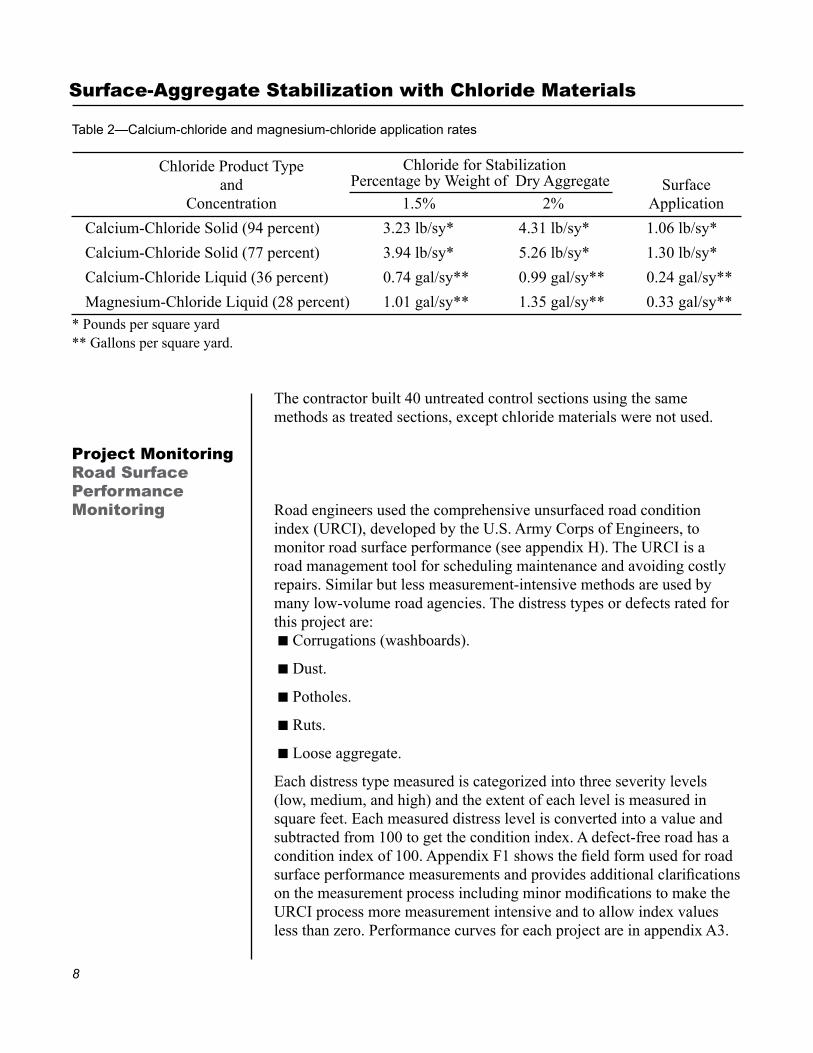
Table 2—Calcium-chloride and magnesium-chloride application rates
Chloride Product Type Chloride for Stabilization and Percentage by Weight of Dry Aggregate Surface Concentration 1.5% 2% Application
Calcium-Chloride Solid (94 percent) 3.23 lb/sy* 4.31 lb/sy* 1.06 lb/sy*
Calcium-Chloride Solid (77 percent) 3.94 lb/sy* 5.26 lb/sy* 1.30 lb/sy*
Calcium-Chloride Liquid (36 percent) 0.74 gal/sy** 0.99 gal/sy** 0.24 gal/sy**
Magnesium-Chloride Liquid (28 percent) 1.01 gal/sy** 1.35 gal/sy** 0.33 gal/sy*** Pounds per square yard** Gallons per square yard.
The contractor built 40 untreated control sections using the same
methods as treated sections, except chloride materials were not used.
Project MonitoringRoad Surface Performance Monitoring Road engineers used the comprehensive unsurfaced road condition
index (URCI), developed by the U.S. Army Corps of Engineers, to monitor road surface performance (see appendix H). The URCI is a road management tool for scheduling maintenance and avoiding costly repairs. Similar but less measurement-intensive methods are used by many low-volume road agencies. The distress types or defects rated for this project are:
n Corrugations (washboards).
n Dust.
n Potholes.
n Ruts.
n Loose aggregate.
Each distress type measured is categorized into three severity levels (low, medium, and high) and the extent of each level is measured in square feet. Each measured distress level is converted into a value and subtracted from 100 to get the condition index. A defect-free road has a conditionindexof100.AppendixF1showsthefieldformusedforroadsurfaceperformancemeasurementsandprovidesadditionalclarificationsonthemeasurementprocessincludingminormodificationstomaketheURCI process more measurement intensive and to allow index values less than zero. Performance curves for each project are in appendix A3.
9
An example of the Tucannon River Road project performance curve isshowninfigures2and3(seefiguresfolderonenclosedCD).Foradditional information on URCI, refer to appendix H.
Prior to construction, engineers took aggregate loss measurements using a vertical survey grid on two sections of each project, one treated andoneuntreated.Thefinalmeasurementsarescheduledfor2006.Appendix F2 provides a protocol for the measurement process. It is assumed that all loss is from the road surface and not from intermixing with the subgrade since all roads have been arterials for many years and the subgrades are stable. Appendix B6 shows the initial aggregate-loss survey data for each project.
Engineers measured road surfacing strengths with a Clegg hammer. Strengths for treated and untreated sections had such a broad and overlapping range that the test was dropped from the monitoring program in August 2004.
The engineers observed road surface conditions to determine if blading was needed and to determine reasonable vehicle speed on each section. Vehiclespeedisimportantbecauseitinfluencesusercostsandprovidesanother indication of road serviceability. Reasonable vehicle speeds and corresponding thresholds for blading needed and blading critical are on performance curves to provide a better description of the extent of deterioration that was taking place during each season. A 25-percent reduction in vehicle speed correlates with blading needed and a 40-percent reduction in vehicle speed correlates with blading critical. These thresholdsarethebasisforfiguringmaintenanceandusercosts.
Soil, Water, and Tree Monitoring Engineers took 48 soil samples, from both treated and untreated sections
on the road shoulder, before construction on each project. After two seasons, they took 48 additional samples on these same sections to seeiftherewasasignificantchangeinchlorideconcentration.Datain appendix E3 shows a rise in soil chloride levels that are below the thresholds for concern.
Before and after treatment of the Tucannon River Road, engineers measured chloride levels in the Tucannon River. Umatilla National Forestfisheriesbiologist,DellGroat,arrangedforsamplingandtestingof river water. The river varied 15 to 20 feet from the road shoulder. ResultsshowninappendixE4indicatethereisnosignificantchangeincalcium- or chloride-ion levels in the water after treatment.

10
Surface-Aggregate Stabilization with Chloride Materials
On 4 projects, before construction, staff sampled 101 conifers close to the road and adjacent to a treated and an untreated test section. Locations of trees ranged from 5 to 50 feet from the road shoulder. Staff took duplicate samples from the same trees after two growing seasons to see iftherewasasignificantincreaseinchlorideconcentration.Datafromtree samples in appendix E5 indicates the chloride level increased, but isnotasignificantlong-termthreattovegetationsurvival.USDAForestService Northern Region plant pathologist, Blakey Lockman, provided the sampling, testing protocol, and review of the results and conclusions. Photos of each section were taken before treatment in 2003 and two growing seasons after treatment in fall 2004. There was no discernible difference between the photo sets.
Weather Monitoring Onsite gauges measured relative humidity and temperature on all 12 projects. Gauges measured onsite rainfall on six projects. During 2003, staff gathered data on the other six projects using nearby remote automated weather stations. In 2004, all projects had onsite rainfall gauges. Onset Computer Corporation manufactured the onsite weather monitoring equipment. A summary of weather data is provided in appendixes A2 and G2 by project and year.
The data for spring, summer, and fall begins and ends when the average air temperature for 3 consecutive days reaches 32 degrees Fahrenheit. Deterioration of the road surface essentially stops when temperatures drop below freezing unless snowplowing takes place. Snowplowing on the Trout Creek Road removed substantial amounts of loose aggregate ontheroadsurfaceandflattenedthecrownsomuchthatpotholefailuresoccurred the following season.
Precipitation during the spring, summer, and early fall was light in 2003 and heavy in 2004. About two-thirds of this precipitation occurred during the hot summer months as isolated thunderstorms dropping 0.3 to 0.5 inches of rain over a 1-hour period.
Construction Monitoring Staff monitored construction equipment time and developed a cost guide,
appendix B1, for the stabilization process. They also used construction costs in each project’s cost analysis. A preliminary cost analysis is in appendix B8.
During construction, several quality assurance methods ensured that thechlorideapplicationratespecifiedwasmetandthatliquidchloridematerialsmettheminimumspecifiedconcentration.Thesemethodsareprovided in appendix C2.

11
Road Blading Maintenance The engineering staff monitored blading maintenance on treated
sectionsonthreeprojectsduringthefirsttwoseasons.Unfortunately,the results of this monitoring were not typical because of equipment breakdowns and unusual weather conditions. Treated-section blading on the other four projects was done under dry summer conditions and was not monitored. More controlled blading and monitoring was done in 2005toillustratethebenefitsofcorrectmaintenancetechniques.Thesemaintenance techniques are in appendix C3.
Road Use Staffcollectedvehicletrafficcountsonall12projects.TheSouthSideRoadhadthelowestseasonalaveragedailytraffic(25),andtheMiddleFork Payette River Road had the highest (157). Four of the 12 roads had peakdailytrafficcountsofover400vehicleswiththegreatestcountbeing 922. The primary operating season is from April to November and isdefinedbyfreezingroadconditionsorsnowfall.CumulativetrafficandaveragedailytrafficareshownonperformancegraphsinappendixA3. The raw data used to generate the graphs is provided in appendix G1.Numeroustrafficcounterequipmentproblemsoccurredin2003and estimates had to be made on some projects during the performance period.Equipmentanddatawereimprovedsignificantlyin2004butestimated values were still necessary during certain time periods on some projects.
Forestroadmanagersprovidedtrafficclassificationandgenerallyfititinto the three categories:
n Light vehicles including light-duty trucks (79 percent).
n Two-axle trucks and light-duty trucks with trailers (16 percent).
n Trucks with more than two axles (5 percent).
Laboratory Testing of Aggregate and Chloride Materials Road-surfacing aggregate on 11 of the 12 projects is good quality, well-
graded crushed aggregate. Gradation tests show from 48 to 72 percent passing the #4 sieve, and 11.1 to 17.2 percent passing the #200 sieve. These gradations perform well in semiarid climates because they capture the chloride ions in a relatively impervious gradation. Impervious gradationspreventrainsfromflushingchlorideionsintheaggregatedown into the subgrade. Less amount of minus #200 would be necessary if the minus-#40 materials were plastic. Aggregates on all projects are

12
Surface-Aggregate Stabilization with Chloride Materials
nonplastic, including the Payette River Road aggregate that was treated with 2.5-percent bentonite clay in 1999. Aggregate quality test results are in appendixes A2 and E1.
Engineers based the percentage of chloride used for stabilization on prior stabilization projects. The 1.5- and 2-percent chloride salt concentrations--by weight of aggregate surfacing--is similar to concentrations obtained by annual dust abatement treatments over a 4- to 6-year period. An indication of the optimum chloride content for a particular aggregate can be determined by running moisture density tests with various percentages of chloride, similar to an asphalt mix design. Experience with this approach is limited, but the optimum chloride content may be where density increases begin to level off and the mixture becomes relatively impermeable. Appendix E2 provides curves on three projects that represent a cross section of all projects and appendixF4showsthemix-designtestmethod.ThemodifiedMarshallhammer method provides higher and more realistic moisture density results for aggregate materials than the proctor method. It is easier to perform and is more repeatable than American Association of State HighwayandTransportationOfficialsorAmericanSocietyforTestingand Materials procedures.
Two samples of each chloride type were laboratory-tested to verify concentration percentage, impurities (sulfates and nitrates), and hazardous waste (arsenic and lead). Test methods are in appendix C2 and the results are in appendix E6.
User Guide for Chloride Stabilization Projects The information provided in the appendixes is valuable for road
managers considering chloride stabilization as an option for improving road surface performance.
Thefirststepinachloridestabilizationprojectistoestimatethelengthof performance that can be expected for the project conditions.
n Compare the proposed project’s characteristics with project characteristics listed in appendix A2.
n Select the project(s) with the closest project characteristics and look at the selected project(s) performance curves in appendix A3 to see if the results are desirable.
n Use performance equations as another option to predict performance. If additional monitoring is approved, these performance equations can be developed (appendix A6). The equations will permit more accurate life prediction because each project variable can be considered.

13
The second step is to perform a cost analysis. n Perform a preliminary construction cost estimate using appendix B1.
n Tabulate the savings in annual blading maintenance, road user cost, and aggregate loss using appendixes B2, B5, and B7.
nAttempttoquantifyintangiblebenefitsforsedimentation,resourcedamage, road user safety, dust health hazard, and public opinion.
n Obtain price quotes for chloride materials from regional chloride manufacturers(appendixB1)andrefinetheconstructioncostestimateif the project is feasible.
nCompletethecostbenefitanalysisusingappendixB8asaguide.
The third step is to prepare the contract package. nVisittheproject,digholestoconfirmdepthsofaggregatesurfacing
and measure road crowns. Take representative samples for testing of gradation, Atterberg limits, and mix design. Using project data, check the original performance estimate and cost analysis.
nReview,andifnecessary,edittheconstructionspecificationinappendix C1.
n Use the PowerPoint® presentation in appendix D2 to explain the process to management if necessary.
Cost and Performance Analysis Treated-section performance for each project is most easily seen by
viewingthegraphsofcumulativetrafficversusconditionindexinappendixesA3andA4.Thesegraphsshowsignificantroadsurfaceperformancebenefitsduring2003and2004.Severaltrendsare:
n Sections untreated show an initial rapid deterioration due to high-speedtraffic.Afterasignificantnumberofdefectsdevelop,vehiclespeed decreases and the deterioration rate decreases.
n Thresholds for blading needed and blading critical are based on reductions in vehicle speed, road manager comments, and visual observations of monitoring personnel. Appendix G4 shows correlations between the condition index and reasonable vehicle speed for each project. A 25-percent reduction in vehicle speed correlates with blading needed and a 40-percent reduction in vehicle speedcorrelateswithbladingcritical.Tovisualizethesignificanceofreductions in the condition index, the information was plotted on the performance curves in appendixes A3 and A4.

14
Surface-Aggregate Stabilization with Chloride Materials
The performance equation in appendix A6 will be completed if additional monitoring is approved. This work cannot be completed until more treated sections need blading. The equation allows road managers to make an estimated prediction on the performance life given their specificprojectconditions.TheprimarybasisforthispredictionmodelistheliferatiosinappendixA5.Liferatioisdefinedastheamountoftrafficontreatedsectionsdividedbytheamountoftrafficonuntreatedsections prior to blading being needed. Essentially, the ratio is a number that represents how much longer the initial performance life of the treated sections is versus the untreated sections prior to maintenance blading. The ratios in table 3 range from a low of 4 to a high of 57.
Table 3—Life ratios for each project
ProjectTrafficVolumePriorto Life Blading Needed Ratio Treated Untreated
Trout Creek 21,000 2,000 11
Tucannon 50,000 10,000 5
Miller Lake 10,200 2,800 4
Williamson 9,000 1,200 8
Wickiup 32,000 3,000 11
Conklin 17,000 3,000 6
Payette 52,500 5,000 11
East Fork 50,000 6,700 7
South Side 12,000 700 17
South Side II 20,000 350 57
Deer Creek 22,000 2,700 8
Snow Creek 11,000 1,000 11
Average 25,558 3,204 8
Staff developed construction costs for the four chloride products mixed by blade and tractor-tiller. They also developed costs for a 5-mile-long project located within 35 miles of Missoula, MT, Boise, ID, and Bend, OR. The format provided in appendix B1 serves as a cost guide. The construction times for each equipment operation came from detailed monitoring during test-project construction. Chloride costs came from regional suppliers shown in appendix B1. Follow directions on the spreadsheet to perform project estimates.

15
Blade maintenance costs in appendix B2 are based on the blading cost per mile and number of bladings needed over the 2003 and 2004 performance period. Cost-per-mile data was available from forest road managers and the actual equipment hours required for various road surface conditions. For consistency in the analysis, the blading cost per mile was based on the cost that correlated with the condition index for blading needed for each project. The number of bladings needed is based on staying above the blading needed line on performance curves provided in appendix A3. As expected, blading frequency is strongly influencedbytrafficvolumes,vehiclespeed,andaggregate-surfacingquality.
The average condition index for normally bladed versus untreated control sections was very similar as shown in appendix G3. This indicatestherearelittlelong-termperformancebenefitsfromcompactionwhile doing routine blading on untreated aggregate surfacing. Results were inconsistent, but an overall average showed a slight increase in condition index and vehicle speeds for the compacted segments over those not compacted. These increases in performance probably do not justify compaction’s added expense. Greater increases in performance can probably be obtained by watering during blading.
Staff used the World Bank Roads Economic Decision Model for determining road-user costs in appendix B5. Variables in this model include road roughness, vehicle speeds and types, terrain, and road surface. Appendix B4 provides average vehicle speed throughout the season for each project for both untreated and treated sections. This analysis was based on only one vehicle, which was described as a “goods vehicle” driven in mountainous terrain on an aggregate surface. This vehicle has a 4,000-pound gross weight, a new cost of $14,000, and is driven 20,000 miles per year. Fuel costs are $1.14 per gallon. Increasing vehicle and fuel costs to current values and selecting a mix of vehicles that included trucks would show an even greater user-cost savings for vehicles traveling over treated road surfaces.
Staff will determine aggregate replacement costs by conducting an identical vertical survey at the initial sites in 2005. Aggregate loss is expectedtobeasignificantcostfactorforuntreatedroadsegments.Initial survey measurements for aggregate loss are shown in appendix B6. An estimated loss, based on loss of dust from the aggregate, is in appendix B7. This estimate is based on the 1973 Iowa Highway Research Board Project HR-151 test results and assumes that aggregate loss is proportional to dust loss.
16
Surface-Aggregate Stabilization with Chloride Materials
Thecostbenefitsummaryandanalysis,appendixB8,comparesallcostsfor untreated and treated sections on the 12 projects. This analysis cannot befinisheduntilmoretreatedsectionsneedbladingandtheaggregateloss survey is completed. Preliminary results indicate that the treatment cost is recovered during the second season for some projects. The graph infigure4(fromfiguresfolder)comparesthelifecyclecostbenefitsofboth untreated and treated sections of all projects. This graph is based on 2 years of actual performance and long-term projections that depend on annual maintenance practices on treated sections that have been used successfullybyothers.Figures5and6(fromfiguresfolder)showthecumulative cost by year for both treated and untreated sections on 2 of the 12 projects.
Intangible Benefits Therearefiveintangiblebenefitsthatmay,inmanycases,bemoreimportant than actual costs.
Sediment Reduction Research by Randy Foltz, USDA Forest Service, Rocky Mountain
Research Station, Forestry Sciences Laboratory, Moscow, ID, and others has shown that if road blading is reduced, sediment that reaches streams is reduced. This project shows that blading is reduced when road surfaces are stabilized. When sediment is reduced, costs are reduced or eliminated for design, construction, and maintenance of sediment control structures.
Resource Damage from Aggregate Sources Road surface stabilization clearly reduces the need for aggregate
replacement. Less aggregate usage would conserve aggregate resources that are scarce in many areas and save funds currently spent for locating new sources, preparing pit development plans, securing necessary permits, and developing and restoring the site.
Road User Safety Chloride materials are an effective dust abatement product, as well as a
stabilization agent. Less dust reduces vehicle accidents, which reduce costs associated with vehicle repair and medical expenses. Less dust also decreases loss of life.
Dust Inhalation of Airborne Particulate Public health costs are less when a known health hazard, such as dust,
isreduced.Theextentofthebenefitisbasedontheamountofvehiculartrafficonaroad,thenumberofvehicleoccupants,andthenumberof individuals exposed for longer periods in roadside residences and campgrounds.
17
Public Opinion Poorly maintained public roads generate negative public opinion. Public
complaints require valuable employee resources that adversely affect the Government workforce’s overall productivity.
Conclusions Thefollowingconclusionsarefromfieldobservationsanddatacollectedduring construction and monitoring of this project throughout the 2003 and 2004 seasons.
Treated Sections versus Untreated Sections nEconomicbenefitsofstabilizationaregreatestonprojectswellsuited
forstabilization,thathavehightrafficvolumes,andthathavehighcosts for aggregate replacement.
n The average initial performance period for the treated sections lasted eight times longer than the untreated sections: sections treated required blading after 25,500 vehicles, and untreated sections required blading after 3,200 vehicles.
n Average speed on treated sections was 37 miles per hour and the average speed on untreated sections was 26 miles per hour for the 2-year period.
n Four of the 39 treated sections needed blading for part of the 2003 season.
n Blading became critical on several untreated sections during the same 2003 season.
n Forty untreated sections needed blading 95 percent of the time during the 2003 season.
n Rate of deterioration decreases as more defects develop in the road surfaceandtrafficspeeddecreases.
n Visual observations indicate treated sections reduced the dust by approximately 90 percent, thus reducing inhalation health hazard.
n Condition of all test sections improved after periods of wet weather and over the winter season. Treated sections improved more than untreated sections.
18
Surface-Aggregate Stabilization with Chloride Materials
Treated Sections nDuringthefirst2yearsofmonitoring,13of39treatedsectionsneeded blading. Six of these sections had construction problems or the crown was removed by snowplowing. The predominant failure mode in the other seven sections was potholing, washboarding, and rutting. All the pothole problems existed where the crown was less than 2 percent due to snowplowing or at the centerline where the crown was flattenedbytraffic.
n No distinct difference in performance existed between the four different products: magnesium chloride liquid, calcium chloride liquid, and calcium chloride solid at 77- and 94-percent salt concentration.
nAfterthe2004season,nosignificantdifferenceinperformancewasnoticed on 2-percent chloride content versus 1.5 percent. A greater difference in performance may be evident in year 2005.
n Chloride stabilization does not improve resistance to surface erosion or pothole formation. Road crown is the primary deterrent to the formation of potholes and surface erosion.
n Poor performance was noted on all treated test sections that potholed duetoeitheraloworflattenedcrown.Waterinpotholesmayleachchloride from the treated surface.
n Aggregate materials on 11 of 12 projects performed well when stabilized. Miller Creek Road was the exception because there was 14-percent 3/4- by 1-1/2-inch material that caused raveling. All other projects were essentially 3/4-inch minus and dense graded with a minus #200 range of 11.2 to 17.1 percent and no plasticity. Dense-graded aggregates with this amount of minus #200 work well because chloride ions are held within a relatively impervious medium. Minus #200 contents between 8 and 12 percent may also work well if minus #40 fraction was plastic.
n No correlation existed between project performance and gradations plotted on the 0.45 power curve. Curves for each projects’ aggregate gradation are provided in appendix E1.
n In dryer climates, treated road surfaces may dust in early spring before spring rains. These surfaces regain their treated appearance (wet look), and harden-up when rains come or when the surface is watered.
19
nAllprojectandconstructioncharacteristicsinfluencetheperformanceofchloride-treatedaggregatesurfaces.Themostsignificantappeartobeaggregatecharacteristics,climate,trafficvolume,andmoisturecontent when maintenance blading. If additional monitoring is approved,therelativesignificancewillbereflectedinappendixA6(performance equation) after the 2005 season.
n The average daily minimum humidity appears to correlate with performance of the chloride-treated sections. The East Fork project was very successful and had an average daily minimum humidity of 26 percent. The three projects in central Oregon that had minimum average daily humidity below 23 percent had marginal performance but also had porous gradations. Periodic summer rains improve performance on impervious surfacing but decrease performance on porous surfacing materials. Other relative humidity and temperature statistics do not appear to be good performance predictors. Projects located next to streams or that had thick roadside vegetation to provide shade, performed better than those in more arid climates.
n Blading-treated sections when moisture is below optimum decreases stabilization effectiveness. Allowing the bladed surface to remain loose and dust will reduce long-term performance. The wet-blading—asexplainedinappendixC3,willpullenoughchlorideandfinestothe road surface to create a dried crust that will last as long as the original treatment.
Construction nThereisnosignificantdifferenceintheperformanceofuntreatednormally bladed sections and untreated compacted control sections. This indicates the following:
n Compactionhasnolong-termbenefitsinmaintenanceblading.
n Normal blading practices used during test-section construction removed all road surface defects was as effective as milling or blade-mixing 2 inches deep. However, this blading costs $284 per mile and probably removed many more defects and built better crowns than the typical maintenance blading. On 8 of the 12 roads the average maintenance blading contract costs $157 per mile. During the second season most contract-bladed untreated sections developed defects more rapidly than blading done during test-section construction.
20
Surface-Aggregate Stabilization with Chloride Materials
n Superior performance of treated sections over untreated control sections indicates that the good performance is due to stabilization agents and not the stabilization construction process.
n Aggregate roads should be stabilized with chloride in early spring when road surface moisture content and humidity are high and late springrainswillkeepthesurfacewetwhiletrafficflushesfinestothesurface.Thefinesformahardcrustwhendry.
n Blade-mixing consistency is very dependent on operator capability and machine condition.
n Blade-mixed sections deteriorated more rapidly than tractor-tiller mixed sections, due to treatment depth inconsistencies and nonuniform mixing. A minimum depth of 2.5 inches is recommended for blade mixing.
n Blade mixing a 2.5-inch depth of aggregate surfacing is not practical where road widths are less than 18 feet, because the loose berm covers too much of the road width.
n Blade mixing liquid chlorides is not practical on roads with grades over 2 percent because the product will run in distributor wheel tracks to sag vertical curves or off the road surface.
n Blade-mixing operations require more quality assurance and technical expertise to ensure the correct amount of aggregate is mixed with chloride and that the treated thickness is uniformly mixed to the specifieddepth.
nTrafficdelaysandconstructioninterruptionswithblademixingaremoresignificantthanwithtractor-tillermixingforallchlorideproducts.
Recommendations Road managers should consider chloride stabilization as a cost-effective method when selecting maintenance options and strategies for aggregate-surface roads. This publication discusses the performance characteristics andeconomicbenefitsthatcanbeexpectedwhenchlorideisusedasastabilizing agent. The average performance life of the treated sections were eight times greater than the untreated sections. Over the projected 10-year life of the treated sections, a savings of $3,300 per mile can be realized in maintenance costs when compared to not stabilizing the roadsurface.Additionalnonmonetarybenefitsofchloridestabilizationinclude reduced stream sedimentation, reduced inhalation health hazards, and increased road-user safety.
The following are additional recommendations when using chloride products as a stabilizer on aggregate surfaced roads.

21
Design n Only allow blade mixing on roads wider than 18 feet. Delete blade mixing option in Section 311.06 (appendix C1) for projects with road widths less than 18 feet.
n Use minimum treatment depths of 2 inches for tractor-tiller mixing and 2.5 inches for blade mixing.
n When stabilizing with chloride materials, use the following road-surface crown-construction requirements to avoid pothole problems:
n 4-percent minimum crown for roads with grades over 2 percent.
n 5- to 6-percent crown for roads with grades under 2 percent.
n Follow the recommended aggregate characteristics shown in table 4. Performance of aggregate with preferred characteristics will exceed the acceptable characteristics, which are typical of most sections treated on the 12 projects.
Table 4—Recommended aggregate characteristics
Characteristic Preferred Acceptable
Maximum Size 3/4 inch 1 inch
Percent Pass #4 55 to 65 50 to 70
Percent Pass #200 (Nonplastic) 14 to 17 12 to 17
Percent Pass #200 (Plastic) 12 to 15 8 to 15
Plasticity Index 2 to 9 Nonplastic
Los Angeles Abrasion Less than 30 Less than 40
Percent Fracture, one face Greater than Greater than 85 percent 75 percent
Construction Tractor-tiller mixing: n Add additional water to the road surface prior to spreading dry
chloride to get close to optimum moisture. Mix both into the aggregate surfacing at the same time.
n Mix liquid products into the road surface immediately after application to prevent liquid from running off road surface.
n Evaluate the loose mixing depth continuously, using a 1.25 swell factortimesthespecifiedcompactedthickness.
n Follow quality and quantity assurance methods contained in appendix C2.
22
Surface-Aggregate Stabilization with Chloride Materials
Blade mixing: n Do not use blade mixing on roads less than 18-feet wide.
n Blade cutting edge height should not vary more than 1/2 inch to ensure that mixing is consistent and that crowns are properly built.
n Do not use motorgraders with carbide mold boards for mixing.
n Measure and size windrows to obtain the desired chloride percentage.
n Continuously monitor mixed material for uniformity and consistency.
n Follow quality and quantity assurance methods contained in appendix C2.
Liquid chloride: n Be more cautious with magnesium chloride than calcium chloride
liquid because magnesium chloride contains more water due to a lower salt concentration.
n Do not blade-mix liquid products on roads with grades over 2 percent.
n Use tractor-tiller mixed liquid products right behind the distributor on grades over 2 percent.
n Use caution when adding water during blading. Too much water prior to adding liquid products will cause the mixed aggregate to be over optimum moisture. Liquid products should not be used when rain is imminent.
nDelaythefinalapplicationofmagnesiumchlorideliquidonthecompacted road surface at least 1 week after construction to avoid product runoff into ditches.
nSpraythefinalsurfaceapplicationintwopassestohelpcontrolrunoff.
n Follow quality and quantity assurance methods contained in appendix C2.
Maintenance n Maintain stabilized roads each spring with light blading to recreate the 4- to 6-percent crown.
n Blade according to procedures in appendix C3, Maintenance Methods.
n After 4 to 6 years, consider the need for a chloride dust abatement application to ensure a 10-year life.

23
Additional Studies Duringthefirst2yearsofthisstudy,engineersrecognizedmanyunforeseen critical areas of work but were beyond the scope, time, and resources available. With additional funding and monitoring, the following areas could be developed:
n Determine the initial performance life of all the treated sections sincefiveoftheprojectsdidnotneedbladinginthefirst2yearsofmonitoring.
n Develop performance life-prediction equation (appendix A5) based on all 12 projects, not just the 7 projects where the treated sections needed blading.
n Evaluate performance of the four chloride types used on the project.
n Evaluate performance of the 2-percent chloride content versus the 1.5-percent content.
n Monitor performance of recommended blading practices (wet blading versus dry blading).
n Finish long-term performance and cost analysis.
n Evaluate long-term performance of treated sections that are bladed wet annually in the spring.
Acknowledgements We would like to express appreciation to the eight USDA Forest Service road managers and their assistants for logistical and technical support.SpecialthankstoPeterBolander,USDAForestServicePacificNorthwest Region materials engineer, and William Vischer, Northern Region materials engineer, for their technical contributions throughout thestudyandespeciallyfortheirreviewofthefinalreport.
For additional information on this chloride stabilization project, contact San Dimas Technology & Development Center (SDTDC) by phone at 909–599–1267.
This publication is the result of a partnership between the USDA Forest Service technology and development program and the U.S. Department of Transportation Federal Highway Administration (FHWA) Coordinated Federal Lands Highway Technology Improvement Program.
SDTDC’s national publications are available on the Internet at http://www.fs.fed.us/eng/pubs/.
USDA Forest Service and U.S. Department of the Interior Bureau of Land Management employees also can view SDTDC’s videos, CDs, and individual project pages on their internal computer network at
http://fsweb.sdtdc.wo.fs.fed.us/.

Stephen Monlux is currently an engineering consultant in materials and pavement engineering, contract administration and technology transfer for several federal agencies, state LTAP centers and numerous counties in the Northwest. Previously, he spent 26 years as the Northern Region Materials Engineer for the Forest Service in Missoula Montana. Stephen Monlux is registered as a professional engineer in the State of Washington.
Michael R Mitchell iscurrentlyanengineeringconsultantinthefieldof geotechnical engineering. Previously, he spent 4 years as a Senior Project Leader at San Dimas Technology and Development Center and 28 years as a Geotechnical/Materials Engineer in the Northern Region for the Forest Service. Michael R Mitchell is registered as a professional engineer in the State of Montana.
About the Authors....