u.s. department of education 2010 - blue ribbon schools ... · u.s. department of education 2010 -...
TRANSCRIPT
NY-01 ny01-clinton-street-elemenary.doc 1
U.S. Department of Education
2010 - Blue Ribbon Schools Program
Type of School: (Check all that apply) [] Charter [X] Title I [] Magnet [] Choice
Name of Principal: Ms. Christie Angrisano
Official School Name: Clinton Street Elementary School
School Mailing Address:
4100 Clinton Street
West Seneca, NY 14224-1604
County: Erie State School Code Number*: 142801060015
Telephone: (716) 677-3620 Fax: (716) 674-7821
Web site/URL: www.wscschools.org E-mail: [email protected]
I have reviewed the information in this application, including the eligibility requirements on page 2 (Part I -
Eligibility Certification), and certify that to the best of my knowledge all information is accurate.
Date (Principal‘s Signature)
Name of Superintendent*: Mrs. Jean Kovach
District Name: West Seneca CSD Tel: (716) 677-3100
I have reviewed the information in this application, including the eligibility requirements on page 2 (Part I -
Eligibility Certification), and certify that to the best of my knowledge it is accurate.
Date (Superintendent‘s Signature)
Name of School Board President/Chairperson: Mrs. Carol Jarczyk
I have reviewed the information in this application, including the eligibility requirements on page 2 (Part I -
Eligibility Certification), and certify that to the best of my knowledge it is accurate.
Date (School Board President‘s/Chairperson‘s Signature)
*Private Schools: If the information requested is not applicable, write N/A in the space.
The original signed cover sheet only should be converted to a PDF file and emailed to Aba Kumi, Blue Ribbon Schools Project
Manager ([email protected]) or mailed by expedited mail or a courier mail service (such as Express Mail, FedEx or UPS) to Aba
Kumi, Director, Blue Ribbon Schools Program, Office of Communications and Outreach, U.S. Department of Education, 400
Maryland Ave., SW, Room 5E103, Washington, DC 20202-8173

NY-01 ny01-clinton-street-elemenary.doc 2
PART I - ELIGIBILITY CERTIFICATION
The signatures on the first page of this application certify that each of the statements below concerning the
school‘s eligibility and compliance with U.S. Department of Education, Office for Civil Rights (OCR)
requirements is true and correct.
1. The school has some configuration that includes one or more of grades K-12. (Schools on the same
campus with one principal, even K-12 schools, must apply as an entire school.)
2. The school has made adequate yearly progress each year for the past two years and has not been
identified by the state as “persistently dangerous” within the last two years.
3. To meet final eligibility, the school must meet the state’s Adequate Yearly Progress (AYP) requirement
in the 2009-2010 school year. AYP must be certified by the state and all appeals resolved at least two weeks
before the awards ceremony for the school to receive the award.
4. If the school includes grades 7 or higher, the school must have foreign language as a part of its
curriculum and a significant number of students in grades 7 and higher must take the course.
5. The school has been in existence for five full years, that is, from at least September 2003.
6. The nominated school has not received the Blue Ribbon Schools award in the past five years, 2005,
2006, 2007, 2008 or 2009.
7. The nominated school or district is not refusing OCR access to information necessary to investigate a
civil rights complaint or to conduct a district-wide compliance review.
8. OCR has not issued a violation letter of findings to the school district concluding that the nominated
school or the district as a whole has violated one or more of the civil rights statutes. A violation letter of
findings will not be considered outstanding if OCR has accepted a corrective action plan from the district to
remedy the violation.
9. The U.S. Department of Justice does not have a pending suit alleging that the nominated school or the
school district as a whole has violated one or more of the civil rights statutes or the Constitution‘s equal
protection clause.
10. There are no findings of violations of the Individuals with Disabilities Education Act in a U.S.
Department of Education monitoring report that apply to the school or school district in question; or if there
are such findings, the state or district has corrected, or agreed to correct, the findings.

NY-01 ny01-clinton-street-elemenary.doc 3
PART II - DEMOGRAPHIC DATA
All data are the most recent year available.
DISTRICT (Questions 1-2 not applicable to private schools)
1. Number of schools in the district: (per
district designation) 7 Elementary schools (includes K-8)
2 Middle/Junior high schools
2 High schools
K-12 schools
11 TOTAL
2. District Per Pupil Expenditure: 14330
SCHOOL (To be completed by all schools)
3. Category that best describes the area where the school is located:
[ ] Urban or large central city
[ ] Suburban school with characteristics typical of an urban area
[ X ] Suburban
[ ] Small city or town in a rural area
[ ] Rural
4. 10 Number of years the principal has been in her/his position at this school.
5. Number of students as of October 1 enrolled at each grade level or its equivalent in applying school only:
Grade # of Males # of Females Grade Total Grade # of Males # of Females Grade Total
PreK 20 19 39 6 43 33 76
K 34 31 65 7
0
1 32 36 68 8
0
2 30 39 69 9
0
3 36 39 75 10
0
4 52 38 90 11
0
5 41 36 77 12
0
TOTAL STUDENTS IN THE APPLYING SCHOOL 559

NY-01 ny01-clinton-street-elemenary.doc 4
6. Racial/ethnic composition of the school: 1 % American Indian or Alaska Native
1 % Asian
1 % Black or African American
1 % Hispanic or Latino
0 % Native Hawaiian or Other Pacific Islander
94 % White
2 % Two or more races
100 % Total
Only the seven standard categories should be used in reporting the racial/ethnic composition of your school.
The final Guidance on Maintaining, Collecting, and Reporting Racial and Ethnic data to the U.S. Department
of Education published in the October 19, 2007 Federal Register provides definitions for each of the seven
categories.
7. Student turnover, or mobility rate, during the past year: 2 %
This rate is calculated using the grid below. The answer to (6) is the mobility rate.
(1) Number of students who transferred to
the school after October 1 until the
end of the year.
7
(2) Number of students who transferred
from the school after October 1 until the
end of the year.
5
(3) Total of all transferred students [sum of
rows (1) and (2)]. 12
(4) Total number of students in the school
as of October 1. 549
(5) Total transferred students in row (3)
divided by total students in row (4). 0.022
(6) Amount in row (5) multiplied by 100. 2.186
8. Limited English proficient students in the school: 0 %
Total number limited English proficient 0
Number of languages represented: 0
Specify languages:
Our district serves all elementary LEP students in one building. Therefore, prospective Clinton Street
Elementary students who meet the LEP criteria do not attend our school.

NY-01 ny01-clinton-street-elemenary.doc 5
9. Students eligible for free/reduced-priced meals: 28 %
Total number students who qualify: 155
If this method does not produce an accurate estimate of the percentage of students from low-income families,
or the school does not participate in the free and reduced-price school meals program, specify a more accurate
estimate, tell why the school chose it, and explain how it arrived at this estimate.
10. Students receiving special education services: 6 %
Total Number of Students Served: 34
Indicate below the number of students with disabilities according to conditions designated in the Individuals
with Disabilities Education Act. Do not add additional categories.
1 Autism 0 Orthopedic Impairment
0 Deafness 2 Other Health Impaired
0 Deaf-Blindness 7 Specific Learning Disability
0 Emotional Disturbance 2 Speech or Language Impairment
0 Hearing Impairment 0 Traumatic Brain Injury
0 Mental Retardation 0 Visual Impairment Including Blindness
22 Multiple Disabilities 0 Developmentally Delayed
11. Indicate number of full-time and part-time staff members in each of the categories below:
Number of Staff
Full-Time
Part-Time
Administrator(s) 1
0
Classroom teachers 28
0
Special resource teachers/specialists 6
5
Paraprofessionals 7
0
Support staff 4
6
Total number 46
11
12. Average school student-classroom teacher ratio, that is, the number of students in the school divided by
the Full Time Equivalent of classroom teachers, e.g., 22:1 25 :1

NY-01 ny01-clinton-street-elemenary.doc 6
13. Show the attendance patterns of teachers and students as a percentage. Only middle and high schools
need to supply dropout rates. Briefly explain in the Notes section any attendance rates under 95%, teacher
turnover rates over 12%, or student dropout rates over 5%.
2008-2009 2007-2008 2006-2007 2005-2006 2004-2005
Daily student attendance 97% 96% 97% 96% 96%
Daily teacher attendance 96% 96% 95% 98% 97%
Teacher turnover rate 6% 4% 11% 12% 24%
Student dropout rate 0% 0% 0% 0% 0%
Please provide all explanations below.
The 04-05 teacher turn-over rate of 24% reflects several retirements.
14. For schools ending in grade 12 (high schools).
Show what the students who graduated in Spring 2009 are doing as of the Fall 2009.
Graduating class size 0 Enrolled in a 4-year college or university 0 %
Enrolled in a community college 0 %
Enrolled in vocational training 0 %
Found employment 0 %
Military service 0 %
Other (travel, staying home, etc.) 0 %
Unknown 0 %
Total %

NY-01 ny01-clinton-street-elemenary.doc 7
PART III - SUMMARY
Students have been happily attending and learning at Clinton Street Elementary School since it opened in
1967. Our school is located in West Seneca, NY, a first ring suburb of the city of Buffalo. We are an
economically diverse community and our school is currently assigned Title I status. Clinton is a microcosm of
the surrounding area, and by having experiences with those from backgrounds and circumstances different
than their own, our students are learning valuable lessons in respect, acceptance, empathy, and tolerance. Our
slogan is “Clinton Cares” and the entire school community has a tradition of rallying around character
education and service projects, such as the Relay for Life, and making blankets for Project Linus.
The following vision, mission, and belief statements were developed by staff and parents on our Shared
Decision Making Team. These represent our overarching philosophy and goals.
VISION: Success for all students.
MISSION: To promote good character; to encourage excellence in academics, literacy and the arts; and
to develop life-long learners in partnership with parents and the community.
BELIEFS:All children deserve a quality education and a healthy, safe environment in which to learn.
Having compared our statements to those of other schools, we realize that they could be considered
“variations on a theme.” However, though typical on the surface, we believe that they derive power when
coupled with actions that we, at Clinton, take to make them our reality. Using the model developed by
Richard DuFour, Robert Eaker, et al., we have grown from a collegial group of educators to a true
Professional Learning Community (PLC) with high expectations for ourselves. We continually ask the critical
questions that guide the work of PLC’s: “What do we want students to learn? How will we know if they have
learned ? What do we do when they don’t learn? What do we do when they already know it?” We use data
and information to help us answer those questions, and collaborate to find the best and most effective
practices to ensure that all students succeed. We focus on each child’s strengths and use interests as a vehicle
to promote engagement. We truly do “whatever it takes” so that every child learns at high levels, whether
intervention, extension, or enrichment is required. We consider every domain of children’s development in
seeking avenues to accomplish this. Parents are involved, providing insights or working alongside us. Our
staff reads, researches, and shares, in order to create new pathways to achieve learning goals if the more
traditional approaches are not leading to the desired outcomes.
Although continually striving to improve, we celebrate our accomplishments. We are proud of our state
assessment results, which are important indicators of high academic achievement. We are proud of the variety
and quality of instruction that facilitates learning in all areas of the curriculum. We are proud of our leadership
in implementing inclusion. We are proud that visitors to our school comment on the respectful behavior of our
students. We are proud of the accomplishments of individual students, whether cited for acts of kindness,
sportsmanship, or academic achievement. We are especially proud of those students who have struggled, but
persevered; who excitedly move up several levels in reading; publish their first legible, well-planned writing
piece; make a speech at a DARE graduation after years of working on articulation; bring behaviors that
disrupt their learning under control; or move from a wheelchair to a walker.
This sense of pride in our school goes hand in hand with deep appreciation for the support of the larger
community. We are fortunate to have a Board of Education, superintendent of schools, and other district
administrators, who are dedicated to student achievement and support building-level programs. Our town
officials and local businesses and organizations support our endeavors. Clinton parents are highly invested in
their children’s education. Clerical and maintenance staff ensure a smoothly run school that sets the stage for
learning. Clinton faculty and staff are unsurpassed in their commitment. In a take-off on a well known
advertisement, the principal is fond of saying “At Clinton, you’ve got the network.” The espirit du corp in
our school is tangible and the resulting impact on the lives of children, now and in the future, is what makes
us worthy of Blue Ribbon status.

NY-01 ny01-clinton-street-elemenary.doc 8
PART IV - INDICATORS OF ACADEMIC SUCCESS
1. Assessment Results:
New York State, like all others in the nation, increased its assessment and accountability measures to meet the
mandates of the NCLB Act. Although assessments of student progress toward the state standards in ELA and
math had been administered for several years in grade 4, beginning with the 2005-06 school year, the
assessment program was extended to include annual measures in grades 3-6. Student proficiency levels have
been defined, as follows: Level 1- Not meeting the standards; Level 2 – Partially meeting the standards; Level
3 – Meeting the learning standards; Level 4 – Meeting the learning standards with distinction. Standard score
“cut points” are established each year, which determine at which level a student has performed.
Our school has seen increases in student achievement, which can be viewed through different
lenses. Examining trend data within grade levels, we have seen some dramatic increases in the combined
numbers of students achieving proficiency and mastery levels in math, as follows: grade 3 - an overall
increase of 10% over four years; grade 4 – a 22% increase over five years; grade 5 - a 15% increase over four
years; grade 6 – an astounding 37% increase over four years. Looking at cohort data, we can also examine
trends to determine if a group of students is continuing to achieve state standards at a consistent, increasing, or
decreasing rate. For example, 89% of our third graders to take the first math assessment in 2006 were
proficient. If we follow that cohort, we see that in grade 4 the next year, 95% were proficient; in fifth grade-
97%, and in grade 6 the group achieved 100% proficiency. It should be noted that because of their
achievement last year, in a comparative ranking of all schools in our Western New York region, Clinton Street
Elementary was listed as #1. Of the 100% of the students who were proficient, 67% achieved mastery. The
mastery rate was the highest among all schools in the area.
While, overall our math scores indicate high levels of learning, we continue to use data to improve
achievement of individual students. The only identified sub-group at our school is socio-economic
disadvantaged. It should be noted that we do not flag individual students as “disadvantaged”, so all receive
needs-based instruction. Proficiency and mastery rates among students in the sub- group show an upward
trend across grade levels. For example, from 2006-2009, there was an increase of 20% in proficiency and 6%
in mastery for students in grade 3; a 21% increase in proficiency and 29% in mastery at grade 5; and a 60%
increase in proficiency and 28% in mastery in grade 6. In the same time period, the achievement in Grade 4 in
that sub-group improved from 91% to 100% proficiency and while mastery rates went up and down between
20% and 35%, it is significant that proficiency rates in math for all students have ranged from 90 to 100%.
Similar upward trends in student achievement have been realized in ELA. Our student proficiency rates
between 2006 and 2009 have risen as follows: Grade 3 – 72-92%, an increase of 20%; Grade 5 – 84-99%, an
increase of 15%; Grade 6- 74-98%, an increase of 23%. Mastery rates at those grade levels show a similar
trend. Students who fall within the sub-group have also made gains. Rates of proficiency have increased from
55-86% in grade 3; 55-100% in grade 5; and 60-100% in grade 6. Mastery rates follow the same pattern. The
performance among students in grade 4 has been less consistent, increasing and decreasing from 80% to 88%
for all students; and from 70-92% for students in the sub-group. Some students, especially those with learning
difficulties and specific disabilities have found it difficult to make the transition to more complex reading and
writing tasks in the fourth grade curriculum. They also seem to struggle more with the lengthy fourth grade
assessment. However, we continue to use the NYS test results and other assessment measures to analyze our
instructional practices in the context of student learning needs. We are committed to improving student
performance at the fourth grade level. Our school continues to meet annual yearly progress (AYP) goals in
ELA , as well as math, at all levels.
Information on the New York State assessment system may found at http://www.emsc.nysed.gov/osa/
NY-01 ny01-clinton-street-elemenary.doc 9
2. Using Assessment Results:
Assessment data is a critical component of information used at Clinton Street Elementary as we develop
curriculum, plan instruction, and respond to students’ needs.
At the most global level, we analyze and use group results and trend data from state assessments and other
relevant measures to pinpoint curriculum priorities at our school. Working from the broad New York State
Standards and the more specific, yet comprehensive Core Curriculum, our teachers juxtapose assessment
results with core content requirements to determine Essential Common Outcomes in each content area. This
allows us to avoid teaching what the majority of students already know and are able to do, and focus our
instruction on content knowledge and associated skills they still need to develop. State assessments yield what
we consider primarily summative data, but in this context we have found that a formative application of the
same data modifies what we teach each year, based upon the needs of the group.
From this “mega-look” at assessment data, we move toward a more individualized view. Our teachers
routinely conduct formative assessments in all areas, which provide insights into each student’s
learning. Some assessments, such as DIBELS and DRA, are given district-wide and allow us to monitor
literacy learning. At Clinton, teachers in each grade level or department also create common formative
assessments for units of instruction in order to monitor development of content knowledge and
skills. Examples include running records, common writing pieces, or rubrics used to evaluate performance in
physical education. Teachers informally and continuously assess student learning through individual
conferences, making observations during independent work sessions, or noting answers during simultaneous
responses. All of these assessment measures provide individual foci for instruction, which we use to develop
plans for every learner at our school, whether for purposes of enrichment, extension, or intervention.
We have adopted an RTI model at our school. Using assessment data is critical in determining the
effectiveness of instruction and where we need to make adjustments for all students through Tier 1. For
students receiving Tier 2 and Tier 3 intervention, it helps us to closely track progress, monitor the
effectiveness of our interventions, and adjust instruction as needed, in order to accelerate learning and close
gaps.
3. Communicating Assessment Results:
Our teachers regularly confer with every student on assessment data as part of the teaching-learning
cycle. This helps students to monitor individual progress toward established outcomes and to continually
adjust incremental learning targets. We have found this process especially helpful in motivating students for
whom we are trying to close achievement gaps. The primary emphasis is on reading and math, but this
approach is utilized in all areas, including the arts and physical education. Parents receive individual
children’s assessment data, which is reviewed and thoroughly explained during parent-teacher
conferences. This face-to-face information sharing is done minimally once per year for those whose children
are achieving at or above expected performance levels; more frequently for those whose children are
struggling. Quarterly report cards are sent home. These are developmental and standards-based in grades K-2
and have a more traditional “grade” based format in grades 3-6. Reports on individual students’ state
assessment results in ELA and math for grades 3-6, social studies for grade 5, and science for grade 4, are sent
to parents annually. Letters of explanation accompany those reports. As principal, I conduct a session on
school-wide assessment results and how they are used each year at meetings of our Shared Decision-Making
Team (SDMT) and Parent-Teacher Organization (PTO). I also report that data in the final edition of our
school’s newspaper each year. Through district presentations and publications, assessment data is provided to
all stakeholders in the local community. The greater Buffalo area newspaper and a weekly business journal,
Business First, provide assessment data and comparative rankings of area schools to the community at large.
NY-01 ny01-clinton-street-elemenary.doc 10
4. Sharing Success:
We, at Clinton Street Elementary, are committed to success for all children and believe that working
collaboratively makes that a reality. We furthermore believe that it is a professional obligation to share and
learn from one another. Toward that end, we have "opened our doors." Teams of teachers from other schools
and districts have visited our school to observe the implementation of our literacy framework and approach to
intervention. We have broadcast information on our school’s approaches on our local cable channel. Our
teachers have served as instructors around effective practices in areas such as literacy and technology
integration. Faculty members sit on several district leadership committees (e.g. Curriculum Leadership
Cabinet, District Literacy Team) and are represented on regional councils or boards. Through the
aforementioned affiliations, we have established multiple forums from which we are able to share our
successes and influence the direction of education in our area. If awarded Blue Ribbon status, we would
willingly expand our connections to other schools. One of our long-range plans has been to form a consortium
of schools that use a similar instructional approach. This would function as a larger professional learning
community. Through a relationship with a local college, we plan to conduct more action research that
identifies and solidifies classroom practices that meet the criteria of “evidence-based.” We would take
advantage of the credibility afforded by a Blue Ribbon designation in order to “get the word out” through
hosting forums, publishing articles, and making presentations in the community. Of course, if we receive it,
we would proudly fly the Blue Ribbon flag, include the designation on our letterhead and publications, and
add it to the school name posted on our building. We would hold a big celebration and invite members of the
school, district, and local community. The media would be invited to provide the publicity this great honor
would warrant.

NY-01 ny01-clinton-street-elemenary.doc 11
PART V - CURRICULUM AND INSTRUCTION
1. Curriculum:
Our curriculum and instructional program have been developed so that students achieve New York State’s
learning standards in all core areas. Performance Indicators describe what students should know and be able
to do as a result of quality instruction. The Core Curriculum further specifies grade-specific competencies.
Our district has created an essential curriculum from these documents. Through the lens of student
achievement data, we develop and update our school’s curriculum. By adjusting the standards-based
curriculum to emphasize data-driven priorities, we ensure that our curriculum is responsive and consistently
rigorous in all core areas. The following summaries highlight key elements.
English Language Arts: This is the cornerstone of our instructional program. Students learn that its
fundamental purpose is communication. Students move through developmental progressions of skills and
knowledge. From the smallest units, such as sounds, letters, word parts, and mechanics; to broader concepts
like style, purpose, themes, connections, and inferential thinking, our goal is to ensure that all students are
proficient in ELA. We establish benchmarks and hold ourselves accountable for meeting them. Expected
reading levels are delineated. Writing progresses from “free writes” with inventive spelling, to multiple genres
that follow all conventions. Demonstrations of social norms are expected when speaking and
listening. Students use ELA skills across the curriculum and for personal enjoyment. Student book clubs; a
student newspaper; a student version of Shakespeare in the Park, and PTO family book fairs, are examples of
activities that enhance ELA learning.
Math, Science, and Technology: These three core areas are readily combined because of their real-world
connections and applications. The common thread is that learning takes place largely through authentic
experiences that reinforce what is taught. Technology is infused throughout the curriculum and includes
developing procedural skills, as well as knowledge of safe and appropriate usage. Math involves students in
learning and applying increasingly complex knowledge and skills to solve real-world problems. Through
Inter-connected units in life, earth, and physical sciences, students learn the scientific method and develop
creative and critical thinking skills. A math competition, science fair, rocket launches, internet research, and
Earth Spirit Day, are activities that enhance our curriculum.
Social Studies: The curriculum centers on “big ideas,” e.g. history shapes the present; geography shapes
cultures; governments form to maintain societies; and economic systems are needed to deal with scarcity.
Students progressively learn these ideas through the study of local, state, national, and world communities –
past, and present. Activities that reinforce learning include Junior Achievement programs on economics, a
student Living Wax Museum depicting historical figures, a mini Civil War reenactment, Medieval Faire, and
related field trips.
The Arts – Our school strongly supports student involvement and learning in visual and performing arts. We
recognize their inherent value for all, as well as their importance for students with special talents. Our
curriculum engages students in creating and performing; using media, materials, resources, and instruments;
analyzing and critiquing works; and connecting visual and performing arts with various ideas or
cultures. Students throughout the grade levels develop high levels of knowledge and technical skill, while
deriving personal enjoyment and satisfaction that can be used throughout life. Opportunities abound for our
students in the arts, through exhibits, performances, competitions, and clubs. The arts are integrated with other
core areas, such as ELA and social studies.
Physical Education and Health - The primary focus is on the development of knowledge and skills that
promote lifelong wellness. In all grade levels, students learn the proper form and procedures necessary to
safely participate in sports, games and activities that encourage and maintain fitness. Health education

NY-01 ny01-clinton-street-elemenary.doc 12
is provided so that students understand the role of nutrition, safe and appropriate choices, and medical care.
To provide avenues for further learning and application, we have an extensive intramurals program; before-
school physical activities, such as a “Runners Club;” and an annual Wellness Fair.
Libary-Media: In addition to integration that supports all areas of the curriculm, specific information and
technology skills are taught. Highlights in our state-of-the-art facility include an on-going library loan
program from our varied book collection, author studies, book clubs, research projects and technology
instruction.
2a. (Elementary Schools) Reading:
(This question is for elementary schools only)
Clinton Street Elementary School’s reading curriculum is derived from several sources, including those
provided by New York State and our school district, which developed an essential curriculum map that set
overarching goals for the teaching of reading. From there, our school creates Essential Common Outcomes in
reading at each grade level, twice per year. As noted elsewhere in this document, these decisions on annual
curriculum priorities are based upon group assessment data for each grade level.
Ten years ago, we adopted the Four Blocks literacy framework, developed by Patricia Cunningham, Dorothy
Hall, et.al., to guide our planning and instruction. Its balanced multi-method and multi-level approach,
designed to meet the diverse needs of learners found in every classroom, met our needs. It is divided into four
critical elements (four blocks): Guided Reading, Self-Selected Reading, Working with Words, and Writing. We
have augmented our instruction through incorporating the work of several leaders in the field, including
Richard Allington, Stephanie Harvey and Anne Goudvis, and Lucy Calkins. The framework allows us to use
authentic texts, materials, and applications. Using a gradual release of responsibility model throughout
reading instruction, students learn through the teacher’s modeling, practice with guidance, independent
practice, and application with feedback. We differentiate instruction in all four blocks, based upon student
need. Guided Reading is the block in which we teach strategies that help students develop comprehension
skills. Before reading, mini-lessons on a variety of comprehension strategies appropriate for each grade level
are taught. During reading, strategies or skills from the mini-lesson, as well as those cumulatively learned, are
applied. After reading, students articulate what was learned and its use for them in understanding what they
read. Teachers monitor progress through multiple means of assessment. Self-Selected Reading is where
students develop fluency, gain additional practice in applying comprehension skills in books at their levels,
and develop a love of reading through being allowed to make text choices. It includes a short teacher read-
aloud to model fluency, individual conferences where students and teachers discuss books, and quick informal
assessments of applied skills that are subtly conducted. In the Working with Words block, students develop
spelling, decoding, and word analysis skills as they learn rules and patterns. Physical manipulation of letters,
movement, and chanting make this block ideal for students with multiple learning styles. A posted wall of
sight and anchor words provides a useful resource in for students learning to spell and practice irregular words
correctly. The Writing Block enhances reading instruction in several ways. The relationship between encoding
and decoding is mutually reinforcing in both areas of literacy learning. Students also respond to reading
though writing, and use their written pieces as high interest text to read. Through all of their learning
activities, students realize that the ultimately goal of reading is to comprehend.
3. Additional Curriculum Area:
Our school’s mission includes encouraging excellence in academics and developing life-long learners. Since
basic math skills are important in life, and advanced math skills enable students to pursue higher educational
and career opportunities in the future, we identify math as a curriculum area of emphasis that helps us achieve
our mission. As is the case with reading, our district developed an essential curriculum map in math to set
overarching goals for instruction. This math curriculum is rooted in the state’s core curriculum to help
students meet state standards. As previously described, we, at Clinton, then create our own essential common
outcomes annually to establish priorities at each grade level in the area of math. We rely on the use of

NY-01 ny01-clinton-street-elemenary.doc 13
performance indicators, which describe what students need to do to demonstrate progress toward mastery of
the standards in math. Our approach to teaching math is constructivist in nature. As such, the goal is to
provide opportunities and experiences that facilitate students’ constructing their own understandings of
mathematical concepts. This approach is simultaneously skills-based, developmental, and
differentiated. Essential skills in numeracy, calculation, and problem-solving are taught through modeling and
guided practice. Manipulatives and games enhance learning while promoting enjoyment and confidence –
especially important in this often "maligned" curriculum area. The curriculum spirals, so that students revisit
key concepts and have multiple opportunities to apply skills to solve increasingly more complex problems
throughout the grade levels. Students learn that there is more than one way to solve a problem, which
encourages creative and critical thinking. District-wide, we use the Everyday Math program from the
University of Chicago, which provides many curriculum resources. However, rather than use the program in
lock-step fashion, our teachers use their ever-increasing knowledge of content and pedagogy, as well as
assessment data, in order to mindfully design lessons that make sure all students are successful in math.
4. Instructional Methods:
Several years ago, we realized that a number of students in the K-2, 12:1:1 special education district classes
located in our school were not making much progress. Furthermore, when we analyzed assessment data, we
noted that their learning profiles were not that different from many students served through our general
education program. With the district’s blessing and parental consent, we moved from a self-contained special
education model at the primary level to one of inclusion. With that move, came a compelling need to
differentiate instruction. We examined our curriculum and identified “the bottom line,” i.e. the essential
learning for all students. Rather than differentiate “up and down” from a middle ground, which seemed to be
the more common approach, we began to only differentiate “up.” With this approach, students who struggle
learn the same basic concepts and skills as their classmates, while we preserve time in their schedules for
intervention. Students who are learning at expected levels continue to be instructed on grade level concepts
and skills; those whose learning exceeds expected levels are provided with instruction that enriches their
learning. It should be noted that students’ groupings are flexible in order to honor their strengths and
interests. Serendipitously, the district brought in an outside consultant, Carolyn Chapman, to provide a week-
long Differentiated Instruction Summer Institute for two consecutive years. Several teachers from our school
attended, and were able to provide turn-key training and support for our teachers in implementing DI. Our
curriculum and instructional methods were further modified and supplemented as we addressed learning styles
and preferences, multiple modalities, and incorporated student choice. We have seen positive results among
students in terms of academic achievement and improved behaviors. Additionally, this has influenced
beneficial changes in staff and resource deployment. Classroom teachers have increased their capacity to work
with diverse learners in their classrooms. Special education teachers have become “interventionists,” whose
specialized training is now widely used. Related service providers offer proactive educationally-related
services. The expertise of our reading and literacy specialists is now accessible to all. As a result of our
differentiated instructional program, our special education classification rate has decreased, while student
achievement has increased. Our only identifiable sub-group category is "economically disadvantaged."
Through deploying our intervention staff to meet associated needs, student achievement in that group has also
increased.
5. Professional Development:
We, at Clinton Street Elementary School, define ourselves as a professional learning community. Inherent in
this designation is the belief that the most important professional development occurs through deep,
meaningful collaboration around issues of student learning that are aligned with content standards. We meet
regularly in teams to share assessment data and information. We use these opportunities to reflect upon and
discuss our practices in light of the results we are getting. Teachers whose students experience the most
success in learning new knowledge or skills describe the instruction they used to get positive results. Through
this collaborative dialogue, their colleagues learn new strategies and are able to replicate effective
instruction. This “bottom up” type of professional development is powerful as it validates what works and

NY-01 ny01-clinton-street-elemenary.doc 14
creates an impetus for changing what doesn’t. We use other professional development vehicles to introduce
new school initiatives or address challenges that require acquisition of shared knowledge. One vehicle is
professional reading. In a nod toward the popularity of book clubs, we have dubbed this OPRAHS; the
acronym standing for Our Professional Readers Achieve Higher Standards. We have also brought in
presenters and consultants on topics that we deemed important to the success of our students. For example, we
had recently determined through observation and discussion, that engagement was a problem for a number of
students across grade levels. We invited a college professor with expertise in this area to provide a workshop
on the topic. Our teachers participate in district offerings through our local teachers' center and staff
development office. Finances are limited, but when possible, we send faculty members to conferences that are
particularly relevant. Whether our entire faculty reads, listens to a presenter, or attends a workshop or
conference, the goal of our professional development is to promote reflection, meaningful dialogue, and
inspiration to try new strategies and approaches in our classrooms. This then cycles back to collaboration
centered on student learning in response to our teaching.
6. School Leadership:
The leadership structure at Clinton Street Elementary is best described as distributive. Each grade level and
department autonomously makes decisions within established parameters that address the needs of
students. Creativity is encouraged and teachers are invited to challenge status quo, as long as research backs a
proposal and students will be the beneficiaries of change. We are organized into teams to accomplish specific
purposes. The Shared Decision Making Team of faculty, staff, and parents, is our umbrella committee,
overseeing the work of all teams toward ensuring student achievement at high levels. The Parent-Teacher
Organization provides financial and organizational support to supplement our programs. The Building
Curriculum Leadership Council serves as a clearing house for matters of curriculum and instruction. Our
Four Blocks Literacy Team supports teachers through staying abreast of instructional improvements and
strategies that augment our approach in the critical area of literacy. The Technology Team stays “cutting edge”
to help teachers harness the power of technology that engages and motivates today’s students. Faculty, staff,
and parents on the Character Education and Wellness Teams plan curriculum, service learning, and activities
to help students develop the dispositions required to succeed in all walks of life. The RTI Team serves as our
“think tank.” Comprised of the school’s “specialists,” this team’s charge is to do “whatever it takes” and
support teachers and parents in helping students overcome the obstacles that interfere with learning. The
principal exemplifies the vision of the school, truly believing that every child will succeed. She is very “hands
on”, especially in the areas of literacy and intervention, and takes a special interest in the progress of students
who are struggling. An avid “googler”, she encourages teachers to read, research, and design creative
interventions to meet the varied challenges faced by struggling students. As an ex-officio member of every
school team and the liaison to the district and community, she strives to achieve a balance between being
supportive and challenging ideas and decisions, in the best interest of all Clinton students.

NY-01 ny01-clinton-street-elemenary.doc 15
PART VII - ASSESSMENT RESULTS
STATE CRITERION-REFERENCED TESTS
Subject: Mathematics Grade: 3 Test: NYS Math
Edition/Publication Year: Published annually Publisher: CTB/McGraw-Hill
2008-2009 2007-2008 2006-2007 2005-2006 2004-2005
Testing Month May Mar Mar Mar
SCHOOL SCORES
Proficiency 99 96 98 89
Mastery 43 34 35 37
Number of students tested 75 67 68 64
Percent of total students tested 100 100 100 100
Number of students alternatively assessed 8 3 2
Percent of students alternatively assessed 10 4 3
SUBGROUP SCORES
1. Socio-Economic Disadvantaged/Free and Reduced-Price Meal Students
Proficiency 95 90 91 75
Mastery 36 24 9 30
Number of students tested 22 21 11 19
2. African American Students
Proficiency
Mastery
Number of students tested
3. Hispanic or Latino Students
Proficiency
Mastery
Number of students tested
4. Special Education Students
Proficiency
Mastery
Number of students tested
5. Limited English Proficient Students
Proficiency
Mastery
Number of students tested
6. Largest Other Subgroup
Proficiency
Mastery
Number of students tested
Notes:
No state testing was administered in math in grade 3 until 2005-06. Students who took the NY State
Alternate Assessments (NYSSA) were those in a district 12:1:1 "functional" class housed in our building.
These assessments were developed in 06-07. No prior data is available.

NY-01 ny01-clinton-street-elemenary.doc 16
Subject: Reading Grade: 3 Test: NYS ELA
Edition/Publication Year: Published annually Publisher: CTB/McGraw-Hill
2008-2009 2007-2008 2006-2007 2005-2006 2004-2005
Testing Month Jan Jan Jan Jan
SCHOOL SCORES
Proficiency 92 81 87 72
Mastery 17 15 18 3
Number of students tested 75 67 68 64
Percent of total students tested 100 100 100 100
Number of students alternatively assessed 8 3 2
Percent of students alternatively assessed 10 4 3
SUBGROUP SCORES
1. Socio-Economic Disadvantaged/Free and Reduced-Price Meal Students
Proficiency 86 67 72 55
Mastery 14 10 18 5
Number of students tested 22 21 11 19
2. African American Students
Proficiency
Mastery
Number of students tested
3. Hispanic or Latino Students
Proficiency
Mastery
Number of students tested
4. Special Education Students
Proficiency
Mastery
Number of students tested
5. Limited English Proficient Students
Proficiency
Mastery
Number of students tested
6. Largest Other Subgroup
Proficiency
Mastery
Number of students tested
Notes:
No state testing was administered in ELA in grade 3 until 2005-06. Students who took the NY State
Alternate Assessments (NYSSA) were those in a district 12:1:1 "functional" class housed in our building.
These assessments were developed in 06-07. No prior data is available.

NY-01 ny01-clinton-street-elemenary.doc 17
Subject: Mathematics Grade: 4 Test: NYS Math
Edition/Publication Year: Published annually Publisher: CTB/McGraw-Hill
2008-2009 2007-2008 2006-2007 2005-2006 2004-2005
Testing Month Mar Mar Mar Mar May
SCHOOL SCORES
Proficiency 96 99 95 95 74
Mastery 45 43 40 33 49
Number of students tested 67 67 55 79 84
Percent of total students tested 99 100 100 100 100
Number of students alternatively assessed 2 1 9
Percent of students alternatively assessed 3 1 10
SUBGROUP SCORES
1. Socio-Economic Disadvantaged/Free and Reduced-Price Meal Students
Proficiency 100 93 90 91 91
Mastery 26 20 30 35 32
Number of students tested 19 13 10 23 22
2. African American Students
Proficiency
Mastery
Number of students tested
3. Hispanic or Latino Students
Proficiency
Mastery
Number of students tested
4. Special Education Students
Proficiency
Mastery
Number of students tested
5. Limited English Proficient Students
Proficiency
Mastery
Number of students tested
6. Largest Other Subgroup
Proficiency
Mastery
Number of students tested
Notes:
Students who took the NY State Alternate Assessments (NYSSA) were those in a district 12:1:1 "functional"
class housed in our building. These assessments were developed in 06-07. No prior data is available.

NY-01 ny01-clinton-street-elemenary.doc 18
Subject: Reading Grade: 4 Test: NYS ELA
Edition/Publication Year: Published annually Publisher: CTB/McGraw-Hill
2008-2009 2007-2008 2006-2007 2005-2006 2004-2005
Testing Month Jan Jan Jan Jan Feb
SCHOOL SCORES
Proficiency 82 88 80 85 87
Mastery 3 12 20 9 30
Number of students tested 67 67 55 79 84
Percent of total students tested 100 99 100 100 100
Number of students alternatively assessed 2 1 9
Percent of students alternatively assessed 3 1 14
SUBGROUP SCORES
1. Socio-Economic Disadvantaged/Free and Reduced-Price Meal Students
Proficiency 79 92 70 78 82
Mastery 5 8 0 4 18
Number of students tested 19 13 10 23 22
2. African American Students
Proficiency
Mastery
Number of students tested
3. Hispanic or Latino Students
Proficiency
Mastery
Number of students tested
4. Special Education Students
Proficiency
Mastery
Number of students tested
5. Limited English Proficient Students
Proficiency
Mastery
Number of students tested
6. Largest Other Subgroup
Proficiency
Mastery
Number of students tested
Notes:
Students who took the NY State Alternate Assessments (NYSSA) were those in a district 12:1:1 "functional"
class housed in our building. These assessments were developed in 06-07. No prior data is available.

NY-01 ny01-clinton-street-elemenary.doc 19
Subject: Mathematics Grade: 5 Test: NYS Math
Edition/Publication Year: Published annually Publisher: CTB/McGraw-Hill
2008-2009 2007-2008 2006-2007 2005-2006 2004-2005
Testing Month Mar Mar Mar Mar
SCHOOL SCORES
Proficiency 99 97 90 84
Mastery 51 48 30 26
Number of students tested 72 58 77 85
Percent of total students tested 100 100 100 100
Number of students alternatively assessed 2 8 5
Percent of students alternatively assessed 2 12 6
SUBGROUP SCORES
1. Socio-Economic Disadvantaged/Free and Reduced-Price Meal Students
Proficiency 95 91 83 74
Mastery 40 36 17 11
Number of students tested 19 11 18 20
2. African American Students
Proficiency
Mastery
Number of students tested
3. Hispanic or Latino Students
Proficiency
Mastery
Number of students tested
4. Special Education Students
Proficiency
Mastery
Number of students tested
5. Limited English Proficient Students
Proficiency
Mastery
Number of students tested
6. Largest Other Subgroup
Proficiency
Mastery
Number of students tested
Notes:
No state testing was administered in math in grade 5 until 2005-06. Students who took the NY State
Alternate Assessments (NYSSA) were those in a district 12:1:1 "functional" class housed in our building.
These assessments were revised in 06-07. No prior data is available.

NY-01 ny01-clinton-street-elemenary.doc 20
Subject: Reading Grade: 5 Test: NYS ELA
Edition/Publication Year: Published annually Publisher: CTB-McGraw
2008-2009 2007-2008 2006-2007 2005-2006 2004-2005
Testing Month Jan Jan Jan Jan
SCHOOL SCORES
Proficiency 98 83 77 85
Mastery 17 7 6 19
Number of students tested 72 58 77 85
Percent of total students tested 100 100 100 100
Number of students alternatively assessed 2 8 5
Percent of students alternatively assessed 2 12 6
SUBGROUP SCORES
1. Socio-Economic Disadvantaged/Free and Reduced-Price Meal Students
Proficiency 100 64 78 55
Mastery 16 9 6 5
Number of students tested 19 11 18 20
2. African American Students
Proficiency
Mastery
Number of students tested
3. Hispanic or Latino Students
Proficiency
Mastery
Number of students tested
4. Special Education Students
Proficiency
Mastery
Number of students tested
5. Limited English Proficient Students
Proficiency
Mastery
Number of students tested
6. Largest Other Subgroup
Proficiency
Mastery
Number of students tested
Notes:
No state testing was administered in ELA in grade 5 until 2005-06. Students who took the NY State
Alternate Assessments (NYSSA) were those in a district 12:1:1 "functional" class housed in our building.
These assessments were developed in 06-07. No prior data is available.
NY-01 ny01-clinton-street-elemenary.doc 21
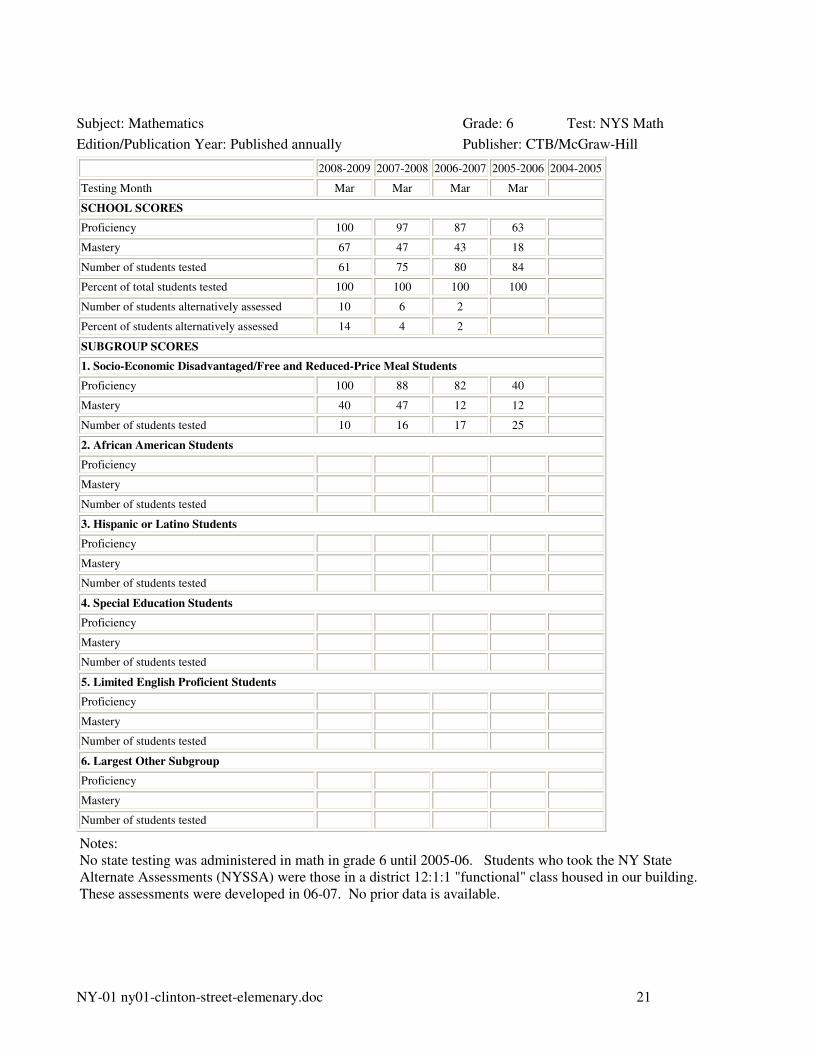
Subject: Mathematics Grade: 6 Test: NYS Math
Edition/Publication Year: Published annually Publisher: CTB/McGraw-Hill
2008-2009 2007-2008 2006-2007 2005-2006 2004-2005
Testing Month Mar Mar Mar Mar
SCHOOL SCORES
Proficiency 100 97 87 63
Mastery 67 47 43 18
Number of students tested 61 75 80 84
Percent of total students tested 100 100 100 100
Number of students alternatively assessed 10 6 2
Percent of students alternatively assessed 14 4 2
SUBGROUP SCORES
1. Socio-Economic Disadvantaged/Free and Reduced-Price Meal Students
Proficiency 100 88 82 40
Mastery 40 47 12 12
Number of students tested 10 16 17 25
2. African American Students
Proficiency
Mastery
Number of students tested
3. Hispanic or Latino Students
Proficiency
Mastery
Number of students tested
4. Special Education Students
Proficiency
Mastery
Number of students tested
5. Limited English Proficient Students
Proficiency
Mastery
Number of students tested
6. Largest Other Subgroup
Proficiency
Mastery
Number of students tested
Notes:
No state testing was administered in math in grade 6 until 2005-06. Students who took the NY State
Alternate Assessments (NYSSA) were those in a district 12:1:1 "functional" class housed in our building.
These assessments were developed in 06-07. No prior data is available.

NY-01 ny01-clinton-street-elemenary.doc 22
Subject: Reading Grade: 6 Test: NYS ELA
Edition/Publication Year: Published annually Publisher: CTB/McGraw-Hill
2008-2009 2007-2008 2006-2007 2005-2006 2004-2005
Testing Month Jan Jan Jan Jan
SCHOOL SCORES
Proficiency 98 95 75 74
Mastery 13 3 10 15
Number of students tested 61 75 80 84
Percent of total students tested 100 100 100 100
Number of students alternatively assessed 10 6 2
Percent of students alternatively assessed 14 7 2
SUBGROUP SCORES
1. Socio-Economic Disadvantaged/Free and Reduced-Price Meal Students
Proficiency 100 94 59 60
Mastery 10 0 0 0
Number of students tested 10 16 17 25
2. African American Students
Proficiency
Mastery
Number of students tested
3. Hispanic or Latino Students
Proficiency
Mastery
Number of students tested
4. Special Education Students
Proficiency
Mastery
Number of students tested
5. Limited English Proficient Students
Proficiency
Mastery
Number of students tested
6. Largest Other Subgroup
Proficiency
Mastery
Number of students tested
Notes:
No state testing was administered in ELA in grade 6 until 2005-06. Students who took the NY State
Alternate Assessments (NYSSA) were those in a district 12:1:1 "functional" class housed in our building.
These assessments were developed in 06-07. No prior data is available.