u.s. department of commerce national …infohouse.p2ric.org/ref/26/25038.pdfabstract over 80 percent...
TRANSCRIPT

<-@@ a 7 q 2 J 5 3 P POLLUTION PREVENTION PAYS PROGRAM
Ocpaitmenl of f4aiurai Resources 8 Communi!y Drvdopmeor
RALEIGH. M. C. 2761 1.7587 P. 0. BOX 27687 I D F
PB8 4-17 4168
Wastewater Recyc le and Reuse P o t e n t i a l f o r I n d i r e c t Discharge T e x t i l e F i n i s h i n g M i l l s Volume 2 . S i x Mill Engineer ing Reports
1
Sverdrup and Parcel and A s s o c i a t e s , I n c . S t . Louis , MO
Prepared f o r
I n d u s t r i a l Environmental Research Lab. Research T r i a n g l e Park, NC
Mar a4
.I
U.S. DEPARTMENT OF COMMERCE National Technical Information Service

. . ,
EB84-174 168
EPA-60012-84- 070b March 1984
WASTEWATER RECYCLE AND REUSE POTENTIAL
FOR INDIRECT DISCHARGE TEXTILE FINISHING MILLS
V o l u m e 2. Six Mill Engineering Reports
Jon F. Berpenthal
Sverdrup & Parce l and Assoc ia t e s , Inc . S t . Louis , Missouri 63101
Contrac t No. 68-02-3678
EPA P r o j e c t Of f i ce r : Robert V . Hendriks
I n d u s t r i a l Environmental Research Laboratory U t i l i t i e s and I n d u s t r i a l Processes Div i s ion
Research Tr i ang le Park , NC 27711
Prepared f o r
U.S. Environmental P r o t e c t i o n Agency O f f i c e of Research and Development
Washington, DC 20460

.
I. REPORT NO, J. .REClPlENI'S ACCESSIOW NO. . . .
2. EPA-600/2-84-070b
Wastewater Recycle and Reuse Potential for Indirect k. T ITLE ANDSUBTITLE
Discharge Textile Finishing Mills; Volume 2. Six Mil l Engineering Reports
'. AUTHORISI
pRRs r l&?r;a - 6. REPORT D A T E
1984 6. PERFORMING ORGANIZATION CODE
II.'PERFORMINO ORGANIZATION REPORT NC
Jon F. Bergenthal
Sverdrup and Parce l and Associates, Inc.
St. Louis, Missouri 63101
PERFORMING OROANIZATION NAME A N D ADDRESS
801 North Eleventh
1. SPONSORING AGENCY N A M E A N 0 ADDRESS
EPA, Office of Research and Development Industrial Environmental Research Laboratory Research Triangle Park , NC 27711
10. PRCrGRAM ELEMENT NO,
-11. CONTRACTJGRANT NO,
68-02-3678 (Phases 1 and 2)
Final: 4181-6/83 13. TYPE OF REPORT A N D PERIOD COVEREO
14. SPONSORING AGENCY CODE
EPA/600/13
DESCRIPTORS -- Pollution Textile Finishing Waste Water Circulation Waste Treatment
I DISTRIBUTION STATEMENT
Release to Publlc
b IOENTIFIERS/OPEN ENOEO TERMS C COSATI Fleld/Craup
Pollution Control 13 B Stationary Sources 13H Recycling
14G
19 SECURITV CLASS (ThhaRIport) 11 N O OF PAGES
__ Unclassified _ _ 38 I 20 SECURITY CLASS (Th i spqe ) I2 PRICE Unclassified - .

NOTICE
T h i s document has been reviewed in accordance with U.S. Environmental Protection Agency policy and approved for publication. or commercial products does not constitute endorse- ment or recommendation for use.
Mention of trade names
ii

ABSTRACT
Over 80 percent of textile finishing mills discharge their
wastewater to publicly owned treatment works. A variety of wastewater
recycle technologies has been developed to allow these mills to reduce
the volume of wastewater and amount of pollutants discharged.
Only a few of these technologies have become widely applied in
the textile finishing industry. With most of these technologies,
specific technical and economic factors affect their application at a
given mill; thus each application must be considered under its own
mill-specific conditions.
This report presents detailed information on textile
wastewater recycle/reuse technologies. Included for each are a
description of the technology, its environmental benefits, recycle
system and treatment system schematics, design criteria, a discussion of
technical factors that limit or enhance the application of the
technology, capital and yearly costs, an examination of factors that
affect the economic feasibility of the technology, listings of current
applications of the technology, and references for further information.
The information in this report is based on a survey of the
literature, discussions with technology vendors and researchers, and
engineering studies conducted at six textile finishing mills. The six
mill engineering reports appear in Volume 2 of this report.
This report is submitted in accordance with Contract Number
68-02-3678 between the U.S. Environmental Protection Agency and
Sverdrup & Parcel and Associates, Inc. It documents the work performed
under Phases I and I1 of the contract. A future report (Phase 111) will
cover a detailed investigation of dyebath reconstitution and reuse. iii

TABLE OF CONTENTS
M i l l C-2, Nylon Carpet T u f t i n g and Dyeing . . . . . . . . . . . . A - i
Mill W-3, Woven Fabr i c P r e p a r a t i o n and P r i n t i n g . . . . . . . . . B - i
M i l l W-4, Woven F a b r i c F i n i s h i n g . . . . . . . . . . . . . . . . C - i M i l l W - 8 , Woven I n d u s t r i a l F a b r i c F i n i s h i n g . . . . . . . . . . . D - i
Mill W-9, Woven F a b r i c F i n i s h i n g . . . . . . . . . . . . . . . . E - i M i l l Y-4, A c r y l i c Yarn Dyeing . . . . . . . . . . . . . . . . . . F - i
i v
1 -
i

MILL SURVEY REPORT MILL C-2
NYLON CARPET TUFTING AND DYEING .
.
A- i
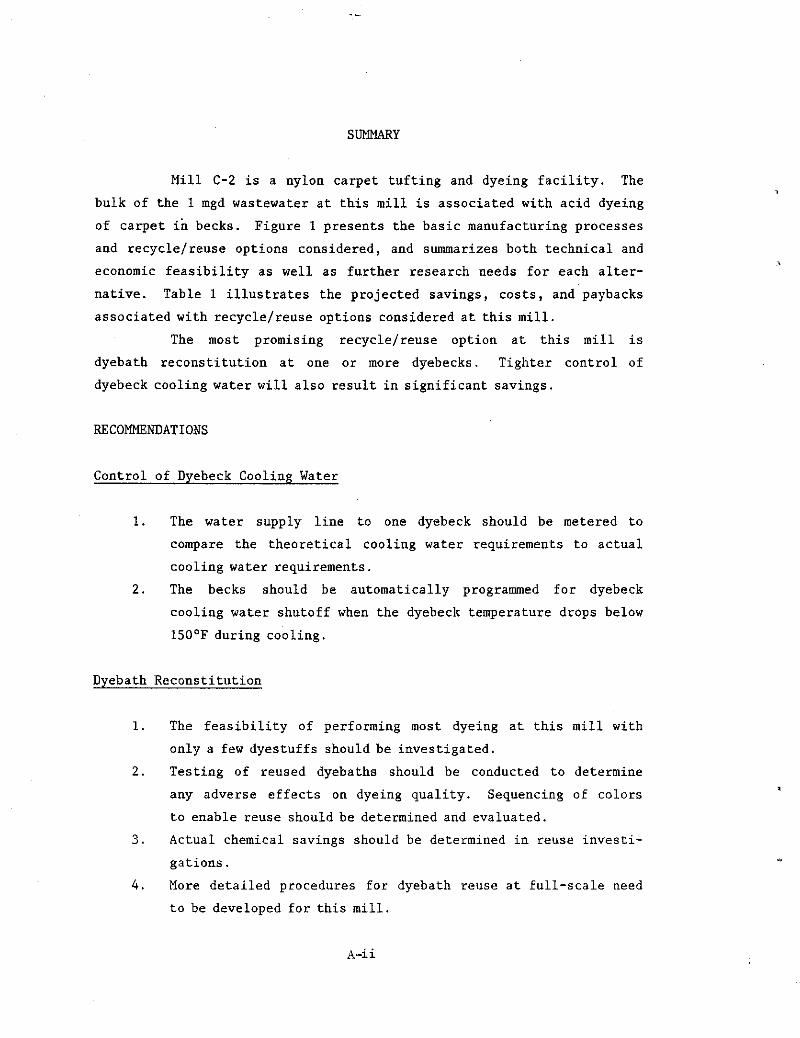
SUMMARY
Mill C-2 is a nylon carpet tufting and dyeing facility. The bulk of the 1 mgd wastewater at this mill is associated with acid dyeing of carpet in becks. Figure 1 presents the basic manufacturing processes and recycle/reuse options considered, and summarizes both technical and economic feasibility as well as further research needs for each alter- native. Table 1 illustrates the projected savings, costs, and paybacks associated with recycle/reuse options considered at this mill.
The most promising recycle/reuse option at this mill is dyebath reconstitution at one or more dyebecks. Tighter control of dyebeck cooling water will also result in significant savings.
RECOMMENDATIONS
Control of Dyebeck Cooling Water
1. The water supply line to one dyebeck should be metered to compare the theoretical cooling water requirements to actual cooling water requirements.
2 . The becks should be automatically programmed for dyebeck cooling water shutoff when the dyebeck temperature drops below 150°F during cooling.
Dyebath Reconstitution
1.
2 .
3 .
4 .
The feasibility of performing most dyeing at this mill with only a few dyestuffs should be investigated. Testing of reused dyebaths should be conducted to determine any adverse effects on dyeing quality. Sequencing of colors to enable reuse should be determined and evaluated. Actual chemical savings should be determined in reuse investi- gations. More detailed procedures for dyebath reuse at full-scale need to be developed for this mill.
A-i i

.
n I EXTRACTION I n TUFTING - DYEING & LATEX
DRYING BACKING
Technologies Evaluated Feasibility
Technical Economic Data Needs
Dye Wastewater feasible marginal Investigate formation of Decolorization (C1 ) & reuse chlorinated compounds
Decolorization (Act Zarbon) & reuse feasible not promising -- Dyebath reconstitution promising promising Demonstration In-beck heat transfer feasible not promising --
Figure 1 . Manufacturing Processes and Potential Recycle/Reuse Technologies at Mill C-2.
..,

TABLE 1 SUMMARY OF ECONOMIC AND ENVIRONMENTAL BENEFITS OF RECYCLE/REUSE OPTIONS
Net Annual Capital Payback Flow Reduction COD Reduction
RecyclefReuse Scheme Savings cost (years) gpd % Total Ib/day % Total
Chlorine Oxidation of Dyehouse $350,000 $1,067,000 3 755,000 75 4,400 75
Carbon Adsorption of Dyehouse ($70,000) $2,070,000 Net 848,000 84 si %
Wastewater
Wastewater Operating costs
$222,000 $ 242,000 1 166,000 17 1 ,470 25 ? F Dyebath Reconstitution (10 becks) 4
Control of Dyebeck Cooling $ 37,000 0 _ _ 205,000 20 0 0
Dyebeck Cooling by Heat Transfer $ 70,000 $ 641,000 9 94,000 9 0 0
f Insufficient information
.

TABLE OF CONTENTS .
.
Summary . . . . . . . . . . . . . . . . . . . . . . . . . . . . ii Table of contents . . . . . . . . . . . . . . . . . . . . . . . v
I . INTRODUCTION . . . . . . . . . . . . . . . . . . . . . . . 1
Facility Description . . . . . . . . . . . . . . . . . 1 Manufacturing Processes . . . . . . . . . . . . . . . 1
Overall Mass and Energy Balances . . . . . . . . . . . 6
Evaluation of Recycle/Reuse Technologies . . . . . . . 9
I1 . CHLORINE OXIDATION OF DYEHOUSE WASTEWATER . . . . . . . . . 13
Description of Manufacturing Process and Proposed Modification . . . . . . . . . . . . . . . . . . . . . 13
Technical Feasibility and Design Criteria . . . . . . 17
Economic Feasibility . . . . . . . . . . . . . . . . . 19
Environmental Benefits . . . . . . . . . . . . . . . . 20
Conclusions . . . . . . . . . . . . . . . . . . . . . 20
I11 . CARBON ADSORPTION TREATMENT OF DYEHOUSE WASTEWATER . . . . 24
Description of Manufacturing Process and Proposed Modification . . . . . . . . . . . . . . . . . . . . 24
Technical Feasibility and Design Criteria . . . . . . . 24
Economic Feasibility . . . . . . . . . . . . . . . . . 28
Environmental Benefits . . . . . . . . . . . . . . . . 28
Conclusions . . . . . . . . . . . . . . . . . . . . . 30
IV . RECONSTITUTION OF DYEBATH WASTEWATER . . . . . . . . . . . . 31
Description of Manufacturing Process and Proposed Modification . . . . . . . . . . . . . . . . . . . . 31
Technical Feasibility and Design Criteria . . . . . . 33
A-V

...
TABLE OF CONTENTS (Continued)
Economic Feasibility . . . . . . . . . . . . . . . . . 34
Environmental Benefits . . . . . . . . . . . . . . . . 31
Conclusions . . . . . . . . . . . . . . . . . . . . . 39
V . COOLING WATER REQUIREMENTS . . . . . . . . . . . . . . . . 40
Description of Manufacturing Process and Proposed Modification . . . . . . . . . . . . . . . . . . . . 40
Technical Feasibility and Design Criteria . . . . . . 40
Economic Feasibility . . . . . . . . . . . . . . . . . 40
Environmental Benefits . . . . . . . . . . . . . . . . 43
Conclusions . . . . . . . . . . . . . . . . . . . . . 43
VI . NONCONTACT COOLING OF DYEBATH WATER . . . . . . . . . . . . 44
Description of Manufacturing Process and Proposed Modification . . . . . . . . . . . . . . . . . . . . 44
Technical Feasibility and Design Criteria . . . . . . 44
Economic Feasibility . . . . . . . . . . . . . . . . . 46
Environmental Benefits . . . . . . . . . . . . . . . . 46
Conclusions . . . . . . . . . . . . . . . . . . . . . 46
References . . . . . . . . . . . . . . . . . . . . . . . . . . . 48
A- vi

SECTION I INTRODUCTION
.
.
M i l l C-2 i s a major c a r p e t t u f t i n g and dyeing f a c i l i t y l o c a t e d
i n t h e Sou theas t . This r e p o r t a s s e s s e s t h e a p p l i c a b i l i t y of t h r e e
technologies - c h l o r i n e d e c o l o r i z a t i o n , a c t i v a t e d carbon, and dyebath
r e c o n s t i t u t i o n - t o enable reuse of process wastewaters .
FACILITY DESCRIPTION
The t o t a l e f f o r t s of M i l l C-2 a r e geared toward t h e product ion
of f i n i s h e d c a r p e t f o r domest ic and commercial u se . Over 90 pe rcen t of
t h e c a r p e t produced here i s nylon f i b e r c a r p e t . The minor remaining
p o r t i o n produced h e r e i s p o l y e s t e r c a r p e t . The p r i n c i p a l manufactur ing
p rocesses involved i n c a r p e t product ion a t M i l l C-2 a r e t u f t i n g , p i e c e
dye ing , and l a t e x backing. These processes a r e desc r ibed below.
MANUFACTURING PROCESSES
T u f t i n g
This p l a n t r ece ives y a r n t o product s p e c i f i c a t i o n s from
a s s o c i a t e d company ope ra t ions o r open market purchases of prepared yarn .
I n d i v i d u a l packages ( 4 t o 8 lbs) of ya rn a r e combined i n a c r e e l t o make
up t h e r equ i r ed number of ya rn ends t o supply t h e p rope r gauge f o r t h e
t u f t i n g machine. From t h e c r e e l t h e ya rn i s f ed t o a need l ing ( t u f t i n g ) machine. These machines
sew t h e ya rn i n t o a pr imary backing m a t e r i a l c a l l e d scr im. The machine
can be mechanical ly set t o produce loop p i l e , c u t p i l e , o r a d e s i r e d
p a t t e r n . No wastewater i s genera ted from any a s p e c t s of t h e t u f t i n g
ope ra t ion .
There a r e s e v e r a l such machines a t t h i s p l a n t .
D B Following t u f t i n g , t h e product i s p i e c e dyed i n an open beck.
Seve ra l medium s i z e becks a r e used he re . The beck i s f i l l e d wi th c i t y
water e s t ima ted by m i l l pe rsonnel t o average 53'F. The r equ i r ed
chemical a d d i t i o n s and dye formula t ions a r e prepared on t h e p l a n t ' s
second l e v e l . Once t h e p rope r amount and type of dye and a d d i t i v e s have
A-1

been prepared, they are fed into the beck through a false front. Chemicals are added first and circulate for about ten minutes before the dye is added. Among the chemical additives that may be introduced into the beck are anti-foam agents (non-silicone, mineral oil base), monosodium o r trisodium phosphates to control pH, leveling agents (fatty acids) o r ethylene oxide condensates for even dye dispersion on the face of the carpet, and polyamide derivative softening agents. Acid dyes (azo and diazo compounds) are used to dye nylon carpet, and dispersed dyes are used for dyeing polyester carpet. Fabric loading, circulation of chemicals, and circulation of dyes usually requires a total of 20 to 30 minutes.
Superheated steam (400'F) is used to heat the dyebath. Steam is introduced into the beck through the same open sparge (false front) used for introducing the dye formulation. The rate of rise in temperature and dye strike (dyeing) temperature is dependent upon the dyestuff and the yarn in the carpet. Usually the dyebath temperature is raised at a rate of two to three degrees per minute until the dye strike temperature of 180°F for low temperature dyeing o r 209OF to 213OF (i.e. rolling boil) f o r high temperature dyeing is reached. Thus, the heating procedure usually requires 45 minutes to an hour. Once the dye strike temperature is reached, carpet circulates through the dyebath for 45 minutes to one hour. The various parameters described above are individually programmable for each beck and cycle.
After the carpet has been circulated for the required length of time, the temperature is lowered to 180°F and the carpet is checked for proper shade. If this inspection shows that the desired shade ha5 not yet been acquired, additional dye is added and the dyebath is again heated to the dye strike temperature. The process of adding additional dye, reheating, and reinspecting is referred to as an "add". Each add will require approximately an hour. Typically there will be one to four o r more adds. Over a period of time, the number of adds per dyeing cycle averages one and a half. A dyeing cycle (length of time between carpet loading and its removal from the beck) requires three hours if there are no adds. The average cycle lasts 4% hours.
A-2

J
Once an inspection shows that the carpet' has reached the desired shade, a portion of the dyebath is drained and replaced with cold water to gradually cool the bath. Sufficient cooling is achieved when the bath temperature reaches 150'F. This bath is then dumped and the beck is refilled for cooling and rinsing.
.
Extraction and Drying When the carpet is cool enough to handle, it is removed from
the beck and goes through a vacuum extractor for water removal. The carpet is dipped through a water bath to ensure even moisture distribution as the carpet passes through the extractor. As the carpet enters the extractor, the weight of the carpet and the weight of the entrapped water are about equal. Approximately two-thirds of the water is removed in this step. Following extraction, the carpet goes through a steam-heated wet goods dryer at 260'F where the moisture content is reduced to the residual level (four percent moisture for nylon).
Backcoating The carpet is now ready to have a secondary backing of jute o r
polypropylene applied. A latex formulation consisting of latex and whiting is applied to the back of the primary backing. The application is controlled by electronic sensing. The secondary backing is pressed against the primary backing and the carpet is then heated by steam to achieve curing. Water cooled rollers are also used to set the latex after application of the latex coated primary backing to the secondary backing. This process is known as rubberizing, and it gives additional strength and bonding to the face yarn of the carpet
A shearing operation sometimes follows rubberizing to give the face of the carpet an even finish. Following rubberizing (or shearing if needed), the carpet is ready for final inspection. It is then cut to customer o r roll length, packaged, and shipped.
A flow schematic o f the above described operations is presented in Figure 1-1. These operations are shown in a plant layout drawing in Figure 1-2.
A-3

YARN
DYEINQ ---W 646 QPM
+ 8 GPM
BACKING --+5 GPM Q FINISHED CARPET
LEGEND: - PRODUCT ----WASTEWATER
FIGURE 1-1. GENERAL PRODUCTION SEQUENCE AT MILL C-2.
,
A- 4

- ASH 0 PITS
BOILER PLANT
WATER
TUFTING
I DYEING1 J
1 I L --
4 -COLORSHOP
(MEZZANINE)
0 WASTEWATER PIT
EXTRACTION
r DRYING
SHEARING 8 INSPECTION
FIGURE 1-2. PLANT LAYOUT AT MILL C-2.
A-6

OVERALL MASS AND ENERGY BALANCES
Water and Wastewater Volumes and Characteristics Mill C-2 purchases city water and passes it through a water
softener prior to use. The characteristics of this softened city water are presented in Table 1-1.
Water use at Mill C-2 during the sampling period was 5,716,100
gallons per week. Mill C-2 is on a five-day week, so water use averages approximately 1,143,000 gallons per working day. Making the simplifying assumption that no water is used between the last production shift on
Friday and the first production shift on Monday, the following are estimated or measured workday flows for identified water use operations.
Operation Water Use Discharge gp d
Boiler Ash Pit Water Softener Sanitary Backcoating Noncontact Cooling
Extractioil Beck Dyeing Miscellaneous
144,000 5,000
21,500 5,000
6,500 6,000
936,000 19,000
10,000 5,000
21,500 5,000
6,500 12,000
930,000 19,000
Total 1,143,000 1,009,000
The overall water balance is illustrated in Figure 1-3.
As can be seen, most of the wastewater is generated from the piece dyeing becks. Three to five batches are run daily through each beck; the average beck size is 6,925 gallons. As noted previously, discharges from a beck during a batch consist of a partial dyebath dump during cooling as cold city water displaces dyebath water, a diluted dyebath dump, and a rinse water dump. Flows associated with a typical batch are estimated at 6,500 gallons during dyebath displacement, 6,795
gallons during the dilute dyebath dump (some water remains in carpet) and 6,925 gallons during the rinse water dump for a total discharge per batch of 20,220 gallons. The dyebath displacement flow given above is
A- 6

TABLE 1-1 WATER QUALITY FOR SOURCE WATER
Constituent
PH Temperature (OF)
Color (ADMI) BOD COD TDS TSS TS Turbidity (NTU) Phenolics Chloride Alkalinity Oil h Grease Calcium Magnesium Sodium Total Phosphorus
*Sampled on April 14, 1982.
Concentration (mg/l)"
7.2
68
6
6.2
23
130 1
130 < 0.1 C0.05
6.9
90
13 0.25 0.12 0.96
0 . 0 4
A- 7

LEGEND -WATER
WASTEWATER _-.. _ _ --- DUILtH , STEAM -..-
CITY WATER 1.143,OOO gpd rLc SOFTENING
I I I I I I I I I I I I
-STEAM BOILER ..-.. I
BLOWDOWN '1
I. I I
'-- ----- -- 10,000 gpd COOLINQ
WATER
I
I I
OVERFLOW J ------ ASH PITS bik 5,000 gpd
DY ElNQ
I 930.000 gpd
I 8,000 gpd I I
---Dl I
EXTRACTION - - - - 1,000 t gpd 12,000 gpd
'(.
I SCREENINQ 1 r , I
MISCELLANEOUS -_-_-- 19,000 gpd
I I ONCONTACT
BACK COATING ------ W O O ePd 7
I
BACKWASH RINSE I 21,600 gpd -4
c TO SEWER
1,008,000 gpd FIGURE 1-3 WATER USE AND WASTEWATER DISCHARGE
A- 8

L
larger than the flow estimated by mill personnel. It was calculated based on random temperature measurements during the sampling period that showed an average temperature reduction of 64'F for the dyebaths. Extra cooling water was being used to cool the dyebaths well below 150'F to an average temperature of 114°F.
Dyehouse wastes are screened for lint removal before passing into a sump. In this pit, they mix with boiler plant and water softener wastewater. This wastewater is then pumped downflow through another screen before combining with sanitary wastes and other mill wastewaters for discharge to the municipal wastewater treatment plant.
Wastewater samples were collected and analyzed from the becks and effluent locations. Conventional and nonconventional textile pollutant results for the dyebath before and after dilution, rinse water, dyehouse wastes prior to the first screen, and combined wastes after the first screen are presented in Table 1-2. Daily mass loadings of these pollutants are listed in Table 1-3 . Other wastewater constituents that affect recycle are discussed below under the appropriate recycle technologies.
Energy Energy requirements at Mill C-2 are met using coal and
electricity. Steam for the dye becks and other needs is provided by a conventional coal-fired boiler plant. Electricity is used for machinery operation and lighting. No heat exchangers are present at this facility.
Materials Based on records during the sampling period, Mill C - 2
processes over 40 batches of carpet most weekdays, with slightly higher production on Mondays and significantly lower production on Fridays. The average carpet face yarn weight per batch is 1,524 lbs.
EVALUATION OF RF,CYCLE/REUSE TECHNOLOGIES The recyclejreuse technologies applicable to Mill C-2 that are
evaluted in this report are the following:
A- 9

TABLE 1-2 WASTEWATER CHARACTERISTICS
Wastewater Source Batch Concentrations (mg/l) or Date BOD5 COD TSS Phenolics PH
Dyebath Prior to Dilution 1 520 3,000 14 <.050 7.7 2 41 2,300 4 < .050 7 .3 3 470 3,300 8 .071 9.0 4 810 3,300 7 .530 9 . 1 5 850 3,000 10 .050 7 .8 6 1,390 4,530 6 .050 8 . 8 _ _ Average 680 3,240 8 .130
Dilute (Cooled) Dyebath 1 280 1,900 8 .180 7.9 2 79 950 < 1 <.050 7 . 4 3 430 1,600 < 1 < .050 8.8 4 340 1,560 2 <.050 8.3 5 520 1,830 8 < .050 7.8 6 460 1,250 3 .380 8 .3 _ _ Average 350 1,520 4 .130
Dye Beck Rinsewater
Final Effluent”
1 40 760 6 <. 050 7.9 2 11 230 < 1 .560 7.6 3 80 270 < 1 .240 8 . 1 4 180 270 2 .540 8.0 5 180 430 2 <. 050 7 .8 6 29 200 2 .230 8.0 _ _ Average 87 360 2 .280
4 / 1 3 / 8 2 270 750 18 <.050 7 . 8 4 / 1 4 / 8 2 340 650 8 f190 7 . 3 41 15 /82 320 790 2 .064 7 . 5 4 / 1 6 / 8 2 320 720 13 < .050 7 . 6 4 / 2 0 / 8 2 280 700 10 < .050 7.6 Average 310 720 10 .080 _ _
* Samples of 4 / 1 3 and 4 / 1 4 from dyehouse discharge prior to first screen. Other samples from pit.

*
TABLE 1-3
POLLUTANT LOADINGS
Flow BOD COD TSS Phenolics Wastewater Source gal/day % Total lb/day %= lb/day %Total lb/day % Total lb/day %Total
Dyebath 299,000 3 1 1,700 68 8,080 138 20 24 0.32 49
Dilute Dyebath 312,500 32 9 10 36 3,960 67 10 12 0.34 52
Rinsewater 318,500 33 230 9 960 16 5 6 0.74 114 3; -- 0.75 -- 47 _ _ (7,130) _ _ 48,000 5 ( 3 4 0 )
r r Other"
Final Effluent 978,000 100 2,500 100 5,870 100 82 100 0.65 100
$c Miscellaneous streams such as boiler, ash pit, water softener, extraction, etc., plus unaccounted for balance.

1. 2 .
3. 4 .
5. Diluted dyebath wastewater - alternative cooling with heat
Dyehouse wastewater - chlorine oxidation f o r decolorization. Dyehouse wastewater - activated carbon f o r decolorization. Exhausted dyebath wastewater - reconstitution. Tighter control of water used for cooling.
transfer coils to enable water use reduction.
.
A- 12

SECTION I1 CHLORINE OXIDATION OF DYEHOUSE WASTEWATER
DESCRIPTION OF MANUFACTURING PROCESS AND PROPOSED MODIFICATION Dyeing is performed at Mill C-2 from Sunday evening through
Friday afternoon. In a typical week, slightly over 200 batches would be dyed for a total face yarn weight of approximately 322,000 pounds. Dyehouse wastes during this period will be approximately 4,326,000
gallons. During mid-week, typical daily figures would be as follows: 70,000 pounds and 942,000 gpd. A schematic of the flows, production, and chemicals associated with a typical batch is presented in Figure 11-1. Table 11-1 presents the wastewater characteristics associated with these flows.
It is estimated that 92 percent of the dyehouse wastewater is associated with acid dyeing. However, there are frequently periods where no disperse dyeing is performed and at these times all dyehouse flows are comprised of acid dye wastewater. Thus, 942,000 gpd is the basis for examining design criteria and the economics of chlorine oxidation at this mill. Some scheduling, piping, and/or process control modifications will be needed in order to segregate the relatively infrequent disperse dye dumps from the acid dye wastewaters. Although disperse dyes are treatable by chlorine oxidation, a longer reaction time is required for decolorization than with acid dyes.
A comparison of the existing and revised process schematic incorporating chlorine oxidation is illustrated in Figure 11-2. An equalization tank is necessary prior to the chlorine oxidation system t o
enable full blending of all the treatable water and thus prevent sudden changes in the wastewater being treated. The wastewater next enters a
series of treatment tanks in which it is decolored by chlorine oxidation. Liquid caustic is used as a buffer to maintain the proper pH during oxidation, and sulfur dioxide gas is employed as an antichlor. Decolored water is next filtered to remove larger particulates and is stored briefly before being returned to the dyehouse.
A- 13

MSP, 20 I b a W, 161ba ANTIFOAh4.13lba
SOFlENlNQ AQENT. 3ba AeNT. 4 ma
r B026g.l.
! I r BMMopL
1 I r 6026gaL
r l a w I
I I I
i i I I
, I ------- WATER IN mowci
RINSING CARPET
.;;>+[*I COOLING I 130gal - To - ORYHQ EXTRACTOR
I I I I I I I I I I
f
I I
amgal I I
I BWO!3al; B796gaLl I B@26lgsl
I
--1 I
r B026g.l.
! I 1 I r 6026gaL
r l a w I
I I I
I I
, I ------- WATER IN mowci
RINSING CARPET
130gal COOLING
To - ORYHQ EXTRACTOR
I I I I I I I I I I
f
I I
amgal I I
I BWO!3al; B796gaLl I B@26lgsl
I
--1 I
-e.- CHEMICALS ---- WATER A M WASTEWATER PRODUCT
FIGURE E-1. FLOWS WITH TYPICAL DYEING CYCLE
A-I4

TABLE 11-1 DYE WASTEWATER CHARACTERIZATION
Parameter
Average Concentrations (mg/l) Dilute Final
Dyebath Dyebath Rinsewater Effluent
pH (median) Temperature [OF ("C)] BOD
COD TS TDS TSS Chloride Hardness (as CaCO ) Oil & Grease Phenolics Total Phosphorus Turbidity (NTU) Color (ADMI) Alkalinity (as CaC03) Total Carbon (%)
Fluoride MBAS (as LAS)
Conductivity (umhos/cm) Sulfate (as SO4) Calcium Magnesium Sodium
3
8.3 178 (81)
680 3,240 1,990 1,500
8
21 0 63
.130 110 60
1,440 210 -- --
0.60 0.53 3.7
8.1 114 (46)
350 1,520 980 740 4 13
50 ,130 62 46 690 150 -- --
0.36 0.32 2 . 2
8.0
75 (24) 87 360 .320 250
2 7.0
22 .280
29 14 520 100 -- -- -- -- -- 0.21 0.14 1.3
7.6 105 (41) 310 720 590 470 10 56 16 110
.os0
23 31 430 97 0.34 0.14 7
310 ' 7.2
4 1.7 26
Selected metals were also analyzed in the wastewater from one final effluent sample and the results were as follows: As - <0.005 mg/l; Cd - <0.1 m g / l ; C r - < 0.1 mg/l; Cu - <0.1 mg/l; Fe - 0.38 mg/l; Pb - <0.1 mg/l; Ni - < 0.1 mg/l; Zn - < 0.1 mg/l; K - 1.8 mg/l; Sn - <1.0 mg/l; A1 - 0.50 mg/ l .
A-15

EXISTINQ
> DYEHOUSE CITY WATER
842,000 QPD
OTHER
1,008,000 Q% '
BOILER PLANT WASTES
30,600 QPD WASTES 38,600 QPD I I
CITY WATER
187.000 QPD DYEHOUSE
- SCREEN
2 5-
REVISED
RECIRCULATION 766.000 QPD
EQUALIZATION CHLORINE OXIDATION
BOILER WASTES 30.600 QPD
I
BLOWDOWN I 187.000 GPO
OTHER PLANT WASTES 30.600 GPD
TO SEWER 264,000 QPD
FIGURE II -2 COMPARISON OF EXISTING AND REVISED DYEHOUSE WASTEWATER TREATMENT SYSTEMS EMPLOYINQ CHLORINE OXIDATION
A - I 6

.^
TECHNICAL FEASIBILITY AM) DESIGN CRITERIA
Literature and Previous Applications Investigations by Perkins, et al. (reference l ) , and Textile
Systems, Inc'. (TSI) have demonstrated that acid dyes can be decolored by chemical oxidation. Both ozone and chlorine have been successful in producing a water suitable for reuse in dyeing, and test dyeings over a series of reuse applications have been acceptable.
Oxidation has been shown to decrease the molecular weight of dye molecules by attacking amide and other molecular linkages, thereby destroying chromophoric groups and decoloring the wastewater.
Thus far, only oxidation by chlorine has been employed in full-scale applications for dye wastewater decolorization, and this has been primarily for acid dyes. costs of generation, practicality, and safety hazards, but it may become more competitive as improvements are made.
Ozone has not been applied because of
A more detailed summary of the research and applications to date is found in Volume 1.
Bench Scale Results Bench scale chlorine decolorization tests were performed on
two dye wastes, two rinse water wastes, and all five final effluent samples. effluent samples were observed to decolor substantially at a dose of 50
mgll chlorine, but retained a straw yellow color that remained even at a chlorine dose of 100 mgfl. individual becks did not provide conclusive results.
Table 11-2 presents a summary of the results. The final
Decoloring of dyebath and rinse waters from
Based on these results, it appears that the combined dyeing wastewater (final effluent except for boiler wastes and other miscellaneous uses) will decolor at a chlorine dose of 50 mg/l. residual yellow color should not normally interface with dyeing, according to TSI research, but this should be investigated before proceeding further with this recycle technology.
The
A-17

TABLE 11-2 RESULTS OF BENCH-SCALE
DYEBATH CHLORINATION TESTS
Wastewater Source Date - Dyebath Dyebath Rinse Rinse F i n a l E f f l u e n t F i n a l E f f l u e n t F i n a l E f f l u e n t F i n a l E f f l u e n t F i n a l E f f l u e n t
4 / 1 4 / 8 2 4 / 1 4 4 / 1 4 4 / 1 4 4 / 1 3 4 / 1 4 4 /15 4 /16 4 /20
ADMI Color I n i t i a l F ina l”
990 3,800
220 540 820 380 680 720 790
1,400 2,600
200 470 280 270 530 350 290
;k F i n a l c o l o r a f t e r 50 mg/l c h l o r i n e dose and 15-minute r e a c t i o n t ime.
A-18

Technical Design Criteria TSI has a patent covering the decolorization of textile dye
wastes by chlorination. The criteria developed in previous investigations indicate a chlorine dose of 50 mg/l applied for about ten minutes to be adequate for decolorization of acid dye wastewater. Liquid caustic is used to maintain the pH at approximately 5.5. Sulfur dioxide is used as an antichlor to control residual chlorine.
An equalization tank providing approximately 30,000 gallons storage (one hour) prior to the treatment system is necessary. Using as a basis an existing system that treats similar wastes, the treatment system should be sized at one hour's flow. TSI has developed a series of standard treatment units employing this technology. For Mill C-2 with a flow of 755,000 gpd (524 gpm), the closest standard size exceeding this flow is 750 gpm. This provides a hydraulic safety factor of 1.4. Storage capacity f o r return to the mill is equal to the volume anticipated in two hours of average flow, i.e., 60,000 gallons.
Design criteria are summarized in Table 11-3.
ECONOMIC FEASIBILITY Cost savings are realized in the areas of water use,
wastewater discharge, and auxiliary chemical use. In addition to capital costs, additional operating costs will be encountered both for labor and chemicals for the oxidation/recycle process.
Due to the low average dyehouse wastewater temperature (105°F) experienced at this mill, it is doubtful that energy savings due to this system will be significant. Energy savings would become significant if hot dyebath wastewater were a larger proportion of the total flow.
Table 11-4 presents an analysis of the annual cost savings realized through dyebath oxidation and recycle. The basis of these costs and savings is as follows:
water supply at $ 0 . 4 5 / 1 , 0 0 0 gallons. sewer use charges of $0.34/1,000 gallons. auxiliary (dyeing) chemical costs of $O.O764/sq yd of carpet.
'
A-I9

treatment chemical costs: chlorine at $0.08/lb caustic at $0.27/lb sulfur dioxide at $0.15/lb
annual labor requirement is 4 man-years. water use savings are 755,000 gpd (80 percent). auxiliary chemical savings are 50 percent. treatment chemical requirements are as given in Table 11-3.
' O
O
O dyehouse operates 250 dayslyear. .
The estimated capital cost (June 1982) of an oxidation recycle system f o r this mill is approximately $1.1 million, including costs for the reaction and storage tanks, chemical feed and control systems, piping, pumps, electrical service, and engineering costs. The resulting payback period is about three years based on annual operating savings of nearly $350,000.
ENVIRONMENTAL BENEFITS The recirculation of 755,000 gpd as a result of chlorine
oxidation would reduce the mill's wastewater discharge by approximately 75 percent. Since dye wastes are such a predominant portion of the discharge at this mill, reductions in pollutant loading are expected to correlate fairly closely to the reduction in hydraulic loading. Energy usage will be cut by only a minor amount, unless the volume of water used to cool and rinse carpet in the becks is significantly reduced.
CONCLUSIONS O The literature and current full-scale operations indicate that
chlorine oxidation to enable recycle should be amenable to the dye wastewaters at this plant.
O Additional testing should be performed to confirm that decolored dye wastewater can be reused without adversely affecting the quality of the dyeing.
A-20

Oxidation Reaction Time
Chlorine Dose
Reaction pH Caustic Feed
Dechlorination Sulfur Dioxide Dose
Reaction Time
TABLE 11-3 DESIGN CRITERIA
DYEBATH OXIDATION/RECYCLE
Storage Capacity
Hydraulic Flow (average)
Design Flow
minutes
mg/l lblday
mg/ 1 lb/day
mgl 1 lb/day minutes
gallons hours at average flow
10
50
315 5.5 90
565
50
315 5
60,000
2
525
0.75
750
A- 21

TABLE 11-4 ECONOMICS
DYEBATH OXIDATION
Annual Operating Costs
Oxidation Process Chemicals Oxidation Process Labor Oxidation Process Maintenance
Total
Annual Savings
Water Supply Sewer Use Charges Auxiliary Chemicals
\ Energy (steam savings) Total
Capital Cost
Equalization and Chlorine Oxidation
$ 56,250
60,000
25,000
$141,250
$ 84,900
64,200
341,900
insignificant $491,000
Payback
Payback is estimated at approximately 3 years.
$1,067,000
A- 22

0 The economics of chlorine oxidation appear marginal at this mill due to the high capital costs.
Potential formation of chlorinated organics as a result of treatment needs to be studied.
O An approach for segregating the small amount of disperse dye wastes from the acid dye wastes needs to be developed. Perhaps disperse dyeing could be performed in one beck that is piped to bypass the chlorine oxidation treatmentfrecycle system.
A-23

SECTION I11 CARBON ADSORPTION TREATMENT OF DYEHOUSE WASTEWATER
DESCRIPTION OF MANUFACTURING PROCESS AND PROPOSED MODIFICATION A description of the dyeing operation at Mill C-2 has been
presented previously. In addition, dyehouse flows and wastewater characteristics were detailed in the discussion of chlorine oxidation. The dyehouse flow of 942,000 gpd presented there is used as the basis for examining design criteria and the economics of activated carbon adsorption at this mill. Activated carbon has been experimentally shown to treat both acid and disperse dye wastes, and hence there is no need to segregate the minor disperse dye flow from acid dye wastes under this technology alternative.
A comparison of the existing and revised process schematic
incorporating activated carbon treatment is shown in Figure 111-1. Following screening for lint removal, an equalization tank is necessary to smooth out flow variations. Dual media filtration is employed prior to activated carbon treatment to remove any suspended solids that might clog the activated carbon columns. In order to avoid a build-up of impurities in the treated wastewater and provide water for backwashing the filtration and adsorption units, approximately 10 percent fresh water is used in the dyehouse daily.
TECHNICAL FEASIBILITY AND DESIGN CRITERIA
Literature and Previous Applications M. M. Stark, B. M. Lalli, and J. L. Rizzo (reference Z), as
well as others, have authored articles discussing investigations into the reuse of textile dye wastewaters through treatment with activated carbon. These studies have shown that both acid and disperse dye wastewaters are treatable in carbon adsorption systems. In one study of 13 textile manufacturers, a filtration/adsorption process using granular activated carbon achieved a median TOC removal of 94 percent and median color reductions of 98 percent 0.1). units and 100 percent APHA units. In addition, a 0.5-mgd moving bed carbon adsorber system has been used to treat carpet dyeing rinsewater at Stephen Leedom Carpet Co. in
A-24

EXISTING
CITY WATER
942.000 QPD *
OTHER
SEWER DYEHOUSE
BOILER PLANT WASTES WASTES
30.600 QPD 36,600 GPO
. CITY WATER 100,000 QPD & DYEHOUSE EQUALIZATION
STORAGE
RECIRCULATION 842.000 QPD
ACTIVATED
ABSORPTION CARBON FILTRATION
BACKWASH
I
TO SEWER 197,oao 0
FIGUREIU-*. COMPARISON OF EXISTING AND REVISED DYEHOUSE WASTEWATER TREATMENT SYSTEMS EMPLOYING ACTIVATED CARBON ABSORPTION
A-26

Southampton, PA; an 86,000-gpd fixed bed adsorber has been used to treat dyehouse wastewater at Harding Carpets in Collingwood, Ontario; and a 60,000 gpd pulsed bed adsorber has been used to enable reuse of rinse water from dyebecks at Westmill Carpets in Kelowna, British Columbia. These and other studies have shown the technical feasibility of using activated carbon to decolor textile dyeing wastewater.
Bench-scale testing of activated carbon to enable reuse of dye wastewaters at Mill C-2 was not performed. It was thought that if activated carbon treatment was shown to be economically feasible at this mill, based on a general preliminary assessment, more detailed design criteria could be developed at a later date based on extensive bench- or pilot-scale testing.
Technical Design Criteria The revised treatment system for this mill is sized at 1 mgd
to provide a small safety factor above the design average 848,000 gpd flow.
Due to rather limited land area available for wastewater treatment at this site, a large equalization basin cannot be employed at this site. Thus, a smaller 40,000-gallon tank providing approximately one hour of storage capacity is employed to partially balance flow and water quality fluctuations.
Filtration is considered to be necessary prior to carbon adsorption to insure a higher quality influent by removing suspended solids. This minimizes operational problems and leads to longer carbon life with less frequent backwashing. Design criteria shown in Table 111-1 are those that are typical of dual-media gravity filter operation.
Activated carbon enables water reuse by adsorbing soluble dyes and hence greatly reducing color in dyehouse wastewater. For a system of this size, it is usually not economical to regenerate on-site the spent carbon, and hence fresh carbon is used for makeup. Spent carbon may either be disposed of o r regenerated offsite. Table 111-1 presents additional design criteria.
A-26

TABLE 111-1 DESIGN CRITERIA CARBON ADSORPTION
Equalization
Capacity Detention Time
Filtration
Type Media Filtration Rate Run Length Backwash Period Backwash Rate TDH
Activated Carbon Adsorption
Type Carbon Hydraulic Load Run Length Backwash Period Backwash Rate Headloss Fresh Carbon Dosage Contact Time
Return Water Storage
Capacity Supply (average water use)
gallons hours
dual media gravity anthracite and sand
hours minutes
ft
gpmfsq ft
gpmfsq ft
downflow pressure mesh size
hours minutes
ft lb/MG
minutes
gpmlsq ft
gpmfsq ft
gallons hours
40,000 1
-- 4 12 15 15 ,14
-- 8 to 30 -
I 24 15 18 37
500 30
250,000 6
A-27

ECONOMIC FEASIBILITY Substantial cost savings in the areas of water use and
wastewater discharge are realized through recycle. Only minor energy savings are envisioned. Auxiliary chemical savings are difficult to quantify without pilot-testing, but with the possible exteption of MSP and TSP, they are expected to be negligible.
Table 111-2 presents an analysis of the economics of activated carbon at this mill. For the purposes of this analysis, it is assumed that no energy savings will be realized due to additional electrical requirements for the treatment system, and that MSP and TSP requirements will be reduced by 50 percent. Other bases used in this analysis follow:
0
0
0
0
0
0
0
0
water supply at $0.45/1,000 gal. sewer use charges of $0.34/1,000 gal. MSP/TSP costs of $O.O19/sq. yd. carpet water use savings are 842,000 gpd activated carbon at $0.75/lb 6,000 manhourslyr required for operation of treatment system dyehouse operates 250 days/year design criteria as presented in Table 111-1.
A s can be seen from Table 111-2, the estimated capital cost of the subject treatment system is approximately $2 million. Even if pre-filtration is assumed to be unnecessary, a capital cost outlay of nearly $1.3 million is required. Regardless of which activated carbon treatment system sequence is selected, annual operation and maintenance costs exceed annual savings. Hence, activated carbon adsorption presently has net operating costs at this mill, and no payback will be realized.
ENVIRONMENTAL BENEFITS The recirculation of 848,000 gpd as a result of carbon
adsorption would reduce the mill's wastewater discharge by over 80 percent. Reductions in pollutant loadings will be somewhat smaller
A- 28

TABLE 111-2 ECONOMICS
CARBON ADSORPTION
Annual Operation and Maintenance Costs
Equalization Dual Media Filtration Activated Carbon Adsorption
$ 0 39,000 282,000
Total $32 1,000 Total without Filtration $282,000
Annual Savings
Water Supply $ 94,700 Sewer Use Charges 71,600 Auxiliary Chemicals (MSP and TSP) 85,000 Energy 0
Total $251,300
Capital Costs
With Filtration
Equalization (40,000 gal) $ 25,000 Dual Media Filtration 466,000 Activated Carbon Adsorption 621,000 Water Storage (250,000 gal) 132,000 Non-Component Costs (Piping, Electrical, etc.) 348,000
Engineering and Construction Supervision 239,000
Contingencies 239,000
Total Capital Cost $2,070,000
Payback
Without Filtration
$ 25,000
621,000 132,000
218,000
--
149,000 149,000
$1,294,000
Even if pilot-scale testing shows that pre-filtration is unnecessary, activated carbon adsorption treatment presents Mill C-2 with net operating costs.
A-29

because of the discharge of concentrated backwash water to the sewer. Savings in energy will be small due to substantial cooling of the wastewater during treatment and the electrical requirement of treatment system operation.
CONCLUSIONS The literature and previous operating experience elsewhere
indicate that activated carbon adsorption should provide a treated wastewater of quality sufficient for reuse at this mill.
O Land area limitations at this mill may not allow sufficient space for proper design of the treatment system. I n particular, if greater equalization capacity to insure efficient operation of filtration and adsorption units is needed, the treatment system would need to be placed beyond current property lines.
O Activated carbon treatment for water reuse, either with or without prefiltration, does not appear cost effective. Annual operating costs exceed anticipated annual savings, and, therefore, there is no payback on the cost of the treatment system.
Activated carbon adsorption is an expensive treatment to install and operate. At present it does not appear economically feasible in the textile industry for most wastewater treatment and reuse applications, unless there is some critical and unusual factor, e.g., shortage of available water, restrictive limitation on allowable discharge volume o r refractory constituents, etc. However, barring any such restrictive circumstances, there are insufficient savings to make it cost effective.
Activated carbon is very effective at removing many constituents from wastewater. Hence, it often does not allow for chemical recovery and may be "overkill" in terms of recycle technology at a plant with only one major source of wastewater.
A-30

SECTION IV RECONSTITUTION OF DYEBATH WASTEWATER
DESCRIPTION OF MANUFACTURING PROCESS AND PROPOSED MODIFICATION A description of the dyeing operation at Mill C-2 was
presented in Section I. Additional details and information on chemical usage, flows, and wastewater characteristics was provided in Section 11. Accordingly, this information is not repeated here. Figure IV-1 can be compared with Figure 11-1 to observe the differences between the existing dyeing operation and the revised dyeing operation employing reconstitution. Due to the small amount of disperse dyeing performed at this mill, it is probably worthwhile to reconstitute only acid dyebaths here.
Figure IV-1 shows that an idealized dyebeck of 6,925 gallons has been used in the analysis of dyebath reconstitution that follows As has been previously noted, upon completion of dyeing the dyebath is cooled by displacement with city water. For reconstitution, it is assumed that the'first 6,925 gallons discharged after dyeing from the beck by displacement followed by dumping is pumped to an elevated and insulated holding tank. At this point, the position of appropriate valves would be reversed so that the remainder of the cooling water and the rinse water could flow to the sewer. While the dyed carpet was being removed from the beck and the next one was being introduced, the reclaimed water in the storage tank would be analyzed spectrophotometrically to determine the appropriate amounts of dyes to add for the next batch. Auxiliary chemical makeup amounts could be calculated or a standard amount added to each batch based on operating experience. Once the appropriate quantities of dyes and chemicals had been added to the reclaimed water in the holding tank, appropriate valve(s) could be opened and the reconstituted dyebath used to dye the next batch of carpet. Each dye machine would have its own holding tank. In this section it is estimated that the dyebath water is reconstituted four times before being discharged, i.e., five batches of carpet are
A-3 1

I I I I I I i I I I I I I I I
LEVELlNQ AQENT. 30lbS. (748.3 MSP , 20lbe.(75lbSS TSP. l6lbs. (661bs.I r-j ANTIFOAM. 13lbs. (321bs.l SEQUESTERINQ AQENT. 41ba. (10lbS.l SOFTENINQ AQENT. 31bs. (7.41bS.l ACID DYE, I l lbs. (SBlbS.) - 1
---- CHEMICALS ---- WATER AND WASTEWATER - PRODUCT
NUMBERS IN PARENTHESES ARE FOR 6 CYCLES
FlGURE1JI-I. REVISED DYEING CYCLE EMPLOYING RECONSTITUTION
A-32

dyed per reconstitution series. . go from light to dark colors as the series progresses. As much as possible, each series should
TECHNICAL FEASIBILITY AND DESIGN CRITERIA
Literature and Previous Applications A significant amount of research into the feasibility and
technical aspects of dyebath reconstitution has been performed by the School of Textile Engineering at the Georgia Institute of Technology (Georgia Tech). exhausted acid dyebaths used to dye nylon carpets. bench- and pilot-scale investigations indicate that commercially acceptable carpet dyeings can be achieved with reconstituted dyebaths. A more detailed discussion of dyebath reconstitution research and applications is found in Volume 1.
A fair amount of this research has focused on reuse of The results of these
Bench Scale Results No bench scale tests of dyebath reconstitution have been
performed at this mill. as to the technical feasibility of reconstitution here.
Company personnel are divided in their opinions
Mill C-2 has high standards of quality that every carpet dyed here must meet. As mentioned earlier, adds are the rule, rather than the exception, in order to get accurate color matches of carpet to standards. employ a red, a blue, and a yellow acid dye (i.e. the primary colors) to achieve a desired carpet color, only a specific one of a dozen o r more common dye shades of each color can be used to obtain the exact dyeing result required. Thus, although only three colors are used, the combinations of dyes used (exclusive of relative quantities) number in the hundreds. For this reason some feel that reconstitution is not feasible at this mill.
Mill personnel note that although most dyebaths normally
Others within this company feel that appropriate dyebaths for most carpets dyed at this mill can be prepared from a very small combination of dyes (again exclusive of relative quantities). It is possible, they say, to use a "pure red" dye, a "pure blue" dye, and a "pure yellow" dye to achieve any color desired.
A-33

At some point, bench- or pilot-scale testing will be required to resolve this question satisfactorily.
Technical Design Criteria In the absence of previous test results at this mill, all
further evaluations of dyebath reconstitution are based on a reconstitution series consisting of five dyeings per series. This number is chosen based on published information on the subject in two Georgia Tech reports.
Potential locations for the reconstitution holding tanks at this mill are shown in Figure IV-2. Piping in place of o r in addition to the open "channels" under the dyehouse floor, as well as lint screens and a pump, would be required to transport exhausted dyebaths to the holding tanks. Insulated and elevated holding tanks will enable retention of more heat value and eliminate the need for a return pump. Return piping and hardware will be necessary
A spectrophotometer will be required to enable analysis of the exhausted dyebath and permit proper formulation of the succeeding dyebath.
ECONOMIC FEASIBILITY Cost savings are realized in the areas of water use,
wastewater discharge, energy savings, and auxiliary chemical use. In addition to capital costs, additional operating costs will be encountered for dyebath pumping.
Table IV-1 presents an analysis of the economics of dyebath The basis of these costs and savings is as reconstitution at this mill.
follows: water,supply at $0.45/1000 gallons. sewer use charges of $0.34/1000 gallons. O
O auxiliary (dyeing) cbemlcal costs of $O.O764/sq yd of carpet. O 51% savings in auxiliary chemicals (exc. ElSP and TSP) per
series; 25% savlngs of MSP and TSP. energy costs of $3.07/1000 l b steam. bath used for dyeing 5 batches of carpet before being replaced.
O
A-3 4

WATER
BOILER-
dU
I COLOR SHOP
(MEZZANINE) J-
I
FIGUREZP-2. POTENTIAL RECONSTITUTION HOLDING TANK LOCATIONS
WASTEWATER PIT
I RECONSTITUTION HOLDING TANKS
EXTRACTION
RECONSTITUTION HOLDING TANKS
N DRYING
TUFTING
I I I I EACKCOATINQ I I I J I
A-35

TABLE IV-1 ECONOMICS
DYEBATH RECONSTITUTION"
Annual Operation and Maintenance Costs
Pumping to Elevated Storage Tanks $ 55 Other Operation and Maintenance Costs 2,285
Total $ 2,340
Annual Savings
Water Supply Sewer Use Charges Auxiliary Chemicals Energy
$ 1,870 1,410 15.856 1;945
Total $21,081
Capital Costs
Holding Tank $12,000
Piping, Valves 1,900
Engineering (at 15%) 3,300
Pump 3,800
Spectrophotometer 4,400 Lint Screen, Other Contingencies (at 15%) 3,300
Total $28,700
Payback
Payback is estimated at approximately 1% years.
* Assumes 1 beck, 6,500 gallons used for cooling per batch.
A-36

6,925 gallons of water returned to dyebath from holding tank at 120OF. average energy savings per reconstituted bath is 1056 l b
steam. O 6,500 gallons of water are used to cool dyebath by
displacement. twelve dyebath drops are reconstituted per machine per week. '
O operation and maintenance costs, except pumping, taken as 5 percent of capital costs. mill operates 50 weeks per year. The analysis is conducted for an "average" dyebeck, i.e. 6925
gallon capacity. It must be realized that the actual dyebecks at this mill are all slightly smaller o r larger than this idealized model. In addition, although this analysis is prepared for reconstitution at only one beck, it is likely that if reconstitution were feasible here, a number of becks would be appropriately modified.
O
An economic evaluation of the effect of employing 10 of the 13 becks at this mill for reconstitution is presented in Table IV-2. All other bases listed above remain the same with one exception: it is assumed that only 2,035 gallons of water are used for cooling the dyebath (see Section V), and as a result, auxiliary chemicals savings (except MSP and TSP) are 62 percent per series; MSP and TSP savings are 31 percent per series. (No credit is given to reconstitution for water savings in reducing cooling water from 6,500 gallons/batch to 2,035 gallons/batch.)
A s seen in Tables IV-1 and IV-2,, the payback period is estimated to range from approximately 1 to 1% years.
ENVIRONMENTAL BENEFITS I
The environmental benefits due to institution of reconstitution at Mill C-2 are dependent upon the number of dyebecks employed for reconstitution. For each dyebeck at which reconstitution regularly occurs, water use and wastewater discharge will be reduced by 83,100 gallons per week. Dyebath dumps appear to contribute at least
A-3 7

TABLE IV-2 ECONOMICS
DYEBATH RECONSTITUTION*
Annual Operation and Maintenance Costs
Pumping to Elevated Storage Tanks $ 550
Total $ 23,400 Other Operation and Maintenance Costs 22,850
Annual Savings
Water Supply Sewer Use Charges Auxiliary Chemicals Energy
Capital Costs
Holding Tanks (10) $120,000
Piping, Valves 19,000 Pumps (10) 38,000
Spectrophotometers (2) 8,800 Lint Screen, Other Contingencies (at 5%) 27,900 Engineering (at 15%) 27,900
Total $241,600
Payback
Payback is estimated at approximately 1.1 years.
J- Assumes 10 becks, 2,035 gallons used for cooling per batch.
A-38

two-thirds of the total plant BOD5 and COD discharge. Thus each dyebeck is responsible for approximately 5 percent of the total daily mill discharge of these pollutants. Assuming a 50 percent reduction in the amount of BOD and COD discharged from each beck where reconstitution is practiced gives a daily BOD reduction of 62 lb/beck and a daily COD reduction of 147 lb/beck. Steam requirements for each dyebeck employing reconstitution will be reduced by 12,700 lbs per week. These steam savings will reduce the load on the boilers, thereby reducing air pollutant emissions and reeulting in a secondary environmental benefit.
5
CONCLUSIONS ' Dyebath reconstitution has been shown to be feasible in acid
dyeing of nylon carpet on bench- and pilot-scale investigations. O Significant environmental benefits result from the institution
of dyebath reconstitution. With a payback period of 1 to 2 years, the economics of
reconstitution at this mill appear favorable. O The feasibility of performing most dyeing at this mill with
three to six different dyestuffs needs to be determined. ' If dyeing with a small number of dyestuffs is possible at this
mill, pilot-scale testing should be performed at the mill to determine the effect, if any, of reconstitution on product quality, and to refine projected auxiliary chemical savings.
A- 39

SECTION V COOLING WATER REQUIREMENTS
DESCRIPTION OF MANUFACTURING PROCESS AND PROPOSED MODIFICATION Mill C-2 uses city water to cool and displace dyebath
wastewater prior t o rinsing. As noted in Section I, the bath needs to be cooled only to 150'F prior to being dumped and the dyebeck refilled with cold (53'F) water. However, measurements during the sampling period showed the 178°F (avg) dyebath being cooled to 114'F (avg) with 68°F city water.
A complete-mix mathematical model (shown in Figure V-1) was used to calculate the water needed for cooling. Table V-1 presents the theoretical volumes of cooling water (based on this model) used to
achieve the degree of cooling noted in six actual dyeings monitored during the field investigation. It can be seen in Table V-1 that an average of 6,500 gallons of water is used per batch for cooling the dyebeck contents to 114'F prior to the rinse operation. However, using the model and calculating the amount of 68OF water theoretically required to reduce the temperature of 6,925 gallons of dyebath from 178OF to only 150°F, gives a volume of 2,035 gallons cooling water per batch. Thus, overcooling of the dyebeck contents is consuming an estimated 4,465 gallons of water per batch.
TECHNICAL FEASIBILITY AND DESIGN CRITERIA The mill clearly has the ability to monitor the temperature of
the dyebath and control the amount of water used for cooling. No
physical modifications are required to implement dyebath dumps consistently at 150°F. A change in operating procedures in the dyehouse or modifications to the program controlling the dyeing cycle should be sufficient.
ECONOMIC FEASIBILITY Expenses associated with reducing the water used for dyebath
cooling are minimal o r nil. Water savings per batch is 4,465 gallons. Based on 211 batches per week, and operation 50 weeks per year, annual water savings are projected to be 47.1 million gallons. This results in
A-40

Assumptions: - Complete M i x - Flow In = Flow Out - No Heat Loss to Atmosphere - Vb (Beck Volume) and T
are Constants (Temperature of City Water)
C
AV, Tb - AV, Tc 3 -VbAT, (Equation 1)
(Equation 2)
Where Vc = volume of cooling water added to cool beck T = temperature of water in beck Ti = initial temperature of dyebath Tf = final temperature of dyebath Vf = theoretical volume of city water used to cool
b
the dyebath from Ti to Tf
FIGURE V - I
BECK COOLINQ WATER MODEL
k 4 1

TABLE V-1 VOLUME OF WATER USED FOR DYEBATH COOLING
T r i a l VIJ+: 1 7.113 - Tc* - Ti?? Tf*
68 176 136 2 7;113 68 185 113 6; 800 3 7,113 68 185 104 8,400 4 7,375 68 167 99 8,600 5 7,113 68 171 136 2,900 6. 7,375 - 185 - 95 10,8oO - 68 F . -- 68 178 114 --
Average Volume of C i t y Water Used for Dyebath Cooling =
3,300 + 6,800 + 8,400 + 8,600 + 2,950 + + 6 x 6,925 gal/batch**+: 7,113 7,113 7,113 7,375 7,113 7,375
= 6,500 g a l / b a t c h
$c Vb, Vf i n g a l l o n s ; Tc, T i , Tf given i n OF +& Vf c a l c u l a t e d from Equat ion 5
&A& '-'I,' 6,925 g a l l o n s i s t h e average dyebeck volume a t t h i s m i l l
A- 42

a reduction in water use costs of $21,195 per year and sewer use charges of $16,014 per year. Additional minor savings are accrued since the mill will soften and pump less water.
ENVIRONMENTAL BENEFITS Conservation of water used to cool the dyebath as described
above will reduce the typical weekday water use from 1,143,000 gpd to 938,000 gpd. Wastewater discharge will fall to an estimated 804,000 gpd from the present 1,009,000 gpd. However pollutant loadings will remain unchanged and pollutant concentrations in the discharge will increase somewhat. Energy savings, although small, will be realized due to slightly lower pump operating costs.
CONCLUSIONS The mill is currently using and discharging excessive
quantities of water due to poor control of the dyebath cooling procedure.
O Savings of nearly $40,000 annually are available with no additional capital investment.
Significant reductions in the water used for dyebath cooling will affect the economics of the chlorine oxidation and activated carbon technology alternatives described in earlier sections. The economics of dyebath reconstitution will be unaffected.
A-43

SECTION VI NONCONTACT COOLING OF DYEBATH WATER
DESCRIPTION OF MANUFACTURING PROCESS AND PROPOSED MODIFICATION As has been noted previously, Mill C-2 uses city water to cool
and displace dyebath wastewater after dyeing has been satisfactorily completed. An alternative to cooling the dyebath by displacement would be heat transfer using cooling coils. Cold water would pass through coils within the beck. In so doing, the noncontact cooling water would be heated and could be stored for dyebath makeup water, while the dye- bath would be cooled.
TECHNICAL FEASIBILITY AND DESIGN CRITERIA Noncontact cooling water and heat exchange arrangements are
used in many industries and applications to achieve desired objectives such as product or waste cooling, product control, energy savings due to
preheating of incoming water, and combinations of these. Cooling of the dyebath wastewater at this mill presents such an opportunity.
However, as discussed in Section V, excessive water is used at Mill C-2 to achieve dyebath cooling. Therefore, a necessary first step in evaluating dyebath cooling alternatives is to assume that the dyebath needs to be cooled only to 150'F. Other design criteria are listed below.
a
a
O
dyebath is at 178OF prior to cooling city water is at 68°F
volume of dyebath to be cooled is 6,925 gallons maximum time allowed for cooling is 30 minutes allowable cooling system pressure drop is 25 psi O
' overall coefficient of heat transfer, U, taken as 80 BTU/hr sq ft OF 316 stainless steel serpentine double embossed panel coils, 16 gauge with a dimension of 143" x 43" to be used, providing 96.4 sq ft heat transfer surface area each

Within the above restrictions, 12 panels would be optimum as shown below.
Heat transfer surface area may be calculated using the following equation:
Q U x "LMTD" A = (Equation 6)
Where A = surface area available to transmit heat, sq ft. Q = total quantity of heat added o r extracted, BTU/hr U = overall coefficient of heat transfer, BTU/(hr sq ft OF)
LMTD = logarithmic mean temperature difference, OF To cool 6925 gallons of water 28'F in 30 minutes requires
extraction of heat, Q, at the rate of 3,234,252 BTU/hr. If 2518 gallons are used for cooling inside the coils, then "LMTD" is found to be 35OF, and the exit temperature of the noncontact cooling water is 145OF. Substituting the values given above for Q, U, and "LMTD" into Equation 6 gives a surface area requirement of 1155 sq ft. Twelve panels provide 1157 sq ft of surface area. The flow through each panel is consequently 2518 gallons - 30 minutes - 12 panels = 7 gpm, and the resulting pressure drop as this water passes through the coil is 23 psi.
A bank of 12 panels would have the dimensions of approximately 12' x 4' x 2.5'. However, only 0.5' is available in the front portion of the becks to accomodate the bank. The becks will have to be modified to accommodate sufficient heat transfer surface area; one possibility would be to position the steam line, dye line and baffle farther from the front wall of the beck.
Some observations can be made regarding tradeoffs in developing an appropriate "in-beck'' heat transfer arrangement. As the amount of time allowed for cooling is decreased, the term Q in Equation 6 becomes proportionally larger, and hence additional panels will be required for cooling. If flow through the panels is increased, the pressure drop also increases. For example doubling the flow through the panels from 7 gpm to 14 gpm results in a corresponding pressure drop increase from 23 psi to 85 psi. Conversely as flow through the panels decreases, the term "LMTD" in Equation 6 becomes smaller and hence required surface area becomes larger.
.,
A- 45

ECONOMIC FEASIBILITY Table VI-1 presents information on the costs and annual
savings of in-beck heat recovery. From an economic viewpoint, this water and energy reduction alternative is seen to be unattractive. There will be costs associated with cleaning and maintaining the plate coils, as well as operational costs associated with pumping. Even ignoring these costs that would cut into annual savings of $70,000, as well as any capital costs associated with modifying the dyebeck, it is seen that the relatively high capital costs for the heat transfer banks results in a long payback period.
ENVIRONMENTAL BENEFITS Annual water savings of approximately 21 million gallons could
be realized if the dyebaths are cooled using heat transfer coils. Energy savings equivalent to 17 million pounds of steam will also be realized. These water and energy savings assume that the 21 million gallons of 145OF water used in cooling the dyebecks can be used for boiler and dyebath makeup water. No reductions in pollutant discharge are obtained.
CONCLUSIONS The technology to implement in-situ cooling of dyebaths using
noncontact cooling water is readily available. A number of manu- facturers produce heat transfer coils in plate and other forms.
Where large volumes of water must be cooled relatively quickly, the number of heat transfer panel coils required make the total capital costs for this technology relatively high.
O At this mill there is insufficient unused volume in the beck to allow for the necessary number of heat transfer panels required.
A-46

TABLE V I - 1
ECONOMICS IN-BECK HEAT TRANSFER (13 Becks) .
Operation and Maintenance Costs
These costs were not developed. Operation and maintenance costs should be relatively low.
Annual Savings
Water Supply Sewer Use Charges Auxiliary Chemicals Energy
TOTAL
$ 9,700
$ 7,300
$ 0
$53,000
$70,000
Capital Costs
Twelve-panel heat transfer banks (13) $528,000
Insulated Holding Tank (25,000 gallons) 30,000
Pipes and valves 25,000
Engineering and Contingencies (at 10%) 58,000
TOTAL $641,000
Payback
Payback o f capital costs only, exclusive of interest or other costs, requires nearly ten years.
A- 41

REFERENCES
1. Perkins, W. S., J. F. Judkins, Jr., and W. D. Perry. "Renovation of Dyebath Water by Chlorination o r Ozonation," Textile Chemist and Colorist, Vol. 12, Nos. 8-10 (August-October, 1980), pp. 182-272.
2. Stark, M. M. and J. L. Rizzo. "Carbon Adsorption - Case Studies at Several Textile Plants," unpublished paper presented at Midwater Conference on Textile Wastewater and Air Pollution Control, January 23-25, 1974.
A- 48

SUMMARY
Mill W-3, a woven fabric finishing mill, conducts various fabric finishing processes that have been investigated for the potential applicability of wastewater recycle/reuse technologies. Figure 1 illus- trates the basic fabric finishing processes, summarizes the findings of this investigation, and identifies further research needs. Table 1 summarizes the projected savings, costs, and payback periods associated with wastewater recycle/reuse techniques considered at this mill.
The most promising recycle/reuse techniques at this mill are: Evaporation of mercerizing wastewater for caustic recovery and 1.
water recycle (in-place); 2 .
3 . Reuse of open width preparation range rinse water for open Reuse of excess mercerizing wastewater in desizing;
width scouring (complete countercurrent flow); 4 . Upgrading in-place coagulation/flotation facilities and opera-
ting them to recycle print wastewater for equipment cleaning; 5. 6.
Flow reduction in the print and color shop; and Direct water reuse and heat recovery in the soaphouse.
RECOMMENDATIONS It is recommended that the following techniques and research
needs be pursued for recycle/reuse of wastewater at this mill: 1. Bleachhouse Wastewater
a. Reuse of excess mercerizing wastewater at the desize washer and reuse of open width rinse water at the open width scour (complete counterflow) should be tested to determine effects on fabric quality and manufacturing processes.
b. A detailed investigation of piping, pumping, and storage requirements for direct reuse of mercerizing wastewater and open width rinse water should be conducted to establish capital costs more definitely.
c. Technical feasibility of ultrafiltration for size separa- tion/recovery should be investigated in more detail. In particular, more research is needed on the feasibility of segregating PVA-sized
,
B- ii

MILL SURVEY REPORT MILL W-3
WOVEN FABRIC PREPARATION AND PRINTING
B-i

Rope Range
DESIZING SCOURING BLEACHING MERCERIZING
t FINISHING Open Width Range
- SCOURING ~
Techniques Evaluated
Bleachhouse Wastewater Direct Reuse Measures
(Mercerizing to Desizing; Open Width Rinse to Open Width Scour)
b Y Ultrafiltration P. P.
Evaporation (In-place)
Print and Color Shop Wastewater Water Use Reduction Measures
Feasibility Technical Economic Data Needs
Feasible Promising Effect on Processing and Fabric Quality
Questionable Questionable Segregation of PVA-Sized Fabrics Desizing Efficiency Size Degradation Marketability of Recovered Size Effects of UF Permeate Recycle
Feasible (In-place)
Feasible
Coagulation/Elotation (Upgrading) Feasible (New) Feasible
Soaphouse Wastewater Direct Reuse and Heat Recovery Feasible
Promising --
Promising Current Water Use and Potential Reduction
Promising Effect on Equipment Cleaning Not Promising --
Promising Optimal Operating Conditions of Open Width Soapers
FIGURE 1

TABLE 1 SUMMARY OF ECONOMIC AND ENVIRONMENTAL
BENEFITS OF VARIOUS RECYCLE SCHEMES
Recycle/Reuse Scheme
Bleachhouse Evaporation
Caustic Recovery (In-Place)
Ultrafiltration W
I Size Separation 2
Direct Reuse
Print and Color Shop Flow Reduction & Direct Reuse
CoagulationfFlotation (upgrading) (new)
Soaphouse Direct Reuse and Heat Recovery
Annual Savings
$325,000
none to
$630,000
$ 49,500
$ 2,200
$ 49,000 (20,000)
$135,000"
Capital cost
$603,000
$615,000 to
$1,173,000
$ 24,000
-- $153,000 $376,000
$683,000
Payback (Years)
1.9
no payback
1 . 9 years to
0.5
Immediate
3.1 no payback
5.0"
Flow Reduction BOD Reduction a!!! % Total Ib/day % Total
222,000 15.9 1378 16.4 to to to to
282,000 20.1 3033 36 .1
174,000 12.4 -- --
63,000 4.5 _ _ _ _ 163,000 11.6 760 9.0 163,000 11.6 3360 40.0
230,000 16.4 -_ --
9: Does not include value for increase in productivity due to new soaper.

.
fabrics from other sizes, the effects of water reduction/reuse on desiz- ing efficiency, marketability of recovered size, and the effects of recycling the treated desizing wastewater on pollutant discharge, fabric quality, and manufacturing processes.
2. Print and Color Shop Wastewater a. Monitoring of water use should be conducted, and water
reduction measures should be implemented. Such measutes include employee education and incentives for conservation, and arrangement and selection of equipment for improved housekeeping. Direct reuse of drum washer wastewater, box and brush wash water, and floor cleaning water should be investigated in more detail.
b. Coagulation/flotation facilities should be upgraded and operation improved to implement recycle of treated wastewater for equip- ment cleaning. The reuse of the treated wastewater should be tested to determine effects on equipment cleaning.
3 . Soaphouse Wastewater a. Reuse of open width soaper spray wastewater at the back-
grey washer should be tested for any adverse effects on the backgrey washing process.
b. Optimal operating conditions for the open width soapers should be established to plan the details of direct reuse and heat recovery.
c. A detailed investigation of piping, pumping, and storage requirements for direct reuse and heat recovery should be conducted to establish capital costs more definitely.

TABLE OF CONTENTS
Summary . . . . . . . . . . . . Table of Contents . . . . . . .
. . ii
. . vi
I . INTRODUCTION . . . . . . . . . . . . . . . . . . . . . . . . 1 Facility Description . . . . . . . . . . . . . . . . . . 1
Manufacturing Processes . . . . . . . . . . . . . . . . 1
Overall Mass and Energy Balances . . . . . . . . . . . . 7
Evaluation of Recycle/Reuse Technologies . . . . . . . . 19
I1 . BLEACHHOUSE WASTEWATER . . . . . . . . . . . . . . . Description of Manufacturing Processes . . . . Description o f Applicable Recycle/Reuse Methods Technical Feasibility . . . . . . . . . . . . Economic Feasibility . . . . . . . . . . . . . Environmental Effects . . . . . . . . . . . . Conclusions . . . . . . . . . . . . . . . . . Evaporation of Mercerizing Wastewater . . . .
. . . . . 20
. . . . . 20 . . . . 28
. . . . . 33 . . . . . 36
. . . . . 37
. . . . . 41 . . . . . 42
I11 . PRINT & COLOR SHOP WASTEWATER . . . . . . . . . . . . . Description of Manufacturing Processes and Wastewater Pretreatment . . . . . . . . . . . . . . . . . . .
Description of Applicable Recycle/Reuse Methods . . Technical Feasibility . . . . . . . . . . . . . . Technical Design Criteria . . . . . . . . . . . . Economic Feasibility . . . . . . . . . . . . . . . Environmental Effects . . . . . . . . . . . . . . Conclusions . . . . . . . . . . . . . . . . . . .
46
. . . 46
. . . 53
. . . 57
. . . 60
. . . 61
. . . 64
. . . 64

TABLE OF CONTENTS (Continued)
* IV . SOAPHOUSE WASTEWATER . . . . . . . . . . . . . . . . . . . . . 65
Description of Manufacturing Processes . . . . . . . . . 65 Description of Applicable Recycle/Reuse Methods . . . . . 72 Technical Feasibility . . . . . . . . . . . . . . . . . . 75 Technical Design Criteria . . . . . . . . . . . . . . . . 78 Economic Feasibility . . . . . . . . . . . . . . . . . . 78 Environmental Effects . . . . . . . . . . . . . . . . . . 80 Conclusions . . . . . . . . . . . . . . . . . . . . . . . . 80
B-vii


SECTION I INTRODUCTION
FACILITY DESCRIPTION Mill W-3 is engaged in the preparation, printing, and
finishing of woven fabrics for wearing apparel. Total production during the field investigation averaged 300,000 yards per day, which is approximately equal to 85,000 pounds per day.
A large portion of the total production consists of all-cotton fabrics, and the remaining portion consists mainly of polyester/rayon blends. Polyesterjcotton, rayon, and rayonlcotton blends are processed occasionally.
MANIJFACTURING PROCESSES The mill performs a variety of wet processes to prepare,
print, and finish the incoming fabrics. These operations are illustrated on the schematic in Figure 1-1 and include desizing, scouring, bleaching, mercerizing, dyeing, printing, ageing, soaping, and final finishing.
Desizing, Scouring, and Bleaching The bleach house consists of an open-width range and a rope
range. The open-width range is used primarily for desizing/scouring of polyesterjrayon blends, thus processing a minor portion of the total mill production. The rope range is used for desizing, scouring, and bleaching of cotton or cotton blends, thus processing a major portion of total mill production.
The process sequence on the open-width range i s a singer, padder, four counterflow wash compartments, a steamer, and finally five counterflow wash compartments. Detergent is used on this range to remove emulsifiers, lubricants and some size materials such as water-soluble PVA and starch from the polyesterjrayon fabrics. The singer uses no water, while the padder sometimes discharges a small amount of warm water, about 4 to 5 gpm. Water enters the last compart-

FABRIC RECEIVING
+ ~
(ROPE RANGE)
-* 15oPOo GPO
- - + 120,000 GPD BLEACHING
(OPEN WIDTH RANGE)
130.000 GPD C -- SCOURINQIDESIZING
50.000 GPD C - -- MERCER1 I
WHITE FRAMES
$.
V I I
PRINTING 1 L+ 90.000 GPD 30.000 QPD+-
c
+
I L-* 100,000 GPD
AGEINQ
SOAPING --t 400.000 GPD LEGEND:
-PRODUCT FLOW -I- WASTEWATER
. . . . . . . . . PROCESS CHEMICALS
FINAL FINISHING --* 30,000 QPD + INSPECTING I PACKING I SHIPPINQ
FIQURE 1-1 MANUFACTURING PROCESSES
8-2

ment of the first washer at a temperature of 175OF and a flow of approximately 20 gpm, and counterflows through the four compartments and is discharged. After bypassing the steamer, the fabric passes through a five-compartment unit for rinsing. Water enters the fifth compartment of this unit at 175°F and 65 gpm and counterflows through the remaining four compartments to the drain.
The process sequence on the rope range is much more extensive than that on the open-width range. A sequence of eleven machines is used to perform desizing, scouring, and bleaching. The first four machines in the range are used to effect desizing; after passing through a singer, the fabric goes sequentially to a desize saturator, a J box, and a desize washer (Washer 1). No water is discharged from the singer, saturator, or J box, although water and sodium bromite are added to the saturator. Approximately 75 gpm of 120°F to 140'F water are added to the desize washer, and frequently an additional 25 gpm of hot, evaporator condensate from the mercerizing caustic recovery unit is also fed t o the washer. Thus, the discharge from this unit ranges from 75 gpm to 100 gpm. Size materials removed from the greige goods are primarily starch and PVA. Only very small amounts of CMC sized the greige goods are processed. Following desizing, the next four machines in this range are used for scouring. In order, the machines are a caustic saturator, a J box, and two washers (Washers 2 and 3 ) . The final four machines in the range, a peroxide saturator, a J box, and Washers 4 & 5 , are used for bleaching. Sodium hydroxide is added to the caustic saturator, while peroxide is added to the bleach saturator. There is no overflow or discharge from the saturators or J boxes. However, 90 gpm of 120°F to 140°F water enters Washer 5 , counterflows to Washer 4 , is pumped through a filter to Washer 3 , and is discharged from Washer 2. The fabric, upon removal from Washer 5, is ready for mercerizing or printing.
These operations are illustrated and discussed further in the section on recycle/reuse technologies involved with the bleachhouse.
Mercerizing and Caustic Recovery There are two identical mercerizing trains at the mill that
processsed about 180,000 yards of cotton fabric per day during the field investigations. Each train consists of a padder, caustic saturator,
B- 3

counterflow chain and spray washers, a recuperator, and a three- compartment counterflow washer. Some water is added to the padder and purchased (50% NaOH) o r recovered (35% NaOH) caustic is added to the saturator. Approximately 30-35 gpm of 120'F to 140°F water is fed countercurrent through the three compartments of the final washer; 15
gpm flows to the padder and is discharged to the drain while the remaining 15 gpm flows through the recuperator to the chain and spray washer. The discharge from the chain and spray washer is a weak ( 4 to 5% NaOH) solution that is pumped to the Zaremba caustic recovery unit along with 25% NaOH from the saturator overflow. The caustic saturators of the mercerizers experience a level rise in the system, thus causing the overflow.
As there are two mercerizing trains, approximately 30 gpm of washwater is pumped from the spray washers to the weak feed storage tanks associated with the caustic recovery system. From here the washwater flows into a double effect evaporator where the caustic strength is increased to 35% NaOH and piped to product storage. Wastewater (condensate) from the double effect evaporator is used in the rope range desize Washer 1. This Zaremba caustic recovery system has been in operation at the mill for ten years. The overall recovery rate for caustic is approximately 80 percent; in November, 1981, for example, the mill used 360,000 lbs of 100% caustic and recovered 304,000 lbs. Although the primary cost in caustic recovery is for steam, the overall savings through recovery of caustic are substantial.
This system is illustrated and discussed further in the section on recycle/reuse technologies involved with the bleachhouse.
D y e i n g
Dyeing is performed on an "as needed" basis at the mill to supplement the printing operation. During the field investigations, production ranged from zero to 63,000 yards per day and averaged about 40,000 yards per day.
The type of dyeing is also quite variable, depending on the requirements of the fabrics. Fiber reactive and azoic dyes are used on
cottons, and disperse dyes on polyester.
B- 4

Since t h e p rocess ing he re i s s o v a r i a b l e , t h i s a r e a i s n o t
inc luded i n any d i scuss ions of r ecyc le / r euse technologies .
P r i n t i n g
The p r i n t i n g ope ra t ion i s t h e h e a r t of t h i s m i l l , c o n s i s t i n g
of engraved r o l l e r p r i n t i n g on up t o 14 machines. R o l l e r p r i n t i n g
r e q u i r e s t h e p r e c i s e coord ina t ion of many moving p a r t s t o achieve a
q u a l i t y product . For each c o l o r be ing p r i n t e d on a f a b r i c , one engraved
r o l l e r i s r equ i r ed . Ten engraved r o l l e r s , and hence ten c o l o r s , a r e t h e
maximum t h a t can be used wi th a machine i n a g iven run. Color i s pumped
from a c o l o r k e t t l e t o a c o l o r pan ( t r a y ) . A f u r n i s h i n g r o l l (brush)
p a r t l y submerged i n t h e t r a y p i c k s up c o l o r and t r a n s f e r s it To an
engraved copper r o l l ; a s t a t i o n a r y doc to r b l ade removes excess dye from
t h e r o l l as it r o t a t e s immediately p r i o r t o t h e copper r o l l ' s c o n t a c t
w i th t h e f a b r i c . The f a b r i c i s p r i n t e d wi th t h e p a t t e r n on t h e engraved
copper r o l l a s it passes between t h i s r o l l and a d r i v e c y l i n d e r . A grey backing m a t e r i a l i s a l so pres sed between t h e s e two r o t a t i n g elements on
t h e c y l i n d e r s i d e of t h e p r i n t e d f a b r i c t o absorb excess c o l o r and
p reven t contaminat ion of the d r i v e c y l i n d e r .
The c o l o r shop i s t h e p o r t i o n of t h e m i l l where v a r i o u s dyes
and pigments a r e mixed and prepared f o r u se i n the p r i n t i n g machines.
A t some p o i n t i n t h e f u t u r e an automated color-mixing system may be
i n s t i t u t e d .
The pr imary use of water i n t h e p r i n t shop i s f o r equipment
c l ean ing . Two l a r g e bays a r e a v a i l a b l e f o r washing brushes , b l ades ,
t r a y s , and r o l l e r s . These i tems a r e removed from t h e p r i n t machines and
t aken t o one of t h e two sp ray booths t o be cleaned. A h igh p r e s s u r e
s t ream of water from a 1- o r 2- inch hose i s played on these removable
p r i n t machine p a r t s u n t i l a l l t r a c e s of c o l o r have been e l imina ted .
Addi t iona l water is used i n t h e p r i n t a r e a f o r hos ing down t h e p r i n t
machines and c l ean ing t h e c o l o r pumps by pumping water through them
whenever c o l o r s a r e changed. A l l t h e s e c l ean ing ope ra t ions i n t h e p r i n t
shop a r e a a r e performed manually; no c l ean ing equipment o r machines a r e
used. Each p r i n t machine has a d r a i n underneath t o c o l l e c t wastewater
B-5

from machine and pump cleaning. Water is.used in the color shop primarily for hosing down mixers and for cleaning color tubs in a drum washer.
Water use, wastewater characteristics, and potential for recycle/reuse are discussed in further detail in subsequent sections.
Ageing and Soaping A process called ageing is employed following printing to fix
and develop the colors for increased fastness to washing and sunlight. The fabric is aged using neutral o r acid steam o r heat. Soapers are employed after ageing to wash out unfixed dyes and pastes. The mill has one rope soaper, one new open-width soaper, and one backgrey washer. Another new open-width soaper is due to be on-line shortly". After passing through the soapers and dry cans, the fabric is packed in boxes.
The rope soaperk washes plain dye work and selected print work. It operated about 16 hours (two shifts) per day during the field investigation and processed about 120,000 yards per day. The rope soaper consists of four washers followed by dry cans; however, the fourth washer is frequently bypassed. Soap is added to Washers 1 and 2.
Hot water at 120°F to 160°F is added to Washer 1 at about 10 gpm, Washer 2 at about 60 gpm, and Washer 3 at about 60 gpm. An additional 30 gpm of cold water is added to Washer 3 . The unit is constructed to allow for counterflow from Washer 3 to Washer 2 , but counterflow is usually not employed.
Each new open-width soaper consists of two spray boxes followed by five washers before the fabric reaches the dry cans. The mill is experimenting to identify the optimum mode of operation in terms of water use and temperatures. During the field investigation one soaper was in operation, processing about 180,000 yards per day.
The primary mode of operation (Mode 1 ) of the open-width soaper consists of adding 15 gpm of cold water through each of the two spray boxes and 25 gpm of hot water counterflowed from Washer 5 to Washer 1. This mode is employed about 80 percent of the time.
7: Subsequent to the field investigation, the mill abandoned the rope soaper and replaced it with a second open-width soaper.

Mode 2 , which has been used about 20 percent of the time, consists of adding 15 gpm of cold water through the spray boxes, 25 gpm of hot water counterflowed from Washer 5 to Washer 3, and 20 gpm of hot water counterflowed from Washer 2 to Washer 1 . This has been used on
fabrics that have appeared more difficult t o wash because of greater amounts of excess color.
The backgrey washer is used to clean the fabric that passes between the printed fabric and drive cylinder in the roller printing operation prior to its reuse. The cloth passes through two washers and dry cans. Clean water at 120°F to 160'F enters Washer 2 at 20 to 50 gpm (average 25 gpm) and counterflows to Washer 1 prior to discharge. The water required for this operation need not be of as high quality as that in other processes since this fabric is used only to absorb dyes and pigments between the product cloth and printing machine cylinder.
This area is illustrated and discussed in more detail in the section on recylelreuse technologies involved with the soaphouse.
Final Finishing The finishing room applies special finishes to some of the
fabric after soaping and drying. The finishing generally requires a small quantity of high quality water to apply finishes such as lustre, embossing, wrinkle-resistance, shrinkage control, and others. A
relatively small quantity of water is used for equipment cleaning. Observations and discussions with mill personnel revealed that
this area of the mill does not have a significant potential for wastewater recyclelreuse, so it will not be discussed in further detail.
OVERALL MASS AND ENERGY BALANCES
Water Use and Characteristics Total water use at the mill averages about 1,500,000 gpd. The
major areas of water use are the bleach house with its processes of desizing, scouring, and bleaching (406,000 gpd); mercerizers (100,000 gpd); dyeing (33,000 gpd); print and color shop (200,000 gpd); soapers and backgrey washer (440,000 gpd); and final finishing (33,000 gpd) .
B- 7

Minor uses are for boiler makeup and utilities, acid ager scrubbers, the print wastewater pretreatment system (belt press for DAF sludge dewatering), and sanitary and general maintenance. The overall water balance is illustrated on Figures 1-2 and 1-3. Most of the water comes from a mill pond, with the exception of sanitary water, which is purchased from the local municipal system. Some of the pond water is preheated through the mill's turbine condenser and subsequently stored for warm water uses. The mill also employs heat exchangers to further heat incoming water with the heat of hot wastewater discharges from the bleach house and mercerizers.
Table 1-1 illustrates the quality of the incoming process water from the mill pond.
Wastewater Discharge and Characteristics The major sources of wastewater discharge are the processes
named as the major water users. Some losses are incurred due to water retention in the fabric after the bleach house and the soap house, evaporative losses, pipe leakage, and other housekeeping considerations. Suspected infiltration into the final effluent line makes up for some of
these losses, so the average final effluent discharge is about 1,400,000 gpd. The wastewater balance is illustrated in Figures 1-2 and 1-3.
Hot wastewater from the bleach house and mercerizers flows through a heat exchanger before discharge to the mill's pretreatment system in order to heat incoming process water. Mill personnel state that typically the bleachhouse wastewater enters at 152OF and heats the incoming fresh water (already preheated in the mill's turbine condensers) from llO°F to 132'F. The bleachhouse wastewater discharges at about 132OF.
A portion of the mercerizer wastewater is pumped to a Zaremba double-effect evaporator for caustic recovery. Only about half the wastewater flows through chain and spray washers, as described earlier, in order to yield an adequate caustic concentration for the recovery process. The operation and performance of this system are described in more detail in the section on recycle/reuse technologies. Wastewater samples were collected and analyzed from the major manufacturing
B- 8


. ,0 .143mgq OPEN WIDTH I 0 . 1 3 m y
SCOURIDESIZE
I I O.013mgd LOSS I I I
I ,-,-pq-, EXCHANQER mgd
, I El 0.4Smgd
T O SEWER (FIQURE 1-2)
I I
DESIZE
I I I
0.027mgd LOSS 2
i I CAUSTIC RECOVERY
I I I I I
. I I
0.016 mgd LOSS
0.508 mQd FROM POND WATER LEBEND (FIGURE 1-2)
1 WATER ----WASTEWATER
FIGURE 1-3 WATER USE AND WASTEWATER DISCHARGE.
BLEACHHOUSE
8-10

TABLE 1-1 POND WATER
Alkalinity (as CaC03) BOD COD TDS TSS Chloride Oil & Grease Pheno 1 i c s Turbidity (NTU) Color (ADMI) Hardness (as CaC03) Sodium Chromium Copper Iron Manganese Zinc
PH (SUI Temperature ( O F )
Concentration, mg/l
10
15
59
6 11
<0.01
0.55
14
20
17
< 0 . 1
< 0 . 1
0.23 < 0.1
<0.1
7.8
72
Source: Water sample taken May 18, 1982.

processes of desizing (rope range), scouringfbleaching (rope range), scouring/desizing (open width range), mercerizing, printing and color preparation, soaping, and of the mill's final effluent. The results for conventional and nonconventional textile pollutants are presented in Table 1-2 and discussed below. Table 1-3 presents pollutant loadings for the major wastewater streams. Table 1-4 presents results for all parameters analyzed in the final effluent. Other wastewater constituents that affect recycle are discussed below under the appropriate manufacturing processes.
Wastewater Pretreatment Discharge from the bleach house and mercerizers flows to a
0.6-million-gallon basin for neutralization with sulfuric acid. Sulfuric acid is added at a rate of 3,000 to 3,500 gallons per month. The neutralized wastewater joins other mill wastewater and is discharged to the municipal treatment system.
Discharge from the print and color shop is stored in a 0.6-million-gallon equalization basin and pumped subsequently to a dissolved air flotation (DAF) clarifier. Ferric chloride and polymer are added to coagulate the print and color wastewater and enable flotation of the solids. The float sludge is dewatered on a belt press, and the clarified effluent j o i n s other mill wastewater and is discharged to the municipal treatment system.
Samples were collected and analyzed from the DAF effluent, and results are presented in the discussion of DAF operation and performance in the section on recyclefreuse of print wastewater.
Energy Use and Types The major sources for energy at the mill are fuel oil, natural
gas, and electricity. Fuel o i l is used f o r space and water heating and cogeneration of electricity; natural gas is used for operation of dryers and curers; and electricity is used for lighting and machinery operation throughout the mill. Overall energy use at the mill in 1981 was 737,188 x 10 BTU per year; approximately 30 percent of all the energy is used f o r fabric preparation (desizing, scouring, bleaching, mercerizing). This results in an energy use of 36,000 BTU/lb of fabric, and the average cost is $5.14 per 10
6
6 BTU.

TABLE 1-2
WASTEWATER CHARACTERISTICS BLEACHHOUSE
Concentration (mg/l)
Wastewater Source Date - BOD - COD TSS - Phenolics pH (SU)
Rope Range
Desize 5/19/82 2,850 5,040 830 0 .14 - 5120182 3,500 5 ,600 790 0.06 6.2
5/21/82 1,520 3,450 490 <0.01 6.8
Avg . 2,620 4,700 700 0.07 -
Scour/Bleach 5/19/82 2,450 5,600 340 0.032 - 5120182 2,750 6,630 630 0.049 11.5
5/21/82 2,120 5,400 270 0 .13 11.7
Avg . 2,440 5,880 410 0.07 -
Open Width Prep. Range Desize/Scour 5/19/82 6,000 12,200 5,200 <0.01 -
5120182 2,400 8,900 1,110 0.032 6 .2
5 /2 i / a2 3,000 9,520 250 0.021 7.2
Avg . 3,800 10,210 2,190 0.021 -
Rinse 5/19/82 180 300 66 < 0.01 - 5120182 72 32 20 < 0.01 6 .4
5/21/82 120 160 10 < 0.01 6.5
Avg . 124 164 32 < 0 . 0 1 -
Mercerizer
Rinse 5/18/82 63 42 23 0.009 10 .4 5/19/82 22 54 10 < 0 . 0 1 11.0
5120182 44 62 30 0.0015 11.4
Avg . 43 53 21 0.007 -

TABLE 1-2 (continued) WASTEWATER CHARACTERISTICS
SOAPHOUSE
Concentration (mg/l) Wastewater Source __ Date TSS Phenolics pH (SU) COD BOD - - -
Rope Soaper” Wash 1 5/19/82 180 600 25 0.049 9 .3
Wash 2 5/19/82 36 42 8 < 0.01 8 . 5
Open Width Soaper Mode 1 - Spray 1 5/18/82 1,650 3,870 74 0.37 5.9
5/19/82 1,450 3,280 52 0 .24 5 .8
Avg . 1,550 3,580 63 0.30 -
Spray 2 5/18/82 950 2,220 55 0.21 5 . 9
5/19/82 550 1,550 56 0.16 5 . 9
Avg . 750 1,890 56 0.19 -
Wash 1 5/18/82 153 2,180 130 1.76 6 .3
5/19/82 700 1,780 80 0.53 6 .1
Avg . 430 1,980 105 1.15 -
Mode 2 - Spray 1 5/19/82 440 1,710 46 0.18 - Spray 2 5/19/82 220 600 40 0 .12 - Wash 1 5/19/82 560 1,450 64 0.41 - Wash 3 5/19/82 500 1,590 240 0.28 -
Backgrey Washer 5/18/82 500 2,310 190 1.93 9 . 0
5/20/82 480 2,300 70 13.26 9.4
5/19/82 1,000 1,470 280 8.56 9.6
Avg . 660 2,030 180 7.92 -
J: Rope soaper was abandoned subsequent to the field investigations, and replaced by a new open width soaper.
B-14

TABLE 1-3 (Continued)
POLLUTANT LOADINGS
Source ___ Flow# BOD COD TSS Phenolics mgd % Total lb/day % Total lb/day % Total lb/day % Total lb/day % Total
Backgrey Washer __ 0.05 3.6 275 3.3 __ 847 4.2 1.5 3.3 65.7 75 - -
Total Soaphouse 0.4 28.6 893 10.6 2,608 13.1 150 3.0 3.74 74.5
Other Wastewater Raw Print 0.19 - - 3,711 - 10,617 776 - 8.6 - Wastewater
(not added to total)
DAF Treated Effluent
W
U 16.4 2.54 50.6 0.19 13.6 1,173 14.0 2,947 14.8 824
+ Belt Press - - - - - - - - Makeup 0.04 2 .9
Add DAF + Bleach- - - house + Soaphouse 1.08 17.1 8,920 20,201 - 2,879 6.45 -
Miscellaneous + Dyeing + Finishing* 0.32 22.9 (513) - ( 2 3 5 ) - 2,142* - (1.43)*" -
Final Effluent 1 . 4 100 8,407 100 19,966 100 5,021 100 5.02 100
4
u
Unaccounted flow and pollutant loadings allocated here.
Perhaps due to precipitation reactions in final effluent line.
Some phenolic compounds may volatilize in atmosphere before final discharge to sewer.
Flow data for the most part were estimated based on operator comments and overall flow balance discussed with mill personnel. balance.
..>..*. ,%
# Flow meters present on the DAF effluent and final effluent were also used in obtaining overall

TABLE 1-4 FINAL EFFLUENT
Alkalinity (as CaC03) BOD
COD TDS TSS Chloride Oil & Grease Phenolics Turbidity (NTU) Color (ADMI) Hardness (as CaC03) Sodium Chromium Copper Iron
Manganese Zinc
PH (SUI Temperature (OF)
Concentration, mg/l
870 1,220 850 500 600 1,050
1,970 1,500 1,650 1,640 3,790 3,780 390 350 550
190 170 170 210 120 210
0.43 0.27 0.58 5.1 80 100
1,200 1,100 1,570 97 40 40
610 2,180 ' 600 3.6 1.8 1.6 1..2 0.43 0.56
82 15 21 2.9 1.4 1.4
0.33 0.35 0.19 - - 9.3
102 102 109
Source: Wastewater samples taken May 17 to 21, 1982.
B48

EVALUATION OF RECYCLE/REUSE TECHNOLOGIES The areas at Mill W-3 that were selected for study of recycle/
reuse methods are the following: 1 . Bleachhouse Wastewater
a. Flow reduction and direct reuse measures. b. Ultrafiltration for size separation and water recycle. c. Mercerizing waste - Evaporation for caustic recovery and
water recycle. 2. Print & Color Shop Wastewater
a. Flow reduction and direct reuse measures. b. Goagulation/flotation for water recycle.
3 . Soaphouse Wastewater a. Flow reduction b. Each of these is considered in detail in the following
Direct reuse and heat recovery.
sections.
B- 19

SECTION I1 BLEACHHOUSE WASTEWATER
DESCRIPTION OF MANUFACTURING PROCESSES A major portion of the incoming fabrics to be finished at this
mill consists of all-cotton or cotton blends that are desized, scoured, and bleached on the rope range in preparation for printing. A minor portion consists of polyester/rayon and other polyester blends that are desized and scoured on the open width preparation range. Most of the goods are sized with PVA, starch, or a combination of the two. The mill has little or no control over the amounts or tGes of size on the fabrics, because they are sent from greige mills around the nation and world.
The rope and open width preparation ranges are described in the introduction and are illustrated in Figures 11-1 and 11-2.
A major portion of the total production also is mercerized. These fabrics are primarily all cotton. The mercerizer is described in the introduction and is illustrated in Figure 11-3, incorporated with the caustic recovery system.
Water and Chemical Use
Rope Range Desizing. The schematic diagram in Figure 11-1 shows that about 165,000 gpd are used at the desize washer, which includes about 34,000 gpd of hot condensate from the caustic recovery multiple effect evaporator. The range processes about 60,000 pounds of fabric per day, resulting in an average water use of 2.75 gallons per lb of fabric for desizing. The resulting wastewater flow of 150,000 gpd is discharged at about 140°F with other bleachhouse wastewater to a heat exchanger before flowing to the bleachhouse neutralization basin and final discharge to the sewer.
The most important chemical added at the desize saturator is sodium bromite, which catalyzes a reaction to break down the starch size on the fabrics. This reaction proceeds in the J-box, which provides a range of detention times from 40 to 80 minutes.
E-20

SODIUM BROMITE 0.01Smgd LOSS
t I
CAUSTIC SATURATOR
COTTON AND COTTON
FABRICS
DESIZE WASHER + I BLEND SATURATOR
- I t * I L0186mOd FEED (INCLUDES
0.034mgd FROM CAUSTIC O.1Smgd TO HEAT
EXCHANGER 6 DRAIN RECOVERY UNIT)
NsOH
I
I 0.012mod LOSS
H202 I
t - FABRIC TO
MERCERIZINQ OR PRlNTlNQ
PEROXIDE SATURATOR
WASHER +2 WASHER +3
I t. 1 140'F I I
L I
0 . g ; w d
I
0.12 mod TO HEAT EXCHANGER AND DRAW
PUMP
FIGURE 11 -1 SCHEMATIC DIAGRAM
BLEACHHOUSE ROPE RANGE

The synthetic and starch sizes are removed in the desize washer.
Rope Range Scouring/Bleachin$. About 132,000 gpd are used for scouring and bleaching, which results in average water use of 2.2 gallons per' lb of fabric. The wastewater flow of 120,000 gpd is discharged at about 140°F with other bleachhouse wastewater to a heat exchanger before flowing to the neutralization basin and final discharge.
Caustic and hydrogen peroxide are added for scouring and bleaching, and remaining size, oils, waxes, and other fiber impurities are removed in the washers.
Open Width Preparation Range Desizing/Scouring. The schematic diagram in Figure 11-2 shows that about 143,000 gpd are used at this range, with 108,000 gpd used in the rinse portion and 35,000 gpd used in the desize/scour portion. The range processes about 25,000 pounds of fabric per day, resulting in an average water use of 5.7 gallons per pound of fabric. The wastewater flow of 130,000 gpd is discharged at about 175°F with other bleachhouse wastewater to a heat exchanger before flowing to the neutralization basin and final discharge to the sewer.
Generally, no chemicals are added except for detergents occa- sionally to remove synthetic sizes, oils, and other fiber impurities. The polyesterfrayon fabrics are more easily cleaned than the cotton fabrics, thus precluding the need for chemicals such as caustic.
Mercerizing. The schematic diagram in Figure 11-3 shows that about 100,000 gpd are used at the two ranges (50,000 gpd at each range). The mercerizing ranges process about 51,000 lb of fabric per day, resulting in an average water use of nearly 2 gallons per lb of fabric. About half of the water is used at the chain and spray washers and about 40,000 gpd flow to the caustic recovery system.
The details of the caustic recovery system are covered later in this section. About 50,000 gpd of mercerizing wastewater are discharged at about 175'F and, together with other bleachhouse wastewater, flow to a heat exchanger before flowing to the neutralization basin and final discharge to the sewer.
B- 22

0.009 mad I- lo88
FABRIC NORMALLY I . ' BYPASSES STEAMER
0.010 mad r r I
, FABRIC SCOUR RINSE
POLYESTER SINQER (FOUR WASH STEAMER (FIVE WASH TO PADDER --.). COMPARTMENTS COMPARTMENTS b
OUNTERFLOW) PRlNTlNO BLEND (NO (OPTIONAL) FABRICS WATER) COUNTERFLOW)
I
. TO HEAT FEED
EXCHANQER 1. DRAIN (17S'F)
0.008 mad 0.108 mad TO HEAT R E D
EXCHANOER h DRAIN (176'F)
FIGURE E-2 SCHEMATIC DIAGRAM
OPEN WIDTH PREPARATION RANGE
.

THREE RECUPERATOR WASH
CAUSTIC
SATURATOR WASHER COMPARTMENTS>
26Qpm CONDENSATE P R 0 DUCT EFFECT TO DESIZE 0.034mQd S T 0 RAG E
EXCESS CONDENSATE TO DRAIN
MULTIPLE
EVAPORATOR
FABRIC TO PRINTING
-6 gpm L O S S )
-15-20lb STEAM PER Ib CAUSTIC RECOVERED
FIGURE 1L -3
0
5;; 0>2 &O<
TOHEATEXCHANGER AND DRAIN 0 0
W O Le
2.6 gpm RECOVERED, CAUSTIC TO UNIT 2
SCHEMATIC D I A ~ R A M MERCERIZING AND CAUSTIC RECOVERY
A
W P c
+ 1SQpm FROM UNIT 2 30-35ppm
v FEED 0.06mad
WEAK FEED 5 T 0 R A G E
4-5% NaOH

Concentrated caustic (35-50% solution) is added at the caustic saturator to immerse the fabric in a 20-25% caustic solution to effect the mercerization process. The major portion ojf the caustic is sub- sequently washed off at the chain and spray washers.
Wastewater Characterization Rope Range - Desizing and Scouring/Bleaching. Wastewater samples
from rope range desizing and scouring/ bleaching were collected and analyzed, and the results are shown in Table 11-1. A s indicated in this table and Table 1-3, these processes contribute a large part of the organic and solids load (68 percent of total BOD, 59 percent of total COD, 25 percent of TSS) to the mill's discharge, as a result of removal of starches, synthetic sizes, waxes, oils, and other fiber impurities.
It is interesting to note that both the desize and scour/ bleach portions of the range contribute similar loads of BOD, COD, and TSS, which leads to a question on the actual efficiency of the desize operation, i.e., how much size is actually removed in the desize portion of the range, and how much is removed in the scour/bleach portion. This question significantly affects the potential for application of reuse/ recycle technologies and is discussed further in the section on recycle/ reuse methods.
Open Width Preparation Range. Wastewater samples from the open width preparation range were collected and analyzed, and the results are shown in Table 11-2. This table and Table 1-3 show that the desizefscour portion of the open width preparation range contributes a significant organics and solids load to the mill effluent (13 percent of the BOD, 14 percent of the COD, and 12 percent of the TSS). A wide range in daily values for BOD and TSS is noted, perhaps due to the variety of fabrics processed at the range. It is evident, however, that the rinse portion is relatively clean in comparison with the desize/scour portion, and this indicates a potential for water reuse at the range itself. This is discussed further in the section on
recycle/reuse methods.
B-25

TABLE 11-1 ROPE RANGE WASTEWATER
Alkalinity (as CaC03) Total Carbon (% by weight) BOD COD TDS TSS Oil & Grease Phenolics Turbidity (NTU) Hardness (as CaCO )
Sodium Chromium Copper Iron
Manganese Zinc
3
PH ( S W Temperature (OF)
Concentration, mg/l
Desize Wash Scour/Bleach Wash
0 0 0 4,170 4,060 3,080 0.2 0.22 0.12 - - -
2,850 3,500 1,520 2,450 2,750 2,120 5,040 5,600 3,450 5,600 6,630 5,400
2,200 3,450 2,550 7,400 10,550 9,670 830 790 490 340 630 270 73 53 88 480 53 90 0.14 0.06 <0.01 0.032 0.049 0.13
230 85 120 280 550 310 150 57 100 110 120 91 140 160 61 4,150 3,180 3,280 < 0.1 <0.1 <0.1 <0.1 <0.1 <0.1 < 0.1 <0.1 <0.1 < 0.1 <0.1 <0.1 1.1 0.41 0.46 0.74 0.95 0.75
< 0.1 <O.l < 0.1 0.12 0.13 0.12 0.21 0.19 0.12 0.17 0.15 0.14 - - 6.2 6.8 11.5 11.7
135 147 136 135 136 135
Source: Wastewater samples taken May 17 to 21, 1982.
.
B- 26

Alkalinity (as CaC03) MBAS (as LAS) BOD COD TDS TSS Oil & Grease Phenolics Turbidity (NTU) Hardness (as CaCO )
Sodium Chromium Copper Iron Manganese Zinc pH (SU) Temperature (OF)
3
TABLE 11-2 OPEN WIDTH PREPARATION RANGE WASTEWATER
Concentration, mgjl Desize/Scour Wash Rinse Wash
35 32 21 0.22 0.2 0.44
6,000 2,400 3,000 12,200 8,900 9,520 2,300 3,120 3,340 5,200 1,110 250 130 140 360 < 0.01 0.032 0.021
1,200 450 250 < 1 <1 < 1
- - - - - - - - - - - - - - - - - - - 6.2 7.2
180 175 169
6.3 0.058
180 300
110 66 44
< 0.01 24 8.1 23
< 0.1 < 0.1 0.26
< 0.1 < 0.1
- 180
7.4 8.4 0.034 0.04 72 120 32 160 970 < 1 20 10 100 180 <0.01 <0 .01
. 23 14
< 1 < 1 - - - - - - - - - - - - 6.4 6.5
167 169
Source: Wastewater samples taken May 17 to 21, 1982
B- 27

Mercerizing. Wastewater samples from the excess mercerizing wastewater (the portion that discharges to drain, as opposed to caustic recovery) were collected and analyzed, and the results are shown in Table 11-3. This table and Table 1-3 indicate that the wastewater is dilute, clear, and relatively pure; therefore, it has good potential for reuse in an area that may be enhanced o r unaffected by the alkalinity and pH, which range around 900 mg/l as CaCO and 11.0, respectively. Reuse of this wastewater at the desize washer is discussed later in this section.
3
DESCRIPTION OF APPLICABLE RECYCLE/REUSE METHODS The methods for wastewater recycle/reuse in the bleachhouse
are discussed under the following categories: Flow reduction and direct reuse measures. Ultrafiltration of desizing/scouring wastewater for size separation and water recycle. Evaporation of mercerizing wastewater for caustic recovery and water recycle.
O
0
Flow Reduction and Direct Reuse Measures It is useful to first consider means to reduce flow at the
various processes in order to minimize the costs involved in treating and recycling and to achieve savings in sewer use charges. The overall water use at the rope range averages nearly five gallons per pound of fabric, with 2.75 gallons per pound from desizing and 2.2 gallons per pound from scouringlbleaching. The water use at the open width pre- paration range averages 5.7 gallons per pound of fabric. Since ultra- filtration (UF) is a potential technology for treating wastewater from the rope range desizing and the open width desizing/scouring, it should be noted that economical applications of UF for size removal have been achieved with water use rates of about one gallon per pound of fabric.
A revised flow diagram incorporating direct reuse, flow reduc- tion, UF treatment, and recycle in the bleachhouse is illustrated in Figure 11-4. The diagram shows that the input to the rope range desize washer is decreased from 165,000 gpd to 120,000 gpd, and it consists of
B- 28

...
Alkalinity (as CaC03) BOD COD TDS
TSS Chloride Phenolics Turbidity (NTU) Hardness (as CaC03) Sodium Chromium Copper Iron Manganese Zinc
PH (SUI Temperature (OF)
TABLE 11-3 MERCERIZER WASTEWATER
Concentration, mg/l 270 1,050
63 22
42 54 360 1,200
23 10 15 -
0.009 <0.01
5.6 7 . 5
28 20 260 - < 0 . 1 - ( 0 . 1 - 0.35 -
< 0.1 - <0.1 - 10.4 11.0
172 169
1,400
44
62
2,160
30 - 0.0015
10
<1
190 - - - - -
11.4
167
Source: Wastewater samples taken May 17 to 21, 1982.
B-29

0
/
8-30

34,000 gpd of evaporation condensate from the caustic recovery unit (already in place), 50,000 gpd of water reuse from the mercerizers, 17,000 gpd from ultrafiltration permeate, and 19,000 gpd of fresh heated makeup water from the mill pond and bleachhouse heat exchanger. The wastewater discharge from the unit is 108,000 gpd, of which 36,000 gpd is fed to the ultrafiltration system, and 72,000 gpd is discharged to the heat exchanger and drain. The flow to the ultrafiltration system is planned such that wastewater from PVA desizing is segregated by pre-testing fabrics for their size type, and it is estimated that one-third of the desizing flow is associated strictly with PVA desizing. Currently no data are available to support the estimate other than observations by mill personnel, so this is in need of ful-ther investigation. The input to the open width preparation range is de- creased from 143,000 gpd to 54,000 gpd by employing complete countel-flow and balancing the needs of the rinse and scour/desize portions of the range. Of the 48,000 gpd discharged, about one fourth or 12,000 gpd is estimated to be related to PVA desizing and is fed to the ultrafiltra- tion system. The remaining 36,000 gpd is discharged to the bleachhouse heat exchanger and to drain.
The total feed to the UF system is therefore estimated at 48,000 gpd, which results in about 43,000 gpd of permeate and 5,000 gpd of concentrate. The permeate can be recycled in various proportions to the rope and open width preparation ranges, and one scheme is shown that divides the recycle in proportion to the requirement at each range. Thus, 17,000 gpd are recycled to the rope range desize washer and 26,000 gpd to the open width preparation range.
Ultrafiltration of Desizing/Scouring Wastewater for Size Separation and Water Recycle
A description of ultrafiltration technology and its applica- bility in the textile industry is found in Volume 1.
The system planned for this application is illustrated in Figure 11-5. The desize wastewater containing PVA is passed through a vibrating screen filter for solids removal before entering a continuous multi-stage feed and bleed ultrafiltration system. The hot permeate is recycled to the rope and/or open width preparation ranges, and the concentrate is stored until it is hauled for disposal o r marketing.
B-31

TO PERMEATE S ~ O R A G E
UF STAGE + l UF STAGE +2 UF STAGE +9
B 0 h)
TO CONCENTRATE
STORAGE
FIGURE II -6
CONTINUOUS MULTI-STAGE FEED AND BLEED OPERATION ULTRAFILTRATION SYSTEM SCHEMATIC
.

TECHNICAL FEASIBILITY
Flow Reduction and Direct Reuse Measures Rope Range. An essential question affecting the ability to reduce
flows at the ranges is the efficiency of the desizing operations. Wastewater data indicate, as stated earlier, that size may not be adequately removed in the rope range desizing operation and that substantial amounts may be present in the scour/bleach wastewater. One factor that may affect the desizing efficiency is the temperature of 140°F, which is lower than other known desizing operations of a similar type (see Mill W-8 of this study and Volume 1) that operate closer to 175'F.
Another factor is the nature of the chemical reaction involv- ing sodium bromite for starch and PVA removal. This reaction is typi- cally recommended to occur at pH above 9 for starch removal (Trotman, p. 210)*, and wastewater data indicate that the desize washwater is discharged at a pH of 6 to 7. The extent to which starch and PVA sizes are broken down in this process is an important factor in the success of the UT treatment process, which is discussed in the subsection on UF feasibility.
The reuse of hot condensate from the Zaremba caustic recovery unit in the desize washers should not have an effect. on desizing efficiency.
Desizing efficiency may be affected by direct reuse of the portion of the mercerizing wastewater that is currently discharged directly to drain. Since this wastewater is fairly clean relative to the rope range desize wastewater, as shown in Tables 11-1 and 11-3, it has the potential for direct reuse at the rope range desize washer. Water saving and energy benefits can be realized if the pond water input
flow to the desize washer is subsequently lowered. The effects of the alkalinity and temperature of the mercerizer wastewater on desizing efficiency need to be investigated.
Counterflow rinse is already installed on the scour/bleach portion of the rope range, and it is not apparent that flows can be reduced without affecting the efficiency of the operation. Again, the
"Trotman, Dyeing and Chemical Technology of Textile Fibers, 5th Edition.
B-33

temperature of 14OoF is lower than expected (Trotman, p. 254), and con- ceivably water use could be reduced if the temperature were raised, but
the energy costs would likely exceed the water use savings. It would become economical only if it could be shown to be essential for the economic success of a UF o r other treatment system to be discussed in the section on UF treatment.
Open Width Preparation Range. The water use at this range averages
about 5.7 gallons per pound of fabric, and the wastewater data in Table 11-2 indicate that the rinse portion of the range generates a very dilute wastewater in terms of organics and solids. Thus, this portion of the range has good potential for reuse at the desize/ scour portion of the range, through a complete counterflow arrangement from the rinse to scour portion. It is likely also that direct water reduction can be achieved because the major portion of the impurities is removed in the scour portion of the range. This is consistent with the concept that polyester fabrics are more easily cleaned than cotton fabrics. It has been demonstrated at another mill (Mill W-4 of this study) that a water use of one gallon per pound of fabric is achievable for open width scouring/desizing of polyester fabrics. Therefore, the projected water use of two gallons per pound here appears reasonable, though testing is necessary to establish that the fabrics are sufficiently scoured and desized in preparation for printing and finishing. Careful monitoring of flows will be necessary to conduct tests to establish optimum flow rate. Such monitoring and testing have never been conducted at this mill.
Ultrafiltration (UF) The general history and background of UF in the textile
industry is found in Volume 1, so the discussion here will focus on its applicability for the rope and open width preparation ranges.
A bench scale test of UF was conducted by Abcor, Inc. on the rope range desizing wastewater and the open width desizing/scouring wastewater. Phase separation was demonstrated for both streams, but the following results indicate that starch is degraded extensively at the rope range and passes through the UF membrane:
B-34

Rope range desize COD = 5,250 mg/l." UF Permeate - rope range desize COD = 2,180 mg/l." Open width desize/scour COD = 12,455 mg/l." UF Permeate - open width desize/scour COD = 970 mg/l.*
* Bench scale test conducted May 21, 1982.
COD test performed by Mill W-3 on May 21 and 2 4 , 1982.
The extent to which starch and PVA are removed and chemically altered in the different portions of the rope range is one major issue involved with the application of UF for the rope range. Indicator parameters such as BOD, COD, and TSS show that size may be removed partially at both the desize and scour/bleach portion of the range, add further technical investigations are needed to determine the efficiency of the desizing operation.
The state of degradation of the starch and PVA is in need of investigation to determine the potential for complete rejection in a UF membrane and to project the nature of the concentrate and permeate.
The results for the open width range are somewhat more pro- mising and indicate that the synthetic sizes do not pass through the membrane as extensively as the starch sizes generally expected at the rope range.
Mill personnel are uncertain as to amounts and types of size on the fabrics that are processed on this range, so investigations similar to those needed for the rope range must be conducted on this range. Wastewater data show that the vast majority of the organic and solids load results in the scour/desize portion of the range and not in the rinse portion, which indicates that size removal occurs only on the scourldesize portion of the range. However, testing must establish the amount, type, and extent of degradation of the size material in the wastewater.
The results of such investigations on the two ranges signifi- cantly affect the planning of a LE system. It is necessary to make some assumptions to examine the economics of a UF system on a preliminary
B- 35

.-
basis. Most research has shown that the best applications of UF have been for PVA recovery and that starch is generally degraded to the extent that it cannot be reused.
Therefore, the planned system depends on the ability to segre- gate the fabrics such that PVA is the major size constituent in the wastewater. Testing and statistical data are needed to establish the percentage of the fabrics that are sized with PVA and to project a flow rate for the UF system.
Further investigations are needed to establish the usefulness and value of the permeate and concentrate of a UF system at this mill. One UF manufacturer with experience in the region has stated that there may be a nearby market for the UF concentrate at paper mills, which sometimes use a starch/PVA mixture as a binder.
ECONOMIC FEASIBILITY The discussion of Technical Feasibility offers many unanswered
questions regarding water reduction and ultrafiltration in the bleach- house. Therefore, the following range of possible conditions is ex- plored in this discussion:
1. Direct reuse of mercerizer wastewater and open width rinse water only.
2 . Direct reuse plus ultrafiltration of 20 gpm from the rope range and 6 gpm from the open width range.
3 . Direct reuse plus ultrafiltration of 32 gpm from the rope range and 10 gpm from the open width range.
4 . Direct reuse plus ultrafiltration of 44 gpm from the rope range and 15 gpm from the open width range.
The benefits of size recovery are evaluated over a range of recoverable chemical values from no value to $1 per pound.
The benefits, costs, and paybacks under the various conditions are summarized in Table 11-4. The benefits are illustrated further in Table 11-5, and the costs in Table 11-6.
The benefits and costs are calculated on the basis of the following:
B-36

Wastewater discharge at $0.43/1000 gallons (estimated from mill records). BOD surcharge of $0.13 per lb of BOD in concentrations exceed- ing 100 mg/l. Energy cost of $5.14/10 BTU. Electricity cost of $0.0743 per Kwhr. Existing heat exchanger typically heats incoming pond water from 110 to 132OF with bleachhouse wastewater entering at 152'F and discharging at 132'F. Reused hot water is expected to average 150°F. Manufacturing processes operate 250 days/yr. UF system operates 7 days/wk (provided with adequate automation and storage) and recovers 80 percent of size; PVA is applied at 8 percent of weight of fabric. Capital costs are estimated in 1982 dollars on the basis of previous studies and equations in Volume 1. O&M costs for UF are based on equations developed in Volume 1. Tables 11-4 through 11-6 illustrate that direct reuse is
6
economically attractive because of the wastewater and energy savings and relatively small capital and annual costs.
Ultrafiltration is economically attractive only if substantial value (close to $1 per pound) can be attributed to the recovered chemical (size). No payback is expected if a market for the recovered size is not available; i.e., the savings from wastewater and BOD discharge reductions and energy reductions are not adequate to offset the relatively high capital and 'annual costs for UF.
ENVIRONMENTAL EFFECTS Direct reuse and water reduction are expected to have little
o r no effect on pollutant loads, because the streams involved are re- latively clean and contribute relatively small amounts of pollutants. This is evident in Table 1-3, which shows that the open width rinse and mercerizer rinse contribute less than 2 percent of the BOD, and less
B-37

TABLE 11-4 SUMMARY OF BLEACHHOUSE ECONOMICS
(CAUSTIC RECOVERY covered separately)
Scheme:
Annual Savings Totals w/chemical recovered at: $ l/lb
0.75/lb 0.50/lb 0.25/lb O.O/lb
costs Capital
Annual Operating
Payback Period (years) Chemical value of: $ l/lb
O.75/lb 0.50/lb 0.25/lb O.O/lb
1
Reuse only
$50,000 50,000 50,000 50,000 50,000
$24,000
$ 500
0.48 0.48 0.48 0.48 0.48
2
UF (26 gpm)
$407,000 327,000 247,000 167,000 87,000
Reuse +
$615,000
$ 81,000
1.9 2.5 3.7 7.2
no payback
3 4
UF (42 gpm) UF (59 gpm)
$589,000 $774,000 469,000 614,000 349,000 454,000 229,000 294,000 109,000 139,000
Reuse + Reuse +
$899,000 - $1,173,000
$116,000 $144,000
1.9 1.9 2.5 2.5 3.9 3.8 8.0 7.8
no payback no payback
B- 38
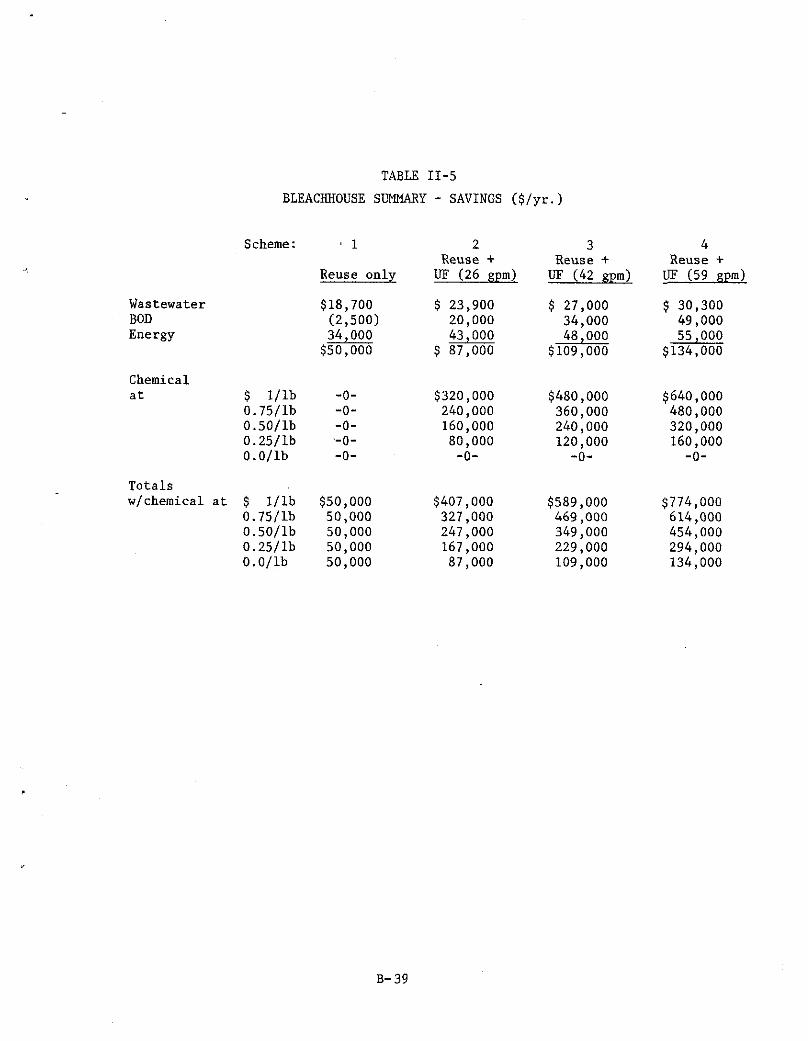
Wastewater BOD Energy
TABLE 11-5 BLEACHHOUSE SUMMARY - SAVINGS ($/yr.)
Scheme: ' 1 2 3 4 Reuse + Reuse + Reuse +
Reuse only UF (26 gpm) UF (42 gpm) UF (59 gpm)
$18,700 $ 23,900 $ 27,000 $ 30,300 (2.5001 20.000 34.000 49 .a00 34;ooo- 43;ooo 48 ; 000 55 io00 $50,000 $ 87,000 $109,000 $134,000
Chemical at $ I / l b
0.75llb 0.50llb 0.25llb O.O/lb
Totals wlchemical at $ l/lb
0.75llb 0.501lb 0.25/lb O.O/lb
-0- -0- -0- --o- -0-
$50,000 50,000 50,000 50,000 50,000
$320,000 240,000 160,000 80,000
-0-
$407,000 327,000 247,000 167,000 87,000
$480,000 360,000 240,000
-0- 120,000
$589,000 469,000 349,000 229,000 109,000
$640,000 480,000 320,000 160,000
-0-
$774,000 614,000 454,000 294,000 134,000
B- 39

TABLE 11-6 BLEACHHOUSE COST SUMMARY
Scheme: 1 2 3 4 Reuse + Reuse + Reuse +
Reuse only UF (26 gpm) UF (42 gpm) UF (59 gpm)
Capital Cost UF System
Piping
Pumps
Storage
-0- $406,000 $591,000 $770,000
9,000 3,000 add 3,600 4,000 +9,ooo from +9,ooo 12,000 Scheme 1 12,600
+9;ooo 13,000
8,000 8,000 add 10,000 12,000 +8,ooo from +8,ooo +8,ooo 16,000 Scheme 1 18,000 20,000
3,000 100,000 158,000 215,000 Scheme 1 not added (insignificant)
Electrical 3,000 61,000 89,000 116,000
Engineering 1,000 20,000 30,000 39,000
Total Capital $24,000 $615,000 $898,600 $1,173,000
Annual Costs UF Operating h Maintaining $ 80,000 $115,000 $143,000
Pumping Insignificant, based on caustic recovery calculations
Misc. OM $ 500 $ 1,000 $ 1,000 $ 1,000
Total Annual $ 500 $ 81,000 $116,000 $144,000
B- 40

than 1 percent of the COD and TSS loads. Tables 11-2 and 11-3 indicate that no other pollutants are expected to be affected significantly by direct water reuse.
The effects of an ultrafiltration system depend on the flow that is treated. As shown in Table 1-3, the desize washer of the rope range contributes significant loads of BOD, COD and TSS, and these loads could be drastically reduced by ultrafiltration and reuse of the UF permeate. Reuse of wastewater from the open width scour range would effect further reduction in these parameters in the final effluent. Calculations for BOD surcharges show that up to a 40 percent decrease in final effluent BOD load is achievable, depending on the flow through UF treatment. This flow is determined by the quantity of PVA-sized fabric, for which data need to be collected. Similar reductions in COD and TSS are expected.
Tables 11-1 and 11-2 indicate that other pollutant parameters, such as metals and phenolics, are not affected by recycle/reuse measures in the bleachhouse.
CONCLUSIONS 1. Direct reuse of mercerizer wastewater and open width pre-
paration rinse water is economically attractive and should be pursued by the mill.
2 . Substantial additional research is needed to evaluate the desizing process and the potential for size recovery at this mill. Research needs are discussed under Technical Feasibility and include studies in the following areas:
O Segregation of PVA-sized fabrics. Desizing efficiency and effects of water reduction/reuse.
' Size degradation. ' Marketability of recovered size. a Effects of UF permeate on fabric quality, manufacturing
processes, and pollutant discharge. 3. Ultrafiltration is costly and can be justified economically
only if substantial chemical (size) value is recovered. This technology
B- 41

should not be pursued until further research is conducted as indicated above.
EVAPORATION OF MERCERIZING WASTEWATER A description of evaporation technology and its applicability
in the textile industry is found in Volume 1. The system already in place at this mill is illustrated in
Figure 11-3. A solution of 4 to 5% caustic is pumped from the chain and spray washers at the mercerizers to a weak feed storage tank. Lint and gross solids are removed at a vibrating screen before the wastewater enters the multiple effect evaporator, where it is concentrated to a 35%
caustic solution. The caustic is returned to the caustic saturators at the mercerizers, and the hot condensate generally is pumped for reuse at the desize washer.
Technical Design Criteria The evaporator system used at this mill for caustic recovery
consists of a double effect evaporator with vertical steam chests. The second effect is operated under a vacuum. A Sweco vibrating screen filter removes particulate matter from the feed to the evaporator. Other technical data on the system are listed below:
Type of Evaporator and Manufacturer: Double effect evaporator
Date of Installation:
Average Caustic Recovery:
Average Concentration Achieved:
Feedrate:
Steam Requirement:
B-42
Zaremba (no longer in business)
Around 1970.
304,000 lb/mo (80% of amount used)
4% to 35-40%
40,000 gpd
20 lb steam/lb caustic recovered

Economic Feasibility The benefits, costs and payback of caustic recovery are sum-
marized in Table 11-7. The benefits and costs are calculated on the following basis:
1. 2. Energy cost of $5.14/10 BTU. 3. Electricity cost of $O.O743/Kwhr. 4. Caustic valued at $0.18/lb. 5. Existing heat exchanger heats incoming pond water to 132'F
Wastewater discharge at $0.43/1000 gallons. 6
Reused hot water averages 158'F with caustic recovery in place. 6. Current neutralization costs average $2,640 per month with
caustic recovery in place. 7. 8. Capital and other O&M costs are estimated in 1982 dollars on
Manufacturing process operates 250 days/year.
the basis of previous studies and costs developed in Volume 1. It is evident that the benefits of caustic recovery outweigh
the costs sufficiently to make the technology economically attractive, as indicated by the 1 to 2 year payback period. The benefits are due to the value of the recovered chemical and the savings in neutralization costs.
It is conceivable that steam economy is actually somewhat better than the conservative value used in the estimate (20 lb steamjlb caustic recovered). Calculations indicate that values of 15 lb steam per lb caustic may be achievable, which would lower the payback period proportionately.
Environmental Effects Tables 1-3 and 11-3 indicate that mercerizer wastewater is
relatively clean with respect to pollutant parameters such as BOD, COD, TSS, phenolics, and metals. The primary effect of recycle/reuse of the wastewater is to decrease the alkalinity and pH of the effluent. The total alkalinity from the bleachhouse is decreased by about 80 percent by the caustic recovery system.
B-43

TABLE 11-7
ECONOMICS OF EVAPORATION FOR CAUSTIC RECOVERY
Annual Savings Caus t i c recovery $650,000
N e u t r a l i z a t i o n sav ings 127,000
$777,000
C a p i t a l Cost
Evaporat ion Equipment
P ip ing
Pumping
S to rage
E l e c t r i c a l
Engineer ing
Annual Opera t ing Costs
Steam
O M Labor
O W M a t e r i a l s
Pumping
Payback Per iod
$480,000
3,000
4,000
20,000
72,000
24,000
$603,000
$427,000
20,000
4,800
50
$452,000

Conclusions 1. Caustic recovery by evaporation has been highly successful at
the mill. Substantial savings have been realized due to chemical re- covery and reduced neutralization costs.
2 . Improvements in steam economy would reduce the payback period proportionately. Thus, higher caustic concentrations in the original feed would improve the economics, which are already attractive.
B- 45
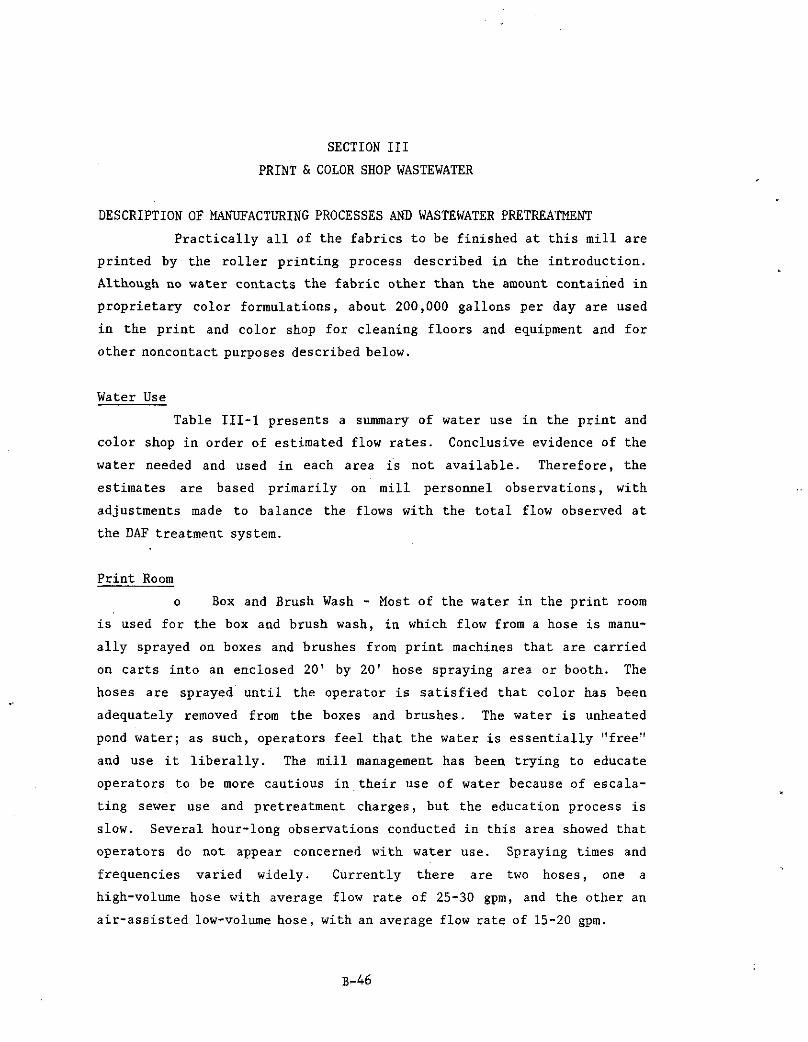
SECTION I11 PRINT & COLOR SHOP WASTEWATER
DESCRIPTION OF MANUFACTURING PROCESSES AND WASTEWATER PRETREATMENT Practically all of the fabrics to be finished at this mill are
printed by the roller printing process described in the introduction. Although no water contacts the fabric other than the amount contained in proprietary color formulations, about 200,000 gallons per day are used in the print and color shop for cleaning floors and equipment and for other noncontact purposes described below.
Water Use Table 111-1 presents a summary of water use in the print and
color shop in order of estimated flow rates. Conclusive evidence of the water needed and used in each area is not available. Therefore, the estimates are based primarily on mill personnel observations, with adjustments made to balance the flows with the total flow observed at the DAF treatment system.
Print Room o Box and Brush Wash - Most of the water in the print room
is used for the box and brush wash, in which flow from a hose is manu- ally sprayed on boxes and brushes from print machines that are carried on carts into an enclosed 20' by 20' hose spraying area o r booth. The hoses are sprayed until the operator is satisfied that color has been adequately removed from the boxes and brushes. The water is unheated pond water; as such, operators feel that the water is essentially "free" and use it liberally. The mill management has been trying to educate operators to be more cautious in their use of water because of escala- ting sewer use and pretreatment charges, but the education process is slow. Several hour-long observations conducted in this area showed that operators do not appear concerned with water use, Spraying times and frequencies varied widely. Currently there are two hoses, one a
high-volume hose with average flow rate of 25-30 gpm, and the other an air-assisted low-volume hose, with an average flow rate of 15-20 gpm.
B-46
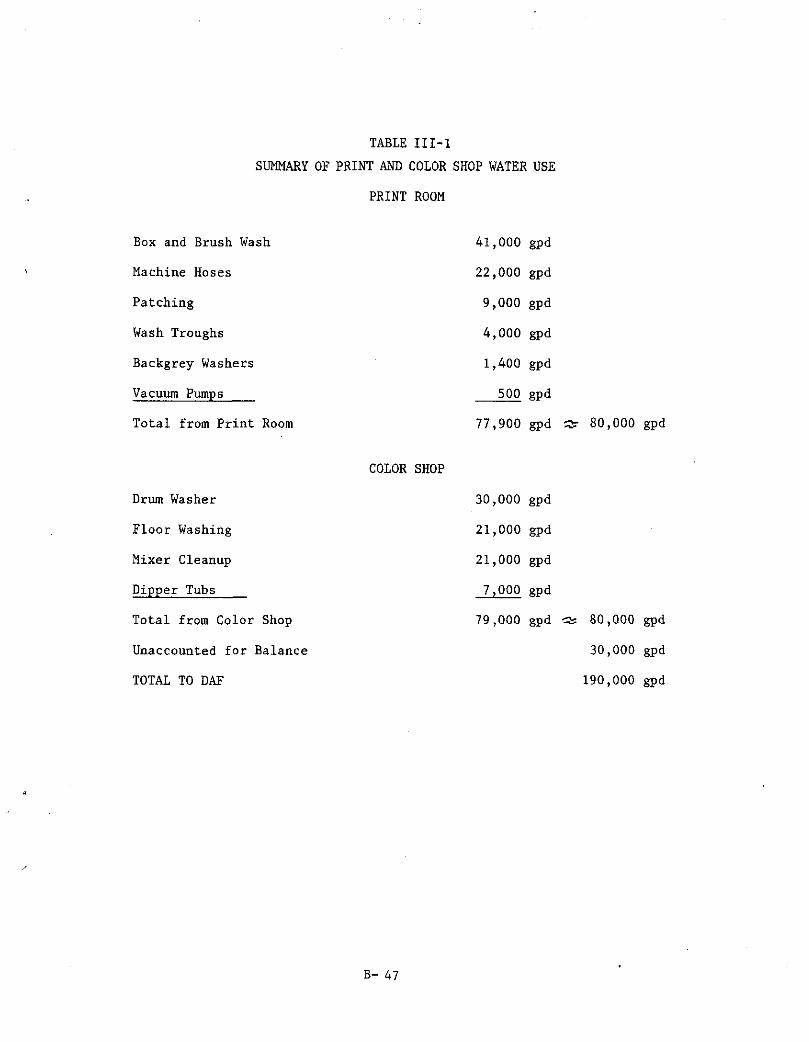
TABLE 111-1 SUMMARY OF PRINT AND COLOR SHOP WATER USE
PRINT ROOM
Box and Brush Wash
Machine Hoses
Patching
Wash Troughs
Backgrey Washers
Vacuum Pumps
Total from Print Room
COLOR SHOP
D r u m Washer
Floor Washing
Mixer Cleanup
Dipper Tubs
Total from Color Shop
Unaccounted for Balance
TOTAL TO DAF
41,000 gpd
22,000 gpd
9,000 gpd
4,000 gpd
1,400 gpd
500 gpd
77,900 gpd 'c 8 0 , 0 0 0 gpd
30,000 gpd
21,000 gpd
21,000 gpd
7,ooo gpd
79,000 gpd 80,000 gpd
30,000 gpd
190,000 gpd
B- 47

Operators show a distinct preference for the high-volume hose and state that the air-assisted hos'e does not allow the water to strike the equipment strongly enough to dislodge the color. This is discussed further under water reduction measures.
a Machine Hoses - At each printing machine there is a hose to wash down the floor periodically. Flowrates of the individual hoses are shown in Table 111-2, with estimates of the time per day that the hoses run. Observations in this area were inconclusive, and hoses are occasionally left to run indiscriminately.
O Patching - A series of sinks is filled and continuously flushed in order to test patches of printed fabric for color matching. Four faucets are left to run, r,esulting in 6 gpm around the clock. Wash Troughs - A series of troughs is located along the periphery of the printing room, in which miscellaneous equipment can be dipped for a quick rinse. The troughs are dumped and refilled two or three times per shift, according to mill personnel. Data on the troughs are summarized in Table 111-2. Backgrey Washers - Five backgrey washers are incorporated with printing machines to wash lightweight nylon backgrey fabrics, as opposed to heavier cotton fabrics that are washed at the main backgrey washer in the soaphouse. Data on these backgrey washers are summarized in Table 111-2.
O
O Vacuum Pumps - Pumps incorporated on the print machines for backgrey washer operation have a steady trickle discharge of water estimated as 100 gpd for each of the five pumps.
Color Shop O Drumwasher - The most noticeable water use in the color
shop is the automated drumwasher that scrubs used color drums so they may be reused for transporting other color
B-48

TABLE 111-2 PRINT ROOM FLOW DATA
BOX AND BRUSH WASH
High Volume Hose - 30 gpm" for a maximum of 15 hours""/day = 27,000 gpd Low Volume Hose - 20 gpm" for a maximum of 12 hoursf:*/day = 14,400 gpd Projected Water Use = 41,400 gpd
MACHINE HOSES (Projected Running Time = 120 minutes/day";)
Machine No. Flow Rate,* gpm
9 10 11 12 13 8 4 1 X X
25 20 10 10 10 25 25 15 20 20
PATCHING
6 gpm measured,* 24 hours/dayfc* 8,640 gpd 9,000 gpd
WASH TROUGHS
Flow, gpd
3,000 2,400 1,200 1,200 1,200 3,000 3,000 1,800 2.400 2;400
21,600
3 Large Troughs, 8 cu. ft./trough (60 gal) 6 Small Troughs, 5-1/2 cu.ft./trough (40 gal)
3 x 3 Trough Dumps per shift** x 3 shifts/day x 60 gal/dump* = 1,620 gpd 6 x 3 Trough Dumps per shift"" x 3 shifts/day x 40 gal/dump* = 2,160 gpd
TOTAL = 3,780 gpd W 4,000 gpd
BACKGREY WASHERS (at print machines)
5 machines x 45 gal/dump* x 3 dumps/day*+ = 675 gpd
5 machines x 720 gal/dump" x 1 dump/wk"* x - wk = 720 gpd 5 days +
Total Estimate = 1,400 gpd
* Measured during April h May, 1982. fdc Estimate from observations and discussions in May, 1982.

formulations to the print machines. Cycle times and flowrates vary widely; data are presented in Table 111-3.
' F l o o r Washing - Periodically the floor in the color shop is hosed down at varying flowrates and for varying times, depending on operator preference, and data are summarized in Table 111-3. Mixer Cleanup - Color mixers are typically washed initi- ally in tubs of dirty water, followed by a wash with clean water from a hose. The data on the clean water wash are summarized in Table 111-3.
Dipper Tubs - A series of tubs is available in several locations around the color shop for miscellaneous clean- ing, usually for color dippers. Often the faucets are left to flush continuously except where operators are careful to close the valves. The data from the observa- tions of these tubs are summarized in Table 111-3.
Chemical Use and Wastewater Characteristics The chemicals used in the various color formulations are
proprietary, but generally they consist of dyestuffs, thickeners, pig- ments, and mineral spirits. The formulations vary with the type of fabric and the color pattern desired.
The washing of the equipment and floors results in a waste- water containing a highly colored colloidal suspension of many of the materials mentioned above. Composite samples of the wastewater, known heretofore as raw print wastewater, were collected just after a bar screen that precedes pumping to the raw print wastewater equalization basin. The results of the analyses of these samples are presented in Table 111-4, along with the results from the DAF pretreatment process for comparison. Table 111-4, in conjunction with Tables 1-2 and 1-3,
indicates the highly colored and organic nature of the raw print waste- water.
Of course, it should be noted that the DAF treatment system removes contaminants to some extent before they are discharged to the city sewer with the other mill wastewater. This is discussed further in the subsection on Technical Feasibility.
B-50

TABLE 111-3 COLOR SHOP FLOW DATA
DRUM WASHER 20 gpm measured as maximum per tub;: 500 tubs/day estimated** 3 minutes/tub measured as maximum"
20 gpm/tub x 500 tubs/day x 3 minutes/tub = 30,000 gpd
FLOOR WASHING 30 gpm estimated as average hose discharge rate*: 700 minutes/day in use estimated*$< 30 gpm x 700 min/day = 21,000 gpd
30 gpm estimated as typical discharge rate** 700 minutes/day in use*': 30 gpm x 700 min/day = 21,000 gpd
MIXER CLEANUP
DIPPER TUBS 10 gpm estimated"* 700 minutes/day in use estimated+-: 10 gpm x 700 min/day = 7,000 gpd
* Measured during May, 1982. Estimate from observations and discussions in May, 1982
B-51

TABLE 111-4
PRINT WASTEWATER
Alkalinity (as CaC03) MBAS (as LAS) Total Carbon (% by weight) BOD COD TDS TSS Chloride Oil & Grease Phenolics Turbidity (NTU) Color (ADMI) Hardness (as CaCO )
Sodium
Chromium Copper Iron Manganese Zinc
3
PH ( S W
Temperature (OF)
Concentration, mg/l Raw CoagIDAF Treated
410 340 310 63 26 40
2,700 3,400 1,050
6,590 10,300 3,200
2,770 2,840 2,020
620 540 310
140 80 80
5 1 360 780
3.83 9.33 3.15
2,300 3,700 - 17,600 19,200 12,400
< 1 50 40
460 450 350
18 29 5 . 5
20 9.5 4.0
11 3.0 3.4
2.0 0.30 0.67
4.0 1 . 6 0.42
10.7 --- --- 88 82 8 4
550 680 1,000
1,080 2,300 2,200
620 750 772
220 350 992
830 760 760
28 97 34
1.54 1.38 1.87
10 2.6 2 . 4
300 870 929
89 50 < 1
200 240 200
1 .3 11 7 .3
0.86 4 .3 3.5
50 64 230
9 . 9 10 8.5
0.72 1.1 0 . 8 0
5 . 1 5 . 1 --- 81 82 88
Source: Wastewater samples taken May 17 to 2 1 , 1982.
B 5 2
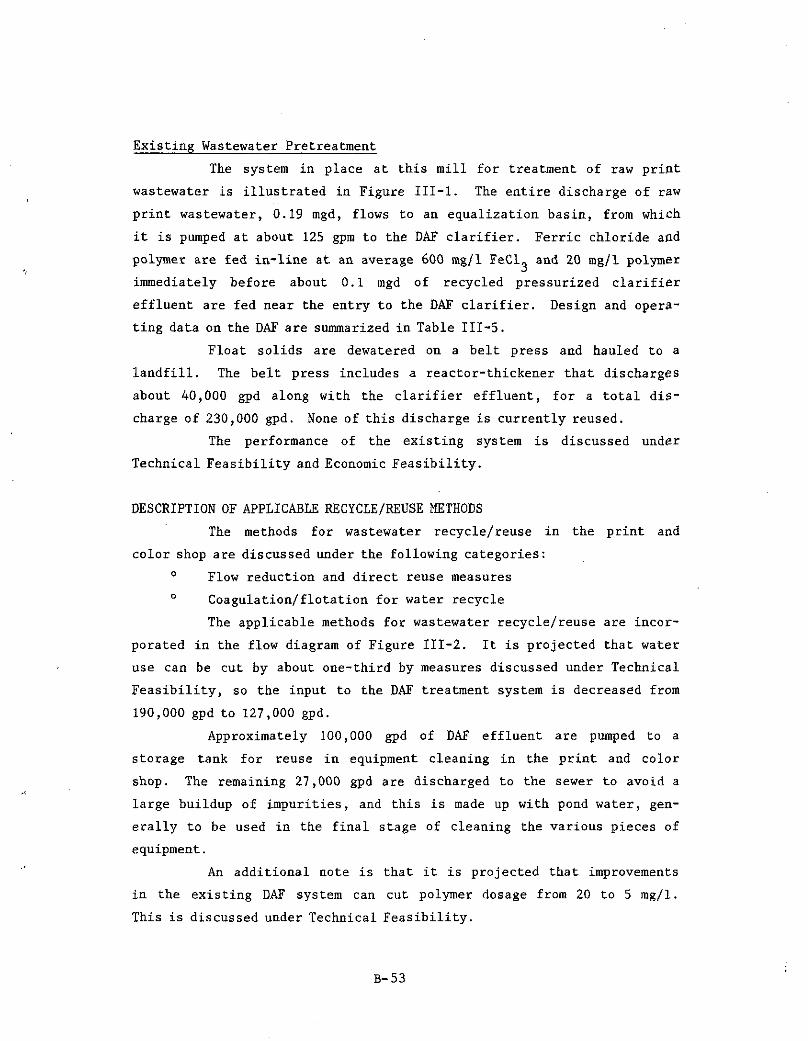
Existing Wastewater Pretreatment The system in place at this mill for treatment of raw print
wastewater is illustrated in Figure 111-1. The entire discharge of raw print wastewater, 0.19 mgd, flows to an equalization basin, from which it is pumped at about 125 gpm to the DAF clarifier. Ferric chloride and polymer are fed in-line at an average 600 mg/l FeCl and 20 mgjl polymer immediately before about 0.1 mgd of recycled pressurized clarifier effluent are fed near the entry to the DAF clarifier. Design and opera- ting data on the DAF are summarized in Table 111-5.
3
Float solids are dewatered on a belt press and hauled to a landfill. The belt press includes a reactor-thickener that discharges about 40,000 gpd along with the clarifier effluent, for a total dis- charge of 230,000 gpd. None of this discharge i s currently reused.
The performance of the existing system is discussed under Technical Feasibility and Economic Feasibility.
DESCRIPTION OF APPLICABLE RECYCLE/REUSE METHODS The methods for wastewater recycle/reuse in the print and
c o l o r shop are discussed under the following categories: O Flow reduction and direct reuse measures O Coagulation/flotation for water recycle
The applicable methods for wastewater recycle/reuse are incor- porated in the flow diagram of Figure 111-2. It is projected that water use can be cut by about one-third by measures discussed under Technical Feasibility, s o the input to the DAF treatment system is decreased from 190,000 gpd to 127,000 gpd.
Approximately 100,000 gpd of DAF effluent are pumped to a storage tank for reuse in equipment cleaning in the print and color shop. The remaining 27,000 gpd are discharged to the sewer to avoid a large buildup of impurities, and this is made up with pond water, gen- erally to be used in the final stage of cleaning the various pieces of equipment.
An additional note is that it is projected that improvements in the existing DAF system can cut polymer dosage from 20 to 5 mg/l. This is discussed under Technical Feasibility.
B- 5 3

l -z iGJ [POLYMER MIX' B I
I FEED
. POLYMER 20 mgii
I FECI3 6 0 0 m g l l
- I P W I T r:" ;I'""""""""p COLOR 0.6 MILLION
WASTEWATER GALLONS
t 0.01 mQd LOSS
1 PRESSURIZATION SYSTEM
PRESSURIZED CLARIFIER
EFFLUENT RECYCLE 40 pels
'0.1 m g d 0 . 1 m g d
RECYCLED CLARIFIER EFFLUENT
0.23 mod * 0 . 1 0 A TO SEWER
CLARIFIER - CLARIFIER
FROM BELT - o.04 FLOAT SOLIDS TO
MAKEUP FOR ~ ~ ~ A ~ ~ ~ ~ G AND BELT LANDFILLING ( iooo LEIDAY DRY
S 0 LIDS)
FIGURE IE-1 SCHEMATIC DIAGRAM
COAGULATlONlDAF FOR PRINTING WASTEWATER

TABLE 111-5
COAGULATION/DAF SUMMARY DESIGN AND OPERATING DATA
Raw Print Wastewater Flow Rate: 200,000 gpd; 125 gpm feed to DAF
Equalization Volume: 0.6 million gallons
Type & Dosage of Coagulants: 600-700 mg/l FeC13 io-20 mg/l polymer
Mixing & Flocculation Facilities: In line and at DAF
pH Control:
Type & Size of DAF Unit:
Obtained with FeC13 dose to pH 5-5.5
20 foot diameter, Infilco Degremont, Inc.
Typical Solids Loading: 0.1 lb / sq ft/hr
Hydraulic Loading: 0.6 gpm/sq ft
Air to Solids Ratio: 0.02 - 0.04
Air Pressure:
Recycle Ratio:
40 psig
50%
B-55

MAKE UP WATER 27,000 gpd
INT 6 COLOR SHOP
I
CHEMICAL FEED pH CONTROL
FeCI3 AT 800mgl (OPTIONAL)
PUMPINQ 7 A
POLYMER MIX
POLYMER AT Smal l -
40.000 god TO BELT PRESS
t c 1 (10001Wdly DRY SOLIDS) FLOAT SOLIDS TO BELT PRESS PRESSURIZATION
SYSTEM OAF CLARIFIER DEWATERING AND LANDFILL
CLARIFIED EFFLUENT 83,600gpd Bf.000gpd
TO SEWER
+l PRINT 6 COLOR WASTEWATER
CLARIFIED EFFLUENT 100.000gpd
FIGURE -2 RECYCLE I REUSE FOR PRINT 8 COLOR SHOP
WASTEWATER FLOW DIAGRAM OF COAGULATION I DAF SYSTEM
8-66

TECHNICAL FEASIBILITY
Flow Reduction and Direct Reuse Measures As described in the subsection on water use, the mill does not
iarefully control o r monitor the use of water in the print and color shop. It is recommended that the areas of largest water use, such as the box and brush washing, floor washing, and drum washing, be metered and that observations be made to establish a means to control the indis- criminate use of water. In addition to a continuation of education programs, both formal and informal, a system of incentives could be devised to reward operators for improvements in controlling water use. Several specific suggestions for water reduction follow, but it should be noted that the list is far from exhaustive, and imaginative measures are constantly in need of development.
Box & Brush Wash. As mentioned earlier, the mill has an air-assisted hose and a traditional high volume hose, and thus far, operators have continued to use the high-volume hose. Observations showed that the air-assisted hose can do as good a j o b of cleaning as the high-volume hose, provided the operator stands fairly close to the equipment so that the water strikes with adequate force. The first step in water reduction is to educate and convince the operators that this is the case and that the high-volume hose is rarely needed.
A similar hosing operation is performed at a nearby mill of the same parent company, and the air-assisted hose flowrate is about 10 gpm, as opposed to about 20 gpm for the air-assisted hose at this mill and 30 gpm for the high-volume hose. Although the material may be somewhat more easily removed at the other mill since screens are used for printing instead of rollers, there is evidence that flows can be reduced in this area by one-third by using the air-assisted hose almost exclusively.
Floor Washing. This is an area in which indiscriminate water use is often observed, especially in the color shop. One specific suggestion, based on observations at the company's other mill nearby, is to wash all mixers and other equipment in a confined space against a wall, instead of spread around the room as is currently done.
B-57

It is projected that floor washing flows could be cut by at least one third by judicious planning of the space, similar to the measures at the other mill. A variation is to plan containment areas for spills immediately around the color mixing area, so that the color would have less floor space on which to spread. Nozzles on the hoses would be a simple measure for more efficient cleaning. A system of incentives for spill control could be devised to promote a sense of better housekeeping in general and to prevent serious loss of valuable color formulations.
Drum Washing. It is suspected that cycle times could be reduced for many of the drums, though admittedly some are difficult to clean adequately. At the company's other nearby mill, the drum washer's typical cycle is one minute, but the formulations are aqueous solutions that are easier to clean.
Sumps for Direct Reuse. Mill personnel often suggest that water from the drum washing, floor washing, and box and brush washing could drain to a central nearby sump and be pumped back for direct reuse. A
screen and lint filter are necessary to avoid clogging hose and machinery nozzles, and it is known that this idea is typically incorporated in automated equipment washing systems developed.by Stork, a reputable European textile equipment manufacturer. Thus, it is known that adequate screens and filters are available on the market for direct reuse of the dirty water. Clean water would be used only at the final stage of a washing cycle
Solvent Cleaning. Judicious use of solvents is suggested for the most difficult cleaning j o b s . This is an area in need of further investigation to determine when solvents can be applied more economically than water. One suggestion is to use a tub of solveni solution to soak the dirtiest equipment and break the emulsions before going to the water spray booths. An automated system is envisioned in which the equipment rotates through a solvent-filled trough and upward through an intense water spray, using dirty water initially and finishing with clean water. This is similar to an automated spray cleaning system for squeegees at the company's other nearby mill. Care would need to be taken to prevent air pollution from volatilization of solvents.
B-5 8

Manufacturing Changes. An important final note is that roller print technology can be supplemented by screen print technology. A s
stated earlier, screens and the associated aqueous solutions used in color formulations are more easily cleaned. If any of the mill's printing is converted from roller to screen, water use reduction is likely to accompany such a conversion.
Coagulation/Flotation for Water Recycle A discussion of coagulation/flotation and its applicability in
the textile industry is found in Volume 1. The technical feasibility of this technology has been established at several full-scale installations that reuse the clarified effluent of DAF in their print and color shops. Although Mill W-3 does not now reuse the clarified effluent in the print & color shop, it is suspected that it may be of adequate quality for reuse as is, or that improvements in the operation of the DAF system will yield adequate quality for reuse.
Performance of Existing DAF System. Table 111-4 shows that the existing system encounters difficulties in solids removal, though it performs adequately for turbidity and color removal. Some of the coagulated floc particles may be scoured from the bottom of the float layer, because investigation showed that the float solids layer was up to 4 feet thick.
Other operating problems that may contribute to the solids removal problem are 1 ) inadequate dilution and mixing of polymer with the waste; 2) lack of rapid mix and flocculation facilities; and 3) lack of pH control.
Mill personnel state that the clarified effluent may be of adequate quality for reuse, despite the solids problem. Even with improved solids removal, there is a need for screening and lint fil- tration to avoid clogging of pumps, machinery and hose nozzles.
Mill personnel feel that the level of phenols and metals in the effluent should not be an obstacle to reuse as equipment cleaning water, though a period of testing is advisable to identify the possi- bility for damage to equipment o r fabrics through contact with the equipment.
B-59

The residual color is typically a light amber, and testing of the wastewater for reuse should consider potential problems from the amber color.
Bench Scale Results. A bench scale test of coagulation with ferric chloride and the polymer used by Mill W-3 was conducted as a check on
coagulant type and dosage. The optimum ferric chloride dose was about 600 mg/l, similar to the mill, and the polymer dose was about 5 mg/l, somewhat less than the 20 mg/l used at the mill. Mill personnel state that they feel the polymer feed system needs improvement to allow for better in-line mixing, perhaps by providing more injection points. They concur that the polymer dose is too high, so that the 5 mg/l dose appears reasonable.
Revised System. The revised DAF system described earlier and illustrated in Figure 111-2, allows for coagulant and polymer mixing, flocculation, and pH .control. These improvements coupled with water reduction and solids removal improvements in the DAF clarifier are expected to produce a clearer effluent adequate for reuse in equipment cleaning. Equipment manufacturers such as Stork of Europe have been incorporating efficient screens and lint filters in much of their automated equipment cleaning machinery, so that clogging of nozzles at the point of reuse will be prevented.
TECHNICAL DESIGN CRITERIA Design criteria of the revised system with water reduction and
reuse incorporated are summarized below:
Design flow: 127,000 gpd, 80-90 gpm Equalization Volume: 0.3 million gallons Type & Dosage of Coagulants: 600 mg/l FeC13
5 mg/l polymer Mixing Facility: Rapid Mix - 1-2 minutes
4 200 gallons capacity; Gt=l x 10 4 Flocculation Facility: Gt = 0.5 x 10
pH Control: Optional; achieved with FeC13 dose.
B- 60

Type & Size of DAF Unit: Circular; 16 foot diameter Typical Solids Loading: 0.16 lb/sq ft./hr. Hydraulic Loading: 0.68 gpm/sq. ft. Air to Solids Ratio: 0.01 to 0.02 Air Pressure: 40 psig Recycle Ratio: 5 0%
ECONOMIC FEASIBILITY
Flow Reduction and Direct Reuse Measures There are few tangible costs associated with water reduction
measures. Many of the measures involve improved housekeeping procedures and employee incentives and education; wastewater savings can be esti- mated on the basis of $0.43/1,000 gallons. With the projected reduction of 63,000 gpd, a wastewater savings of about $6,800 per year would be realized. It is estimated that $5,000 per year in miscellaneous costs could be incurred for training and housekeeping measures.
Localized sumps for direct reuse would incur costs for con- struction, installation of piping, pumps, and filters, and operation and maintenance of pumps and filters. It is expected that capital (installed) costs for a direct reuse sump would generally not exceed $4,000, and OM costs would not exceed $1,000 per year. An area with potential for direct reuse is the drum washer. If 25,000 gpd were reused, wastewater savings of about $2,700 per year would be expected. Thus, the approximate payback for this example would be $4,000/ $1,70O/yr = 2 . 4 years.
Coagulation/Flotation This discussion looks at the economics of providing coagula-
tion/flotation facilities in two ways: 1) no facilities currently in place, and 2) upgrading current facilities.
The benefits, costs, and paybacks of recycle/reuse for the print and color shop are presented in Table 111-6. The basis for the development of cost and savings estimates is as follows:
B-61

td I
N m
TABLE 111-6 ECONOMICS OF PRINT AND COLOR SHOP WASTEWATER RECYCLE/REUSE
Coagulation/ Flotation with
Recycle Total Water Reduction Only 1* 2" 1" 2"
Benefits Wastewater Savings, gpd 63,000 100,000 100,000 163,000 163,000
Slur $6,800 $10,800 $10,800 $17,600 $17,600
BOD Surcharge _ _ _ 50,000 10,800 50,000 10,800 Savings, $/yr
Total Savings
costs Capital Coagulation Flotation Equalization
Storage Pioine
Pumps
(insignificant) $6,800 $61,000 $22,000 $67,800 $28,800
80,000 80,000 75,000 -- 70,000 _- 10,000 10,000 15,000 6,000
30,000 15,000 J Y
~~
Filters 5,000 5,000 Electrical 43,000 17,000 Engineering 14,000 6,000 Contingency 34,000 14,000 Total Capital Minimal 376,000 153,000
Annual Coagulation Flotation Equalization Pumuine.
30,000 (40,000) 25,000 -- 1,000 -- 500 300
Sluhne-Hauling 10,000 -_ - - Miscellaneous 5,000 14,000 12,000 Total Annual 5,000 80,500 (27,700) 85,500 (22,750)
Payback Period Immediate no payback 3.1 years no payback 3.0 years
* Note that 1 represents analysis assuming no facilities in place; 2 is analysis for facility upgrading.
....

Wastewater discharge savings of' $0.43/1,000 gallons
BOD surcharge savings based on $0.13/lb for concentrations greater than 100 mg/l
Facilities operate 250 days per year
Electricity for pumping at $0.0743/Kwhr
Coagulant dosage of 600 mg/l FeC13; 5 mg/l polymer
Cost of FeC13 = $0.57/gallon, 3.5 lb/gallon
Cost of polymer = $3.39/1b
Sludge hauling costs = $10,00O/yr based on current mill data
Capital costs are estimated in 1982 dollars on the basis of previous studies and discussed in Volume 1.
Table 111-6 illustrates the promising economic potential for recycle of print wastewater in the case of upgrading the existing faci- lities. The two- to three-year payback period is reasonable and is even lower if coagulation facilities are not added. Upgrading the existing operation provides substantial benefits in terms of decreased coagula- tion costs in addition to the wastewater and BOD surcharge savings, and these additional benefits make the upgrading for recycle economically attractive. The savings from decreased wastewater and BOD discharge alone do not provide adequate economic incentive.
The construction of a complete new coagulation/flotation system is not economically feasible because no reasonable payback period is expected. Wastewater and BOD savings do not provide adequate savings to offset the capital costs and the fairly high annual costs for coagu- lation and flotation at this mill.
B-63

ENVIRONMENTAL EFFECTS
By examination of Tables 1-3 and 111-4, it is evident that the coagulationfflotation system effects a significant removal of BOD, COD, and phenolics. It is expected that improvements in treatment system operation would lead to more effective removal of TSS. Turbidity and color are vastly improved by means of the coagulation/flotation system. Iron, manganese, and chlorides show an increase because of the addition of ferric chloride as a coagulant.
Recycle of coagulation/flotation wastewater enables a further reduction of pollutant discharge by keeping the resultant pollutant load within the mill.
Water reduction measures are not expected to affect pollutant loads but will lead to decreased wastewater discharge.
Direct reuse sumps would decrease the overall loads depending on the amount of pollutants typically discharged from the particular area, such as drum washing, box and brush washing, and floor washing.
CONCLUSIONS a Upgrading existing coagulation/flotation facilities and
improving operations will enable recycle of treated wastewater for reuse in the print and color shop. Reduction in wastewater and BOD discharge plus savings in coagulant addition make the option economically attrac- tive. Pilot plant work should be conducted to establish the need for rapid mix and flocculation facilities, and the effects of improved polymer mixing and solids handling should be investigated.
The capital and annual costs for coagulation/flotation at this mill are not offset by wastewater and BOD discharge savings alone. However, lower coagulant dosages may make the technology economically attractive at other mills.
' Improved housekeeping procedures, conservation education and incentives, and direct reuse are expected to lead to a 33 percent wastewater discharge reduction, and the savings are economically attrac- tive. Capital costs should be fairly minimal.
Treated wastewater from coagulation/flotation should be tested to assure that equipment can be effectively washed without damage and that clogging of nozzles on hoses and other equipment can be avoided by in-line filtration.
B-64

SECTION IV SOAPHOUSE WASTEWATER
DESCRIPTION OF MANUFACTURING PROCESSES All fabrics are subjected to the soaping process subsequent to
printing and ageing in order to remove excess print b color formulations and any chemicals applied during ageing, such as acetic acid. As de- scribed in the introduction, the soaphouse consists of a variety of ranges, including a horizontal laced open width soaper, a rope soaper, and a backgrey washer. The mill plans to use the rope soaper sparingly in the near future when another open width soaper comes on-line."
The open width soaper is illustrated in its two modes of operation in Figure IV-1, and the backgrey washer is illustrated in Figure IV-2.
The rope soaper is illustrated in Figure IV-3 in order to consider the effects of its abandonment on water and energy use."
Water and Chemical Use Open Width Soaper. The schematic diagram in Figure IV-1 shows that
about 100,000 gpd are used at the open width soaper, with about 75,000 to 80,000 gpd used for Mode 1 (complete counterflow) and 20,000 to 25,000 gpd used for Mode 2 (partial counterflow). The range processes about 50,000 pounds of fabric per day, resulting in an average water use of about 2 gallons per l b . The wastewater flow of 90,000 gpd is dis- charged with other soaphouse water directly to the sewer. The flow from the washers is discharged at about 158'F, while the flow from the sprays! is discharged at about 10O0F.
The chemicals added to the washers are soap and proprietary dyestripping chemicals. Unfixed dyes and pigments are removed physi- cally in the spray boxes, and others are removed chemically and therm- ally in the wash boxes.
Backgrey Washer. Figure IV-2 shows that about 60,000 gpd are used at the backgrey washer to process about 130,000 yards (37,000 pounds)
;: Since the time of Phase I1 investigations, the rope soaper has been abandoned and replaced by a new open-width soaper.
B- 65

SOAP a DYESTRIPPINO 0.01
CHEMICALS mpd
SOAPED AGED, FABRIC
TO DRY CANS F I N I S H I N O
2 5 - 3 0
FEED
0.020 1 5 - 2 0 a020 1 6 - 2 0 0.032
TO FEED TO FEED TO DRAIN DRAIN DRAIN 1 OOOF 100°F 158'F
w m m g d g p m mgd g p m mad
MODE 1 (80% OF FABRIC)
m
m I 0 SOAP
DVESTRIPPINQ CHEMICALS
S O A P E D AGED, F A B R I C
T O D R Y CANS a FINISHNO
0.0038 1 5 - 2 0 0.0038 1 6 - 2 0 0.0048 26-30 0.008 26-30
TO FEED TO FEED TO FEED FEED m g d g p m m g d g p m m g d (pm m a d cipm
DRAIN DRAIN DRAIN DRAIN 100OF IOO'F 140'F 176OF
MODE 2 (20% OF FABRIC)
FIGURE IE -1 SCHEMATIC DIAGRAM
HORIZONTAL OPEN WIDTH SOAPER MODES 1 h 2
(AT TIME OF FIELD INVESTIGATION )

DIRTY BACKQREY
FABRIC
I WASHER +? O.OSmgd 10 DRAIN 113'F SOAP8
O.Olmgd LO88
20-60gPm FEED (0.Oemgd) WASHER +2
10 DRY CANS REUSE A 8 BACKQREY FABRIC
FIQURE -2 SCHEMATIC DIAGRAM BACKGREY WASHER
B- 87

per day of cotton backgrey fabrics. This results in an average water use of 1 . 6 gallons per lb of fabric. The wastewater flow of about 50,000 gpd is discharged directly to drain at a temperature of about 113'F. Soaps and detergents are added to assist in removing excess color from the fabric.
Rope Soaper." Figure IV-3 shows that about 280,000 gpd were used at the rope soaper to process about 34,000 pounds of fabric per day, which resulted in an average water use of 8.2 gallons per lb of fabric. The wastewater flow of about 260,000 gpd was discharged at about 113'F
directly to the sewer with other soaphouse wastewater. It is apparent that water use was excessive at this range, and observations showed that although counterflow piping was in place between Washer 3 and Washer 2, it was not used.
Soaps were added in the first two washers to remove excess dyes and pigments.
Wastewater Characterization Open Width Soaper. Wastewater samples from the open width soaper
were collected and analyzed, and the results are shown in Tables IV-1 and IV-2. The soaper contributes a relatively small percentage of the total mill organic and solids load (6.7 percent of the BOD, 8.2 percent of the COD, 2.3 percent of the TSS), indicating that relatively small amounts of the dyes and pigments are removed. However, the concentrations of BOD and COD are noteworthy in their range from 150 mg/l at Washer 1 in Mode 1 to 3870 mg/l at Spray 1 in Mode 1 . The level of pollutants generally appears to be greater in Mode 1 than in Mode 2, but this likely reflects the fact that Mode 1 predominates and processes a larger variety of fabrics and color formulations.
There is no clear trend as to the location of the maximum removal of excess color formulations, except that it appears more color is found in the washer wastewater than in the spray wastewater.
The levels of sodium and chromium are noteworthy in the Mode 1
wastewater and indicate that color formulations are removed at all locations
.'- The rope soaper has been abandoned since Phase I1 investigations and replaced by a new open width soaper.
B-68

WABHER WASHER WASHER WASHER 4
4 - - DYED, PRINTED,
FABRIC a (USUALLY AGED 1 2
BYPASSED)
NOTE: COUNTERFIDW CAPABILITY NOT USB)
TO DRY - CAN8
FIGURE Ip; -S SCHEMATIC DIAGRAM
ROPE SOAPER

TABLE IV-1 OPEN WIDTH SOAPER
MODE 1
Alkalinity (as CAC03) MBAS (as LAS)
BOD COD TDS TSS Chloride Oil & Grease Phenolics Turbidity (NTU) Color (ADMI) Hardness (as CaC03) Sodium Chromium Copper Iron Manganese . Zinc PH (Su)
Temperature (OF)
Concentration, mg/l Spray 1
660 410 5.5 6.5
1,650 1,450 3,870 3,280 6,200 3,200
74 52 1,120 -
31 450 0.37 0.24 30 26
3,510 376 97 69
1,750 1,510 5.7 16 1.1 0.83 0.56 0.58 0.27 0.11 0.11 0.12 5.9 5.8 99 97
Spray 2 Wash 1
340 160 210 120 6.7 6.2 20 22
950 550 153 700 2,220 1,550 2,180 1,780 3,370 1,400 1,860 880
55 56 130 80
475 - 180 - 140 16 44 150 0.21 0.16 1.76 0.53 2.3 60 0.26 3.8
4,020 395 10,800 2,920 48 40 48 61
1,650 440 470 290 3.3 9.0 20 17 0.14 0.71 0.25 0.36 0.45 0.54 0.64 0.62 0.17 <0.1 0.18 <0.1
<0.1 <0.1 1.2 0.79 5.9 5.9 6.3 6.1
100 97 158 158
Source: Wastewater samples taken May 17 to 21, 1982.
B- 70

TABLE IV-2 OPEN WIDTH SOAPER
MODE 2
Alkalinity (as CaC03) MBAS (as LAS) BOD COD TDS TSS Oil & Grease Phenolics Turbidity (NTU) Color (ADMI) Hardness (as CaC03) Sodium Chromium Copper I ron
Manganese Zinc Temperature (OF)
Concentration, mgfl
Spray 1
190
6.7 440
1,710
1,900 46 67
0.18
5.3 1,600
50 480
0 .15
0.7
0.53 0 .7 0.21
95
Wash 1 Spray 2
52 110 1 .6 24
220 560 600 ’ 1,450
650 1,000 40 64
14 24
0.12 0.41
5.3 12 177 2,700 28 24
180 300 < 0 . 1 1.8
0 .22 0.27 0.40 0 .63
0.27 0.40 < 0 . 1 0.78
100 140
Wash 3
500
9.9
500 1,590
760 240 100
0.28 1 . 4
5,780 32
440 2.0
0 . 3 4
1.9 0.13
0.92 175
Source: Wastewater samples taken May 17 to 21, 1982.
B-71

The highest levels of surfactants, measured as MBAS o r LAS, are found in Washer 1 at 24 mg/l LAS.
Backgrey Washer. Wastewater samples from the backgrey washer were collected and analyzed, and the results are shown in Table IV-3. The backgrey washer produces a highly colored wastewater with a significant amount of phenolics and chromium that have an effect on the final mill discharge. The organics and solids loads are fairly small (3 .2 percent of total BOD, 4.2 percent of total COD, 2 . 6 percent of total TSS).
The data indicate that excess color formulation is removed and that the levels on the fabric vary widely.
Rope Soaper." Wastewater samples from the rope soaper were collected and analyzed, and the results are shown in Table IV-4. This table and Table 1-3 show that the rope soaper contributed less than 1 percent of the BOD, COD, and TSS to the mill's effluent despite contributing nearly 20 percent of the total effluent flow.
The wastewater was more highly colored (5570 ADMI units) in Washer 1 than in Washer 2 , and it generally appeared that Washers 2 and 3 wastewater could have been counterflowed completely without a serious effect on the soaping operation. The data provided further evidence that water use was excessive here, because a great deal of contamination was not observed. This is discussed further under recycle/reuse methods.
DESCRIPTION OF APPLICABLE RECYCLE/REUSE METHODS The methods for wastewater recycle/reuse in the soaphouse are
discussed under the following headings: ' Flow reduction
Direct reuse and heat recovery
Flow Reduction The primary means of flow reduction is by the manufacturing
change from rope to open width soaping. The open width soapers are more
75 The rope soaper has been abandoned since Phase I1 investigations and has been replaced by a new open width soaper.
B-72

TABLE IV-3
Alkalinity (as CaC03) MBAS (as LAS) BOD COD TDS TSS Chloride Oil & Grease Phenolics Turbidity (NTU) Color (ADMI) Hardness (as CAC03) Sodium Chromium Copper Lead Manganese Zinc
PH ( S W Temperature ( O F )
BACKGREY WASHER
Concentration, mg/ l
470 300 13 9.9
500 1,000 2,310 1,470 1,550 1,800 190 280 80 - 120 220 1.93 8.56 0.4 9
2,160 12,800 52 61 490 500
18 3.8 2.0 3.0
2.6 1.3 0.32 0.24 0.58 0.31 9.0 9.6
113 115
87 4.6
480 2,300 420 70 -
24 13.26 20
2,580 73
540 29 0.96 0.72 0.13 0.17 9.4
109
Source: Wastewater samples taken May 17 to 21, 1982.
B- 73

TABLE IV-4 ROPE SOAF'ER"
. .
Alkalinity (as CaC03) MBAS (as U S ) BOD COD TDS TSS Chloride O i l & Grease Phenolics Turbidity (NTU) Color (ADMI) Hardness (as CaCO ) Sodium Chromium Copper Iron Manganese Zinc
3
PH (SUI Temperature (OF)
Concentration, mg/l
Washer 1 Washer 2
260 0.013
180 600
1,000 25 - 62 0.049 2.6
5,570 28 280 < 0.1 < 0.1 0.35
< 0.1 <0.1 9.3
122
18 0.074 36 42 78 8 -
500
0.01 3.7
370 8.1 25 <0.1 <0.1 0.34
<0.1 <0.1 8.5
104
-k Note that this soaper has been removed from operation and replaced by a second open width soaper during Fall 1982.
Source: Wastewater samples taken May 17 to 21, 1982
B- 14

efficient in water and energy use. The water use reduction achieved by this change is from 380,000 gpd for the current soaping operation (rope and open width) to 200,000 gpd for dual open width soapers. See Figure IV-4 for an illustration of the plan for the soaphouse.
Open Width Soaper. Flow reduction at the open width soaper is not projected, because the most efficient mode of operation has not been identified by the mill, and highly variable washing requirements are encountered. This is discussed further under Technical Feasibility.
Backgrey Washer. Flow reduction is not projected because of the highly variable requirements for washing at this range.
Direct Reuse and Heat Recovery The planned reuse and heat recovery scheme is illustrated in
Figure IV-4. About 60,000 gpd from the 180,000 gpd discharged by the two open width soapers will be reused directly for washing the backgrey fabrics.
Wastewater from the soapers and backgrey washer will flow to a recovery pit, from which it will be pumped to the backgrey washer for reuse o r the heat exchanger to preheat incoming feed water. The hot water from the washers (158’F) will be segregated from the cold water of the sprays (95-105’F), so that about half the total wastewater from the soapers (0.09 mgd) flows to the heat exchanger, and the remainder flows to either the backgrey washer o r directly to drain.
A total of about 170,000 gpd will be discharged, consisting of 90,000 gpd from the heat exchanger, 30,000 gpd from the recovery pit, and 50,000 gpd from the backgrey washer.
TECHNICAL FEASIBILITY
Flow Reduction Rope Soaper.” The discussion of water use and wastewater
characteristics explains the need and potential for flow reduction at this range. A water use of 8 gallons per pound of fabric was much
Q The rope soaper has been abandoned since Phase I1 investigations and has been replaced by a new open width soaper.
B-75
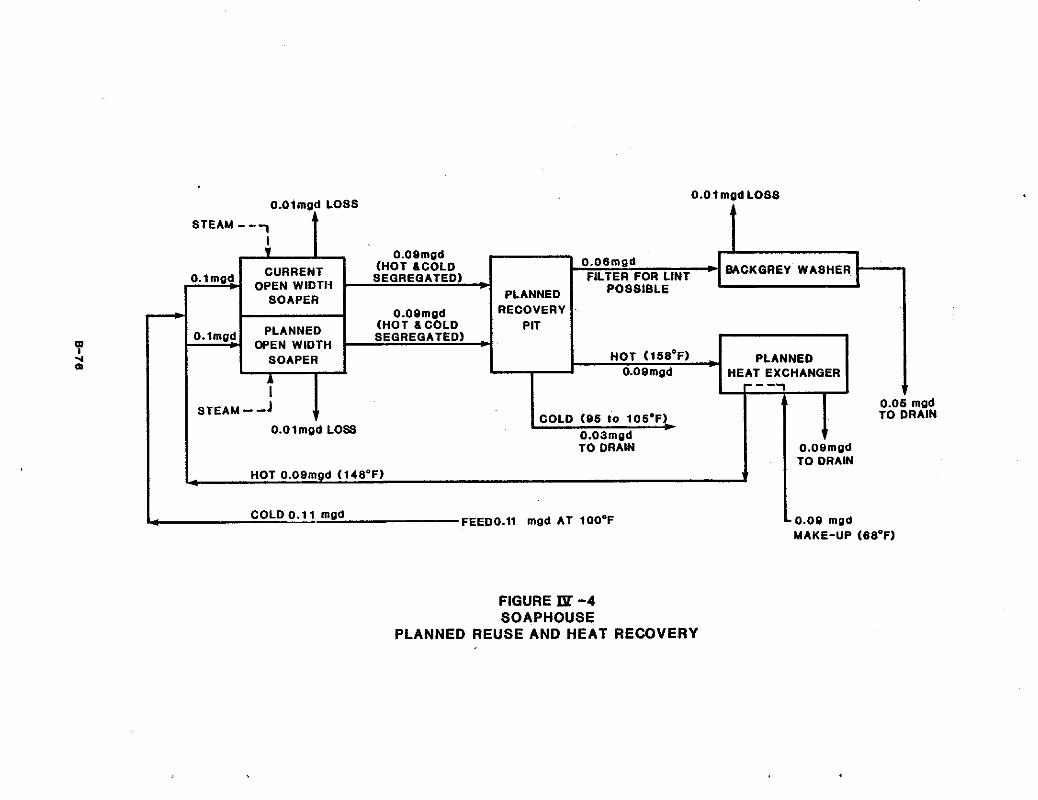
0.01mgd LOSS
t STEAM ---, I
CURRENT OPEN WIDTH
SOAPER 0.09mgd
(HOT 6 COLD SEGREGATED)
OPEN WIDTH SOAPER
t I-
0.08mgd (HOT &COLD
SEGREGATED)
0.Olmgd LOSS
t BACKGREY WASHER
POSSIBLE PLANNED RECOVERY
PIT I 1
I HOT (1SS'F) PLANNED HEAT EXCHANGER 0.091
A
STEAM - -1 ' 1 O.Olmgd LOSS
I FEEDO.ll mgd AT IOO'F COLD 0.1 1 mgd
O.OSmgd TO DRAIN
0.08 mgd
0.c TO
MAKE-UP (68OF)
FIGURE lY -4 SOAPHOUSE
PLANNED REUSE AND HEAT RECOVERY

greater than the 2 gallons per pound used at the open width soaper, and the relatively low concentrations of most pollutant parameters indicate that excessive dilution was occurring. The relatively clean effluent from washer 2 indicated that it had the potential for direct reuse at washer 1 and that the effluent of washer 3 also had the potential for reuse by a counterflow arrangement. Piping was in place for counterflow from washer 3 to washer 2 , but mill personnel stated the counterflow mode was not used.
Open Width Soaper. The potential for water reduction is not apparent from water use and wastewater data. The optimum mode of operation has not been identified by the mill. It is expected that it will operate in different modes to accomodate the variations in washing requirements for the incoming fabrics and color formulations.
Backgrey Washer. The potential for water reduction is again not apparent. The requirements for washing are too highly variable to plan a definite reduction.
Direct Reuse and Heat Recovery The mill has determined that the quality of the water used for
washing backgrey fabrics is not critical, because they aim only to remove gross deposits of excess color formulation. A thoroughly clean fabric is not necessary, and color is not an important parameter for these fabrics.
The segregated hot discharge from the soapers is expected to have a temperature of 158'F; and this provides the potential for heat recovery in a heat exchanger system. The heat exchanger technology is well established throughout industry; thus, discussion of its technical feasibility is not needed. The economics of its operation are discussed under Economic Feasibility.
Notes on Other Reuse o r TreatmentIRecycle The potential for direct reuse of soaphouse wastewater in
other mill processes is not apparent, because the color levels are typically too high even for equipment cleaning in the print room. It should also be noted that the soaphouse wastewater is too dilute in
B- 77

terms of a colloidal suspension to consider treatment such as coagula- tion/flotation. A bench scale coagulation test showed that coagulation was not effective for the dilute suspension normally encountered in the soaphouse wastewater, even though similar constituents from color for- mulations enter the wastewater. Other means of treatment were not considered because of the dilute nature of the colloidal suspension, and
no effective treatment has been documented to date. Mill personnel noted that occasionally white fabrics are
processed on the soaper, and the spray portion of the soaper may have the potential for reuse in the print room for equipment cleaning. This is intermittent and difficult to plan, so it is not included in the plans here.
TECHNICAL DESIGN CRITERIA The heat exchange system is projected to include a counterflow
plate and frame arrangement with the following characteristics:
Wastewater Feed 90,000 gpd, 158OF Fresh Water Feed 90,000 gpd, 68OF Fresh Water Output 90,000 gpd, 148OF Wastewater Output 90,000 gpd, 78OF Pressure Drop 6 psig Model: Tranter UX-216, UP-111, 304 stainless steel"
ECONOMIC FEASIBILITY The benefits, costs, and payback of recycle/reuse/heat
recovery of soaphouse wastewater are presented in Table IV-5. The basis for the development of cost and savings estimates is a s follows:
Wastewater discharge savings of $0.43/1,000 gallons
Soaphouse operates 250 dayslyear Counterflow heat exchanger is projected to raise incoming water temperature from 68°F to 148'F while soaper waste- water from washers drops from 158OF to 78°F. Electricity for pumping at $0.0743/Kwhr. Capital costs are estimated in 1982 dollars on the basis of vendor quotes and previous studies.
O Energy savings of $5.14 per million BTU
O
O
k Note that a complete evaluation of models has not been conducted; the model mentioned i s one of many possible models.
B-78

.-
TABLE IV-5 ECONOMICS OF SOAPHOUSE WASTEWATER RECYCLE/REUSE
Benefits
Water Savings (230,000 gpd) $ 25,000 Energy Savings 113,000 BOD Savings Negligible
Total Savings $138,000
Costs
Capital New Soaper Heat Exchanger Lint Filters Piping Pumps Storage Electrical Engineering Contingency
$650,000 7,000 5,000 4,500 5,000 3,000 4,000
3,000 1,000
Total Capital $683,000
Annual* O&M of Heat Exchanger $ 1,200 Pumping 200 Miscellaneous 1,000
Total Annual $ 2,400
Payback Period* = $683,000/$135,000 = 5.0 years
$: Benefit of increased productivity due to new soaper not included in this analysis. costs of old soaper.
O&M costs of new soaper assumed equal to O&M
B-79

Table IV-5 illustrates the potential for substantial savings in the soaphouse, primarily due to heat recovery. The payback period of five years does not include the benefits of increased productivity due to the new soaper.
The mill continues to study methods to optimize the soaping operation in the open width soapers, particularly in terms of chemical, energy, and water use. Further energy and water use benefits may result from other process changes. As stated earlier, the rope soaper has been abandoned, s o the economic analysis is based on the elimination of the rope soaper.
ENVIRONMENTAL EFFECTS Pollutant discharge is not expected to change significantly as
a result of recycle/reuse and manufacturing changes in the soaphouse, although the wastewater discharge decreases from 0.4 mgd to 0.13 mgd. Table 1-3 illustrates that the soaphouse pollutant loadings are a small percentage of the total, and the projected changes in the soaphouse are not expected to change the soaphouse pollutant discharge.
CONCLUSIONS O The planned changes in the soaphouse for water reuseLreduction
and heat recovery are promising and should result in substantial eco- nomic savings.
O Effects on pollutant discharge are expected to be negligible. Treatment for reuse in other areas of the mill is not pro-
mising because of the dilute nature of the wastewater. O Optimization of open width soaper operation may lead to
further water reduction and better potential for treatment and further reuse.
B-80

MILL SURVEY REPORT MILL W-4
WOVEN FABRIC PREPARATION ANJJ PRINTING
C-i

SUMMARY
Mill W-4, an integrated woven fabric finishing mill, conducts a variety of finishing processes that have been investigated for the potential applicability of wastewater recycle/reuse. Figure 1 illustrates the basic finishing processes, summarizes the findings of this investigation, and identifies further research needs. Table 1 illustrates the projected savings, costs, and paybacks associated with recyclelreuse options considered at this mill.
The most promising recycle/reuse options at this mill are: 1) reuse of the entire flow of water jet weaving wastewater at the looms and scour/desize washers; 2) dyebath reconstitution at two to four large dyeing machines; and 3) ultrafiltration for size recovery from the desize wastewater.
RECOMMENDATIONS It is recommended that the following research needs be
considered in future investigations: Water Jet Weaving Wastewater - Reuse at Looms and Scour/Desize Washers O A detailed investigation of piping requirements is needed to
establish the capital costs more definitely. The effects of reused wastewater on the looms and fabrics must be evaluated to show that damage is not likely from oils in the recycled water. Pilot testing of in-line filters should be conducted to evaluate the ability to remove o i l s that may occasionally enter the wastewater. Housekeeping procedures around the looms should be studied and an employee education program developed to promote better housekeeping so as to reduce the entry of oils into the wastewater.
Dyebath Reconstitution O A revised cooling/rinsing procedure needs to be developed and
tested so that spent concentrated dyebaths can be stored

U
e m
U
c 8 rl
.rl 0
al 4
1
Dl
m U
a
al U
4 2
.a 3 2 k e
d
m
Mrl
ou
YO
ao
ma
r rlrl
mm
r
dm
m
m
ww
$2
I I 0” e s .VI
m
.rl
0
Y a
U
a, rl
D
rl m m w
m
c-iii

Recycle/Reuse Scheme
TABLE 1
SUMMARY OF ECONOMIC AND ENVIRONMENTAL BENEFITS OF VARIOUS RECYCLE SCHEMES
- Annual Capital Payback Flow tduction Savings cost (Years) gpd % Total 11. I
Ultrafiltration
Size Recovery $217,000 $550,000 2.5 25,600 3
O Size Recovery & Oil Separation $119,000 $1,072,000 9.0 88,000 12
Dyebath Reconstitution $148,300 $ 65,000 0 .4 26,400 4
Dyehath Oxidation/Reuse $ 92,000 $430,000 4.7 216,000 29
Water Jet Weaving Water
O Reuse at Looms Si Washers $ 35,200 $ 26,000 0.7 150,000 20
O Reuse at Washers Only $ 7,800 $ 22,000 2.8 75,000 10
Terephthalic Acid Recovery $ 40,000 $100,000 2.5 1,200 1
.d.
Reduction I % Total
500 7
1,100 16
1,120 16
1,600 23

for reuse. The current overflow rinse procedure is not fully compatible with dyebath reuse.
O A convenient method for dyebath storage must be developed. O Testing of reused dyebaths must be conducted to determine any
adverse effects on dyeing quality. Sequencing of colors must be planned and tested for reuse. Actual chemical savings must be determined in reuse experiments.
Ultrafiltration for Size Recovery from Desize Wastewater The efficiency of the desizing operation and the effect of desizing on the chemical nature of the size must be' investigated in detail. The effects of a two-stage desizing procedure with a hot water stage followed by an alkaline stage should be evaluated with regard to size removal, size degradation, and water and energy usage. Pilot-scale testing should be conducted to identify the optimum membrane type and configuration and to develop flux data. Capital costs can then be more clearly established. Recovered size should be tested f o r effects on weaving efficiency, desizing, and dyeing.
c- v

TABLE OF CONTENTS
Summary . . . . . . . . . . . . . . . . . . . . . . . . . . ii Table of Contents . . . . . . . . . . . . . . . . . . . . . . . . vi
I . INTRODUCTION . . . . . . . . . . . . . . . . . . . . . . . . 1
Facility Description . . . . . . . . . . . . . . . . . 1 Manufacturing Processes . . . . . . . . . . . . . . . 1
Overall Mass and Energy Balances . . . . . . . . . . . 4
Evaluation of Recycle/Reuse Technologies . . . . . . . 11
I1 . ULTRAFILTRATION OF DESIZING/SCOURING WASTEWATER . . . Description of Manufacturing Process . . . . . . Description of Applicable Recycle/Reuse Methods Technical Feasibility . . . . . . . . . . . . . Technical Design Criteria . . . . . . . . . . . Economic Feasibility . . . . . . . . . . . . . . Environmental Effects . . . . . . . . . . . . . Conclusions . . . . . . . . . . . . . . . . . .
. . . 12
. . . 12
. . . 16
. . . 20
. . . 24
. . . 25
. . . 30
. . . 30
I11 . DYEBATH RECONSTITUTION . . . . . . . . . . . . . . . . . . 31
31 Evaluation of Potential for Dyebath Reconstitution . . 32
Environmental Effects . . . . . . . . . . . . . . . . 40
Conclusions . . . . . . . . . . . . . . . . . . . . . 40
Description of Manufacturing Process . . . . . . . . .
IV . CHEMICAL OXIDATION OF DYE WASTEWATER . . . . . . . . . . . 42
Description of Manufacturing Process . . . . . . . . . 42
Description of Applicable Recycle/Reuse Methods . . . 42
Technical Feasibility . . . . . . . . . . . . . . . . 45
Technical Design Criteria . . . . . . . . . . . . . . 46
Economic Feasibility . . . . . . . . . . . . . . . . . 46 Environmental Effects . . . . . . . . . . . . . . . . 50
Conclusions . . . . . . . . . . . . . . . . . . . . . 50
C-vi

TABLE OF CONTENTS (continued)
V . REUSE OF WATER JET WEAVING WASTEWATER . . . . . . . . . . 51 Description of Manufacturing Process . . . . . . . . 51 Evaluation of the Potential for Reuse . . . . . . . . 51
Environmental Effects . . . . . . . . . . . . . . . . 59 Conclusions . . . . . . . . . . . . . . . . . . . . . 59
VI . RECOVERY OF TEREPHTHALIC ACID FROM DENIER REDUCTION WASTEWATER . . . . . . . . . . . . . . . . . . . . . . . 61
Description of Manufacturing Process and Applicable RecyclefReuse Method . . . . . . . . . . 61
Technical Feasibility . . . . . . . . . . . . . . . . 61 Economic Feasibility . . . . . . . . . . . . . . . 64
Environmental Effects . . . . . . . . . . . . . . . . 65 Conclusions . . . . . . . . . . . . . . . . . . . . . 65
References . . . . . . . . . . . . . . . . . . . . . . . . : . . 66 AppendixA . . . . . . . . . . . . . . . . . . . . . . . . . . 67
c-vii

.

SECTION I INTRODUCTION '
FACILITY DESCRIPTION Mill W-4 is an integrated mill in the woven fabric finishing
sector of the textile industry. The mill produces finished woven fabrics for wearing apparel. Total production averages 500,000 pounds per week. Currently, 60 to 70 percent of production consists of
100 percent polyester fabrics from filament polyester fibers. Of the remaining production, 15 to 20 percent consists of polyester/wool blends, 10 to 15 percent consists of polyester/cellulose (cotton or rayon) blends, and a small percentage consists of a variety of modified polyester blends.
MANUFACTURING PROCESSES The mill performs .both dry and wet operations to prepare and
finish the incoming fibers. These operations are illustrated on the schematic in Figure 1-1. Dry operations (greige mill operations) consist of slashing and weaving. Wet operations include scouring, desizing, and dyeing.
Slashing & Weaving Greige mill operations consist of slashing and weaving.
Approximately 30 percent of total greige production consists of goods that are sized with acrylic sizes. The remaining '70 percent is not sized.
Weaving is done on both water jet and dry looms. Approximately half the greige production at this mill (30 percent of total production) consists of fabrics woven on 164 water jet looms, with the other half (30 percent of total production) woven on 373 traditional dry looms. The remaining 40 percent of total greige production is woven on water jet looms at a nearby mill of the same parent company.

I FIBER RECElVHG AND I
- VEN GREIGE GOODS FROM OTHER MILL 200,000 LBJWK.
BEAM PREPARATION 5- 90,000 LBJWK.
DYEING 600.000 LBJWK.
FINISHED FABRIC
FIGURE 1-1. MANUFACTURING PROCESSES
c- 2

Scouring and Desizing The woven greige goods are scoured and/or desized on two
continuous washers. As stated earlier, about 30 percent of total production contains size and is therefore desized. This percentage can vary with the seasons: more sized goods in lightweight fabrics for spring and summer; fewer sized goods in heavy weight fabrics for fall and winter
All the desizing occurs on washer number 1, and the mill generally is able to schedule long runs of sized fabric in order to segregate the desizing operation from scouring on this washer. Washer number 2 performs only scouring. The chemical formulations and procedures used on these washers will be described in more detail in the discussion of recycle/reuse technologies.
Dyeing ' Dyeing is performed in a batch mode on 19 pressure jet
machines. Although dyeing at this mill involves a great variety of procedures, the mill focuses on disperse dyebaths for 100% polyester, which comprises 60 to 70 percent of production. The mill projects that they may be processing more blends in the future, but 100% polyester dyeing is expected to predominate.
The other five major dyeing procedures involve disperse/acid dyeing of polyesterlwool blends (15 to 20 percent of production); dispersejdirect dyeing of polyester/cellulose blends (10 to 15 percent of production); disperse/ basic dyeing of polyester/modified polyester blends; basic dyeing of modified polyester; and acid dyeing of wool (polyester/wool blends), with the polyester fiber left undyed.
A more detailed description of the dyeing machinery and pro- cedures will be presented in the discussion of technologies for recycle/ reuse of dyebath wastewater.
All dyeing procedures are computer controlled. The mill's dyehouse office includes a computer system that displays the exact procedure being conducted at each dyeing mahcine, maintains a complete record of all the procedures used, and controls chemical additions, temperature, and cycle timing.
c- 3

D r y i n g
The mill dries the dyed fabric on three drying ranges. Drying is the final step in processing before inspection and packaging for shipment.
OVERALL MASS AND ENERGY BALANCES
Water Use and Characteristics Total water use at the mill averages about 800,000 gpd. The
major areas of water use at the mill are the processes of water jet weaving (150,000 gpd), scouring (78,000 gpd) and desizing (32,000 gpd), and dyeing (500,000 gpd). Minor water uses are for slashing, sanitary, boiler makeup, and general maintenance purposes (total 40,000 gpd). The overall water balance is illustrated on Figure 1-2.
A l l the incoming water i s purchased from the city. The portion used in water jet weaving and the boilers is softened at the mill from about 17 mg/l hardness to approximately 7.5 mg/l hardness, as CaC03. The rest o f the mill generally uses the city water after treatment through pressure filters.
Table 1-1 lists the quality of the general process and softened waters at the mill.
Wastewater Discharge and Characteristics The major sources of wastewater discharge are essentially
those named as the major water users. Some water is retained in the fabric after scouring, desizing, and dyeing. This is estimated to be 10
percent of the water used in these processes. See Figure 1-2 for the wastewater balance.
The mill recovers energy from all hot. wastewater discharges through a heat exchanger before final discharge. The heat exchange system i s described in more detail below in the section on energy usage.
Wastewater samples were collected and analyzed from the major wet manufacturing processes of water jet weaving, scouring and desizing, and dyeing, and of the mill's final effluent. The results for conven-
c- 4
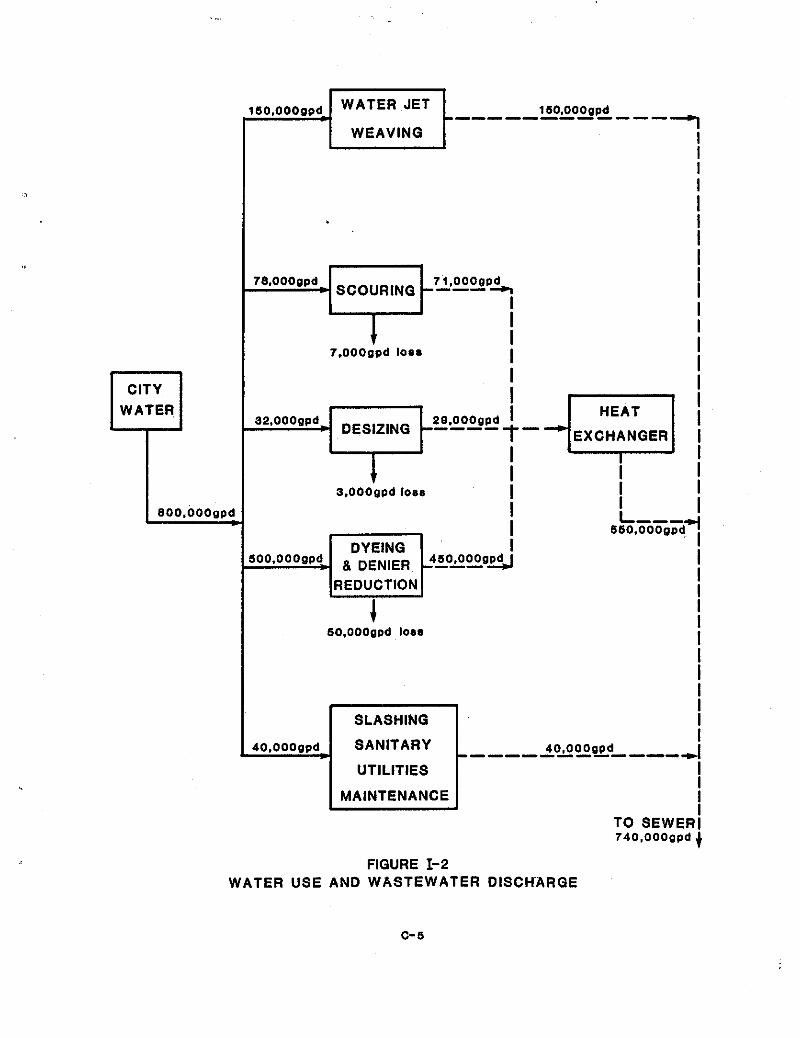
.^
WATER 7
160.000gpd -------------
I I
32.000gpd 4 I I
I I I I
I I I 3.000gpd loss I
I
\REDUCTION I 4
60.000gpd loss
SLASHING I ------------ J
UTILITIES I I
MAINTENANCE I I
TO SEWER1 740.000gpd 4
40,000gpd
FIGURE 1-2 WATER USE AND WASTEWATER DISCHARGE
c- 5
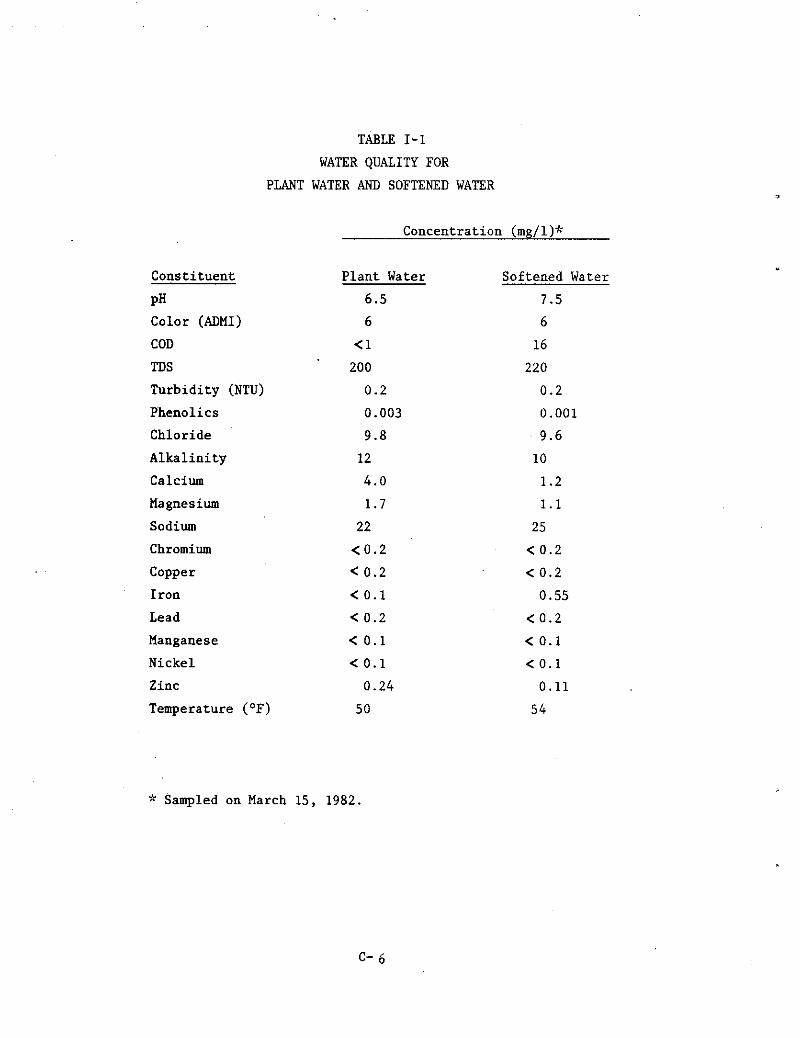
TABLE 1-1 WATER QUALITY FOR
PLANT WATER AMI SOFTENED WATER
Concentration (mg/l)*
Constituent
PH Color (ADMI) COD TDS
Turbidity (NTU) Phenolics Chloride Alkalinity Calcium Magnesium Sodium Chromium Copper Iron Lead Manganese Nickel Zinc Temperature (OF)
Plant Water 6 . 5 6
<1
200
0.2
0.003
9.8
12
4.0
1.7
22
<0.2
< 0.2
< 0.1
< 0.2
< 0 . 1
< 0.1
0.24
50
Softened Water
7.5
6
16
220
0.2
0.001
9.6
10
1.2
1.1
25
< 0.2
< 0.2
0 .55 < 0.2
< 0.1
< 0.1
0.11
54
* Sampled on March 15, 1982.
C- 6

tional and nonconventional textile pollutants are presented in Table 1-2
and discussed below. Table 1-3 presents pollutant loadings for the major wastewater streams. Table 1-4 presents results for all parameters analyzed in the final effluent. Other wastewater constituents that affect recycle are discussed below under the appropriate recycle technologies.
Energy Use and Types The major sources for energy at the mill are natural gas and
electricity. Natural gas, occasionally supplemented with fuel oil and propane, is used for space and water heating. Electricity is used for lighting and machinery operation throughout the mill. In 1981 the mill's average energy consumption was 28,000 million BTU per month from natural gas and 13,000 million BTU per month from electricity. Consumption varies with production and season, and the mill's records show that consumption in 1981 was about 18,000 BTU/lb, down from 27,000 BTU/lb in 1980.
It is interesting to note that water consumption per pound of product dropped from 24 gal/lb in 1980 to 17 gal/lb in 1981, showing the strong relationship between energy and water consumption.
An important factor in the mill's efforts to conserve energy is the use of a heat exchange system.
During a typical production period in March 1982, city water entered the heat exchanger at 50°F and was heated to 110°F by mill wastewater entering at 126°F. The wastewater left the exchanger at 66'F. The mill reported that the incoming city water is much warmer in the summer (77'F) thus enabling greater discharge temperatures for the plant water leaving the heat exchanger.
However, it must be noted that during the summer months, warm city water used in weaving must be chilled t o about 60°F for operation of the water jet looms.
Energy use and savings for individual processes will be discussed in more detail in the discussion of recycle/reuse technologies.
c- 7

TABLE 1-2 WASTEWATER CHARACTERISTICS
Was - ewater Source Date
Water Jet Weaving 3/15/82 3/16/82 Avg .
Desizing
Scouring
Denier Reduction 3/16/82
Dyeing 3/15/82 3/16/82 Avg .
Final Effluent 3/15/82 3/16/82
3/17/82 Avg .
Concentrations (mg/l)
BOD -
10
14 12
660
100
72
86
13,000
200
300 250
220
190 220
210
COD -
190 170 180
2,600
1,200 1,300
1,250
31,000
a30 2,000
1,415
1,300 1,100
1 ,000
1,130
TSS -
5 2 4
95
3 a 5
540
9
33 21
61
94
130
95
Phenolics
0.003
0.120 0.061
0.004
0.057 0.005
0.031
0.017
0.040
0.790 0.415
0.100
0.015 0.340
0.152
@ (S.U.)
7.0
6 . 6
10.1
8 .2 7.8 --
12.0
10.6
5 .1 -_ 8 . 3 7 . 2
7.2 -_
c- a

TABLE 1-3
POLLUTANT LOADINGS
Source
Water Jet Weaving
Desizing
Scouring
Dyeing n I W
Denier Reduction
Other*
Final Effluent
Flow - gallday
150,000
29,000
71,000
448,800
1,200
40,000
740,000
% total
20
4
10
61
1
5
100
BOD Ib/day
15
160
50
935
130
10
1,300
% Total
1
12
4
73
10
--
100
COD Ib/day % Total
225 3
630 9
740 10
5,300 74
310 4
(235) --
6,970 100
TSS Ib/day
5
23
3
79
5
475*
590*
% Total
4
20
3
69
4
--
100
* Miscellaneous streams such as utilities, maintenance, etc., plus unaccounted for balance.
Phenolics
0 . 0 8
0.001
0.02
1.55
0.0002
(0.71)
0.94
% Total
5
0
1
94
0
--
100
7%: Balance of suspended solids may be caused by precipitation of terephthalic acid from the denier reduction process caused by the lower pH of final effluent.

TABLE 1-4
FINAL EFFLUENT
Alkalinity (as CaC03) BOD - Total BOD - Dissolved COD TS TDS TSS Chloride Oil & Grease Phenolics Turbidity (NTU) Color (ADMI) Calcium Magnesium Chromium Copper Lead Nickel Zinc Sodium I r o n Manganese pH (S.U.) Temperature (OF)
Concentration, mgll
160 150 140
220 190 220
150 150 160
1,300 1,100 1,000
610 670
61 14
1,100
125 805
0.10
2 .4
1 . 8
< 0.2 < 0.2
< 0 . 2
<O.l 0.18
400
0.95 < 0 . 1
8.3 66
620 600
94
130 37
0.015
170
660
2 . 3 1.8
< 0.2 < 0.2
<0.2 < 0 . 1
0.15
160 1.1
< 0 . 1
7 .2
63
960
730 130
12
28 0.34
140
995 2.6
1 . 7 < 0 . 2 < 0 . 2
< 0 . 2 < 0.1
0.13
170 0.96
< 0 . 1
7.2 66
Source: Wastewater samples taken March 15 to 17, 1982.
c-10

EVALUATION OF RECYCLE/REUSE TECHNOLOGIES The areas at Mill W-4 that were selected for study of recycle/
reuse methods are the following:
0
Desizing wastewater - ultrafiltration f o r size recovery and water recycle Scouring wastewater - ultrafiltration for oil separation and water recycle Dyebath reconstitution Dyeing wastewater - oxidation for decoloring Water jet weaving wastewater - direct reuse at scour/ desize washers o r treatment and reuse in water jet weaving Denier reduction wastewater - recovery of terephthalic acid
Each of these is considered in detail in the following sections.
c-11

SECTION I1 ULTWILTRATION OF DESIZING/SCOURING WASTEWATER
DESCRIPTION OF MANUFACTURING PROCESS Approximately 29 percent of the greige goods to be finished at
this mill are sized with an acrylic size in preparation for weaving. The size is applied at 10 to 15 percent of the weight of the fabric and must be removed in the desizing operation to facilitate the dyeing operation. The remaining 71 percent of the greige goods do not contain size, but must still be scoured to remove oils, waxes, and other impurities on the fabric.
Currently the mill has two washers. All desizing is conducted on washer #l. Scouring of unsized goods also occurs on washer #l, and the mill states that these are the more "critical" goods. Scouring of
unsized "non-critical" goods occurs on washer #2.
Water and Chemical Use Flow schematics of the desizing and scouring operations are
shown in Figure 11-1. Water use is about 77 gpm o r 110,000 gpd. The bath chemicals employed for both scouring and desizing are
soda ash and mercaptan scour. The mill controls the chemical dosages for washer #l to maintain about 4 to 5 grams per liter of soda ash and 0.75 to 1 gram per liter of mercaptan scour. The dosages of chemicals on washer #2 are not carefully controlled. Mill data from a typical production week show a use of 6900 lbs of soda ash per week and 2300 lb/wk of mercaptan scour. This is a 3:l ratio, as compared to about 4:l on washer #l. This indicates the use of a different soda ashjmercaptan scour ratio in washer #2.
Wastewater Characterization Wastewater samples from scouring and desizing were collected
and analyzed. The results are shown in Table 11-1. Table 11-2 summarizes the amounts of the various chemicals remaining in the waste- water. The basis for these estimates is as follows. The wastewater
c- 12

DESIZED GREIQE GOODS 2e.O001b/day(avg.)
SCOURED GREIGE GOODS 2 I,OOOlb/day(avg.)
I_ - PLANT WATER
WASHER 1
A -
SODA ASH 4 to 6p / l WASTEWATER 40gpm
i MERCAPTAN SCOUR 0.76 to 1911
SCOURED GREIGE GOODS 60.0001b/dsy
3 gpm WATER RETAINED IN FABRIC
T PLANT WATER 3 3 9 ~ WASHER 2 2
WASTEWATER 3OOpm AMOUNTS NOT
MERCAPTAN CAREFULLY CONTROLLED
SODA ASH
FIGURE E-1 DESlZElSCOUR WASHERS
C-13

TABLE 11-1 WASTEWATER CHARACTERIZATION
DESIZING AND SCOURING
Concentration, mg/l
Alkalinity BOD COD TOC (% by weight) TDS TSS Chloride Pheno I i c s
Oil & Grease Turbidity (NTU) Color (ADMI) Calcium Magnesium Sodium Chromium Copper Iron Lead Manganese Nickel Zinc pH (S.U.) Temperature ( O F )
Desizing 2,200
660
2,600
0.26
5,100
95
40
0.004
93
280
630
2.6
2 .1
1000 < 0.2
< 0.2
0.73
< 0.2
< 0 . 1
< 0.1
0.15
10.1
167
Scouring
300
100
1,200
240
3
18
--
0.057
24
150
530
2.9
1 . 4
160
< 0.2
< 0.2
0.58
< 0.2
< 0.1
< 0.1
0.12
8 . 2
126
14
72
1,300 --
77
8 --
0.005
220
240
1470
2.5
1.5
23
< 0.2
< 0.2
0.28
< 0 . 2
< 0 .1
< 0.1
< 0.1
7 . 8
106
Source: Wastewater samples from March 15 to 17, 1982.
C- '14

TABLE 1-2 (continued) WASTEWATER CHARACTERISTICS
OTHER WASTEWATERS
Concentration (mg/l)
Wastewater Source __ Date - BOD - COD TSS - Phenolics pH (SUI
Raw Print 5/18/82 2,700 6,590 620 3.83 - Wastewater 5/19/82 3,400 10,300 5 40 9.33 -
Avg . 2,380 6,700 490 5.44 - 5/20/82 1,050 3,200 310 3.15 10.7
DAF Treated 5/18/82 550 1,080 220 1.54 - Effluent 5/19/82 680 2,300 350 1.38 5.1
5/20/82 1,000 2,200 992 1.87 5 .1 Avg . 740 1,860 520 1.60 -
Final Effluent 5 f 18/82 500 1,970 390 0.43 - 5/19/82 600 1,500 350 0.27 - 51'20182 1,050 1,650 550 0.58 9.3
Avg . 720 1,710 430 0.43 -
Source: Wastewater samples taken May 17 to 21, 1982.
B- 15

TABLE 1-3
POLLUTANT LOADINGS
Source __
Bleachhouse
Rope Range Desize Rope Range - Scour/
Open-Width Scour Open-Width Rinse Mercerizer Rinse
Total Bleachhouse
Soaphouse
Rope Soaperk- Wash 1 Wash 2 Wash 3
Total
Bleach
m I
u.
Open-Width Mode 1 Spray 1
Spray 2 Wash 1
Total
Flow#
mgd % Total
0.15 10.7 0.12 8.6
0.032 2 ..3 0.098 1.0 0.05 3.6
0.45 32.1
~
' BOD'
lh/day % Total
3,278 39.0 2,442 29.0
1,014 12.1 101 1.2
18 0.2
6,853 81.5
0.016 1.1 24 0.098 7.0 29 0.146 10.4
0.26 18.6 53
- ~ -
0.020 1.4 259 0.020 1.4 125 0.032 2.3 115
0.072 5 .1 499
~ - -
COD
lblday % Total
5,880 29.5 5,885 29.5
2,725 13.6 134 0.7 22 0.1
14.646 73.3
~
TSS
lb/day % Total
876 17.4 410 8.2
584 11.6 26 0.5
9 0.2
1,905 37.9
~
Phenolics
lh/day % Total
0.09 1 . 8 0.07 1.4
0.006 0.1
0.003
0.169 3.4
- - ~
0.3 80 0 .4 3.3 0.1 0.007 0.3 34 0.2 6.5 0.1 - - - - - - - - - - - - ~
0.6 114 0.6 9.8 0.2 0.007
3.1 591 3.0 10.5 0.2 0.05 1.5 315 1.6 9.3 0.2 0 .'03
0.6 0.31 1.4 528 2.6 28
5.9 1,440 7.2 41.8 1.0 0.39
- ~ - __ - __
0.1 -
0.1
1.0 0.6 6.2
7.8
-
Mode 2 Spray 1 0.0036 0.3 13 0.2 5 1 0.3 1.4 0.0 0.005 0 .1 Spray 2 0.0036 0.3 7 0.1 18 0.1 1.2 0.0 0.004 0.1 Wash 1 0.0048 0.3 22 0 . 3 58 0.3 2.6 0.1 0.016 0.3 Wash 3 0.006 - 0.4 - 25 0.3 - 80 0.4 12.0 0.2 0.014 0.3
Total 0.018 1.3 67 0.8 207 1.0 17.2 0.3 0.039 0.8
- ~ - ~ -
* Rope Soaper was abandoned subsequent to the field investigations and replaced by a new open width soaper.

TABLE 11-2 ESTIMATED CHEMICALS IN DESIZE
AM) SCOUR WASTEWATER
Chemical Quantity, lb/day Washer 1 Washer 2
Chemical D& Scour Scour
Soda Ash 663 442 63
Mercaptan Scour 166 110 16
Acrylic Size 2,516 - -
Spinning Oils 232 168 400
Source: Mill data on chemical use, discussions with mill personnel, and wastewater sampling data.

data for sodium (1,000 mg/l) and alkalinity (2,200 mg/l) indicate the amount of soda ash remaining in the desize wastewater. The values are used to estimate the amount of soda ash consumed in the operation, and the 4:1 soda ash/mercaptan scour ratio is used to estimate the amount of mercaptan scour remaining. The mill estimates that oils are present at about 1 percent of the weight of fabric, which would result in a 0.12 percent concentration of oils in the wastewater assuming they are completely removed in the washing. The scour wastewater data show that soda ash is applied at a lower and variable concentration based on
alkalinity values of 300 mg/l and 14 mg/l and sodium values of 160 mg/l and 23 mg/l.
A s stated earlier, about 29 percent of the total wet production is desized. The mill is capable of scheduling long runs of sized goods through washer #1 in order to segregate the desize from the scour wastewater. Thus, desizing occurs from 2% to 3 days per week, only on washer #l. The washer typically generates 40 gpm wastewater at 167'F, while washer #2 generates 30 gpm at 126" F. The continuous discharge from the washers drops into separate troughs below each washer, which lead to a pipe in which the washer discharges combine and flow into the main discharge pit in the mill before entering the heat exchanger.
The wastewater data in Tables 11-1 and 1-3 indicate that the desize operation contributes a substantial organic load to the mill's final effluent. As noted in Section I, this stream contributes 4 percent of the total flow, but 12 percent of the total BOD. This is attributable to the acrylic size, oils, and waxes that are removed in the operation. The scour wastewater data indicate that the organic load from this operation is also substantial, particularly due to the impurities being removed.
DESCRIPTION OF APPLICABLE RECYCLE/REUSE METHODS The alternatives for recycle consist of 1) recycle system for
the desize wastewater only, 2 ) recycle system for both scour and desize wastewater.

Alternative 1 - Ultrafiltration of Desize Wastewater The revised process under Alternative 1, including size
recovery system and water recycle, is illustrated in Figure 11-2. The objectives of the process are to: 1) remove excessive impurities and enable recovery o r reuse of valuable chemicals, particularly the size; 2) reuse energy and water; 3) reduce pollutant loadings and COD surcharge.
The essential means of accomplishing the objectives is through ultrafiltration, a low pressure membrane separation technique to con- centrate the valuable size and allow other bath chemicals (soda ash, mercaptan scour, defoamer) to pass through in the hot permeate and be recycled to the desize washer.
Desize wastewater is passed through a vibrating screen filter for gross solids removal before entering a continuous multi-stage feed and bleed ultrafiltration system (illustrated in Figure 11-3). The hot permeate from the system is returned to the desize bath, and the concentrated size is centrifuged (if necessary) for oil removal before reuse in the slasher. The removed oils may be stored for combustion in the boilers.
The technical and economic feasibility of this alternative is covered below under "Technical Feasibility" and "Economic Feasibility."
Alternative 2 - Alternative 1 Plus Ultrafiltration of Scour Wastewater Alternative 2 includes an ultrafiltration system for the
scouring wastewater, in addition to the desize wastewater, with similar objectives except to separate oils from the wastewater instead of size. Therefore, this part of the system will be known as the oil separation system. The recovered wastewater, containing the auxiliary chemicals, is recycled to the scour washer.
As discussed earlier, scouring is conducted on both washer #I and washer 82 for unsized goods, which represent 71 percent of production. Washer #I discharges 40 gpm at about 167'F for an average of two days per week, 24 hrslday, for unsized goods, and washer 112 discharges 30 gpm at about 126OF for five days per week, 24 hours/day, for unsized goods.
C- 1 7

ALSO BE USED HERE
10 apm
FIGURE II-2 SIZE RECOVERY SYSTEM
40 gpm t - 1
DESlZlNQ
BATH
3 dayslwk c
VIBRATING BALANCE
SCREEN TANK - * FILTER 100,000 gal
A 4 . (OPTIONAL) 18-17 gpmi
PERMEATE ULTRA- 20 gpm CONTINUOUS RETURN
FILTRATION 4 18 gpm
E TO DRAIN 4 D w I c9
BATH - F SYSTEM
CARTRIDGE FILTER FEED PUMP
WASTE OIL TO DRAIN

WASTE
FEED TANK
~
V b
PERMEATE
UF
STAQE 2 I RECYCLI
b
I RECYCLE UF
STAQE 3 b
CONCENTRATE v -
FIGURE It-3. CONTINUOUS MULTI-STAGE FEED & BLEED OPERATION
c - I S

The ultrafiltration system should be capable of handling the flow as described above, a total of 330,000 gallons/wk. The peak flow will be about 70 gpm, and the continuous average flow is about 45.8 gpm.
The oil separation system is illustrated in Figure 11-4. Scour wastewater passes through both a vibrating screen and cartridge filter before entering the continuous multi-stage feed and bleed ultrafiltration system. The permeate from the system is returned to the scour o r desize bath, and the concentrate is stored for subsequent combustion in the boilers. The expected oil content in the concentrate is 20,000 to 40,000 ppm.
TECHNICAL FEASIBILITY
Previous History Several full scale ultrafiltration size recovery systems have
been installed for recovery of PVA size and other synthetic sizes (WD, for example). Pilot testing for recovery of acrylic sizes has also been successful (Reference 1).
The two primary membrane configurations that have been successful are the tubular configuration sold by Gaston County Filtration Systems, Stanley, NC, and the spiral-wound configuration of Abcor, Inc., Wilmington, MA. A hollow fiber type has shown some promise at pilot and bench scale, but no full scale units have been installed. The spiral wound configuration exhibits a greater membrane area per unit volume than the tubular type, resulting in a smaller space requirement, but it is more susceptible t o plugging and fouling. Thus, it generally requires both a vibrating screen filter and a cartridge filter for prefiltration. Thus far, the useful life of the spiral-wound membranes has not exceeded 2 years, while the tubular system membranes have gone 7 years without fouling.
The tubular system requires a 100 to 150 mesh vibrating screen for prefiltration, plus somewhat greater surface area, floor space, and horsepower for higher flux rates. The membranes are installed in a 6 mm
ID carbon tube, which is unlikely to plug and has not plugged i n the full scale installations. The tubular membranes withstand a greater pH and temperature range than the spiral-wound and hollow fiber types.
c- 20

- 70 gpm max ( 46 gpm ava) 330,000 gallwk 30 gpm 5 dayslwk
+4O gpm 2 dayslwk BALANCE
SCOURING SCREEN w TANK FILTER 60,000 gal BATH
$0 mm TO SEE RECOVERY (3 dayslwk)
TO DRAIN
MAKEUP
I -
4ogpm . 2Q0,OOO OaWwk ULTRA- 46 gpm + ~' CONTINUOUS FILTRATION
SYSTEM PERMEATE
RETURN
45 gpm FEED PUMP CARTRlDGE
322.000 aailwk - FILTER - t TOMETER
TO DRAIN 5 gpm
32.000 gallwk CONCENTRATE
8000 gaWwk 1 mm
A CHEMICALS
TO BOILERS FOR COMBUSTION OR HAUL TO DISPOSAL
STORAGE I TANK I-* FIGURE R-4 OIL RECOVERY SYSTEM

The oil separation system is virtually the same as the,size recovery system but likely will include a cartridge filter before the ultrafiltration system. The reason for this is that pilot plant work for oil recovery has been successful with the Abcor spiral wound membrane configuration, as opposed to the tubular configuration of Gaston County Filtration Systems successful in size recovery systems.
And although the tubular unit was successful during the bench scale tests (see Appendix A), the spiral-wound configuration is the basis for the preliminary design of the oil separation system.
Volume 1 contains a detailed review of applications information for ultrafiltration.
Bench Scale Results ,
A bench scale test of ultrafiltration (UF) was conducted by Gaston County Filtration Systems to further evaluate the feasibility of UF at this mill for size and oil recovery. A brief description of their method and equipment is found in Appendix A.
Although phase separation was demonstrated in the desize and scour wastewater, the analytical results, shown in Table 11-3, indicate that a substantial portion of the size passes through the membrane. The indicators are the COD, which is reduced from 2600 mg/l in the waste- water to 1,100 mg/l in the permeate, and total carbon, reduced from 0.26 percent by weight in the wastewater to 0.16 percent in the permeate. In the scour wastewater, the COD was reduced from 1200 m g / l
to 40 mg/l in the permeate, further substantiating the opinion that size is passing through the membrane and oils are being separated.
Mill personnel and other consultants indicate that the acrylic size may be chemically altered in the hot alkaline conditions of the desizing bath, probably causing the molecular weight to drop substan- tially through breaking of carbon-carbon bonds with the interaction of
oxygen. It is difficult to assess the extent of size degradation due
to alkaline conditions based on the data available presently, because the time lag between sample collection, bench testing, and sample analysis was several days, and this time period can also contribute to size degradation in the wastewater.
c-22
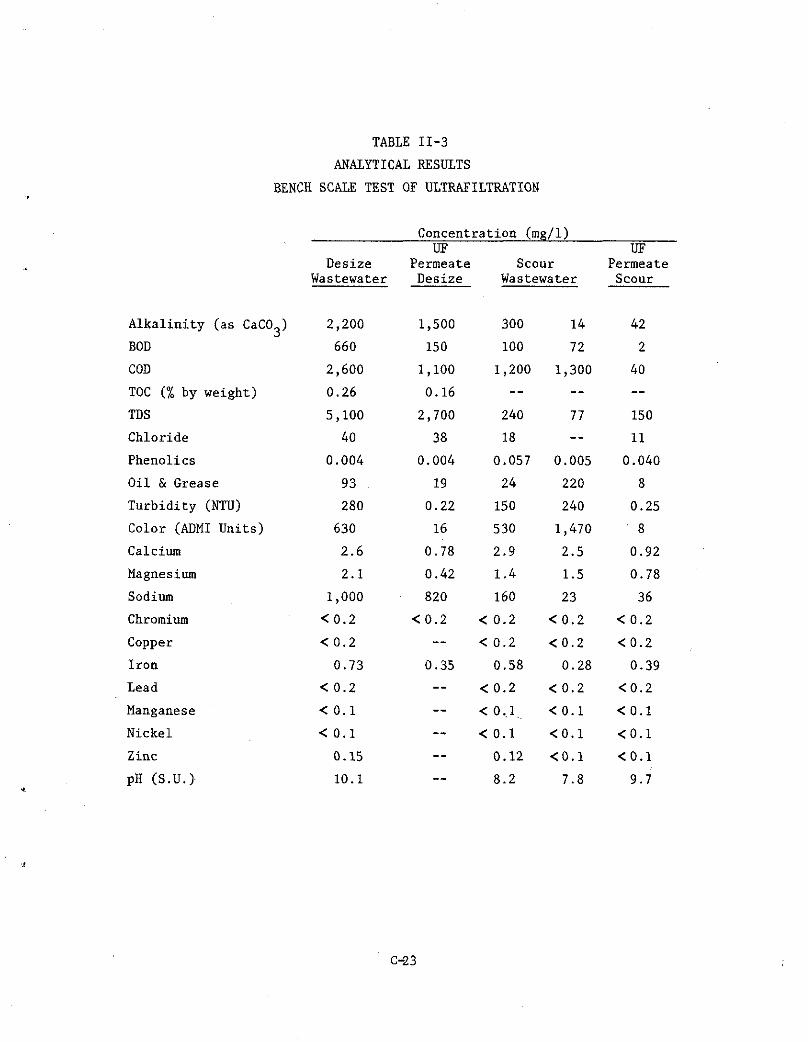
Alkalinity (as CaC03) BOD COD
TOC (% by weight) TDS Chloride Phenolics Oil & Grease Turbidity (NTU) Color (ADMI Units) Calcium Magnesium Sodium Chromium Copper Iron Lead Manganese Nickel Zinc pH (S.U.)
TABLE 11-3 ANALYTICAL RESULTS
BENCH SCALE TEST OF ULTRAFILTRATION
Concentration (mg/l) UF UF
Permeate Scour Permeate Desize Wastewater Scour
Desize Wastewater
2,200
660
2,600
0.26
5,100
40
0.004
93
280
630
2.6
2.1
1,000
<0.2
< 0.2
0.73 < 0.2
< 0 . 1
< 0 .1
0.15
10.1
1,500
150
1,100
0.16
2,700
38
0.004
19
0.22
16
0.78
0.42
820
< 0.2 --
0.35 -- -- -- -- --
300 100
1,200
240
18
0.057
24
150
530
2.9
1.4
160
< 0.2
< 0.2
--
0.58
< 0.2
< 0.1
< 0 . 1
0.12
8.2
14
72
1,300 -- 77 --
0.005
220
240
1,470
2.5
1.5
23
< 0.2
< 0 . 2
0.28
< 0.2
< 0 . 1
< 0 . 1
<0.1
7.8
42
2
40 -- 150
11
0.040
8
0.25
8
0.92
0.78
36 < 0.2
< 0.2
0.39
<0 .2
< 0 . 1
<0 .1
<0 .1
9.7
C-23

Further Technical Investigations In order to evaluate more thoroughly the technical feasibility
of size and oil recovery at this mill, the following investigations are recommended:
O Collect further data on size removal in the desizing operation to evaluate the efficiency of the operation, and to evaluate the possible alteration o r degradation of the size in the desizing operation due to alkaline and hot temperature conditions.
O Evaluate the usefulness of the recovered size by testing at the slasher and observing effects on weaving efficiency, desizing, and dyeing. Of special consideration is the effect of the suspected chemical alteration of the size due t o hot alkaline conditions.
O Investigate the effect on size removal, size degradation, and water and energy savings by varying the desizing procedure to include a hot water wash stage followed by a second stage alkaline wash.
O Conduct further testing of various membranes to identify the optimum membrane and develop flux data.
O Evaluate the usefulness of the recovered oils and their value as a fuel o r for reuse in fiber manufacturing.
TECHNICAL DESIGN CRITERIA
Alternative 1 - Ultrafiltration of Desize Wastewater In order to segregate the desize wastewater, the mill can
schedule long runs of sized goods through the washer for about 3 days per week.
The ultrafiltration system must take this into consideration. For example, though the average daily flow over a week would be 29,000 gpd (based on 29 percent of the total washer flow of 100,000 gpd, the peak desize wastewater flow at 40 gpm would be 57,600 gpd. Therefore, the storage capacity and ultrafiltration system capacity must be capable of handling this. The total flow of 40 gpm for 70 hours would be 168,000 gallons.
C- 24
,

In order to establish a preliminary design for the ultra- filtration unit, assumptions must be made on the expected flux value through the unit - this is to be more definitely established during pilot plant operation. Values in the literature<< range from about 30 to 100 gallons/ft2/day (GFD) depending on the temperature, inlet feed pressure, and membrane type and configuration.
Typically, at least an 8 hour holding capacity is recommended to allow independent operation of the washer and ultrafiltration system. Based on Gaston County Filtration Systems (GCFS) previous experience, they expect an overall flux rate of 30 GFD. Each GCFS loop contains 480
ft of membrane area, thus providing a flow capacity of 10 gpm per loop. GCFS expects that the mill can cut water use slightly from 8 lbs water per lb fabric to 6 o r 7 lbs water per lb of fabric; with this provision, and with provision of a 100,000 gallon storage tank, the UF system can be designed for 2 loops for optimum capital cost. Each loop will handle
10 gpm continuously.
2
Table 11-4 summarizes the design criteria for this recycle system.
Alternative 2 - Alternative 1 Plus Ultrafiltration of Scour Wastewater Preliminary design of the ultrafiltration system is based on
pilot plant work conducted by Abcor. Abcor carries a factory assembled system, No. 545, which is expected to recover 8,000 gallons of concentrate from the total flow of 330,000 gallons per week. The design criteria for this recycle system are summarized in Table 11-5.
ECONOMIC FEASIBILITY Cost savings from recycling desize and scour wastewater result
from water use savings, sewer surcharge savings, auxiliary chemical. savings, size recovery, and energy savings. Operating costs result from operation of the ultrafiltration system. Operating and cost savings were developed for the recycle of desize wastewater and for the recycle of scour wastewater. The basis for the costs and savings are as follows :
5: Literature references in Volume 1.
C-25
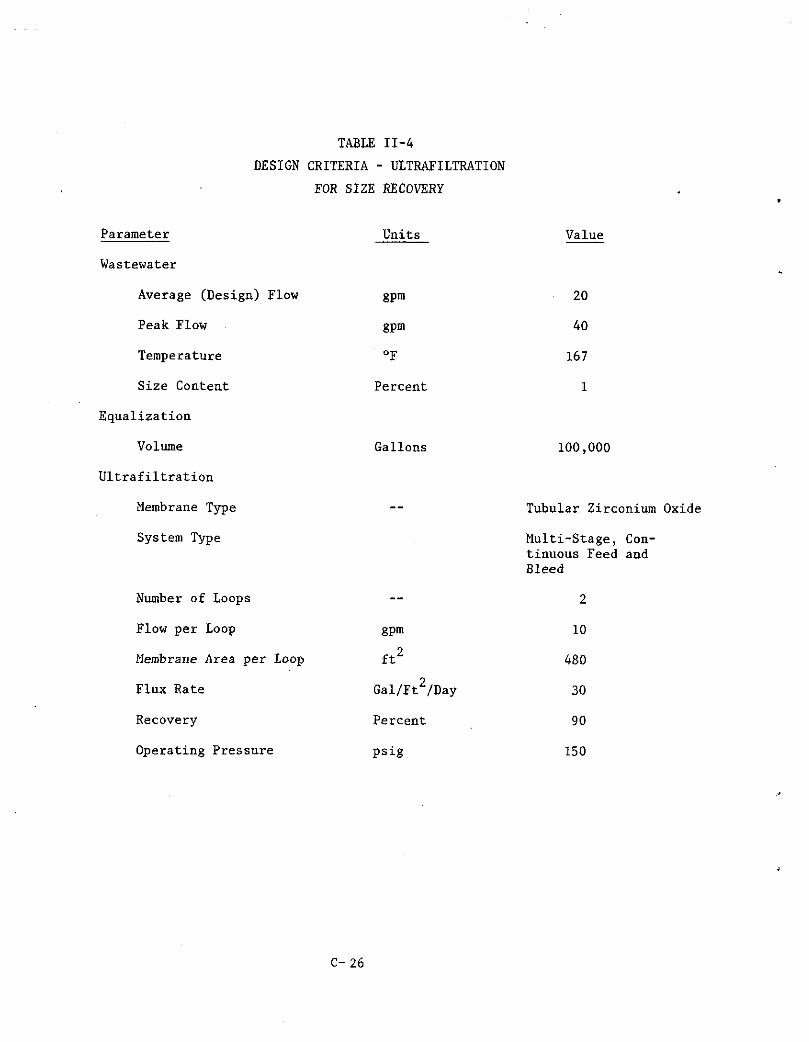
TABLE 11-4 DESIGN CRITERIA - ULTRAFILTRATION
FOR SIZE RECOVERY
Parameter
Wastewater
Average (Design) Flow
Peak Flow
Temperature
Size Content
Equalization
Volume
Ultrafiltration
Membrane Type
System Type
Number of Loops
Flow per Loop
Membrane Area per Loop
Flux Rate
Recovery
Operating Pressure
Units
gPm
gPm
OF
Percent
Gallons
n
ftL
Gal/Ft2/Day
Percent
Psig
Value
20
40
167
1
100,000
Tubular Zirconium Oxide
Multi-Stage, Con- tinuous Feed and Bleed
2
10
480
30
90
150
C- 26

TABLE 11-5 DESIGN CRITERIA - ULTRAFILTRATION
FOR OIL RECOVERY
Parameter Units
Wastewater
Average (Design) Flow @m
Peak Flow gPm
Temperature O F
Oil Content Percent
Equalization
Volume Gallons
Ultrafiltration
Membrane Type
System Type
Operating Pressure
Flux Rate
w i g 2 Gal/Ft /Day
- Value
46
' 70
167
0.1
30,000
Spiral Wound
Multi-Stage, Con- tinuous Feed and Bleed
50 -
* Flux rate must be determined by pilot testing.
C-27

0
0
0
0
0
0
0
0
0
costs.
Water and wastewater (volume) savings of $0.83 per 1,000 gallons. Wastewater surcharge savings of 3.3 cents per pound of COD for COD > 600 mg/l. Chemical savings of: 11.3 cents/lb soda ash
78 centsllb mercaptan scour 40 cents/lb acrylic size
Energy savings of $4.30 per million BTU. Ultrafiltration system capital and operating costs from information contained in Volume 1.
Other assumptions include the following: Desizing and scouring are conducted 250 days/yr. Ultrafiltration system is designed to recover 80% of the acrylic size. Eighty percent of the auxiliary chemicals in the wastewater are recycled to the washer in the permeate. Energy savings are based on the current situation of raising preheated plant water from 110°F to 167'F for washer #l and from llO°F to 126OF for washer #2.
Table 11-6 presents an analysis of these operating savings and
Estimated capital costs (June 1982) and the resulting payback periods for the two alternatives are as follows.
Capital Cost Annual Savings Payback (years) Recycle-Desize $550,000 $ 217,000 2.5 Recycle-Desize & Scour $1,072,000 $ 119,000 9
Note that there is no incremental payback for adding recycle to the scour wastewater, since the annual savings are lower for recycle of both desize and scour wastewater.
From Table 11-6 it is apparent that the recovery o f acrylic size is the item that makes recycle economically attractive, accounting for over 80 percent of the annual savings.
c-28

i
n I
N \D
TABLE 11-6 OPERATING SAVINGS FOR ULTRAFILTRATION
TREATMENT AM) RECYCLE OF DESIZE/SCOUR WASTEWATER
Water Use/Wastewater
COD Surcharge
Auxiliary Chemicals
Acrylic Size
Energy Savings
Recycle Operating Co.sts ($/yr)
Net Annual Savings (Slyr)
Desize __
25,600
5,300
500
3,100
41,000
2,000
201,300
6.4
6,200
($40,000)
$217,000
Washer 1
22,400
4,600
200
800
27,200
0
0
10.6
10,300
-
Scour Washer 2
40,000
8,300
400
1,500
3,900
0
0
5.3
5,200
~
Total ~
62,400
12,900
600
2,300
31,000
0
0
15.9
15,500
- ($160,000)
$119,000 for system with desize & scour

Current (1982) prices for various types of sizing agents are
as follows: PVA $ 1.20
CMC $ 1.00
Acrylic $ 0.40
Therefore, the above noted payback period for acrylic size is consistent with the reported payback periods of 9 to 18 months with more expensive
PVA and CMC sizes.
ENVIRONNENTAL EFFECTS The environmental effects of the ultrafiltration/reuse systems
can be estimated from Table 1-3. The most significant effects of reuse are the decreased organic load (BOD, COD) and suspended solids load.
It is uncertain what the effect of the ultrafiltration membrane will be on the final wastewater quality and whether any adverse effects will occur, such as dumps of concentrated solutions in cleanup that may contain priority pollutants such as metals. This is worthy of further technical investigation during pilot testing.
CONCLUSIONS O The technical feasibility of size recovery needs additional.
investigation at this mill because of suspected chemical degradation of
the size in desizing. ' Estimates of capital costs need to be better defined through
pilot plant testing to establish flux data. The economic feasibility is reasonably promising because of
the great savings in size costs. The situation would be much better at other mills that use more expensive sizes, such as PVA and CMC.
O The effects of ultrafiltration on final wastewater quality need further investigation.
Oil separation through ultrafiltration is not economically attractive unless a great value can be found for the oils.
c- 30

SECTION 111 DYEBATH RECONSTITUTION
DESCRIPTION OF MANUFACTURING PROCESS
General The mill performs a large variety of dyeing procedures in
order to fill all orders. All dyeing is performed on jet dyeing machines of various styles and capacities to allow for substantial flexibility. The various dye formulations break down to the following major types:
100 percent polyester - disperse dyes only. This represents 60 percent to 70 percent of production currently, but the market varies.
Modified polyester - cationic dyes only.
Polyester/modified polyester blend - disperse/cationic dyes.
O Polyester/wool blend - disperselacid dyes.
O Polyester/wool blend - acid dye only (polyester not dyed).
O Polyester/cellulose (rayon o r cotton) - disperse/direct dyes.
Mill personnel feel that blends will occupy a greater portion of their dyeing in the future though admittedly the market is somewhat unpredictable. However, most of the dye personnel feel that 100 percent disperse dyeable polyester will always occupy a large part of their production because this is where their experience and expertise lie.
Therefore, examination of the potential f o r dyebath recon- stitution will focus on the disperse dyeing portion of production.
t
- ..
c- 31

Production and Machinery Typical production at the mill is estimated to be
500,000 lbjwk, though mill capacity is approximately 750,000 lbslweek. Currently, 60 to 70 percent of production is 100 percent polyester (disperse dyeable), 15 to 20 percent is polyester/wool, 5 to 10 percent is polyester/cellulose, and the remaining portion is filled by polyester blends and modified polyester.
The current dyeing machinery is summarized in Table 111-1, along with the maximum number of cycles per day and the expected water use per cycle.
It should be pointed out that dye formulations are controlled by a central computer system, so that the dyeing personnel know the type of dyeing occurring in a particular machine at all times, as well as the status of the dyeing process with time. This system enables personnel to monitor and control the dyeing quality with relative ease, especially considering the complex nature of each formulation and the large variety of procedures.
EVALUATION OF POTENTIAL FOR DYEBATH RECONSTITUTION Discussions with mill personnel reveal that they are hesitant
to explore dyebath reconstitution at the mill, though they can foresee the benefits of it if their dyeing schedule allowed it. The scheduling of shades and dye types varies tremendously from day to day, and the mill must maintain flexibility.
Technical Feasibility Production information and the physical layout dictate that
the evaluation should focus on the 100 percent disperse dyeable polyester portion of production that is conducted in the six-port and three-port dyeing machines. The majority of the dyeing wastewater (88 percent) is generated in these machines, and the major portion of production in performed in these machines. Since there are seven (7) six-port machines and five ( 5 ) three-port machines, overall flexibility should not be significantly affected if several of these machines were allocated primarily f o r 100 percent disperse dyeing.
c- 32

TABLE 111-1 DYEING MACHINERY WATER USE
(1) No. Machines (1) Type of Machine
Six-Port Three-Port One-Port Four-Port Two-Port Hisaki FL-1 Hisaki FL-2
Total Maximum Water Use Typical Daily Water Use
Typical Wastewater Discharge
Water Use Pe T2FYcle Gallons
7,500
9,000 1,200 5,000 2,500 1,000 2,000
(3) Maximum Daily Water Use
Gallons
262,500 225,000 12,000 25,000
12,500 10,000
10,000
557,000 500,000 450,000
Notes:
(1) From Mill Layout
(2) Mill Personnel Estimates
(3) Calculated Value = No. Machines x 5 cycles/day x Water Use Per Cycle
C- 33

Studies at Georgia Tech (Reference 5) demonstrate the technical feasibility of the reconstitution of disperse dyebaths, as well as its applicability to jet dyeing machines. Volume 1 summarizes technical information on the applicability of reconstitution in dye houses.
Mill personnel provided detailed information on a predominant dyebath with 100% disperse dyes. For a 6-port jet dye machine, the following procedure is followed:
Fill with 1,500 gallons water at about 158OF Add 1,681 lbs of fabric (3,212 yards) Add dyestuffs and auxiliary chemicals, as shown below: 18 lbs ester based leveller 36 lbs lubricant/soil release finish 30 lbs defoamer, 7.5 lbs acetic acid (56 percent solution) pH control 8,525 grams (18.8 lbs) dyestuff A 8,855 grams (19.5 lbs) dyestuff B 7,928 grams (17.5 lbs) dyestuff C
The temperature is slowly raised to 250'F and maintained for 30 to 60 minutes, with monitoring to determine the end point of the process. The temperature is allowed to drop slowly to 158'F by means of an overflow rinse of about 6,000 gallons.
The dyeing process as described above is not particularly suited for direct reconstitution and reuse because of the dilution that occurs from the overflow rinse. Mill personnel have stated that a change in cooling and rinse procedures is probably technically feasible to allow for dyebath reuse. Mill personnel may be willing to test a procedure in which the concentrated dyebath is sent to storage and followed by a rinse with preheated clean water. They feel this rinse procedure will likely not adversely affect the quality of the dyeing. The one disadvantage of this revised procedure is that it would negate some of the potential energy savings from reconstitution. Another possibility is to let the dyebath cool naturally o r by heat exchangers to a temperature below the dye strike temperature.
c-34

Two basic methods of storage and reuse have been identified through the literature and field investigations. The first is that illustrated in Figure 111-1 in which the spent dyebath is pumped to a holding tank, analyzed spectrophotometrically, stored until needed, and then reconstituted for dyeing the next batch. The second procedure is to store the dyebath in the original machine and to transfer the fabric to another machine for rinsing.
The first method described above is seen to be most applicable to this mill because of difficulties in moving fabric between dye machines and the required slow cooling.
A s noted earlier, disperse dyeing of polyester has been demon- strated to be amenable to dyebath reconstitution. We feel, however, that testing is needed to verify that the quality of dyeing is not adversely affected by the change in rinse procedures. Testing would also indicate the permissible sequences of dye shades for scheduling on the machines.
Economic Feasibility Cost savings are realized in the areas of water use, waste-
water discharge, auxiliary chemical use, and energy. Additional operating costs will be incurred for dyebath pumping and rinse water preheating. Operating costs and savings were developed for three cases:
Case 1. Reconstitution on one 6-port and one 3-port machine. Case 2 . Reconstitution on two 6-port and one 3-port machine. Case 3. Reconstitution on two 6-port and two 3-port machine.
The basis for the costs and savings are as follows:
Water and wastewater (volume) savings of $0.83 per 1,000 gallons. Wastewater surcharge savings of 3.3 cents per pound of COD, for COD > 600 mg/l. Chemical savings of $ 0 . 0 2 2 per pound of fabric (see Table 111-2).
c- 35

I INSULATED HOLDING TANK
MAKEUP WATER AND CHEMICALS
SPECTROPHOTOMETRIC ANALYSIS DYE MACHINE *
PUMP PUMP
FIGURE m- 1 DYEBATH RECONSTITUTION SCHEMATIC
c- 38

Chemical Type
Leveller Lubricant Defoamer Acetic Acid Dyestuffs
TABLE 111-2 RECOVERABLE CHEMICAL VALUE IN PREDOMINANT DYEBATH
Total
Amount Price Recoverable lbs C/lb(l) % Exhaustion (2) Value (3)
18 72 20
36 63 80 30 87 20
7.5 14.5 20 95
$ 10.37 $ 4.54 $ 20.90
$ 0.87 --
$ 36.68
Recoverable chemical value per lb fabric = $36.68 + 1,681 lb = $ O.O22/lb fabric
Notes: (1) From Mill Records (2) Mill Estimate
(3) Calculated Value lbs x C/lb x (1 - Percent Exhaustion)
c- 37

O Energy savings and cost of $4.30 per million BTU. Capital and operating costs are explained in Volume 1.
Other assumptions include the following:
O Four dyebath drops are reconstituted per day f o r each machine ( 5 dyeing cycles).
O 6-port machine uses 1,500 gallons dyebath to dye 1,500 pounds fabric.
O 3-port machine uses 1,800 gallons dyebath to dye 1,800 pounds fabric.
O Reconstituted dyebath temperature is 158OF; plant water temperature is llO°F; energy savings based on difference of 48'F. Average COD of spent dyebath is 5,100 mg/l. Dyeing is performed 250 days per year.
O
Table 111-3 presents an analysis of these operating costs and savings.
Estimated capital costs (June 1982) for the three cases presented above are:
Case 1 $35,000 Case 2 $57,000 Case 3 $65,000
These costs include:
Insulated elevated storage tanks for dyebath storage. Related pumps and piping. Electrical service f o r pumps. Access platform at tanks. Spectrophotometer for dyebath analysis. Engineering design costs.
The resulting payback period for the three cases are as follows:
C-38

TABLE 111-3 OPERATING SAVINGS
FOR DYEBATH RECONSTITUTION
Case 1 Case 2 - Water/Wastewater (gpd) 13,200 19,200
($/yr) 2,700 4,000
COD Surcharge (Iblday) 560 820 (S/yr) 4,100 5 ,900
Auxiliary Chemicals ($/yr) 76,000 110,000
5 . 3 7.7 Energy Savings"(l0 BTU/day) (S/ur) 5,100 7,500
Energy Cost:: ( l o 6 BTU/day) 11.0 16.0
6
($/yr) (1 1,800) (17,200)
Operating Supplies (Slur) (4,000) (4,000)
Net Annual Savings ($/yr) 72,100 106,200
Case 3
26.400 5,500
1,120 8,100
152,000
-
10.6 10,300
22.0 (23,600)
(4,000)
148,300
7: Energy savings due to hot, recycled dyebath. for heated rinse water.
Energy cost due to need
C-39

Capital Cost Annual Savings Payback (months)
Case 1 $35,000 $ 72,100 6
Case 2 $57,000 $106,200 6
Case 3 $65,000 $148,300 5
As indicated on Table 111-3, the value of auxiliary chemicals in the reconstituted dyebath is the major area of cost savings. It would appear that to ensure a payback period of one year of less under the above defined cost basis, a minimum recoverable chemical value of about $0.013 per pound of fabric processed is needed.
ENVIRONMENTAL EFFECTS A s indicated on Table 111-4, the institution of dyebath
reconstitution on as few as two to four of the mill's 19 dye machines will result in significantly lower discharges of pollutants from the mill. The values in the table do not take into account the possible build-up in some pollutant concentrations in the dyebath caused by recycle, which would then be released in the final dyebath drop.
CONCLUSIONS ' Dyebath reconstitution has been shown to be feasible in
similar applications as this (disperse dyeing of polyester in jet dye machines).
' Only two to four of the dye machines should initially be dedicated for reconstitution in order to maintain dyeing flexibility.
' Significant environmental benefits can result from the institution of dyebath reconstitution.
The economics of reconstitution appear favorable: payback period of 5 to 6 months.
O Testing should be performed to verify the feasibility of a modified rinsing/cooling system, to verify that product quality is unaffected by dyebath reuse, and to verify the assumed auxiliary chemical savings.
C- 40

TABLE 111-4 ENVIRONMENTAL BENEFITS OF DYEBATH RECONSTITUTION
Case 1 Case 2
Flow Reduction ( w d ) 13,200 19,200 (% Total) 2 3
BOD Reduction ( W d a y ) 100 140 (% Total) 8 11
(% Total) 8 12 COD Reduction ( W d a y ) 560 820
TSS Reduction ( W d a y ) a (“6 Total) 1
12 2
Phenol ics Reduction (lb/day) 0.1 0.14 (% Total) 11 15
Case 3
26,400 4
200 15
1,120 16
17 3
0.2 21

SECTION IV CHEMICAL OXIDATION OF DYE WASTEWATER
DESCRIPTION OF MANUFACTURING PROCESS Dyeing at this mill is described in detail in the discussion
of dyebath reconstitution. For the purpose of discussion of chemical oxidation, consideration is given to the predominant dyeing type, namely, disperse dyeing of 100 percent polyester fabric, which comprises 60 to 70 percent of all dyeing at the mill. It is estimated that 60 percent of the wastewater generated in dyeing (450,000 gpd) results from the disperse dyeing, and this discharge of 270,000 gpd is the basis for examining design criteria and the economics of chemical oxdiation at this mill. The composite discharge temperature is about 10S°F, but individual baths may be discharged at about 158OF.
As shown earlier, the dye wastewater contributes the greatest pollutant load of all the processes to the final effluent, particularly COD. See Tables 1-3 and IV-1 for loads from the various processes and concentrations from dyeing.
DESCRIPTION OF APPLICABLE RECYCLE/REUSE METHODS The revised process schematic incorporating recycle is
illustrated in Figure IV-1. The 270,000 gpd of disperse dyeing wastewater are segregated so that auxiliary chemicals can be reused consistently, and fairly consistent treatment requirements can be experienced. Some piping and process control modifications are needed in order to be able to segregate the disperse dye wastewater.
The wastewater enters a series of treatment tanks in which it is decolored by chlorine oxidation, with pH adjustment by liquid caustic o r soda ash, and dechlorination by sulfur dioxide, sodium bisulfite, or sodium thiosulfate.
In order to avoid a build-up of impurities in the treated wastewater, a 20 percent blowdown is planned (54,000 gpd).
Decolored wastewater is filtered to remove particulates of 15 The treated waste- microns or larger that may contain additional color.
c- 42

CAUSTIC
A BLOWDOWN (TO SEWER) 37.S QPM
OXIDATION FILTRATION DISPERSE DYEING
V < - I S 0 GPM STORAGE
FIGURE1P-1. SCHEMATIC DIAGRAM OF DYE WASTEWATER DECOLORIZATION AND RECYCLE
c-43

TABLE IV-1
DYE WASTEWATER CHARACTERIZATION
Alkalinity Acidity
PH (SUI BOD
COD TS TDS TSS Chloride Oil & Grease Phenolics Turbidity (NTU) Color (ADMI) Calcium Magnesium Sodium Chromium Copper I ron
Lead Manganese Nickel Zinc Temperature ( O F )
Concentration, mg/l
170 10 0
0 0 180
10.4 5.0 4.8
200 300 1,700
830 2,000 11,000 420 20,000 2,900
240 670 ' 3,300
9 33 30 10 9.5 25
8,900 63 19 0.04 0.79 22.0
125 190 1,700
1,100 3,500 15,200 2.4 2.6 8.8
1.7 2.0 3.5
100 60 230
< 0 . 2 < 0.2 < 0 . 2 < 0 . 2 < 0 . 2 < 0 . 2
1 .5 0.89 1 .5 < 0.2 < 0.2 < 0.2 < 0 . 1 < 0.1 0.22
< 0 . 1 < 0 . 1 < 0 . 1 0.12 0.12 0.30
101 106 211
Source: Wastewater samples taken March 15 to 18, 1982.
c- 44

water is stored briefly before returning to the dyeing machines for dyebath makeup and for overflow rinsing. The final rinse of the goods would be with city water.
Since the wastewater has been decolored and filtered, there should be no problem with reuse for dyeing and thus, recycle should not affect the mill's need to maintain flexibility in dyeing schedules as with reconstitution (see Section 111). The quality of the water expected is discussed in more detail under Technical Feasibility.
Since it is expected that the chlorine oxidation system will require 1,000 to 3,000 square feet, it is envisioned that it will need to be located outside the dyehouse.
TECHNICAL FEASIBILITY
Literature and Previous Applications Investigation by Perkins et al. (Reference 4 ) and Textile
Systems, Inc. (TSI) have demonstrated that disperse dyes can be decolored by chemical oxidation. Both ozone and chlorine have been successful in producing'a water suitable for reuse in dyeing, and test dyeings over a series of reuse applications have been acceptable.
Oxidation has been shown to decrease the molecular weight of dye molecules by attacking amide and other molecular linkages, thereby destroying chromophoric groups and decoloring the wastewater.
Thus far, only oxidation by chlorine has been employed in full-scale applications for dye wastewater decolorization, and this has been primarily for acid dyes. Ozone has not been applied because of costs of generation, practicality, and safety hazards, but it may become more competitive as improvements are made.
A more detailed summary of the research and applications to date is found in Volume 1.
Bench Scale Results A composite sample of dyes and rinses was collected, and a
bench scale chlorination test was conducted. The test indicated that
c-45

while the dyes encountered in the sample were substantially decolored by chlorination, complete decolorization could not be achieved, even at very high dosages near 2500 mg/l C12.
It is likely that the composite was not representative of the dyes normally used at the mill, because the pH was above 10, as opposed to a typical dyebath of pH 5 .
Therefore, the results are not considered to be conclusive enough for demonstrating the technical feasibility of chlorine decolori- zation at this mill, and more extensive and controlled studies need to be conducted to determine the dyes that are amenable to chlorine decolorization and 'the expected dosage requirements.
TECHNICAL DESIGN CRITERIA The criteria developed in previous investigations by Perkins
et al. and TSI dictate a chlorine dose of 100 mg/l applied for about 30
minutes for adequate decolorization of disperse dye wastewater. Sulfur dioxide is used to reduce the residual chlorine, and liquid caustic is used to adjust the pH to about 8.0.
The system is sized to treat about 270,000 gpd. With a small safety factor, the standard system provided by TSI for 200 gpm is expected to be adequate.
Treatment tank capacity needs to be about three times the capacity for acid dye wastewaters, due to the slower reaction time for disperse dyes. Thus, the volume of the treatment tanks is about 27,000 gallons, based on 3 hours at- 9,000 gallons per hour.
Storage capacity for about two hours of average flow is typically suggested, which would result in a volume of 18,000 gallons.
Design criteria are summarized in Table IV-2.
ECONOMIC FEASIBILITY Cost savings are realized in the areas of water use, waste-
water discharge, COD surcharge, and auxiliary chemical use. Additional operating costs will be encountered both for labor and chemicals for the oxidation/recycle process.
C- 46

TABLE IV-2 DESIGN CRITERIA
DYEBATH OXIDATION/RECYCLE
Oxidation
Reaction Time minutes
Chlorine Dose mg/l lb/day
Reaction pH
Caustic Feed lb/day
Dechlorination
Sulfur Dioxide Dose mg/l
Reaction Time minutes lb/day
30
100
185 8.0
650
90
165 5
Total Treatment Capacity
gallons 27,000 hours @ avg. flow 3
Storage Capacity
gallons 18,000
hours @ avg. flow 2
Hydraulic Flow (average) 150
0.22
Design Flow 200
c- 47

Table IV-3 presents an analysis of the annual cost savings realized through dyebath oxidation and recycle. The basis for these costs and savings is as follows:
Water and wastewater (volume) savings of $0.83 per 1,000 gallons. Wastewater surcharge savings of 3.3 cents per pound of COD, for COD > 600 mgll. Auxiliary (dyeing) chemical costs of $0.022 per pound of fabric dyed. Treatment chemical costs of:
chlorine 8Cllb caustic 27C/lb
15C/lb s02 Treatment labor requirement i s 4 man-years. Capital costs are explained in Volume 1.
Other assumptions include the following: Water use savings are 80 percent, based on 20 percent recycle.
O Auxiliary chemical savings are 50 percent, COD reduction is 50 percent. No energy benefit is realized due to existing heat exchangers. Treatment chemical requirements are as given in Table IV-2.
O Dyehouse operates 250 dayslyear.
The estimated capital cost (June 1982) of an oxidation recycle system is $430,000, including costs for the reaction and storage tanks, chemical feed and control systems, piping, pumps, electrical service, and engineering costs. The resulting payback period is 4.7 years, based on the annual operating savings of $ 9 2 , 0 0 0 .
C-48

TABLE IV-3 OPERATING SAVINGS
FOR DYEBATH OXIDATION/REXYCLE
Water/Wastewater
COD Surcharge
Auxiliary Chemicals
Energy Savings
Oxidation Process Chemicals
Oxidation Process Labor
Net Annual Savings
216,000
45,000
1,600
4,000
172,000
0
( 5 4 , 0 0 0 )
(75,000)
92,000
c- 49

ENVIRONMENTAL EFFECTS The introduction of dyebath oxidation and recycle would result
in a decreased wastewater discharge of 216,000 gpd, or almost 30 percent of the plant total. In addition, the daily average discharge of COD would be reduced by 1,600 pounds, 23 percent of the plant total.
One area that requires further investigation is whether chlorinated organic compounds are formed during the chlorination process.
CONCLUSIONS The literature indicates that dyebath oxidation and recycle should be amenable to the dyeing operations at this plant. Bench scale tests indicated decoloring of the composite dyebath, but the tests are not considered as conclusive. Significant environmental benefits may be realized by recycle, but the potential formation of chlorinated organic compounds should be investigated.
O Testing should confirm that decolored dye wastewater can be reused without adversely affecting the quality of the dyeing
O The economics of chlorine oxidation do not appear favorable at this mill because of high capital costs and the relatively low value of recoverable chemicals. The fact that energy is not recovered because of an existing heat exchanger also detracts from the economic attractiveness of the technology. It is generally recognized that economies of scale can be realized, and equipment manufacturers usually recommend the system be considered for flows greater than 500,000 gpd.

SECTION V REUSE OF WATER JXT WEAVING WASTEWATER
DESCRIPTION OF MANUFACTURING PROCESS
Water Use and Wastewater Characteristics A softened water supply of about 150,000 gpd is used in the
operation of the water jet looms. The resultant wastewater is slightly contaminated with acrylic size and oils. Samples of the wastewater were collected and analyzed, and the results are shown in Table V-1. The flow schematic of the current water jet weaving process is presented in Figure V - 1 .
Two alternatives are worthy of consideration for reuse of this wastewater. The first would be complete recycle/reuse with direct reuse of 67 percent of the water at the water jet looms, and the remaining 33 percent at the scour/desize washers. The second alternative is partial recycle/reuse with 50 percent of the water reused at the scour/desize washers; the remaining 50 percent is sewered.
EVALUATION OF THE POTENTIAL FOR REUSE
Technical Feasibility Alternative 1 - Reuse in water jet weaving. The scheme under this
alternative is illustrated in Figure V-2. Under this alternative, about 2/3 (100,000 gpd) of the wastewater would be continuously recycled to the water jet looms with the other l/3 (50,000 gpd) reused at the scour/desize washers to avoid buildup of oils and solids in the water jet weaving water supply. This amount would be made up with softened and chilled clean water. This alternative would reduce the operation and maintenance of the softeners, because it is expected on the basis of the analytical results that hardness will not build up in the wastewater and repeat softening will not be required. Furthermore, the requirements for chilled water during summer months would also be reduced.
Reuse of this water in the desize/scour washers appears to be technically feasible based on a comparison of the water jet weaving wastewater with the effluent from the washers:
C- 51

TABLE V-1
WATER JET WEAVING FEED AND WASTEWATER CHARACTERIZATION
Concentration (mg/l) Softened Water Water Jet Wastewater
pH (S.U.) Color (ADMI) BOD COD TSS TDS Turbidity (NTU) Phenolics Chloride Alkalinity Calcium Magnesium Sodium Chromium Copper Iron Lead Manganese Nickel Zinc Oil & Grease Temperature (OF)
7.5 6
16 -
220 0 .2
0.001
9 .6 10
1 . 2 1.1
25 < 0 .2
< 0.2
0.55
< 0.2 < 0.1
< 0 . 1
0.11 -
54
6.5 to 1.1
80 12
180 4
71 32 0.061
9 .2 14 1 .2 1 .2
28 < 0.2
< 0.2
0.9 < 0 . 2 < 0 . 1
< 0 . 1
< 0 . 1
48
63
C- 52

FILTERED CITY WATER 160.000 QPD
WATER JET WEAVING
SOFTENING
1 CHILLING I 3 TO. SEWER
160,000 QPD
FIGUREP-1. CURRENT WATER JET WEAVING SCHEMATIC
c- 53

FILTERED CITY WATER 60.000 QPD
SOFTENING + CHILLING 01;1
WATER JET 80. F WEAVING
100,000 GPO
L O S S E S 10,000 QPD MAKEUP
80.000 QPD
HEAT EXCHANGE
SCOUR
WASHERS
100,000 QPD WASTEWATER-
STEAM INJECTION (OPTIONAL)
FtGURE Y-2. RECYCLE ALTERNATIVE 1 WATER JET WEAVING WASTEWATER
c-54

BOD COD TDS TSS Oil & Grease
Concentration, mgjl Water Jet Weaving Scouring Desizing
12 86 660 180 71
4 48
1 ,250 2,600 160 5,110
5 95 122 93
As noted previously, the water jet weaving wastewater contains only small amounts of size and oils from the weaving process, the same constituents being removed during washing. The temperature of the water jet weaving wastewater will have to be raised to 130 or 175OF for scouring o r desizing from 60°F, as compared to the current situation in which city water (assumed yearly average temperature of 70'F) is heated to these temperatures.
For reuse in weaving, the small amount of size in the water is not considered to be detrimental. The suspended solids concentration is also very low. One obstacle to this scheme is the inconsistency of the wastewater oil content, The range of the oil concentration is due to inconsistent housekeeping practices that allow machine oils to be dis- charged to the wastewater. These oils would likely damage the incoming fibers. For this reason, the scheme includes an optional cartridge type filter for use when machine oil spills are observed.
Alternative 2 - Reuse at the scour/desize washers. Mill personnel have been hesitant to reuse the water jet weaving wastewater directly at the looms, mostly because of the potential oils and solids problems. Therefore, an alternative scheme, as illustrated in Figure V-3, would be to reuse the wastewater only at the scour/desize washers. It is expected that about 75,000 gpd could be safely reused at the washers, as discussed above, using about 35,000 gpd of clean makeup water. The remaining 75,000 gpd of water jet weaving wastewater would be sewered.
In order to preheat the water from water jet weaving, the water would be passed through heat exchangers. Since the water jet water must be maintained around 60°F, the mill would again have to expend additional energy to chill and heat the water during the warmer season when incoming city water is often at a temperature above 80'F.
c- 55

FILTERED CITY WATER 150,000 QPD
I SOFTENING Q
CHILLING =I I
LOSSES 10,000 GPO
100,000 GPO SCOURIDESIZE 75.000 GPO
WASTEWATER- WASHERS
STEAM INJECTION (OPTIONAL)
FIGUREY-3. RECYCLE ALTERNATIVE 2 WATER JET WEAVINQ WASTEWATER
C-68

.
Economic Feasibility Recycle of water jet weaving wastewater to the looms results
in cost savings in the area of water use, wastewater discharge, water softening, and water chilling. Reuse at the desize/scour washers results in water use savings, wastewater discharge savings, but slightly greater costs in water heating due to the 60°F temperature of the weaving wastewater. Operating costs and savings were developed for the two alternatives just discussed:
Case 1. Case 2 .
Recycle to looms and desizelscour washers. Recycle only to desize/scour washers.
The basis for the costs and savings are as follows: Water and wastewater (volume) savings of $0.83 per 1,000 gallons.
O Wastewater surcharge of 3.3 cents per pound of COD, for COD> 600 mg/l. Water softening costs of 0.6 cents per 1,000 gallons (chemical cost).
O Water chilling cost of $1 per ton-day based on electricity at $O.O42/KW and 1 KW/ton cooling. Water heating costs of $4.30 per million BTU. O
Other assumptions include the following: Weaving is perdormed 312 days/year.
a Desizingjscouring is performed 250 days/year.
' Heating efficiency is 90 percent (hot water). Annual average city water temperature is 70°F, requiring 10°F cooling.
Table V-2 presents an analysis of these operating costs and savings.
Note that the COD surcharge actually increases due to recycle. This is because the reduced wastewater volume also reduces the amount of COD exempt from the surcharge.
c- 57

TABLE V-2 OPERATING SAVINGS
WATER JET WEAVING WASTEWATER REUSE
Water Savings (gal/day)
(S/yr)
COD Surcharge ($/yr)
Softened Water Savings (gal/day)
($/yr)
Chilled Water Savings (tons cooling)
(Slur)
6
($/yr)
Energy Cost (Reheating) (10 BTU/day)
Net Annual Savings ($/yr)
Case 1
150,000
38,800
(7,800)
100,000
200
29
9,000
4 . 2 (5,000)
$35,200
Case 2
75,000
19,400
(4,100)
0
0
0
0
6.3
(7,500)
$7,800
C- 58

Estimated capital costs (June 1982) and the resulting payback periods for these two cases are as follows:
Capital Cost Annual Savings Payback (years) Case 1 $26,000 $35,200 0.7 Case 2 $22,000 $ 7,800 2.8
The capital costs include a storage basin, pumps and piping, electrical service to the pumps, cartridge filter, and engineering costs. It is conceivable that the expense of piping installation may be more than envisioned in the capital costs estimated above due to unknown under- ground obstacles and other difficulties.
A s indicated on Table V-2, the major cost savings result from water savings. Despite the lack of chemical value in the wastewater, reuse of the total flow shows much .economic promise. A detailed evaluation of the piping and pumping needs should be performed to more closely estimate the capital costs, especially since piping and pumping are the major capital costs involved in the system.
ENVIRONMENTAL EFFECTS As discussed in Section I of this report, water jet weaving
represents a sizeable fraction of the mill's wastewater flow, but only a few percent of the pollutant load. Recycle and reuse of this stream, as described above, would result in the elimination of from 75,000 to 100,000 gpd wastewater. This represents approximately 10 to 14 percent of the total wastewater flbw.
CONCLUSIONS O Recycle of the total flow of water jet weaving wastewater
appear to be technically and economically feasible, but capital costs for piping and pumping need to be investigated in more detail.
c- 59

O The poor economics of partial reuse are due to the fact that the wastewater contains little o r no reusable chemical value or heat value, and the reuse of about half the flow does not provide enough water savings. Testing must be performed to ascertain that the water jet weaving wastewater can be reused without causing damage to the looms and the fabrics. This testing should include testing of in-line filters for removal of oils.
O The mill should be attentive to controlling the entry of machine oils in the wastewater. An employee education program could be geared toward promoting general good housekeeping procedures around the looms.

SECTION VI RECOVERY OF TEREPHTHALIC ACID FROM
DENIER REDUCTION WASTEWATER
DESCRIPTION OF MANUFACTURING PROCESS AND APPLICABLE RECYCLE/REUSE METHOD Denier reduction is a batch process that reduces the weight of
the polyester fabrics by means of a caustic treatment prior to dyeing. The objective is to produce a "synthetic silk" product. In this process, the constituents of the polyester fabric are broken down to terephthalic acid, ethylene glycol, and other by-products. The resulting wastewater generally has a high COD and pH and contains 1 to 1.5% terephthalic acid. Table VI-1 presents the results of wastewater analyses of this stream.
The frequency with which the process is performed varies each week, and mill personnel report a range of denier reduction wastewater discharge from 6,000 to 35,000 gallons per week.
The mill is interested in recovering and marketing the tere- phthalic acid. The method for recovery, as illustrated in Figure VI-1, involves a pH adjustment to about pH 4.5 to precipitate all the dissolved terephthalic acid (TPA). Subsequently, the supernatant must be decanted and the TPA dewatered. The resulting powdered TPA solids likely will not be pure enough for reuse in fiber manufacturing, because 99.9 percent purity is required (Reference 3 ) . There is a possibility that it could be purified enough to be used in the manufacture of alkyd resins, but the product must be very low in metals content (less than 2 ppm) for this use. Sodium may be a problem, because the TPA is dissolved in the caustic bath used in denier reduction.
The oil well service industry uses a variety of acids in formation, stimulation and fracturing, and the mill sees this as a possible market (Reference 2).
TECHNICAL FEASIBILITY The method of treatment to recover TPA will depend on the
requirements of the market. The preliminary design is subject to much revision and testing, but it is presented to provide a rough idea of the
C-61

TABLE VI-1 WASTEWATER CHARACTERISTICS
DENIER REDUCTION
Alkalinity (as CaC03) BOD COD TS TSS Turbidity (NTU) Chloride Oil & Grease Phenolics Calcium Magnesium Sodium Chromium Copper I ron
Lead Manganese Nickel Zinc pH (S.U.) Temperature (OF)
Concentration (mg/l)
9,900
13,000
31,000
22,000
810
1,000
170
< 2.5
0.017
2.0
1.0
5,400
< 0 . 2
< 0.2
0.35
<0.2
0.26
0.12
0.16
12.0
200
Source: Wastewater sample collected March 16, 1982.

CAUSTIC
FINISHED FABRIC DYE
MACHINE
QREIQE FABRIC PREPARED FOR DYEINQ
w DYE WASTEWATER
-
4
EQUALIZATION
TANK AND PRECIPITATION - SUPERNATANT
REUSED IN
DENIER I REDUCTION WASTEWATER 6.000 QPD I
SULFURIC ACID-i I
I OR FILTRATE
RECOVERED TPA 1.200 QPD I
DEWATERING
RECOVERED TPA 780 L0.IDAY
AT 20 TO 30% SOLIDS
FIQUREPI-1- TEREPHTHALIC ACID RECOVERY SYSTEM
C-63

costs of TPA recovery and the approximate range of breakeven prices for the recovered product. The basic scheme, as illustrated in Figure VI-1, is to adjust the pH to about 4.5 with sulfuric acid. A bench scale test inidicated that this will precipitate the terephthalic acid, leaving a clear ( C1.0 NTU turbidity), colorless supernatant. The supernatant, however contains a very high level (5,100 mg/l) dissolved solids due to the caustic used in denier reduction and the acid used for neutraliz- ation. This rapid buildup of dissolved solids would limit the number of reuse cycles of the supernatant to probably 2 or 3 .
The use of acidic dye wastewater was also considered for neutralization, but this is judged as not feasible due to the low amount of acidity in the dye wastewater (180 mg/l) compared to the alkalinity (9,900 mg/l) of the denier reduction wastewater.
The settled solids resulting from precipitation will have to be dewatered, the degree depending on market requirements, such as moisture content and hauling costs. A centrifuge or filter press would be used for dewatering.
ECONOMIC FEASIBILITY The amount of terephthalic acid that can be recovered from the
wastewater is estimated to range from 200 to 1,100 pounds per day, with an average of 790 pounds. Based on an estimated maximum value of 20
cents/pound, the annual value of recovered TPA is only $40,000. Water and energy savings total $4,000 per year, and the COD surcharge is lowered by $10,000.
Operating costs are estimated dt $4,000 annually for sulfuric acid neutralization and $10,000 for TPA dewatering. Thus, the net annual savings is $40,000.
The capital costs for acid feed and dewatering equipment could easily exceed $100,000, with most of this amount for dewatering. Thus, even with an optimistic estimate of the value of the recovered TPA, the payback period is at least 2.5 years.
C- 64

ENVIRONMENTAL EFFECTS The reuse of denier reduction wastewater following removal of
the terephthalic acid would have little effect on the total volume of wastewater discharge from the plant (i.e., less than 1 percent reduction). The amount of COD reduction, however, is significant, estimated at an maximum of 1,300 lb/day, or about 19 percent of the plant total. Note, however, that during our field investigation, the denier reduction wastewater accounted for only 4 percent of the total COD (see Section I).
CONCLUSIONS o Technically, the recovery of terephthalic acid from denier
reduction wastewater is a relatively simple operation consist- ing of batch precipitation, decanting, and dewatering.
o Economically, the uncertainty of a specific market and value for the recovered product, along with the small amount of
product involved, make this technology look unpromising.
C- 65
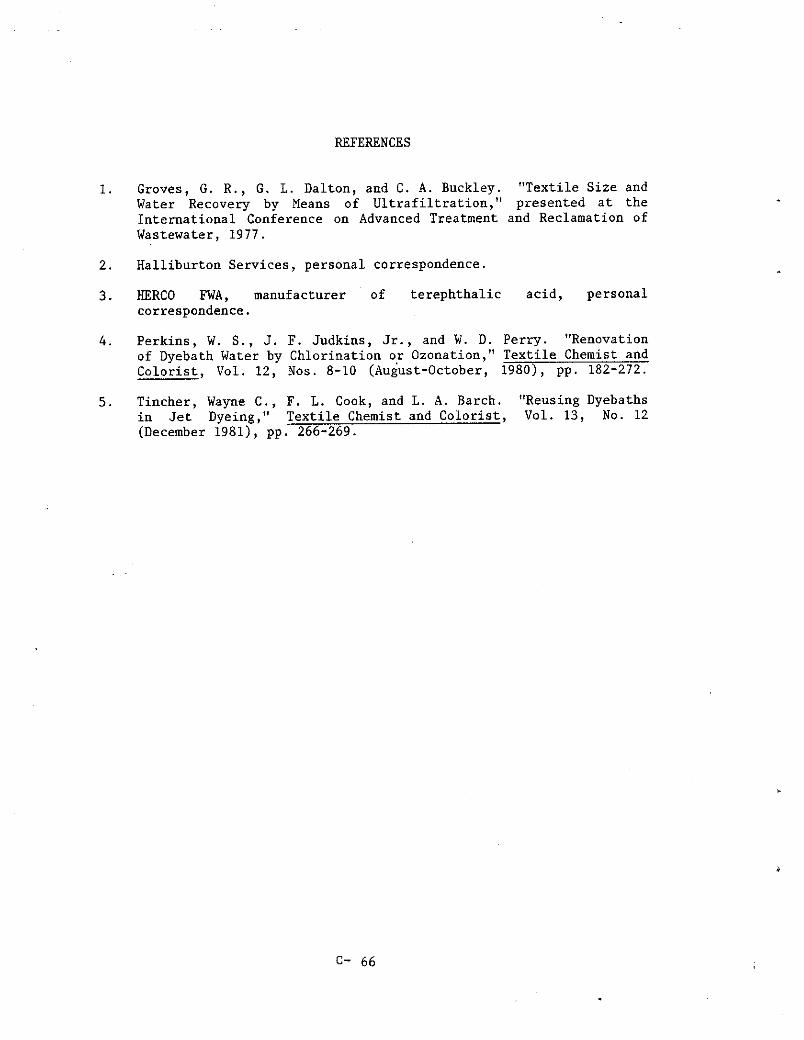
REFERENCES
1. Groves, G. R., G. L. Dalton, and C. A. Buckley. "Textile Size and Water Recovery by Means of Ultrafiltration," presented at the International Conference on Advanced Treatment and Reclamation of Wastewater, 1977.
2. Halliburton Services, personal correspondence.
3. HERCO FWA, manufacturer of terephthalic acid, personal correspondence.
4 . Perkins, W. S., J. F. Judkins, Jr., and W. D. Perry. "Renovation of Dyebath Water by Chlorination or Ozonation," Textile Chemist and Colorist, Vol. 12, Nos. 8-10 (August-October, 1980), pp. 182-272.
5. Tincher, Wayne C., F. L. Cook, and L. A . Barch. "Reusing Dyebaths in Jet Dyeing," Textile Chemist and Colorist, Vol. 13, No. 12 (December 1981), pp. 266-269.
C- 66

APPEM)IX A
Report on Bench Scale Ultrafiltration Tests Conducted by Gaston County Filtration Systems - Lab Engineer - David Boyles.
Summary: Gaston County Filtration System (GCFS) conducted a series of
bench scale tests of their ultrafiltration system to demonstrate the ability to separate phases in the following wastewater streams:
1) 2) Desize wastewater - size and oil separation (3/18/82)
3) Denier reduction wastewater - terephthalic acid separation
Scour wastewater - oil separation (3/15/82)
(3/15 & 3/22/82)
Separation was achieved for the scour and desize wastewater, while the denier reduction wastewater required pH adjustment to appzoxi- mately 4.5 to achieve separation. The pH adjustment causes the tereph- thalic acid to precipitate, so that the UF system functioned actually as a concentration method rather than separation method.
DESCRIPTION OF TIE BENCH SCALE UF UNIT The GCFS portable bench scale UF unit consists of a single
loop system with pump, zirconium oxide membrane installed in a UF module, and piping to allow for concentrate recycle and permeate discharge until desired TS levels are found in the concentrate.
The zirconium oxide membrane is capable of withstanding a wide pH and temperature range without fouling problems.
All tests were conducted on samples with their temperature brought up to the approximate temperature of the process, i.e., 180°F for scour/desize wastewater, 200'F f o r denier reduction wastewater.
PILOT SCALE TESTING GCFS can conduct pilot scale testing of a UF unit f o r a
minimum period of six weeks, and a cost of about $350.00 per week.
C-67


MILL SURVEY REPORT
MILL W-8
WOVEN INDUSTRIAL FABRIC FINISHER
D-i

SUMMARY
Mill W-8, a commission finisher of woven fabrics, uses several manufacturing processes that have been investigated in this study for the potential applicability of wastewater recycle/reuse methods. Figure 1 illustrates the basic processes, summarizes the findings, and identifies further research needs. Table 1 summarizes the projected savings, costs, and paybacks associated with the recycle/reuse methods considered at this mill.
The most promising recycle/reuse techniques at this mill are:
1. Countercurrent rinsing and/or water use reduction on the rope washers, open width desize range, and sulfur black dye range.
Dye recovery by hyperfiltration at the sulfur black dye range. 2;
RECOMMENDATIONS It is recommended that the following techniques and research
needs be pursued for recycle/reuse of wastewater at this mill:
1. Countercurrent rinsing and water use reduction should be tested to determine effects on fabric quality and manufacturing processes at the rope washers, desize range, sulfur black dye range, and possibly other preparation ranges not investigated in this study.
2 . Pilot tests of hyperfiltration at the sulfur black dye range should be conducted to confirm the technical and economic feasibility of the technology., In particular, the following research efforts should be undertaken:
a.
b.
c.
d.
Determine the actual quantity of dye that can be recovered.
Confirm the suitability of reusing the recovered dye
Confirm the suitability of permeate for reuse.
Examine the buildup of impurities in the recovered dye and the permeate to determine the necessary blowdown.
D - i i

MILL W-8
JDESIZING I--4 SULFUR BLACK DYEING~-+ STARCH FINISHING~
Technologies Evaluated
Rope Bleachery Countercurrent Rinsing
Feasibility Technical Economic Data Needs
Feasible Promising Testing
Desize Range u Countercurrent Rinsing Feasible Promising Testing v. Size Recovery by Not Promising Not Promising I
b’. Hyper/Ultrafiltration _ _ w.
Sulfur Black Dye Range Countercurrent Rinsing Feasible Promising Testing Sulfur Black Dye Recovery Feasible Promising Pilot Scale Test by Hyperfiltration
FIGURE 1

TABLE 1
SUMMARY OF ECONOMIC AND ENVIRONNENTAL BENEFITS OF VARIOUS RECYCLE SCHEMES
Recycle/Reuse Scheme
Countercurrent Rinsing at Rope Bleachery
Net Annua 1 Savings Capital (Costs) ~ cost
$ 43,000 -0-
7 Desize Range - Countercurrent $ 1,000 -0-
(1 ) -- -- Sulfur Black Dye Range - Counter- $ 2,000 -0-
7 Rinsing Size Recovery
current RinsingjFlow Reduction Dye Recovery $158,000 $470,000
Payback (Years)
Immediate
Immediate
-- Immediate
3 .0
Flow Reduction BOD Reduction g@ % total lb/day % total
85,000 22 -0- -0-
5,000 1 -0- -0-
-- -- -- _- 8,000 2 -0- -0-
29,000 7 960 9
(') Determined to be technically unfeasible

TABLE OF CONTENTS
. Summary . . . . . . . . . . . . . Table of Contents . . . . . . . .
. . . . . . . . . . . . . . . . . ii
. . . . . . . . . . . . . . . . . V
I . INTRODUCTION . . . . . . . . . . . . . . . . . . . . . . . . . 1
Facility Description . . . . . . . . . . . . . . . . . . . 1
Manufacturing Processes . . . . . . . . . . . . . . . . . 3
Overall Mass Balance . . . . . . . . . . . . . . . . . . . 4 8 Evaluation of Recycle and Reuse Technologies . . . . . . .
I1 . ROPE BLEACHERY . . . . . . . . . . . . . . . . . . . . . . . . 13
Description of Manufacturing Process . . . . . . . . . . . 13
Evaluation of the Potential for Reuse . . . . . . . . . . 13
Environmental Effects . . . . . . . . . . . . . . . . . . 16
Conclusions . . . . . . . . . . . . . . . . . . . . . . . 16
I11 . SIZE RECOVERY BY ULTRAFILTRATION/HYPERFILTRATION . . . . . . . 18 Description of Manufacturing Process . . . . . . . . . . . 18 Evaluation of the Potential for Reuse . . . . . . . . . . 18
Environmental Effects . . . . . . . . . . . . . . . . . . 23
Conclusions . . . . . . . . . . . . . . . . . . . . . . . 23
IV . SULFUR BLACK DYEING . DYE RECOVERY BY KYPERFILTRATION . . . . . 25
25 Description of Manufacturing Process . . . . . . . . . . . Proposed Modification of the Dye Range Operation for Reuse . . . . . . . . . . . . . . . . . . . . . . . 28
Technical Feasibility . . . . . . . . . . . . . . . . . . 28
Economic Feasibility . . . . . . . . . . . . . . . . . . . 30
Environmental Effects . . . . . . . . . . . . . . . . . . 32
Conclusions . . . . . . . . . . . . . . . . . . . . . . . 32
Appendix A . . . . . . . . . . . . . . . . . . . . . . . . . . . . 33
D-v


SECTION I INTRODUCTION
Recycling and reusing process wastewater can be an important method for reducing the quantity of pollutants discharged from textile mills. Of equal importance to the textile industry, recycle and reuse can save money by recovering process chemicals, saving hot water, and lowering the sewer use charges of indirect dischargers. Recycle and reuse are not yet in wide-spread use, though in recent years, recycle and reuse technologies have been gaining recognition as a method to save money as well as reduce the discharge of pollutants. In order to encourage this development further, this report examines the technical and economic feasibility of recycle and reuse technology at Mill W-8, a woven fabric finishing mill.
The report begins with a description of the production processes, products, and material balances at Mill W-8. The feasibility and the economics of countercurrent rinsing and membrane filtration for several in-plant wastewater streams are then considered.
FACILITY DESCRIPTION Mill W-8 is a commission finisher of woven industrial fabrics,
interlining, and pocket fabric. The mill processes a large quantity of imported fabric, mainly cottonfpolyester and polyesterlrayon blends. The production processes, shown in Figure 1-1, include bleaching, desizing, dyeing, and finishing. Sixty-five percent of the greige fabric received at the mill is sized with starch, while 30 percent is sized with synthetic materials, such as PVA and CMC. The remaining five percent is not sized.
The major wet finishing operations are bleaching, desizing, and continuous dyeing. The wastewater from these operations passes through a heat exchanger to preheat plant make-up water and then is neutralized and discharged to the municipal sewer. Live steam from a coal-fired boiler is also used to heat plant make-up water.
D- 1

MILL W-8 i
OPEN WIDTH DESUINQ
22.000 Ib I day
ROPE BLEACHING 18,000 b I day
WOVEN GOODS I OTHER PREPARATION
BLEACHINQ I SCOURING I DESlZlNQ
c. 0.023 mad 0.088 mgd
DRYING
I 4 I
i
LEGEND
- FABRIC ----- WASTEWATER
PIGMENT DYEING
FIQURE I -1 MANUFACTURING PROCESSES
D- 2
1 I I I I
OTHER -h I I
SULFUR BLACK DYEINQ --1 DY ElNG I io.ooo Ib I day
i 0.140 mgd
I ’ 0.060 mgd
T
I SANFORIZING
1 STARCH OTHER FINISHINO FINISHING I

MANUFACTURING PROCESSES
Bleaching Two rope bleach ranges saturate cottonjpolyester fabric with
caustic and peroxide in the first stage of the bleaching operation. Subsequently, the fabric passes through three or four rope washers. The continuous flow in the washers is maintained at about 180°F and pH 9 . 3 .
The mill has countercurrent rinse capability on these ranges and uses it occasionally.
The rope bleach ranges are described further in the section on recycle/reuse technologies for the bleachery.
Desizing Starch-sized fabric is desized with enzymes on open width
ranges, which may also perform scouring and/or bleaching, depending on the fabric. The fabric is saturated with an enzyme solution, retained in a J-box for about two minutes, and rinsed thoroughly with hot water. The rinsing occurs in a series of eight open width rinse boxes. The temperature in the boxes varies from 120'F to 200°F. Make-up water for the rinse system is preheated to 120°F through the mill's heat exchange system. Live steam is added to each box when desired. The range is capable of countercurrent rinsing, and this is sometimes done.
The desize ranges are discussed further in the section on recycle/reuse technologies for the desizing operation.
Dyeing
The mill performs pigment dyeing, sulfur black dyeing, and other continuous dyeing, with percentages of production varying with market demands. Typically the pigment dyeing process comprises 50 percent of the mill's dyeing and produces no process wastewater. The fabric dyeing of most interest to this study is sulfur black dyeing. This is because of the large amount of sulfur black dyeing performed at the mill, and the consequent potential for dye recovery and reuse. On
the continuous sulfur black dye range, the fabric passes through a dye
D- 3

pad'followed by a steamer, water seal and nip, six rinse boxes, brine (oxidation) bath, and three more rinse boxes. The mill generally uses countercurrent rinsing on this range.
This dye range is described further in the section on recycle/reuse technologies for the dye range.
Finishing The mill performs a variety of finishing processes including
Sanforizing and starch finishing. In the starch finishing process, the mill uses a fairly dilute starch and talc suspension in what they refer to as a "backfilling" operation, with starch/talc serving as a "hand building" agent. The mill is interested in recovering starch from desizing for use in this finishing operation. Other details of the operation are considered proprietary. The finishing processes do not discharge a significant flow or pollutant load.
OVERALL MASS BALANCE
Water Use and Characteristics Figure 1-2 depicts the water balance at Mill W-8. Total water
use at the mill averages about 460,000 gpd. Three major wet processes are rope bleaching (103,000 gpd), open width desizing (27,000 gpd) and sulfur black dyeing (55,000 gpd). The balance of water use consists of other preparation and dyeing operations, utilities, and other miscellaneous uses.
Table 1-1 indicates the water use rates of the three major waste streams in terms of gallons per pound. The sulfur black dye range uses about 5 gal/lb of product, the desizing range uses about 1 gal/lb, while the rope bleachery uses about 6 gal/lb. Table 1-2 lists the quality of the incoming city water.
Wastewater Discharge and Characteristics About 85 percent of the incoming water is discharged
(387,000 gpd) as shown in Figure 1-2. About 15 percent is lost or retained in the fabric after wet processing.
0 - 4 .

MILL W-8
WATER 0 L 460.000
DESIZINQ / SCOURINQ -)I (PREPARATION --------
RANQE) I I I
4.000 gpd LOSS I
AND WASHERS)
14,000 god LOSS I-
I I I 1337,000
I
I I I
DYE RANQE)
6,000 gpd LOSS
~56.000
e-----
(PREPARE AND DYE)
15,000 gpd LOSS
STEAM AND
NON CONTACTUSES
36000 gpd LOSS
60,000 gpd ----------------. SANITARY AND MISCELLANEOUS USES
TO : EWER 387.000 gpd
FIGURE I -2 WATER USE AND WASTEWATER DISCHARGE
0-5

TABLE 1-1
WATER USE
Description
Dye Range Water Seal Wash Boxes Total
Desize Range 1 s t Rinse Box 2nd Rinse Box Total, 8 rinses
Rope Bleachery 1st & 2nd washers 3rd & 4th washers
Total
Production y d / d y l i o / d y
36,944 10,154
36,944 10,154
36,944 10,154
36,944 10,154
75,400 21,514
75,400 21,514
75,400 21,514
75,400 21,514
64,000 17,800
64,000 17,800
64,000 17,800
64,000 17,800
Existing Flow
@
8,000
47,ooo 55,000
3,300
3,300
26,400
47,000
56,000
103,000
Ratio gal/lb
0.8
4.6
5 . 4
0.15
0.15
1 .2
2.6
3 . 2
5.8
Based on mill production and measured discharge rates during field investigation.
D- 6

TABLE 1-2 WATER QUALITY FOR INCOMING WATER
Parameter Concentrat ion (mg/l)
A l k a l i n i t y , a s CaC03 Chlor ide TS
Ca
Mg N i
Na
18 6.4
56
4.6
1.5
0 .1
4.9
Source: Water sample c o l l e c t e d on March 2 4 , 1982.
D- 7

The mill recovers energy from hot wastewater discharges through a heat exchanger before final discharge. Wastewater samples were collected from the sulfur black dye range, desize range, and rope bleachery. The sampling results for conventional and nonconventional textile pollutants are presented in Table 1-3 and discussed further in subsequent sections. Table 1-4, which presents a summary of pollutant loadings, indicates that about 70 percent of the COD discharged from Mill W-8 originates from the rope bleachery, desize range, and sulfur black dye range. The bleachery has the highest individual discharges of BOD, COD, and TSS. Table 1-5 presents the results for all parameters measured in the final effluent.
Other wastewater constituents that affect recycle are discussed below under the appropriate recycle/reuse technologies.
EVALUATION OF RECYCLE AND REUSE TECHNOLOGIES Recycle and reuse technologies were evaluated for three
wastewater streams; rope bleachery, desizing, and sulfur black dyeing. These waste streams were selected for study because they were either large contributors of flow, BOD, and TSS, or there was potential for recovery of chemicals such as size and dye.
Table 1-6 lists the recycle and reuse technologies evaluated These are discussed in detail in the following sections. for Mill W-8.
D-8

Wastewater Source Date
TABLE 1-3 WASTEWATER CHARACTERISTICS
Rope Bleachery Washers 1 & 2 3 / 2 2 / 8 2
Washers 1 & 2 3 / 2 3 / 8 2
Washers 3 & 4 3 / 2 4 / 8 2
Desize Range Rinse 2 3 / 2 2 / 8 2
Rinse 2 3 / 2 3 / 8 2
Rinse 1 3 / 2 4 / 8 2
Sulfur Black Dye Range Water Seal 3 / 2 2 / 8 2
Water Seal 3 / 2 3 / 8 2
Rinse Box 1 3 / 2 4 / 8 2
Final Effluent 3 / 2 2 / 8 2
3 / 2 3 / 8 2
3 / 2 4 / 8 2
Concentrations (mg/l) BOD COD TSS Phenolics pH(S.U.) ---
5,100
3,000
540
7,500
6,100
13,000
5,400
4,800
4,900
4,900
4,000
1,200
11,300 1,700
24,100 2,900
750 60
50,000 7 ,700
48,000 3,850
20,300 4,100
2,300 440
2,300 140
7,700 190
6,400 1,900
6,400 800
2,800 490
0.008 11 .0
0.290 9 .3
0.014 9 . 4
0.130 7 . 0
1.100 9.7
1.100 9 . 1
0.052 6 .7
0.002 11.1
0.003 11.5
0.061 10.0 0.085 10.0
0.200 9 .0
D- 9

TABLE 1-4
POLLUTANT LOADINGS
Flow BOD COD TSS __ Source % total Ib/day % total Ib/day % total lb/day % total
Rope Bleachery 89,000 23 1,600 15 6,200 36 800 24
Desize Range 23,000 6 1,250 11 4,300 25 800 24
Sulfur Black Dye Range 50,000 13 1,210 11 1,540 9 50 2
Other" 225,000 58 6,940 63 4,960 30 1,650 50
Final Effluent 387,000 100 11,000 100 17,000 100 3,300 100
"Includes several continuous ranges used for dyeing or preparation, utilities, noncontact water, sanitary and miscellaneous uses.
Note that while 70 percent of the mill effluent COD is represented in the wastewater from the bleachery, desize range and sulfur black dye range, only 37 percent of the BOD and 50 percent of the TSS is represented in these sources. as the various waste streams are combined, diluted, cooled, and undergo pH and other changes.
This is in part due to precipitation reactions and dilution of BOD inhibitory substances

TABLE 1-5 FINAL EFFLUENT
Concentration (mgjl)
Parameter 3/22/82 3/23/82 3/24/82
Total BOD5
COD Alkalinity as CaCO Chloride Oil ' k grease Phenolics TS TDS TSS Turbidity, NTU Ca cu
Mg
3
Ni Na pH, field measure, units Color (ADMI) Temperature, OF
4,900 6,400
130 120 79
.Ob1 5,800 4,900 1,900 300
6.6 0.15
13 0.1
470 10
8,200
95
4,000 6,400
170 440 --
.085
6,400
6,300 800
350 13 0.12 12 0.1
600 10
7,300 --
1,200 2,800
270 180 --
.zoo 3,500 5,400
490 120 6.
-- 9. 0.1
340 9
11,500 104
L

TABLE 1-6 RECYCLE AND REUSE TECHNOLOGIES
EVALUATED FOR MILL W-8
Source Objective
Rope Bleachery Reduce water use
Desizing range Reduce water use
Reduce discharge of TSS & BOD, recovery of starch for backfilling, and recovery of hot water
Sulfur black dye ,range
Reduce water use
Reduce discharge of TSS, BOD; recovery of dyeing chemicals; and recovery of hot water
Technique
Countercurrent rinsing
Countercurrent rinsing
Membrane Separation
Countercurrent rinsing
Hyperfiltration
D- 12

SECTION I1 ROPE BLEACIIERY
DESCRIPTION OF MANUFACTURING PROCESS The rope bleachery at Mill W-8 is illustrated in schematic
form in Figure 11-1. The fabric is saturated with caustic and hydrogen peroxide in the first stage of the operation. After storage for a specified time in detention bins, the fabric passes through three or four rope washers. During the field investigation, about 18,000 lb/day of fabric were processed on the range.
Water Use and Wastewater Characteristics Total water use averaged about 103,000 gpd at the washers
during the investigation, which yields a water use rate of 5.7 gallons of water per pound of fabric. The water use consisted of 28,000 gpd on Washer 1, 19,000 gpd on Washer 2, 37,000 gpd on Washer 3 , and 19,000 gpd on Washer 4 . An estimated 15 percent of the water used is lost through evaporation o r retained in the fabric. Wastewater samples from the rope bleachery were collected and analyzed, and the results are shown in Table 11-1. The results indicate that the major portion of contaminants are removed in the first two washers. Therefore, the potential exists for countercurrent rinsing from Washers 3 and 4 to Washers 1 and 2.
EVALUATION OF THE POTENTIAL FOR REUSE
Technical Feasibility Mill W-8 has the capability to use countercurrent rinsing on
the washers but does so only occasionally. No extensive data have been gathered by the mill on the effects of water reduction and full countercurrent rinsing, though mill personnel have commented that they feel fabric quality will suffer. Several studies by Groves, Buckley, and Turnbull" indicated that washer performance levels off beyond a
;';Closed Looped Recycle Systems for Textile Effluents," JWPCF, March 1979, p. 499.
D- 13

FABRIC m ROPE FORM
1 CAUSTIC
HYDROGEN PEROXDE SATURATOR
I
HOT WATER
W E STEAM * ROPE WASHER t 2
28,000 gpd 12O.F HOT WATER
#- ROPE WASHER +I
I W E STEAM I I
1
ROPE WASHER t 4 WE STEAM
7 WASTEWATER
49,000 gpd 1 8WF
TO FINWIINQ OPERAllONS
FIGURE E-1.' SCHEMATIC OF ROPE BLEACHERY
0-14

TABLE 11-1 WASTEWATER CHARACTERIZATION
ROPE BLEACHERY
Concentration (mg/l)
Washer: l & 2 l b 2 3 & 4 Parameter Date: 3/22/82 3/23/83 3/23/82
Total BOD5 Solub le BOD5 COD Alkalinity as CaCO Chloride Oil & grease Phenolics TS TDS TSS Turbidity, NTU Ca cu
Mg
3
Ni Na pH, field measure, units Color (ADMI) Temperature O F
5,100 3,000 3,800 3,000 11,300 24,100 1,500 790
97 63 -- 100
. ooa .290 11,500 19,000 11,000 5,900
1,000 2,200 1,700 2,900
4.2 3.8 -- --
4.8 3.0 -- 0.16
980 730 11 9.3
1,210 4,300 180 180
540 640 750 120 140 --
.014 1,100
890 60
-- 3.6 4.6
-- 0.1
180
9.4 -- 170
D-15

water consumption of 1 gallon per l b of fabric. They conclude that full countercurrent flow systems should operate efficiently at water use levels as low as 1 gallon per pound of fabric. These studies and the wastewater characteristics suggest that more extensive counterflow washing has potential for success at this mill. The actual water use in such a system needed to achieve desired fabric quality must be determined by the mill through actual testing.
Economic Feasibility Savings in water and energy can be realized by the
implementation of countercurrent rinsing, and no capital o r additional O&M costs are expected, therefore yielding an immediate payback.
Two levels of countercurrent rinsing were considered and are presented in Table 11-2:
1. 2. Full countercurrent flow and water use reduction to 1
Countercurrent flow from Washers 3 and 4 to Washers 1 and 2 .
gallon/lb fabric. A s shown i n Table 11-2, substantial cost and water savings can
be realized through countercurrent washing.
ENVIRONMENTAL EFFECTS The pollutant load is not expected to be reduced by
countercurrent rinsing, because the same removal of impurities is expected. Water and energy requirements will be reduced as stated above.
CONCLUSIONS ' Reuse of rope washer wastewater through countercurrent rinsing
appears to be technically and economically feasible. ' Testing must be performed to determine actual water and energy
savings achievable without sacrificing fabric quality.
D-16

TABLE 11-2
ECONOMIC ANA~YSIS OF COUNTERCURRENT WASHING
Existing Case 1 Case 2
Fabric Bleached, lb/day 18,000 18,000 18,000
Water Flow, gpd Washer 1 Washer 2
Washer 3 Washer 4
Total
28,000 0 0
19,000 0 0 37,000 37,000 0 19,000 19,000 18,ooo 103,000 56,000 18,000
Water Use, gal/lb 5.7 3.1 1.0
Water Savings, gpd
$/yr
0 41,000 85,000
0 5,400 9,700
Energy Savings, $/yr 0 18,300 33,000
Total Savings, $/yr 0 24,700 42,700
Notes:
1. Water savings based on 260 daylyear operation and water/sewer costs of $0.44 per 1000 gallons
2 . Energy savings based on 260 day/year operation, energy costs of
$3/million BTU, and heating the washwater from 120°F to 180°F
D- 17

SECTION I11 SIZE RECOVERY BY ULTRAFILTRATION/HYPERFILTRATION
DESCRIPTION OF MANUFACTURING PROCESS Starch-sized fabric is desized on an open-width r a as shown
in Figure 111-1. The fabric is saturated with an enzyme solution, retained in a J-box for about two minutes, and rinsed thoroughly with hot water. The rinsing occurs in a series of eight open-width rinse boxes. The temperature of the rinse boxes varies from 120°F to 200OF. Make-up water for this rinse system i s preheated to 120'F through the plant heat exchanger system. Live steam is added to each rinse box as required. The range is capable of countercurrent rinsing and this is sometimes used. During the field investigation, about 22,000 lb/day of fabric were processed on the range.
Water Use and Wastewater Characteristics As shown in Figure 111-1, total water use during this study
averaged 27,000 gpd on this range, resulting in a water use rate of 1.2 gallons per pound of fabric. About 15 percent of the water is lost through evaporation o r retained in the fabric after desizing.
Wastewater samples from the first two rinse boxes on the desize range were collected and analyzed, and the results are shown in Table 111-1. The results indicate a concentrated organic wastewater due to the removal of starch and, occasionally, various synthetic sizes.
EVALUATION OF THE POTENTIAL FOR REUSE
Technical Feasibility - Countercurrent Rinsing The mill has nearly optimized the control of water use at the
desize range, judging from the water use rate of 1.2 gallons per pound of fabric. Countercurrent rinsing potentially could reduce the quantity of water required at the desize range even further, from 27,000 gpd to 22,000 gpd. Facilities for countercurrent rinsing are already in place at the desizing range. However, it is not now used because mill personnel believe that once-through rinsing produces a higher quality
D- 18

FABRIC &
WASTEWATER 29.000 ppd
1BQF
I v
SATURATOR WETTINQ AQENT ENZYME
I
FAERIC TO flNlSHlNG OPERATIONS
WATER
LIVE STEAM
FIGURE IE -1 SCHEMATIC OF OPEN WIDTH DESlZlNG OPERATION
D-1 S

TABLE 111-1 WASTEWATER CHARACTERIZATION
DESIZE RANGE
Concentration (mg/l)
Rinse 1 Rinse 2 Rinse 2 Parameter 3/24/82 3/22/82 3/23/82
Total BOD5 Soluble BOD5 COD Alkalinity as CaC03 Chloride Oil & grease Phenolics TS TDS TSS Turbidity, NTU Ca
Mg Ni Na pH, field measure, units Color (ADMI) Temperature O F
13,000 --
20,300 -- -- --
1.1 28,000 22,000 4,100 2,100
9.4 15 0.12
680 9 . 1
4,950 125
7,500 6,100 7,400 5,100 50,000 48,000
210 710 730 53 880 230
.130 1.1 33,600 26,000 21,000 13,600 7,700 3,850 2,400 5,200
13 4.5 14 10
0.14 0.10 540 600
7.0 9 .7 6,400 2,000 180 180

product, though they have not confirmed this with any extensive testing. Further tests are needed to determine if fabric quality will be adversely affected by countercurrent rinsing.
Technical Feasibility - Size Recovery Although ultrafiltration has been successfully used to recover
synthetic size compounds, starch recovery has not been demonstrated. Starch desizing is frequently done with enzymes that break down the starch into smaller products of hydrolysis. The degree of hydrolysis that occurs is a function of time. Therefore, if the desize wastewater can be treated rapidly and the hydrolysis reaction stopped, recovery of a usable by-product from the desize wastewater may be possible. Alternately, desizing can be done with hot water and caustic rather than with enzymes in an attempt to avoid complete degradation of the starch. In any case, some degradation of starch occurs during the desizing process, and additional bench-scale o r pilot-scale research i s needed to determine if a usable by-product can actually be recovered by membrane filtration at Mill W-8. Bench scale tests performed for this study have indicated that the starch by-products are only partially concentrated by membrane filtration. This means that the hydrolysis reaction has progressed far, resulting in smaller compounds that are not efficiently recovered by hyperfiltration. A complete description and results of the
membrane bench tests performed in this study is provided in Appendix A. An attempt was made by mill personnel to reuse the
hyperfiltration membrane concentrate (containing the recovered starch by-products) in the mill's backfilling operation. A sample was used as makeup for the starch-talc solution applied as a hand builder. The results were not satisfactory. It has been speculated by mill personnel that the concentrate stream contained little usable starch due to the hydrolysis reaction during desizing.
A further consequence of the poor recovery noted in the tests is that the hyperfiltration membrane permeate contains high concentrations of pollutants. This will seriously hinder its ability to be recycled to the desize washers.

Economic Feasibility - Countercurrent Rinsing Cost savings from countercurrent rinsing result from water and
energy savings. A s stated earlier, however, this range has nearly optimized its water use rate so that the amount of water use that could be saved by using countercurrent rinsing is small. The projected water and energy savings are expected to be less than $1,000 per year. No capital costs are expected f o r implementation of countercurrent rinsing since the facilities are currently in place.
Economic Feasibility - Size Recovery Although the technical feasibility of starch recovery remained
unproven as a result of the bench-scale tests discussed above, it was decided that the economics of starch recovery should be investigated. If the economics were promising, then further research into the technical feasibility of starch by-product recovery might be justified.
Cost savings from treatment/recycle of the desize wastewater can result from water use savings, sewer surcharge savings, size recovery, and energy savings. Operating costs result from the operation of the membrane separation system. The basis f o r costs and savings estimates is as follows:
Water = $0.44 /1 ,000 gallons TSS surcharge = $47/1 ,000 lb TSS discharged BOD surcharge = $60/1 ,000 lb BOD discharged Starch = $14.81/100 lb Steam = $3.57/1,000 lb ( $ 3 per million Btu)
Desizing operation is conducted 260 days per year.
Starch is applied at 1 percent of fabric weight on 65 percent of production; assume less than half is available for recovery, which is optimistic, based on the preliminary tests discussed under technical feasibility.
Capital and operating costs are estimated from literature data collected during this study.
Since no full scale systems of this type are operating on starch desizing wastes, these capital and operating costs are considered to be order-of- magnitude estimates only.
D- 22

A summary of the results of the economic analysis is provided in Table 111-2. Even with 50 percent starch by-product recovery, no
payback is expected for this recycle technology.
ENVIRONMENTAL EFFECTS Size recovery and reuse normally results in signficant
reductions to the BOD and TSS from a finishing mill. However, since starch reuse has not been shown to be practical, no environmental benefits are seen resulting from the use of membrane processes to treat desizing wastewater at this mill.
CONCLUSIONS a Recovery of by-products by membrane separation processes
remains completely unproven; extensive research and testing are necessary to prove technical feasibility.
a The value of recovered starch, even if the technology were developed, is not enough to justify the costs of recovery.
a Environmental benefits would be minimal at this mill.

TABLE 111-2 SUMMARY OF ECONOMIC ANALYSIS
SIZE RECOVERY BY MEMBRANE SEPARATION
Capital Cost (22,000 gpd system)
Annual Savings
Water (21,000 gpd) Starch (500 lb/day) TSS (55 lb/day) BOD (550 lb/day) Energy (5,700 lb steam/day) Total Savings
Annual Operating Costs
$409,000
$ 2,300 $ 19,000 $ 800
$ 8,600
$ 5,200 $ 36,000
$ 57,000
Net Annual Cost = $21,00O/yr. Therefore, no payback is expected.
D- 24

.
SECTION IV SULFUR BLACK DYEING - DYE RECOVERY BY HYPERFILTRATION
DESCRIPTION OF MANUFACTURING PROCESS Figure IV-1 is a schematic of the sulfur black dye range.
Fabric passes through a dye pad containing two gallons of the stock dye solution per ten gallons of dye pad solution. Approximately 2,900 pounds of stock dye are used each day. The dyed fabric passes through a steamer, water seal, and nip. Next are six rinse boxes connected for countercurrent rinsing. The temperature of the water from the water seal and the first six rinse boxes is about 140'F; the pH is typically about 11, resulting from the caustic nature of the dye solution. Following that is a brine bath to oxidize the sulfur dye, and three rinse boxes connected for countercurrent rinsing. During the field investigation, about 10,000 pounds of fabric per day were processed on this range. However, this production varies with market demand.
Water Use and Wastewater Characteristics As indicated in Figure IV-1, the total water use at the sulfur
black dye range is about 55,000 gpd, resulting in a water use rate of 5.5 gallons per pound of fabric. About 10 to 15 percent of the water is lost through evaporation or retained in the fabric after the wet process.
Wastewater samples from the water seal and first rinse box of the dye range were collected and analyzed, and the results are shown in Table IV-1. These locations are expected to contain most of the economically recoverable dye. The results indicate a highly colored wastewater with a dilution factor of about 130 to 1 of the stock dye solution. This dilution factor is used to calculate the amount of
recoverable stock dye solution in the wastewater for the economic analysis. Discharge of BOD, COD, and TSS from the dye range is a fairly minor portion of the total mill effluent, as indicated in Table 1-4.

DYE PAD DYE CHEMICALS
4 I ~ ~ k- WATER 1209
STEAMER 6 1st NIP '
t
t I
I
I RINSE BOX
1
RINSE BOX I I
I SALT BATH I f -WATER
RINSE BOX 47,000 god 1209
RINSE BOX
t FABRIC TO COOLiNQ
AND FOLDINQ
FIGURE IV - T SCHEMATIC OF SULFUR-BLACK DYE RANGE
D-28
.
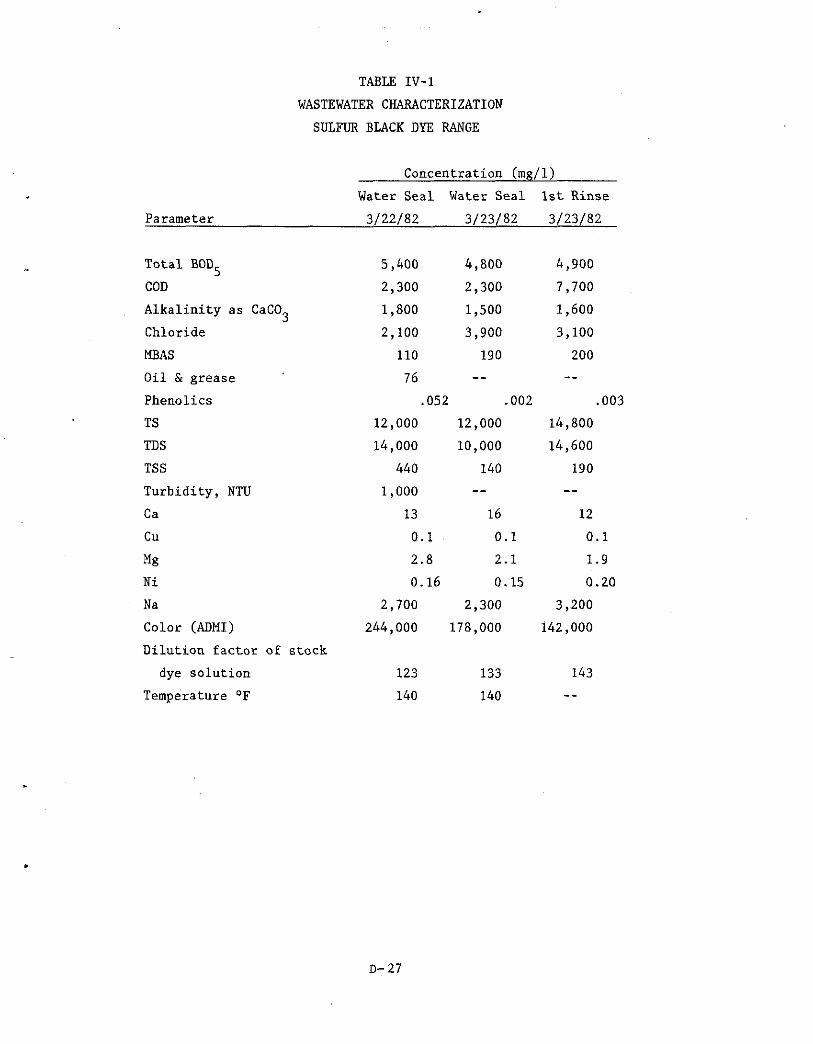
TABLE IV-1 WASTEWATER CHARACTERIZATION
SULFUR BLACK DYE RANGE
Concentration (mg/l) Water Seal Water Seal 1st Rinse
Parameter 3/22/82 3/23/82 3/23/82
Total BOD5 COD Alkalinity as CaC03 Chloride MBAS Oil & grease Phenolics TS TDS TSS Turbidity, NTU Ca cu
Mi3 Ni Na Color (ADMI) Dilution factor of stock
dye solution Temperature O F
5,400 4,800 4,900
2,300 2,300 7,700
1,800 1,500 1,600
2,100 3,900 3,100
110 190 200 -- -- 76
.052 .002 .003
12,000 12,000 14,800
14,000 10,000 14,600
440 140 190 1,000 -- --
13 16 12
0.1 0.1 0.1
2.8 2.1 1.9
0.16 0.15 0.20
2,700 2,300 3,200
244,000 178,000 142,000
123 133 143
140 140 --
D- 27

PROPOSED MODIFICATION OF THE DYE RANGE OPERATION FOR REUSE Although countercurrent rinsing is already in use, it may be
possible to further reduce the amount of water used in the first six rinse boxes from about 26,000 gpd to about 10,000 gpd to achieve an optimum water use rate of 1 gallon per pound of fabric in the rinsing stage. This would also minimize the water flow to be treated for dyestuff recovery. A similar water use rate has been successfully achieved in the full-scale hyperfiltration system operating at LaFrance Industries.
The waste rinse water from the water seal and the first six wash boxes contains valuable dye. Hyperfiltration is applicable for separating the wastewater into a concentrated dye solution and a permeate suitable for recycle as a rinsewater at the dye range. A blowdown from both the concentrate and the permeate is necessary to prevent the buildup of impurities.
TECHNICAL FEASIBILITY One full-scale application of hyperfiltration has recently
been installed at LaFrance Industries. Preliminary reports indicate that this hollow-tube system is economical at that mill. Zirconium oxide polyacrylate hollow-tube systems are capable of treating wastewater at high temperatures and high pH as found at textile mills. A complete discussion of the applicability of this technology is provided in Volume 1. The technology has good potential at this range because long runs of a single dye type are generally processed, enabling a more simplified recovery and reuse process for the dyes. Pilot-scale and full-scale recovery systems are in operation with indigo dyeing wastewater, a very similar application.
Hyperfiltration system design parameters include flux rates, temperature, and pressure. The values f o r these parameters are usually determined by pilot tests. Typical values reported in the literature are shown in Table IV-2.
D-28

.-
Type of Membrane
Spiral-wound poly(ether)amid
Spiral-wound cellulose- acetate
TABLE IV-2 TYPICAL HYPERFILTRATION DESIGN
PARAMETERS
Flux Pressure
gallsq ft-d cu m/sq m-d psig k Pa
Hollow-tube 30 Zirconium oxide polyacrylate
a 0.3 1,000 6,900
5 0.2
1.2
Source: Literature from equipment vendors.
1,000 6,900
1,000 6,900
D- 29

ECONOMIC FEASIBILITY Water use reduction by optimizing the rinsing operation could
amount to almost 16,000 gpd, which would save about $2,000 per year. Energy savings of about 2.6 million Btu/day would result in cost savings of about $2,000 per year. Total savings of $4,000 per year are possible, though the actual water use reduction that is possible needs to be thoroughly tested t o determine effects on fabric quality. No capital or operating costs are expected since the range already has the capability for counterflow rinsing.
Cost savings from treatment/recycle of the remaining 18,000 gpd dye wastewater from the water seal and first six rinse boxes can result from water use savings, sewer surcharge savings, dye recovery, and energy savings. Operating costs result from the operation of the hyperfiltration system. The basis for costs and savings estimates for dye recovery by hyperfiltration is as follows:
Water = $0.44/1,000 gallons TSS surcharge = $47/1,000 lb TSS discharged BOD surcharge = $60/1,000 lb BOD discharged Sulfur Black Dye = $0.45/lb stock dye solution Steam = $3.57/1,000 lb ($3 per million Btu)
Dyeing operation is conducted 260 days per year.
The stock dye solution found in the wastewater showed a dilution factor of 123-143 to 1, depending on the sample location. This results in a recoverable dye quantity of about 1,700 lb/day. However, the mill has stated that only 2,900 lb/day are applied and feel that the 1,700 lbjday amount may be excessive.
Capital and operating costs for the dye recovery system are from cost curves developed in Volume 1. A summary of the results of the economic analysis is provided in Table IV-3. The payback period of 2
years is very sensitive to the dye savings actually achieved. For
example, if the recoverable dye quantity is only 1,000 lb/day, the payback period increases to 4 years.
D-30

TABLE IV-3 SUMMARY OF ECONOMIC ANALYSIS
DYE RXCOVERY '
Capital Cost (18,000 gpd system)
Annual Savings
$364,000
Water (26,000 ad)* $ 3,000
Sulfur Black Dye (1,700 lb/day) $199,000
TSS (Savings not expected) -0-
BOD, (960 lb/day) $ 15,000
Energy (4 million Btu/day) $ 3,100
Annual Costs $ 50,000
Net Annual Savings $170,000
Payback period $364,000/$170,000 per year = 2.1 years
* Includes savings from countercurrent rinse water use reduction
D- 31

ENVIRONMENTAL EFFECTS Reduction in BOD and color is expected as a result of
installation of a hyperfiltration system. However, since the sulfur black dye range contributes only about 11 percent of the total mill effluent BOD, the effect will not be significant. Color reductions in the wastewater from this range will be substantial.
CONCLUSIONS ' Recovery of sulfur black dye by hyperfiltration appears to be
technically and economically feasible, but some pilot testing is necessary to confirm this and refine the design criteria for the unit.
O The actual value of recovered dye must be investigated thoroughly to confirm the economic analysis presented in this report.
O Environmental benefits of dye recovery are expected to be small at this mill, since continuous sulfur black dyeing represents only a small portion of the mill's total production.
D- 32

.
APPENDIX A
SCREENING TEST
STARCH DESIZE OF SOLIDS
PROJECT h92
FOR
SVERDRUP 8 PARCEL AND ASSOCIATES, INC,
APRIL 6, 1982
JCARRE, INC. CONSERVATION AND RESOURCE RECOVERY ENGINEERING 109 DEBPA STREET, P, 0, Box 1555, SENECA, SOUTH CAROLINA 29678
CONSULTING, DESIGN, AND SPECIALTY EOUIPMENT FOR ENERGY, CHEMICALS, AND WATER RECYCLE
D-33

TEST FOR SVERDRUP AND PARCEL
S & P is under contract with EPA to evaluate recycle/reuse for indiiect dischargers in the textile industry. Hyperfiltration (HF) and ultrafiltration (UF) are technologies being considered. Screening tests of UF and HF have been carried out on several process effluents under previous research grant programs. The current screening test is of a starch desize liquid that has not been specifically evaluated. The starch in the sample has been enzyme treated in the process. The sample was preserved
'with 1 pint of formaldehyde in a 5 5 gallon drum sample.
Experience with ZOPA membranes in the treatment of food stuffs suggests the sugar rejection will be low. However, some streams have exhibited adequate 'self-rejecting' characteristics. This present test is undertaken as a screening test. New HF membranes under. development for food processing may be evaluated later.
Objective: The objective of this screening test is to generate samples of permeate and concentrate using both UF and HF membrane processing a starch desizing solution which has been treated with enzymes. The BOD and COD of the permeate will be evaluated, by S & P. A sample of concentrate was returned to M i l l W-8 for reuse evaluation.
Relationship to Other Tasks: The results of the present test will be used to evaluate technologies and applications for the on-site pilot testing portion of the program. Since the the enzyme action converts the starch to sugar, subsequent screening tests may be required, also.
Equipment: A small skid-mounted pumping unit, schematically shown in Figure 1, with a conical bottom feed tank, was used. Module No. 540, (1/2-inch, porous S. S. tubing); with HF membrane was used. A U. F. membrane module (5/8-inch, porous S. S. tubing), N-37; was used. The two membrane modules were connected in series and evaluated simultaneously.
EXPERIMENTAL:
Samplinq:
As requested, samples were collected in brown glass bottles supplied by S L P. The samples taken and the results of CARRE's analysis are listed in Tgble 1. samples were stored in a refrigerator at 36 overnight
The
D-34

ZE
:
D-35

TABLE 1 . RESULTS OF SMIPLE ANI\LYSIS FOR S & P TEST ON STARCH DESIZE SOLUTION
Sample No.
Sample Recovery Conduct ivi ty Re jec t ion Total S o l i d s Reject ion % Sugar Reject ion T m e (%I PH (!Jm/mI (%I ( m d e ) (%I (as glucose) (%I
1 Feed - As r e c ' d . - 6.25 2100 - 18130 - 0.49
2 Permeate, UF 0 6.25 1500 33 4730 70 0.215 55
3 Permeate, HF 0 6.25 740 67 1420 91 0.098 80
4 Feed 0 6.25 2250 - 16000 - 0.482
5 Permeate, UF 80 6.05 3100 23 9070 81 0.45 58
6 Composite, HF 80 6 .25 2700 33 4660 84' 0.191 80*
7 Concentrate 80 6.25 4000 - 48760 - 1.06 U
I w 90 6 .05 3300 27 13060 82 0.52 74 - 8 Permeate, UF
9 Composite, HF 90 6.25 3600 20 5360 -85" 0.22 80*
90 6.25 4500 . 73750 2.01 10 Concentrate
* Membrane Reject ion based on Eqn (1) : 1 - 2
Eqn. (1) cp/cf = 1 , 1 - (1 - R) _._.._____________________
R c7, = concen t r a t ion of composite permeate
Cf = concen t r a t ion of feed
R = recovery
J = membrane r e j e c t i o n
'

.
TABLE 1A DESIZE RANGE
BENCH TEST RESULTS FOR MEMBRANE SEPARATION
T o t a l TS" Conduct ivi ty Percent" Sugar" pH" Sample Number Recovery BOD5 COD TS Rejec t ion Conductivity" Rejec t ion Sugar a s Rejec t ion Lab & Type (Percent) (mg/i) (mg/l) (mg/l) (Percent) (um/cm) (Percent) Glucose (Percent) (S.U.)
1 . Feed a s _ _ Received
2 . UF Permeate 0
0.49 _ _ 6.25 7,600 '24,000 18,000 -- 2,100 -- (18,100';)
33 0.215 55 6.25
3 . HF Permeate 0
4 . Feed t o 0 Membrane F i l t e r
5 . UF Permeate 80 0 I w .I
6 . HF Composite 80
7 . Concentrate 80
1,600 2,300 2,300 91 (1,420")
7,400 21,500 17,500 -_ (16,000")
740
2,250
61 0.098 80 6.25
6.25 -- 0.482 _ _
6,000 10,000 10,100 81 3,100 23 0.45 58 6.05 (9,070")
2,800 5,900 4,600 84 2,700 33 0.191- .80 6.25 (4,660; t )
1.06 -_ 6.25 21,000 177,000 52,200 _ _ 4,000 -- (48,800")
8. UF Permeate 90 7,000 13,400 13,300 82 3,300 27 0.52 74 6.05 (13,100")
9 . HF Composite 90 3,100 6,200 5,700 85 3,600 (5,360")
20 0.22 80 6.25
6.25 10. Concentrate 90 7,500 113,000 91,000 -- 4,500 _ _ 2.01 -- (73,800")

until shipment was made by Federal Express on Tuesday, March 30, 1982. (See Attachment for sample handling and shipping procedures ) .
D-38

Test Procedure:
The testing began on March 29, 1982. After mixing the solution thoroughly, while in the 55 gallon barrel, an "as received" sample was collected and stored. The test unit was cleaned with mild base and acid washes and rinsed. The membrane modules were then placed in the loop and a reference salt data point recorded using a 0.01M NaNO solution. The loop was drained. Seventy eight ( 7 8 ) liters of feed was placed into the loop. The system was started up and the solution recirculated at 600 psig for one hour at zero recovery. Data was collected every thirty (30) minutes. After the hour a pressure excursion from 200 to 900 psig was performed. Samples of feed and permeate were collected and stored. Collection of HF permeate in the stainless steel barrel was begun. After four ( 4 ) hours operating time (approximately 2 9 % recovery) twenty six (26) liters of concentrate were accidentally spilled. Thirty six (36) liters of fresh feed solution was placed into the loop. Concentration continued for three ( 3 ) hours. At this time the system pressure was lowered to 500 psig and the HF permeate flow was divided sending a small portion to the permeate holding tank and the remainder to be recycled to the feed tank, thus allowing concentration to slowly continue overnight.
The following morning (March 30, 1982) all permeate was recycled and samples of permeate and concentrate were collected and stored. Concentration was then continued until eight ( 8 ) liters of concentrate remained. Permeate was recycled while a pressure excursion between 200 and 900 psig was performed. Samples of concentrate and permeate were collected and stored. System was then drained and rinsed. Reference data in the reference 0.0 - M NaNO solution was then recorded. 3
A small volume (approximately 50 ml) was taken from each sample prior to their shipment for total solids, sugar, conductivity, and pH measurement in the CARRE laboratory. The samples were then packed in ice and shipped to Sverdrup Technology, Tullahoma, TN. A one (1) liter samples of the concentrate was shipped to Mill W-8 for tests. Duplicate samples were collected and stored at CARRE, Inc. pending arrival of the shipped samples.
The Test Result Summary sheet for each membrane is attached. Also attached are copies of the data taken during the test.
,
D-39

Results
Figure 2 is a summary in time of the membranes' fluxes, conductivity rejections and operating conditions throughout the test. The H.F. and U.F. membrane conductivity rejections declined throughout the test. Total solids and glucose rejections remained near constant for the H.F. membrane and rose for the U.F. membrane as the membrane fouled. While these tests yield representative rejections, fluxes during these short term test are not representative of design values. Fluxes in the field can be either higher or lower than those seen in screening tests.
There is a very rapid accommodation of the membrane to the fluid which dropped the H.F. flux to approximately 1/3 and the U.F. flux 1/5 of its original flux with the reference salt solution. The flux remained low for the final reference salt data indicating either a tenacious fouling layer or a chemical interaction between the fluid and membrane which changed the membrane's transport properties. The decline in conductivity rejection might point to the latter phenomenon.
Figures 3 and 4 show the effects of pressure on flux and conductivity rejection for the U.F. and H.F. membrane, respectively. Both membranes show a non-linear response which is indicative df a fluid boundary layer which impedes the flux. This is expected in a starch solution.
D-40

EO 60
c 0- 40
2
$ 20
I=- > - u -
CLOSED P O I N T S = TOTAL S O L I D S GLUCOSE 0
- ADD 36L NECJ - -
~ -/-- v---- -
0 4 8 12 16 20 24 ODES4TI'lC TT'IE (HOURS)
F I G U R Z 2. FLUX AND R E J E C T I O N S VERSUS T I Y E FOR MODULE NO. 540 (HF) AND N 37 (IJF) OPERATED I N A STARCH D E S I Z E SOLUTION AT VARIOUS OPERATING C O N D I T I O N S

MODULE N37
c G E
I+ - > 4 0 .
2
Q 3 0 . U
2 0 .
- v w * O ! 70
/-
A
10 I ,.
0% RECOVERY 0 90% RECOVERY a NUMBERS I N PARENTHESIS I N D I C A T E
301 CONCENTRATE TEMPERATURE, 'C.
D - 4 2

MODULE 540
,. 0% RECOVERY 0
9O.Z RECOVERY D
NUMBERS I N PARENTHESIS INIJICATE CONCENTRATE TEMPERATURE, C . ( 4 4 )
V-5.1 fps . pH-6.25 ( 3 7 ) ,I
I
0 200 400 600 800 1000
I N L E T PRESSURE ( P S I G )
F K U R E 4 . FLUX AND CONDUCTIVITY R E J E C T I O N VERSUS PRESSURE FOR MODULE NO. 540 (HF) OPERATED I N A STARCH D E S I Z E SOLUTION AT ZERO AND NINETY PERCENT RECOVERY.
,
D-43

ATTACHMENT - SAMPLING PROCEDURES (1) Sample Collection and Storaqe:
Samples were collected in the one liter and 1 gallon bottles provided by S & P. placed in the refrigerator at 36 F. Smal l amounts were taken from these samples for the analysis to be conducted by CARRE. Duplicates of samples No. I, 4 , 6, 8, 9 , and 10 were collected using plastic 1/2 gallon milk containers and stored in the refrigerator. Those samples were kept until the shipped samples arrived at their destinations. Sample
The gamples were immediately
.No. 10 was split and 1 liter was sent to Mill W-8.
(2) Shippinq Instructions:
Ship by Federal Express, bill to third party, S & P Acct. No. 06007404.
Ship to: Dr. Charlotte Kimbraugh Sverdrup Technology, Inc. 606 William Northern Blvd. Tullahoma, TN 37388
1 liter sample of No. 10 will go to:
M i l l W-8
Shipped on March 29, 1982.
The glass bottles were wrapped in the same manner as received, placed in a double thickness of plastic garbage bags with 5 pounds of ice, replaced in the coolers and receiving boxes.
D-44

Before test After test
:ample No. 1 2 3 4
5 6 7 8
9 10
Pressure Temperature Flux Conductivity psig OC Gal/ft2/day Rejection, %
880 42 4 2 86% 910 37 15 70% I
Before test After test
D-45
Pressure Temperaure Flux Conductivity psig OC Gal/ft2/day Rejection, %
880 42 105 45% 910' 31 2 1 48%
Sample Type Feed - as received Permeate - UF Permeate - tIF Feed Permeate - UF Composite - HF Permeate Concentrate Permeate - UF Composite - HF Permeate Concentrate
Recovery, %
0
0
0
80 80
80
90
90
90

V I c m

D-47


I
I

.

"
MILL SURVEY REPORT MILL W-9
WOVEN FABRIC FINISHING
E - i

SUMMARY
Mill W-9 is a woven fabric finishing mill that conducts several processes that have been investigated for the potential appli- cability of recycle/reuse technologies. Figure 1 illustrates the basic processes, summarizes the findings, and identifies further research needs. Table 1 illustrates the projected savings, costs, and paybacks associated with the recycle/reuse technologies considered at this mill.
The most promising technologies are:
1) 2) bleach bath reconstitution; and 3) dyebath reconstitution.
recycle of batch dyeing rinsewater;
RECOMMENDATIONS It is recommended that the following research needs be con-
sidered in future investigations: 1. Identify effects on fabric quality of reuse of bleach baths,
dyebaths, and rinsewater. 2 . Determine the value of auxiliary chemicals in exhausted dye-
baths. 3. Develop revised rinsing procedures in jet dyeing to accom-
modate dyebath reconstitution. 4. Investigate and resolve scheduling problems involved with
dyebath reconstitution. 5. Should continuous dyeing begin to operate more frequently, a
revised evaluation should be made to determine the value of recoverable chemicals, and pilot testing of hyperfiltration should be conducted to establish design criteria and reevaluate capital and O&M costs.
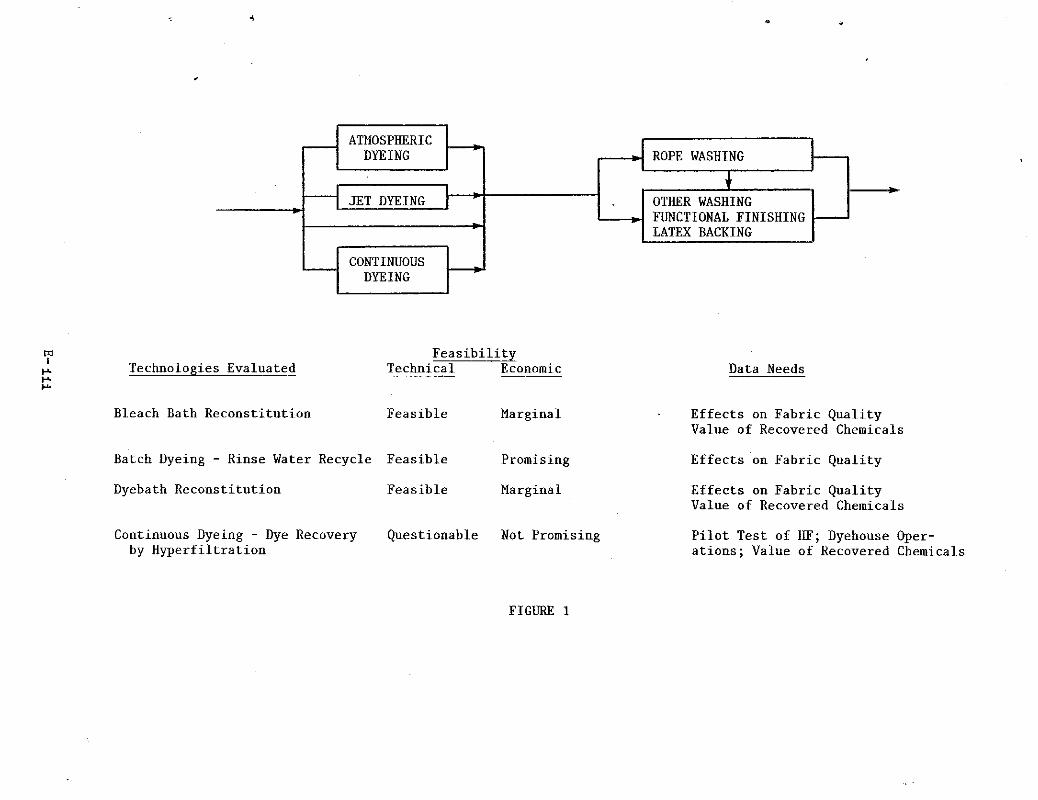
i
.
- - JET DYEING w
*
+ - OTHER WASHING
LATEX BACKING __t FUNCTIONAL FINISHING -
m F Technologies Evaluated I
* * Feasibility
Technical Economic
Bleach Bath Reconstitution Feasible Marginal
Batch Dyeing - Rinse Water Recycle Feasible Promising
Dyebath Reconstitution Feasible Marginal
Continuous Dyeing - Dye Recovery Questionable Not Promising by Hyperfiltration
Data Needs
Effects on Fabric Quality Value of Recovered Chemicals
Effects on Fabric Quality
Effects on Fabric Quality Value of Recovered Chemicals
Pilot Test of HF; Dyehouse Oper- ations; Value of Recovered Chemicals
FIGURE 1

Recycle/Reuse Scheme
Bleach Bath Reconstitution
Batch Dyeing Rinse Water Recycle
Dyebath Reconstitution
Continuous Dyeing-Dye Recovery by by Hyperfiltration
TABLE 1 SUMMARY OF ECONOMIC AND ENVIRONHENTAL BENEFITS OF VARIOUS RECYCLE SCHEMES
Net Annual Savings Capital Payback Flow Reduction (Costs) cost (Years) gpd % total
$ 8,600 $ 31,500 3.7 14,000 5
$ 21,600 $ 40,000 1.9 60,000 20
$ 18,500 $ 80,000 4.3 11,000 4
($110,000) $ 982,000 no payback 60,000 j;
;: The continuous dye range was not in operation at the time of the field investigation at Mill W-9; results are from analysis o f a similar operation at a sister mill, Mill W-10.
.

..
TABLE OF CONTENTS
Summary . . . . . . . . . . Table of Contents . . . . .
. . . . . . . . . . .
. . . . . . . . . . .
& ii V
I . INTRODUCTION . . . . . . . . . . . . . . . . . . . . . . . . . . 1
Facility Description . . . . . . . . . . . . . . . . . . . 1
Manufacturing Processes . . . . . . . . . . . . . . . . . 1
Overall Mass Balance . . . . . . . . . . . . . . . . . . . 5
Evaluation of RecycleIReuse Technologies . . . . . . . . . 8
I1 . RECONSTITUTION OF BLEACH BATHS . . . . . . . . . . . . . . . . . 14
Current Bleaching Procedure . . . . . . . . . . . . . . . . 14
Proposed Modifications to Bleaching Procedure . . . . . . . 14 Technical Feasibility . . . . . . . . . . . . . . . . . . . 14
Economic Feasibility . . . . . . . . . . . . . . . . . . . 18
Environmental Benefits . . . . . . . . . . . . . . . . . . 20
Conclusions . . . . . . . . . . . . . . . . . . . . . . . . 20
I11 . RECYCLE OF BATCH DYEING RINSE WATER . . . . . . . . . . . . . . 21
Current Atmospheric and Jet Dyeing Procedures . . . . . . . 21
Proposed Modifications to the Batch Dyeing Rinsing Procedure . . . . . . . . . . . . . . . . . . . . . . . . 21
Technical Feasibility . . . . . . . . . . . . . . . . . . . 25
Economic Feasibility . . . . . . . . . . . . . . . . . . . 25
Environmental Benefits . . . . . . . . . . . . . . . . . . 27
Conclusions . . . . . . . . . . . . . . . . . . . . . . . . 27
IV . RECONSTITUTION OF DYEBATHS . . . . . . . . . . . . . . . . . . . 29
Atmospheric and Jet Dyeing Procedures . . . . . . . . . . . 29
Proposed Modifications for Dyebath Reconstitution . . . . . 29
Technical Feasibility . . . . . . . . . . . . . . . . . . . 29
Economic Feasibility . . . . . . . . . . . . . . . . . . . 32
Environmental Benefits . . . . . . . . . . . . . . . . . . 34
Conclusions . . . . . . . . . . . . . . . . . . . . . . . . 34
E-v

TABLE OF CONTENTS (Continued)
V . REUSE OF CONTINUOUS DYEING RINSE WATER . . . . . . . . . . . 35 Current Continuous Dyeing Procedure . . . . . . . . . . 35
Operation . . . . . . . . . . . . . . . . . . . . . . 35 Proposed Modifications to Continuous Dyeing
Technical Feasibility . . . . . . . . . . . . . . . . . 40
Economic Feasibility . . . . . . . . . . . . . . . . . 40
Environmental Benefits . . . . . . . . . . . . . . . . 42
Conclusions . . . . . . . . . . . . . . . . . . . . . . 42
E-vi

SECTION I INTRODUCTION
FACILITY DESCRIPTION Mill W-9 is a woven fabric finishing mill that produces
finished fabric for upholstery, drapery, and mattress ticking. The production processes include bleaching, dyeing, washing and functional finishing, and application of latex backing, as shown in Figure 1-1. The major wet operations are bleaching, dyeing, and washing. Fabric weaving and preparation are conducted at other mills.
The primary fabric types are cottonfpolyester blends, although other fibers are processed on occasion.
MANUFACTURING PROCESSES
Bleaching Bleaching is performed as the first step in the batch dyeing
process. Atmospheric becks or jet dye machines are used. Generally, hydrogen peroxide serves as the bleaching agent. Following bleaching, the exhausted bleach liquor is discharged from the dye machines, without dilution at a temperature of 150'F to 200'F. Further discussion of the bleaching operation is found in the section on bleach bath reconstitution.
Dyeing The mill performs batch dyeing in atmospheric becks and
pressure jet dye machines, and has facilities for continuous and jig dyeing. The continuous dye range was not in operation during the field investigations, so a similar continuous dye range at a sister mill (Mill W-10) was investigated. Jig dyeing is used primarily for occasional redyeing and is therefore not considered further in this study.
Atmospheric Dyeing. Dyeing in the atmospheric becks is a five stage operation: bleaching, rinsing, dyeing, clearing the beck, and rinsing. All of these operations produce wastewater.
E- 1

._
- . . .
ATMOSPHERIC
"I I -f
116.000 gpd
PREPARED FABRIC T 1
CONTINUOUS
DYEING r- JET DYEING
I 17: 1 t 40,000 gpd 88,000 gpd
t 'I t
LEGEND
-FABRIC
---WASTEWATER
ROPE WASHINQ .r f I
DRYINQ I COOLING
20,000 gpd
INSPECTING I PACKAGING FOR SHIPMENT
OTHER WASHINQ
FUNCTIONAL FlNlSHlNQ LATEX BACKINQ
FIGURE 1-1 MANUFACTURING P R O C E S S E S MILL W-9
E- 2

The initial bleaching and rinsing steps remove any remaining oils and size. However, desizing is not necessarily intended. Following discharge of the exhausted bleach bath, the beck is refilled in several stages with rinse water, and then dumped.
Dyeing of the fabric is then performed. The 1200 gallons of dyeing liquor consist of water, direct dyes, and a wetting agent. The temperature of the dye liquor is slowly raised from ambient to the 200'F dye strike temperature by steam. Ten pounds of dye liquor are used per pound of fabric.
To remove the hot exhausted dye liquor, 1200 gallons of rinse water are added slowly to the beck to displace the dye liquor. No
sudden temperature changes are permitted in order to avoid spotting of the fabric and permanent wrinkles. This cooling rinse is generally followed by a second 1200-gallon rinse.
A final rinse of 1200 gallons then follows. Sometimes a salt solution is applied during this rinsing to fix the dye. Although hot water is used in this operation, the temperature of the wastewater is relatively low (around 100'F) because this hot rinse water is mixed with the cold rinse water in the beck to avoid sudden temperature changes within the becks.
The dyeing process is discussed further in the sections on
recycle of dyebath rinse water and dyebath reconstitution. Jet Dyeing. Jet dyeing is a four-stage process: bleaching,
rinsing, dyeing, rinsing. It is a pressurized operation so that the temperatures are much higher than in atmospheric beck dyeing.
The bleaching operation consists of application of a hydrogen peroxide solution. Heat is applied through internal noncontact heat exchangers carrying steam. Cooling is done with the same heat exchangers carrying cold water. Following the bleaching operation the fabric is rinsed with running water at about 100'F.
Dyeing with dispersed dyes and a wetting agent is done in a thirty-minute cycle. Direct dyes and acid dyes are also sometimes used. The dye liquor to fabric ratio is about lO:l, although the mill is trying to reduce that ratio to 4 : l . The maximum temperature of the dyebath is 240'F.
E 3

After dyeing, a salt water rinse is sometimes used to remove excess dyes and to fix the dye.
This process is also discussed further in subsequent sections. Continuous Dyeing. Continuous dyeing consists of seven stages:
scouring, dye application, setting, washing, salt application, drying, and cooling. The dyeing range is operated continuously throughout the day.
The scouring operation consists of a detergent wash followed by a rinse to remove any remaining oil and polyester-base size. The wastewater is discharged through a trough beneaththe dye range.
Dye is applied by a dye pad. The dyeing chemicals consist mostly of direct dyes and an alcohol-base wetting agent. The wetting agent is about 0.1 percent of the dye bath. The dye pad box is discharged only during cleanup and it contains a very small amount of liquid.
After the dye is applied, the fabric passes through the setting stage. Heat is applied to set the dye; however, no wastewater results from this operation.
After setting the dye, the fabric passes through a series of wash boxes in which a water spray is applied to the fabric to rinse off excess dye. The washwater temperature is approximately llO°F on some ranges, and ambient temperatures on another range. Following washing the fabric passes through a salt spray to fix the dye.
The last two stages of dyeing consist of drying and cooling. The fabric is passed over and under cylinders through which steam or cold water passes in order to dry o r cool the fabric. The steam is condensed within the cylinders, and the condensate is returned to the boiler. The cold water is not softened and recycle is not practiced in order to avoid buildup of scale and solids. Therefore, the cold water is discharged to the sewers.
Light shades are dyed before dark shades to avoid spotting the fabric. Pits on the cylinders retain dye which is transferred to the fabric. Dark shades can cover up spots caused by light shades but not vice versa.
E- 4

Further discussion of the continuous dyeing operation is found in the section on dye recovery by hyperfiltration.
Washing and Finishing. Open width and rope washing are performed prior to application of functional finishes such as fire retardant and crease resistance. The rope washer is the predominant source of wastewater in this operation but it generates only about ten percent'of total mill effluent when in operation. The rope washers use countercurrent rinsing. Other finishing operations use little water and are therefore not considered further in this study.
Much of the mill's wastewater originates from miscellaneous sources such as cooling cans in the finishing operations, but this is noncontact wastewater.
p Latex is applied to some fabric as a backing, and small
amounts occasionally spill into the plant sewers. However, this is considered insignificant and is not discussed further herein.
OVERALL MASS BALANCE
Water Use and Characteristics Total water use at the mill averages about 2.26 million
gallons per week, or 450,000 gallons per day. The major individual areas of water use, as shown on Figure 1-2, are the processes of atmospheric dyeing (140,000 gpd) and jet dyeing (48 ,000 gpd), which include a step for bleaching. Continuous dyeing facilities are available at this mill, but these were not in use during the field investigation. A similar range, however, was examined at a sister mill (Mill W-IO). This range used about 77,000 gpd of water.
There is a large variety of finishing operations at the mill that incorporate rope and open width washing as preparation before finishing. The single most significant water use is for rope washing. This range operates about one day per week; on other days the other miscellaneous finishing ranges are in operation. The rope washing range uses about 36,000 gpd when in operation.
Water use for cooling, steam make-up, and sanitary purposes amounts to about 126,000 gpd.
Table 1-1 lists the quality of the incoming city water. E-5

CITY
WATER (MILL W - I O ) 77.000 gpd CONTINUOUS DYEING - - 66,000 - - gpd - - - ro SEWER
140.000 115,000 gpd ATMOSPHERIC DYEING ---------
gpd I L - -- 26,000 gpd LOSS
CITY WATER
40.000 god I I
I I
JET DYEING ------- 48,000
L - -t 8,000 gpd LOSS
I 4
I 30,000 god ------- 38.000 ROPE WASHING
(1 daylweek)
I I I I 4 86,000 god
OTHER WASHING I
FUNCTIONAL FINISHING 100.000 - - - - - - -
I ILATEX BACKING I I - I I t- --- 15,000 gpd LOSS
DRYING I COOLING HEAT EXCHANGER
20,000 gpd I
90,000 ODd
STEAM MAKE-UP -. 1 I
I I
Dl I I
10,000 gpd ----- --- -- - 16,000
gpd SANITARY
1 TO SEWER 306,000 gpd
FIGURE 1-2 WATER USE AND WASTEWATER DISCHARGE MILL W-9
E- 6

,
TABLE 1-1
WATER QUALITY FOR INCOMING CITY WATER
Turbidity, NTU pH, S.U. Ca cu
Mg
Ni Na Color (ADMI) Alkalinity, as CaCO
3 c1- Total BOD
COD
MBAS Phenolics TS TDS TSS Temperature, O F
Sulfate Cr Fe Pb Mn Zn
Concentration, mg/l
Mill W-10 Mill W-9
0.34
6.9
4.2
0.005
1.7
0,0025
18
4
10
11 -- 16 --
<0.005 -- 91
45
32
0.003
0.12
<0.001
< 0 . 1
0.10
1
7 .3
3 . 8
0.1
3.0
0 .1
20
6 .2
34
8.5
7 . 4
23
0.007
< 0.040
140
120
< I 52 -- -- -- -- -- --
Sources: W-IO sample collected 3 / 1 1 / 8 2
W-9 water samples collected 4 / 2 7 / 8 2 and 4 / 2 9 / 8 2
E- 7

Wastewater Discharge and Characteristics The major sources of wastewater discharge are the same as the
major water users. An estimated 15 percent of the water used in wet processing operations is lost through evaporation o r retained in the fabric after wet processing, as indicated in Figure 1-2.
Wastewater samples were collected and analyzed from the various stages of atmospheric and jet dyeing of Mill W-9, continuous dyeing rinse water at Mill W-10, and the rope washers and final effluent at Mill W-9. The results for conventional and nonconventional textile pollutants are presented in Table 1-2 and discussed under the applicable recycle/reuse technologies. Tables I-3A and 3B present the overall pollutant loadings for the major wastewater streams to show the relative magnitudes contributed by each process. Table I-3A represents the loadings with the rope washer not operating (4 days per week), while Table I-3B shows the effect of rope washer operation (one day per week). The rope washer discharges a significant amount of BOD, COD, and TSS when in operation. Table 1-4 presents the results for all parameters analyzed in the final effluent. Other constituents that affect recycle/reuse are discussed under the appropriate recycle/reuse technologies.
EVALUATION OF RECYCLE/REUSE TECHNOLOGIES Reconstitution has been used in some textile mills to recycle
batch bleach baths. Mill W-9 personnel believe that too few valuable chemicals are used to merit bleach bath recycle. However, energy and water savings may be significant. Bleach bath reconstitution is examined in Section 11.
Bleaching and dyeing rinse water are frequently reused in a countercurrent fashion with continuous preparation and dyeing ranges. The same principle can be applied during batch dyeing by segregating the last half of each bleach rinse and each dye rinse and reusing the water as the first half of a subsequent rinse. This direct recycle is investigated further in Section I11
,

TABLE 1-2
WASTEWATER CHARACTERISTICS
Concentration (mg/l) - TSS Phenolics pH (S.U.) COD BOD Wastewater Source Date - - -
Bleaching Atm. Bleach Liquor 4 / 2 7 / 8 2 5 2,800 61 Atm. Bleach Rinse 4 / 2 8 / 8 2 14 110 Jet Bleach Rinse 4 / 2 8 / 8 2 5 210 3
--
Atmospheric Dyeing Dyebath 4 / 2 7 / 8 2 -- 260 --
160 Dyebath 4 / 2 9 / 8 2 540 -- Salt Rinse 4 / 2 7 / 8 2 10 110 9 Dye Rinse 4 / 2 7 / 8 2 34 120 9
Jet Dyeing Dyebath 4 / 2 8 / 8 2 64 410 680 Dye Rinse 4 / 2 8 / 8 2 39 770 20
Rope Washer 4 / 2 8 / 8 2 280 1,610 1,330
Final Effluent 4 / 2 7 / 8 2 36 480 20
4 / 2 8 / 8 2 64 630 160
4 / 2 9 / 8 2 220 1,080 230 Average 110 730 140
'Continuous Dyeing" 3 / 1 1 / 8 2 60 140 16
0.330 < 0.040
--
0.066 --
0.120 0.057
0.041 <0.040
0.050
0.059
< 0.040
0.110
0.070
< 0.005
9.0
7 . 1
6.918.8
8,315.8 6 . 4
7 .0
8.016.1
4.7 9.516.5
6 .3
8.8
6.7 9 . 1 --
9.5
*Continuous dyeing facilities at Mill W-9 were not in use during Phase 11, so
a similar operation at a sister mill (Mill W-10) was investigated.
E- 9

3
U
3
N
2 r. N
3
m r.
m 3
0
0
0
U
9
3 .i
k U
al c,
I I I I I I I I I I
I I
W
0 0 0 0
N _.
M
C
.3
4 0
0
V
E-10

Source -
Atmospheric Dyeing
Jet Dyeing
Rope Washing
Cooling m I c +- Sanitary""
Other Washing &
Finishing
Final Effluent
I/ Continuous Dyeing
Flow
gpd
115,000
40,000
30,000
20,000
16,000
85,000
306,000
66,000
% total
38
13
10
6
5 28
100
_ _
TABLE I-3B POLLUTANT LOADINGS*
BOD Ib/day % total
66
7
70
--
20
163
33
40
4
43
--
13
100
_ _
COD Ib/day % total
430
121
403
_ _
648
1,608
77
27
8
25
--
40
100
--
TSS % total
25 6
21 5
333 82
29 7
408 100
_- 9
* Based on 4/28/82 sampling results, with rope washer in operation. one day per week.
Rope washer operates about
-% Sanitary and other washing and finishing streams were not sampled. I/ Continuous dyeing was not in operation at Mill W-9, so a similar operation was investigated at Mill W-10. The dye range was typically operating about 2 days per week.

Turbidity, NTU pH, S.U. Ca cu
Mg Ni Na Color (ADMI) Alkalinity, as CaCO 3 c1- Total BOD COD MBAS O&G Phenolics TS TDS TSS Temperature, OF
TABLE 1-4 WASTEWATER CHARACTERIZATION
FINAL EFFLUENT
Concentration (mg/l) 4/27/82
135 8.8 1.5
<0.1 2.0
< 0.1 280 377 50
230 36 480 0.59
230 0.059
690 510 20 95
4/28 f 82
1000 6.7 1.0
< 0.1 7.1
<0.1 350 537 64 270 64 630 0.09 79
< 0.040 1,180 880 160 108
4/29/82
40 9.1 1.2
< 0 . 1
11 <0.1
1,520 114 64 280 220
1,080 0.335
210 0.110
1,040 730 230 100
E-12

Exhausted dyebaths can be reconstituted by adding fresh dyes and auxiliary chemicals. When this procedure is followed, water, energy, and chemical costs are reduced. Dyebath reconstitution is considered in Section IV.
Decoloring exhausted dyebaths by oxidation o r adsorption is also possible. However, these techniques are more capital-intensive and less applicable to direct dyes than reconstitution. Therefore, they are not considered further for Mill W-9.
Continuous dyeing rinse water sometimes contains significant amounts of energy, dye, and auxiliary chemicals. Hyperfiltration recovers two fractions: a concentrate of the unexhausted dyes and chemicals and a clean hot permeate. Hyperfiltration is considered in Section V.
The rope washer flow is small and countercurrent rinsidg is already used. Furthermore, the mill personnel report that few valuable chemicals are used. Therefore, recycling of the rope washer liquor is not considered further in this report.
E- 13

SECTION I1 RECONSTITUTION OF BLEACH BATHS
CURRENT BLEACHING PROCEDURE As shown in Table 11-1, bleaching is the fiist step of the
dyeing process. The bleach bath is discharged from both the atmospheric and jet dyeing processes without dilution at a temperature of 150°F to 200°F. Table 11-2 presents the bleach bath sampling results.
The 1100-gallon and 1600-gallon batches of bleach bath are discharged into concrete drain troughs which empty into the plant sewers. Recently, Mill W-9 has produced 12 batches per day from
atmospheric dyeing and f o u r or five batches per day from jet dyeing.
PROPOSED MODIFICATIONS TO BLEACHING PROCEDURE As shown in Figure 11-1, an insulated tank could be installed
to store the waste bleach bath. Chemicals can be added to the bath to reconstitute it. The mill considers the amounts and proportions of peroxide, sodium silicate, caustic and acetic acid to be proprietary, so
that further description is not provided herein.
TECHNICAL FEASIBILITY Bleach bath reconstitution is practiced at a yarn mill
investigated during this study. by Mill Y - 4 . Although some of the bleaching chemicals exhaust during use, some valuable chemicals and hot water are present in the discharge. Bleach bath reconstitution permits the reuse of these unexhausted chemicals and hot water.
After bleaching is performed at the above noted mill, the exhausted bleach bath is pumped to a holding tank while rinsing is separately performed in the original dye machine to complete the bleaching cycle. Once the bleached yarn is removed, and fresh yarn added to machine, the exhausted bleach bath is returned from the holding tank and reconstituted to initiate the next cycle. When a reconstitution sequence of bleaching is performed at this mill, the bleach bath is reconstituted over and over again until many cycles have been run o r the mill is through with bleaching.
E- 14

Description
TABLE 11-1 BATCH DYEING PROCEDURES
Typical Water Use (gallons)
Atmospheric Dyeing Procedure
Bleaching 1,600
Rinse 3,600
Dyeing 1,200
Rinse 1,200
Rinse 1,200
Rinse 1,200
Total 10,000
Jet Dyeing Procedure
Bleaching 1,100
Rinse
Dyeing
Rinse (optional)
Total
4,600
1,600
l,ooo
8,300
Comments
H 0 ~204: acgtic acid, 200°F
Na 0 x Si02,
in 3 stages 100°F
200'F and gradual cooling
100°F
100°F
100°F, sometimes a brine rinse
H 0 ~204: acgtic, acid, 20PF dumped at 150°F
Na 0 x Si02,
Running rinse 100°F
Dye, running rinse
Salt sometimes
E- 15

TABLE 11-2 WASTEWATER CHARACTERISTICS
ATMOSPHERIC DYEING - BLEACH BATH*
Parameter
Turbidity, NTU pH (standard units) Ca
Mg Ni Na Color (ADMI) Alkalinity, as CaC03
Total BOD COD MBAS O&G
Phenolics TS TDS TSS Temp. O F
c1-
Concentration (mg/1)
140
9.0
1.5
5.6
< 0 . 1
400
' 610
300
85
4.8
2,800 0.3
69
0.330 2,160
1,390
6 1
170 to 195
Source: Composite-grab wastewater sample collected April 25, 1982.
"This is expected t o be similar to bleach bath used in jet dyeing. J
E- 16

L
L c < m
A r * 0
w a m
CHEMICALS MAKE-UP -.-.r
FIGURE E-1 SCHEMATIC OF BLEACH BATH RECONSTITUTION
ATMOSPHERIC JET DYE
E- I7

Unlike dyeing, bleaching is very predictable and routine from one batch to the next. Batches do not need to be sequenced in a particular order as with dyeing, and hence production scheduling is not a consideration as long as there is bleaching to be done. Mill experience has shown that the quality of finished product is not affected by bleach reconstitution series of 10 cycles o r more.
Effects on fabric quality need to be evaluated to confirm the technical feasibility of this technology at Mill W-9.
ECONOMIC FEASIBILITY Cost savings are realized in the areas of water use,
wastewater discharge, and energy. Chemical savings are likely, based on experience at the yarn mill, but Mill W-9 claims that the recoverable value will be insignificant and prefers to keep cost data confidential. In addition to the capital costs for the holding tank and related equipment (e.g., pump, piping, valves, etc.), a small additional operating cost for pumping will be experienced.
Table 11-3 presents an analysis of the economics of bleach bath reconstitution. The basis of these costs and savings is as follows:
o capital requirements for reconstitution include a 1,600-
gallon, insulated, elevated fiberglass holding tank, pump, and plumbing modifications
o holding tank and related equipment must be purchased (i.e., capital equipment not already available at mill)
o reconstitution economics are developed for 4 atmospheric becks and 3 jet dyeing machines
o bleach bath is used for bleaching ten batches of fabric before being discharged
o mill operates 250 days per year o temperature of the recycled bleach bath is 150'F; the
temperature of preheated city water is 130'F.
o cost of water supply and sewer service is $1.43 /1000 gallons
E- 18

TABLE 11-3 ECONOMIC ANALYSIS OF BLEACH BATH RECONSTITUTION
Capital
1 1600-gal insulated tank $ 5,200
1 PWP 4,000
Piping and valves 13,ooo Subtotal $22,200
Contingencies, engineering, electrical, installation (42%) 9,300 Total $31,500
Savings m Chemical (approximate) 0”
4,000
5,ooo 9,000
8 Energy, 5.8 x 10 Btujyr Water and sewer 3 . 5 x 10 6
gal/yr
Operation and Maintenance
Net Annual Savings
Payback Period
400
(approximate) $ 8,600
3 . 1 years
*Stated as zero chemical savings to adhere to mill comments that little chemical value will be recoverable. Mill claimed that details were confidential.
E- 19

o energy costs are $6.72 per million Btu As can be seen from the table, the payback period associated
with bleach bath reconstitution at this mill is approximately 3 . 7 years. This payback could be shortened significantly by chemical. savings, which have been ignored herein to adhere to confidentiality agreements.
ENVIRONMENTAL BENEFITS The environmental benefits of bleach bath reconstitution are
water use and wastewater discharge savings of 14,000 gpd, and energy savings of 2.3 million Btu/day. COD and phenols discharges are expected to be reduced fairly significantly, judging by the data in Table 11-2, though actual effects need to be investigated during testing.
CONCLUSIONS o Bleach bath reconstitution has been successful in bleaching of
yarn at another mill investigated during this project, and these results should be tested for applicability at this mill.
o With a maximum payback period of 3.7 years, the economics of reconstitution at this mill are marginally attractive. Taking the value of recoverable chemicals into consideration will lower this payback period.
o Significant environmental benefits result from the implementa- tion of bleach bath reconstitution.
,
E- 20

SECTION I11 RECYCLE OF BATCH DYEING RINSE WATER
CURRENT ATMOSPHERIC AND JET DYEING PROCEDURES Table 111-1 presents the water usage in typical batch dyeing
operations at Mill W-9. As shown in Table 111-1, rinsing follows borh bleaching and dyeing. The entire dyeing cycle, including bleaching, dyeing, and rinsing, is controlled by computer. The programmed total flows for the atmospheric and jet dyeing procedures are usually about 10,000 gallons per batch and 8,300 gallons per batch, respectively. However, during the field investigation, flows in the atmospheric and jet dyeing procedures were observed to be 13,300 gallons per batch and 12,900 gallons per batch, respectively. This extra water use was probably due to additional rinsing.
The rinse water discharges from each dye machine through a pipe into concrete drain troughs. The drain troughs empty into the plant sewers.
Table 111-2 presents the rinse water characteristics. Note that the rinse water after bleaching contains relatively few organic pollutants (low BOD and COD concentrations), few suspended solids, little o r no color, and only a modest increase in dissolved solids over the city water concentration (120 mg/l). Similarly, the dye rinse water from atmospheric beck dyeing contains little color, suspended solids, or
organics, but does contain a higher level of dissolved solids. Rinse water following jet dyeing contains substantial color, organics, and dissolved solids. This is due to the use of an overflow, o r running, rinse in which the exhausted dyebath is not dropped before rinsing begins. The residual color may limit reuse of this jet dyeing rinse water.
PROPOSED MODIFICATIONS TO THE BATCH DYEING RINSING PROCEDURE During sampling, the last half of each rinse appeared to be
clean water. For example, the salt rinse is the last rinse to occur in the batch dyeing process. The salt rinse (Table 111-3) has a color of only 10.2 ADMI units and little suspended solids o r organics. The last
E- 21

Description
TABLE 111-1 BATCH DYEING PROCEDURES
Typical Water Use gallons
Atmospheric Dyeing Procedure
Bleaching 1,600
Rinse 3,600
Dyeing 1,200
Rinse
Rinse
Rinse
Total
1,200
1,200
1,200
10,000
Jet Dyeing Procedure
Bleaching 1,100
Rinse 4,600
Dyeing 1,600
Rinse (optional) 1,ooo
Total 8,300
Comments
H 0 ~i0i3: acitic acid, 200°F
in 3 stages lOOOF
200°F and gradual cooling
100°F
100°F
100°F, sometimes a brine rinse
Na 0 x Si02,
H 0 ~204: acgtic acid, 200°F dumped at 150°F
Running rinse 100°F
Dye, running rinse
Salt sometimes
Na 0 x Si02,
,

. v
TABLE 111-2
WASTEWATER CHARACTERIZATION BLEACH AND DYE RINSE WATER
Parameter
Turbidity NTU pH (Standard units)
Ca Cu
Ni
Color (ADMI)
Mg
3 Pi Alkal. as CaCO N C 1 '
I
w Total BOD Soluble BOD
COD MBAS 0% Phenolics
TS TDS TSS
Temp OF
Flow, gpd
Concentration (mg/l) Jet Atmospheric -
4 .4 7.7
0.25 < 0 . 1
0.1 < 0 . 1
22
33 840
14 --
110 _ _ _-
< 0.040
-- _ _ --
82
45,000
12 6.9 & 8.9
1.6
1.8 _- _-
48.6
62 8.5 4.6 6 . 4
210
40 0.33
_ _ 310 250
3
100 to 109
21,000
Concentration (mg/l) Jet Atmospheric --
11 1.4 8 & 6.7 9.5 & 6.5 & 6.5
0.66 0.58 < 0 . 1 0.59
0.17 0.13 < 0 . 1 < 0 . 1
82.9 775
32 42 880 1,040
34 39 -- -_
120 770 2 0.02
0.057 < 0.040 -- --
1,650 2,070 1,540 1,970
9 20
95 to 104 102 to 115
46,000 12,000

TABLE 111-3 WASTEWATER CHARACTERIZATION
ATMOSPHERIC DYEING - SALT RINSE" Parameter Concentration (mgll)
Turbidity NTU pH (Standard units) Ca cu
Mg Ni Na Color (ADMI) Alkal. as CaC03 c1
Total BOD Soluble BOD COD MBAS OhG
Phenolics TS TDS TSS Temp O F
2
7
0.88
c0.1
0.18
< 0 . 1
1,180
10.2
25
210
10
110
0.17
0.120
2,798
2,743
8.8
75
*A final rinsing step used on a portion of production to fix the dyes.
E- 24

half of the bleach and dye rinses were observed to be of a similar nature. This relatively clean rinse water could be reused as the first half of a subsequent rinse, and then be discharged, although the dissolved solids content may limit the amount of rinse water that can actually be reused. As shown in Figure 111-1, pipes and valves could be installed at a sump so the wastewater could be pumped to one of two elevated storage tanks in the dyehouse. The system would be controlled by the dye cycle computer. Each storage tank should be one-half the volume of the maximum rinse. One tank would retain bleach rinse while the other would retain dye rinse, The stored water could flow by gravity back to the dye machines during a subsequent rinse.
TECHNICAL FEASIBILITY Continuous preparation and dye ranges commonly use
countercurrent rinsing. Reusing the last half of batch rinsing would be a similar application. In fact, this method is mentioned in a patent owned by Hanes Corporation (Patent No. 4,152,113, May 1, 1979). Furthermore, a few carpet mills using atmospheric beck dyeing have reused the final rinse water for dyebath make up. The above mentioned patent also indicates that rinse water can be used as dye bath make up water.
The salt content of the rinse waters needs to be studied f o r
its effects on the quality of dyeing. Salt buildup in reuse would need to be carefully monitored.
ECONOMIC FEASIBILITY Cost savings result from water savings and sewer use charge
reductions. Energy savings are not expected from reuse because rinse water used generally has a temperature of only 7 7 to 104°F. The economic analysis presented in Table 111-4 is based on the following:
o Use of the second half of all rinse waters as make-up fo r the first half of the subsequent rinse. The second portion of the subsequent rinse will use city water, which in turn is reused for the next rinse cycle.
E- 25

PUMP 4
ATMOSPHERIC
BECKS -
i
JET DYE
MACHINES
BLEACH RINSE
STORAGE
RINSE STORAQE
FIGURE m-1 SCHEMATIC OF RINSE WATER RECYCLE SYSTEM
E-26

o Water service and sewer use savings of $ 1 . 4 3 / 1 0 0 0 gallons. o Mill operates 250 days per year.
Capital expenditure will be required for piping and valves, a pump, and two 2,300-gallon insulated tanks. As shown in Table 111-4, the capital costs will be about $40,000. The net annual savings for this system would be about $21,600. Thus, a payback period of about 1.9 years can be expected, which makes the system reasonably attractive for the mill.
ENVIRONMENTAL BENEFITS Direct recycle and reuse of rinse water will reduce the amount
of water used and wastewater discharged by 60,000 gpd or 20 percent of total plant discharge. However, the mass of pollutants discharged will remain unchanged while their concentrations will increase slightly due to the smaller flow.
CONCLUSIONS o Effects of salt content of rinse waters on fabric and dyeing
quality must be carefully evaluated to confirm the technical feasibility of this technology.
o Actual water savings must be determined through testing to establish the blowdown necessary to avoid deterioration of fabric quality.
o A detailed estimate of capital expenditures is needed to confirm economic feasibility.
E- 27

TABLE 111-4 ECONOMIC ANALYSIS OF RINSE WATER RECYCLE
Capital
2 2300-gal insulated tanks
1 PUP Piping and valves
Sub total Contingencies, engineering, electrical, installation (42%)
Total
Annual Savings
Sewer and water (half of bleach and dye rinse) 6 15 x 10 gallons/year (60,000 gpd)
Annual Operation and Maintenance Costs
Electricity - negligible Pump repairs, 10% of capital
Net Annual Savings
Payback Period
$11,000
13,ooo 4,000
$28,000
12,ooo $40,000
$22,000
$ 400
$21,600
1.9 years
E- 28

SECTION IV RECONSTITUTION OF DYEBATHS
, ATMOSPHERIC AND JET DYEING PROCEDURES
As explained in the preceding sections, atmospheric dyebaths are usually discharged without dilution. However, the jet dyebaths are diluted by a running rinse. The temperature of the atmospheric dyebath at discharge is usually about 18O0F, while the temperature of the jet dyebath just before the running rinse starts is about 150OF.
Table IV-1 presents the characteristics of spent dyebaths. The data show these dyebaths to be highly colored and to contain high dissolved solids concentration and some organics. These are due to auxiliary chemicals and unexhausted dyestuffs remaining in the dyebath after dyeing.
The dyebaths are discharged from the dyeing machines through the same drains used for the rinse water.
PROPOSED MODIFICATIONS FOR DYEBATH RECONSTITUTION Exhausted dyebaths usually contain 80 percent of the auxiliary
chemicals and five percent of the original dyes. These dyebaths can be recycled after the addition of fresh chemicals and dyes. Of course, fewer chemicals will be used, and energy (hot water) will be conserved. To accomplish this reconstitution, pipes, valves, pumps, and insulated storage tanks are required, as indicated in Figure IV-1. The volume of each storage tank should equal the volume of one batch of dye liquor 1000 to 1200 gallons. In addition, a spectrophotometer and microcomputer are required to determine the quantity of make-up dye.
TECHNICAL FEASIBILITY Dyebath reconstitution is in full-scale use at a number of
textile mills. Pilot scale tests have been performed at many other mills that indicate favorable results. A significant amount of research has been performed by Georgia Tech and is described in more detail in the Final Project Report. Scheduling and quality control problems are
E- 29

Parameter
Turbidity, NTU pH, standard units Ca cu
Mg Ni Na Color (ADMI )
Alkal. as CaC03 c1 Total BOD COD MBAS O&G Phenolics TS TDS TSS Temp OF Flow
TABLE I V - 1
DYEBATH WASTEWATER CHARACTERISTICS
Concentration (mg/l) Atmospheric
Dyeing
16
5 .8 to 8.3
1 .6
< 0 . 1
0.28
< 0 . 1
900
3,750
46.2
2,980
540 260
34
0.066
7,200
6,590
160
180 to 198
10,000 gpd
Jet Dyeing
< 1
4.7
1 . 9
3.8 0.14
0.12
5,200
2,740
0
5,200
64
470
0.15
110
0.041
9,730
8,830
680
167
3,200 gpd

MAKE-UP
CHEMICALS DYE a
ATMOSPHERIC JET DYE
BECKS MACHINES - DYE LIQUO-R
STORAGE TANKS
FIGURE ZP-1 SCHEMATIC OF DYE BATH RECONSTITUTION
E-31

the most likely reasons that reconstitution has not been widely accepted. However, a few textile industry experts believe that quality control and scheduling problems can be overcome in most circumstances. It must be approached on a case-by-case basis, following a methodology being developed during Phase I11 of this study. Revised rinse procedures in jet dyeing must be developed to accommodate reconstitution. A running rinse as used currently causes dilution of the dyebath, which would render the bath inappropriate for reuse.
ECONOMIC FEASIBILITY Cost savings are realized in the areas of water use,
wastewater discharge, energy savings, and auxiliary chemical use. In addition to the capital costs for the seven 1500-gallon holding tanks, pump, piping, valves, spectrophotometer, and microcomputer, additional expenses will be encountered for pumping and other operating costs. Some developmental costs, primarily research labor, will also be required.
Table IV-2 presents an analysis of the economics of basic dyebath reconstitution. The basis of these costs and savings is as follows:
O capital requirements f o r reconstitution include seven 1500-gallon, insulated, elevated fiberglass holding tanks, pump, plumbing modifications, and spectrophotometer and microcomputer
' holding tanks and related equipment must be purchased (i.e., capital equipment not already available at the mill)
' reconstitution economics developed for seven dye machines O dyebath used for dyeing five batches before being discharged O 80 percent water savings expected
cost of water service and sewer use is $1.43 /1000 gallons ' surfactant present at 0.1% of dyebath and valued at $0.35/lb
Other chemical values not given by mill and stated to have little value

TABLE IV-2 ECONOMIC ANALYSIS OF DYEBATH RECONSTITUTION
Capital
7 1500-gal insulated tanks $30,000 1 P U P 4,000
Piping and valves 13,000 Analysis equipment 9,ooo
Contingencies, engineering, electrical, installation (42%) 24,ooo Subtotal 56,000
Total Capital 80,000
Savings Sjyear
Chemicals, surfactant: 23,000 lb/yr 8,000
Energy, 1.8 x lo9 Btu/yr 12,000 3,900 6 Water and sewer, 2.7 x 10 gal/yr
23,900
Operation and Maintenance 5,400
Net annual savings
Payback period
18,500
4.3 years
E- 33

O
O incoming water at 100OF; exhausted dyebath water at 190'F As can be seen from the table, the payback period associated with this reconstitution scheme is approximately 4 years. This is a relatively long payback period for this recycle technology. The most significant factor affecting the payback period is the low value of recoverable auxiliary chemicals at this mill. The mill states that other chemicals have little value and are not to be used in estimates of recoverable value.
energy costs are $6.72 per million Btu
ENVIRONMENTAL BENEFITS With a reconstitution system employing 5 cycles, only about
20 percent of the water normally used for dyeing will be discharged, while most of the chemicals will remain with the recycled dyebath instead of being discharged. Therefore, reconstitution will cause a reduction in the volume of wastewater discharged. The above analysis estimated a reduction in wastewater flow of about 11,000 gpd or 4 percent of the mill total. However, the actual mass of pollutants that will be discharged depends on the buildup of these pollutants through a reconstitution series. This is in need of further research to determine actual pollutant reductions.
CONCLUSIONS O Dyebath reconstitution has been successful at full scale at
other mills, but effects on fabric quality and scheduling must be investigated to confirm technical feasibility at this mill.
O The long payback period is sensitive to actual chemical savings, which should be evaluated in more detail by mill personnel when considering this technology.
O Environmental benefits can be expected in terms of water and energy savings, but reduction in pollutant discharge is in need of further investigation to determine the buildup of pollutants over a reconstitution series.
E- 34

SECTION V
REUSE OF CONTINUOUS DYEING RINSE WATER
CURRENT CONTINUOUS DYEING PROCEDURE There is one continuous dyeing range at Mill W-9. However, it
has not been used for several months, and its operation is not anticipated in the near future, according to company plans. A sister mill, Mill W-10, uses three continuous dyeing ranges. The equivalent of one of these ranges is operated two days a week, that is, these ranges are operated far below capacity. One of the ranges uses a once-through cold spray rinse while the other two ranges use countercurrent flow wash boxes (Figure V - 1 ) . All three ranges use brine tanks to apply a continuously recycling salt rinse to fix the dyes. The rinse water discharge flow rate is estimated to be about 66,000 gallons per day. Table V-1 presents the wastewater characteristics.
The dye pad box contains direct dyes and a wetting agent, a sulfosuccinate compound.
PROPOSED MODIFICATIONS TO CONTINUOUS DYEING OPERATION A hyperfiltration system could be installed to concentrate the
rinse water into two fractions: concentrate that can be reused as dye makeup, and permeate that can be reused as rinse water.
The system would consist of a raw wastewater storage tank, a high pressure pump, a hyperfiltration unit, a permeate storage tank, a concentrate storage tank, and miscellaneous piping. Figure V-2 is a schematic of the proposed system. Table V-2 lists the equipment and design criteria.
The raw waste holding tank should be large enough to hold dye range waste during a hyperfiltration unit shutdown. The proposed system is similar to one currently operating at LaFrance textile mill. It shuts down 30 minutes per day for cleaning. Therefore, the raw waste storage tank should be sized for a 30-minute flow--about 1000 gallons.
Similarly, the permeate storage tank is sized to supply water to the dye ranges during cleaning of the unit--about 1000 gallons.
E- 35

FABRIC
DYE PAD DYE CHEMICALS s. J.
STEAMER I WASTEWATER
RINSE BOX
RINSE BOX
WATER sa- RINSE BOX
I RINSE BOX b-1
7G.A RINSE BOX
FIGURE Y-1 SCHEMATIC OF CONTINUOUS DYEING RANGE
E-36

TABLE V-1
CONTINUOUS DYEING WASTEWATER CHARACTERISTICS
Parameter Turbidity, NTU pH, standard units Ca cu
Mg Ni Na
Color (ADMI) Alkal. as CaC03 c1 Total BOD 'COD MBAS Phenolics TS TDS
TSS Temp. OF
Sulfate Cr Fe Pb Mn Zn
Concentration (mg/l) 10
9.5
5.6
0.95
1.5 < 0.0025
240
290
44
87 60
140
6 . 3 < 0.005
620
580
16
50
220
0.004
0.25 <0.001
< 0 . 1
0.12
Source: Wastewater sample collected 3/11/82 at Mill W-10.
E- 31

DYE RANQE
WASH WATER
,($ HOLDINQ
FIGURE Y-2 HYPERFILTRATION SYSTEM
E- 38

TABLE V-2
EQUIPMENT NEEDED TO RECYCLE CONTIN~JOUS DYEING WASTEWATER
Description
Hyperfiltration unit and high pressure pump”
Design Criteria
66,000 gpd
Raw waste holding tank 1,000 gal
Permeate holding tank 1,000 gal
Concentrate holding tank 200 gal
Interconnecting steel pipe, fittings, and valves 2,000 ft
>+Note that design of the unit depends on flux rate, which is influenced by temperature, spray rinse, so it is conceivable that the feed to the hyperfiltration unit will have to be heated to yield a reasonable flux rate. This factor and other factors, such as length of dyeing runs and time between runs, will determine actual design. These factors need to be investigated during pilot testing.
The one range investigated at Mill W-10 uses a cold
E- 39
TECHNICAL FEASIBILITY A full-scale hyperfiltration facility has recently been put
into service at LaFrance Industries (Riegel Textile Corp.). Preliminary reports indicate that separation and recovery of the dyestuff from the rinse water has been successfully achieved. The recovered rinse water can be recycled to provide water, sewer use, and energy savings. Efforts to reuse the recovered dyestuff have not been completely successful. Work at LaFrance is continuing. The LaFrance system is a hollow tube system with a zirconium oxide polyacrylate membrane. It is capable of operating at high temperatures and high pH. However, wastewater at Mill W-10 is not excessively hot o r high in pH. Therefore, other membranes may be more suitable at Mill W-10. Further discussion of the LaFrance installation and general applicability of HF is found in Volume 1.
Design parameters include flux rate, temperature, and pressure. Pilot tests are necessary to determine these parameters. Since production appears to be subject to variation, it is difficult to establish a schedule for operation of the hyperfiltration unit and to determine the appropriate size of the unit. Generally, long runs of a single dye type provide the optimum conditions for economical operation.
ECONOMIC FEASIBILITI Cost savings from recyclelreuse o f continuous dyeing
rinsewater can result from water and sewer charge savings, energy savings, and chemical recovery. Operating costs result from operation of the hyperfiltration system. Capital costs include estimates for the hyperfiltration unit and high pressure pump, holding tanks, and interconnecting piping, fittings, and valves. The costs and savings summarized in Table V-3 are based on the following:
O Capital and O W costs as developed in Volume 1. O Water service and sewer charges = $1.43/1000 gallons O No energy savings expected, because dye rinsewater is cold.
O Chemical recovery - direct dyes in the rinsewater assumed to be 0.5% of the dye applied. Average dye applied is 250 lb/day. Value of dye = $3.00/lb.
E-40

TABLE V-3 ECONOMIC ANALYSIS OF HYPERFILTRATION
Capital
HF module and high pressure pump 2000 ft pipe, elbows, valves 2 1,000-gal storage tanks 1 200-gal storage tank
Subtotal
Contingencies, engineering, electrical, installation, 42%
Total
Savings
Recoverable dye, 130 lb/yg Water and sewer, 6.0 x 10 gal/yr
Total approx.
o&M costs
Net Annual Costs
No payback
$632,000 51,000 6.000 2;ooo
$691,000
$29 1,000 $982,000
$ 400
$ 9 ,400
119,000
$110,000

Continuous dye range operates 100 days per year. O Assumed 10 percent blowdown required for permeate and
concentrate. Capital and annual costs are based on a 66,000-gpd design
flow, without regard for other important parameters such as flux rate, and dyehouse operation times. Therefore, these costs are possibly conservative, as indicated by the fact that a similar system at LaFrance had capital costs of about $500,000.
Annual costs exceed the annual savings under the assumptions stated above. Under these assumptions, therefore, no payback is expected. With greater chemical recovery that may occur with greater production, or at greater amounts of dye and chemicals in the rinse water, the potential for net annual savings increases. Actual chemical savings would need to be carefully studied in pilot tests.
ENVIRONMENTAL BENEFITS The use of this recycle technology results in a reduction in
wastewater flow of about 6 million gallonsjyear, o r 60,000 gpd when the continuous dye range is operating.
The hyperfiltration system is expected to reduce discharge of organics and color, but the extent of these reductions depends on the actual amounts of dyes and auxiliary chemicals recovered. Table V-1 indicates that the rinse water is fairly dilute with respect to pollutant parameters, so that overall reductions are not expected to be significant.
CONCLUSIONS O Pilot testing is needed to confirm the technical feasibility
of hyperfiltration for dye recovery, and to establish design criteria for the recycle system.
O Actual chemical savings must be examined during pilot tests to more carefully determine economic feasibility. Preliminary analysis shows the economics are not promising.
' Environmental benefits of hyperfiltration of dye wastewater for dye recovery are expected to be minor.
E- 42
MILL SURVEY REPORT
MILL Y-4 ACRYLIC YARN DYEING
F- i

Mill Y - 4 is a yarn dyeing facility. Basic and disperse dyeing of acrylic yarn, as well as bleaching, are the principal manufacturing operations here. Water use approaches and sometimes exceeds 1 mgd. Figure 1 presents the basic manufacturing processes and recycle/reuse options considered, and summarizes both technical and economic feasibility as well as further research needs f o r each alternative. Table 1 illustrates the projected savings, costs, and paybacks associated with recycle/reuse options considered at this mill.
Two recycle/reuse technologies were considered at this mill: dyebath reconstitution, and chlorine oxidation (decoloring) and recycle of dyeing wastewater.
Reconstitution of basic dye, disperse dye, and bleach bath wastewaters is both economically and technically attractive at Mill Y - 4 . Reconstitution should be pursued and implemented further.
Basic dyebath reconstitution is a demonstrated technology at this mill. As a result there is little impetus to further pursue the much more expensive recycle technology of dyebath decoloring by chlorine oxidation.

.
BASIC DYEING
DISPERSE DYEING UNDYED YARN
BLEACHING -
*FINISHED YARN
-
Technologies Evaluated Feasibility
Technical Economic
Basic Dyeing v. Decolorization (C1 ) and reuse Marginal Marginal e. 2 . F. Direct Reuse (Reconstitution) Feasible" Promising
Disperse Dyeing Direct Reuse (Reconstitution) Feasible Marginal
Bleaching Direct Reuse (Reconstitution) Feasible* Promising
+? Has already been demonstrated at mill on full-scale
Data Needs
Additional testing None*
Demonstration
None"
FIGURE 1. MANUFACTURING PROCESSES AND POTENTIAL RECYCLEjREUSE TECHNOLOGIES AT MILL Y - 4 .

RecycleIReuse Scheme
TABLE 1 SUMMARY OF ECONOMIC AND ENYIRONHENTAL BENEFITS OF RECYCLE/AEUSE OPTIONS
Chlorine Oxidation of Basic Dye Wastewater
Reconstitution of Basic Dye I Wastewater" (holding tank) rrl
2 Reconstitution of Disperse Dye
Wastewater" (rinse tank)
Reconstitution of Bleach Bath Wastewater* (holding tank)
Net Annual Capital Payback Flow Reduction COD Reduction Savings cost (years) a!!! % Total Ib/day % Total
$141,000 $355,000 2.5 175,000 20 875 40
38,000 12,000 0.3 7,560 1 48 2.4
J-.- ..a -*-L ..- 2,900 9,500 3.3 7,560 1
25,000 12,000 0.5 8,500 1 8 0.4
* Per Machine *- Insufficient Information
.

TABLE OF CONTENTS
Summary . . . . . . . . . . . . . . . . . . . . . . . . . . . . ii Table of Contents . . . . . . . . . . . . . . . . . . . . . . . . v
I . INTRODUCTION . . . . . . . . . . . . . . . . . . . . . . . 1
Facility Description . . . . . . . . . . . . . . . . . 1
Manufacturing Processes . . . . . . . . . . . . . . . 1
Overall Mass and Energy Balances . . . . . . . . . . . 4
Evaluation of RecyclefReuse Technologies . . . . . . . 13
I1 . CHLORINE OXIDATION OF BASIC DYE WASTEWATER . . . . . . . . 14
Description of Manufacturing Process and Proposed Modification . . . . . . . . . . . . . . . 14
Technical Feasibility and Design Criteria . . . . . . 14 Economic Feasibility . . . . . . . . . . . . . . . . . 21
Environmental Benefits . . . . . . . . . . . . . . . . 24
Conclusions . . . . . . . . . . . . . . . . . . . . . 24
I11 . ALTERNATIVE RECONSTITUTION METHODS . . . . . . . . . . . . 26
Description of Manufacturing Process and Proposed Modification . . . . . . . . . . . . . . . 26
Technical Feasibility and Design Criteria . . . . . . 27
Economic Feasibility . . . . . . . . . . . . . . . . . 28
Environmental Benefits . . . . . . . . . . . . . . . . 31
Conclusions . . . . . . . . . . . . . . . . . . . . . 31
IV . RECONSTITUTION OF BASIC DYEBATHS . . . . . . . . . . . . . 32
Description of Manufacturing Process and Proposed Modification . . . . . . . . . . . . . . . 32
Technical Feasibility and Design Criteria . . . . . . 32
F-v

TABLE OF CONTENTS (continued)
Economic Feasibility . . . Environmental Benefits . . Conclusions . . . . . . .
V . RECONSTITUTION OF DISPERSE DYEBATHS . . . . . . . . . . Description of Manufacturing Process and Proposed Modification . . . . . . . . . . . . . .
Technical Feasibility and Design Criteria . . . . . Economic Feasibility . . . . . . . . . . . . . . . . Environmental Benefits . . . . . . . . . . . . . . . Conclusions . . . . . . . . . . . . . . . . . . . .
VI . RECONSTITUTION OF BLEACH BATHS . . . . . . . . . . . . . Description of Manufacturing Process and Proposed Modification . . . . . . . . . . . . . .
Technical Feasibility and Design Criteria . . . . . Economic Feasibility . . . . . . . . . . . . . . . . Environmental Benefits . . . . . . . . . . . . . . . Conclusions . . . . . . . . . . . . . . . . . . . .
%
36
38 38
40
40 40
44 46
46
49
49 49
5 1
5 3 5 3
References . . . . . . . . . . . . . . . . . . . . . . . . . . 5 7
F-vi

SECTION I INTRODUCTION
Mill Y-4 is a major yarn dyeing facility located in the Southeast. This report assesses the applicability of two technologies, chlorine decolorization and reconstitution, to enable reuse of the process wastewater from this facility.
FACILITY DESCRIPTION This mill is primarily engaged in the dyeing of acrylic yarn,
with over 95 percent of the finishing on a weight basis being comprised of this activity. A flow schematic of the yarn dyeing operations is presented in Figure 1-1. Of the total finished acrylic yarn production, 68 percent is basic dyed, 22 percent is disperse dyed, and 10 percent is bleached white. The remaining finishing activities at this mill are varied, but insignificant in terms of total production.
MANUFACTURING PROCESSES
Yarn Dyeing There are over 20 dye machines in the yarn dyeing area, all
but four of which are pressure machines. All the machines are operated almost constantly six days per week. Bleaching, basic dyeing, and disperse dyeing are performed in the pressure machines. The atmospheric machines are used for shaded and variegated shade dyeing. A substantial number of repeat operations occur in the yarn dyeing area.
Basic dyeing comprises the majority of dyeing at Mill Y-4. This dye class is used for dyeing acrylic yarn and exhausts to about 95
percent. A schematic of the basic dyeing process at this mill is pre- sented in Figure 1-2. The dye machine is filled with warm water and sodium sulfate is added. The pH is depressed to the range 3 to 5 with sulfuric or acetic acid. Next added are a leveler/retarder, softener, and non-ionic wetter. Basic dyes are added and the dyebath temperature raised for dyeing. After the goods have been dyed, the bath is cooled and dumped, and the goods are rinsed with fresh water. This cycle requires about & - I f 2 hours. .
F -1

UNDYED ACRYLIC YARN [___r__l BASIC
DYEING BLEACH I NG DISPERSE
DYEING
INATION
RINSING RINSING
RINSING 3
RINSING
+ SOFTENING
FIGURE 1-1 GENERAL ACRYLIC YARN DYEING ACTIVITIES AT M I L L Y - 4
F- 2

7 -
I 2,333 GAL.
YARN ........
I
BASIC ...... L - DYEING ...... .* RINSING -
FINISHED YARN TO EXTRACTION
BASIC DYE SODIUM SULFATE ACETIC ACID SOFTEN E R LEVELER WETTER
r29333 GAL.
UNDYED c
AND DRYING
c WATER AND WASTEWATER
TO SEWER CHE M ICALS
PRODUCT 4433 GAL.
---- ..........
2,100 GAL.
I
FIGURE 1-2 FLOWS ASSOCIATED W I T H BASIC DYEING ( P E R IOOOLB P R O D U C T I O N )
WATER (233 GAL) 2,333 GAL.
F-3

Disperse dyeing is also used to dye some acrylic fibers. This process is illustrated in Figure 1-3. The dye machine is filled with warm water, and non-ionic wetter and disperse dyes are added. The dyebath is heated and the goods are dyed. The bath is then cooled and dropped. The machine is then filled with fresh water for rinsing, and both softener and acetic acid are added. After rinsing, the bath is dumped. The total disperse dyeing cycle lasts about two hours.
Yarn is bleached by filling the machine with warm water and adding sodium chlorite and auxiliary chemicals. The bath is then heated and subsequently cooled and dropped. Steps for dechlorination, softening, and rinsing follow. The bleaching cycle usually takes about 3-1/2 hours to complete and is shown in Figure 1-4.
Other Finishing Miscellaneous other fibers and products are dyed and finished
at this facility. Although this dyeing and finishing accounts for only a small portion (five percent) of the total production at Mill Y-4,
numerically over 40 percent of the dyeing machines at the mill are available for these various activities. Four-fifths of these are package dyeing machines of various sizes and they are used to perform pressure dyeing. The remainder are skein dyeing machines used to perform atmospheric dyeing.
OVERALL MASS AND ENERGY BALANCES
Water and Wastewater and Characteristics Mill Y-4 purchases city water and softens it prior to use.
The characteristics of this softened city water are presented in Table 1-1.
Water use at Mill Y - 4 during the sampling period, based on
flow readings of softened water, averaged 1.09 mgd for a 6-day work week. This is significantly higher than would be expected based on
other factors. For example, based on operating 300 days per year, the average daily flow calculated from water use billings in 1981 was 0.76

.
.
' 2,333 GAL.- I I I I I
1 1
CHEMICALS ---- . . . . . . . . . . PRODUCT
I
TO SEWER 4433 GAL.
UNDYED YARN . . . . . . .
F I G U R E 1-3 FLOWS ASSOCIATED WITH DISPERSE DYEING (PER 1 0 0 0 L B PRODUCTION)
l l
DISPERSE - - -D - DYEING 1.. .. . .*
RINSING - FINISHED ... RN TO EXTRACTION
I WITH ENTRAPPED 2,100 GAL. WATER (233 GAL)
2,333 GAL.

I I I
2,333GAL.i I
I ,
SOFTEN E R
I I I
UNBLEACHED YARN ...........
4 WATER AND WASTEWATER
l t .
.- BLEACH I NG ._LL_L' ANTICHLORI SOFTENING/ RINSING BLEACHED YARN
......
TO EXTRACTION P AND DRYING
TO SEWER CHEMICALS
PRODUCT 11.433 GAL
---- ..........
i
FIGURE 1-4 FLOWS ASSOCIATED WITH BLEACHING ( P E R IOOOLB PRODUCTION)
WITH ENTRAPPED
F- 6
WATER (233 GAL) 2,100 GAL. 9,333 GAL.

. Parameter
TABLE 1-1
WATER QUALITY FOR SOURCE WATER
PH Temperature [ O F ("C) ] Color (ADMI) BOD COD TS TDS TSS Phenolics Chloride Alkalinity Hardness Cadmium Chromium Copper Iron Nickel Sodium Zinc
$c Sampled on April 29, 1982
Concentration (mg/l)*
7.3
75 (24)
13
15
31
190
230
0
< 0 . 0 4
1.1 137
<1
< 0 . 1
< 0 . 1
< 0 . 1
0 . 1
< 0 . 1
89
0.24

mgd. Although yarn dyeing activities were fairly typical during the field investigation, the output due to other dyeing activities during the sampling period was almost double the average weekly 1981 production figure for these activities. These activities may have accounted for the higher water use.
Dyehouse wastes pass through a Ludell heat exchange system to recover some of the heat present in discharged wastewater. After pass- ing through the heat recovery system and a lint screen, the wastewater flows into a settling pond before being discharged to the municipal sewer. This basin provides a 1 to 1.5 day detention period and is located about 113 mile from the plant. Pollutant concentrations found in the final (pond)'effluent are presented in Table 1-2.
In addition to source water and effluent discharge, wastewater samples from dye machines performing basic dyeing, disperse dyeing, and bleaching operations were also collected and analyzed. Conventional and nonconventional pollutant concentrations for various dye and bleach baths, as well as the final effluent are shown in Table 1-3. Daily mass loadings of these pollutants are listed in Table 1-4 . Other wastewater constituents that affect recycle are discussed in subsequent sections of this report under the appropriate recycle technologies.
According to Table 1-4, virtually all of the BOD and COD are attributable to yarn dyeing operations here, yet only about a tenth of suspended solids are generated in these operations. It is possible that biological activity in the settling pond or contamination from dusty fields and roads nearby contributed to the suspended solids level in the final effluent.
Energy Energy requirements at Mill Y-4 are met using natural gas,
fuel oil, and electricity. The present boiler, providing steam for heating the dye machines and other needs, uses natural gas or fuel oil depending on the season. It will soon be replaced with a coal-fired boiler. In 1981, natural gas usage was 158,883 MCF and fuel oil usage was 913,835 gallons. Electricity is used for machinery operation and lighting, and 5,380,368 kwh were consumed in 1981. A Ludell heat recovery system is used at this facility to recovery some of the heat present in discharged wastewater.
Fi3

TABLE 1-2
FINAL EFFLUENT CHARACTERIZATION
Parameter Average Concentration (mgjl)"
pH (median) Temperature [OF ("C)] Color (AJJMI) BOD COD TS TDS TSS Phenolics Hardness Cadmium Copper Iron Nickel Zinc
7.3
97 ( 3 6 ) 250
85
290
1590
1490
47
<0.047 (2 samples) 85 -.A ,. ,.
< 0 . 1 1
0.24 .LJ. .. ,\
0.56
;k Based on 3 24-hour automatic composite samples from April 2 9 , 30, and May 1, 1982.
**- Below analytical quantification level
f
*- 9

.-
TABLE 1-3 WASTEWATER CHARACTERISTICS
Batch Concentrations (mg/l) Wastewater Source or Date BOD, COD TSS Phenolics pH
_I
Basic Dyeing Bath
Basic Dyeing Rinse
Disperse Dyeing Bath
Disperse Dyeing Rinse
1 2
3
4
5 6
Average
1
2
3 4
5 6
Average
1 2
3 Average
1
2
3 Average
100
150
300
1,300
540 80
410
110
130
92
56 140
84
100
220
350 310
290
72 100
96
89
610
1,200
1,100 2,800
610
790 1,180
360
540 320
310 1,340
-- 570
1,000
1,500
1,230
1,240
290 280
290 290
16
30 19
35
32 30
21
13 28
5 1 4 8
40
24
2
3
< 1
2
6
7
8
7
< .040
< .040
< .040 < .04O
< .040 < ,040
< .040
<.040 < .040
< .04O
< .040 < .040
-- < .040
.062
.051
< .040
< .O51
< .040
< .040 < ,040
< ,040
4 .4
4 .4
4.5
4.5 4.4
6.6 --
7.0
7 .4
6 .1
1 . 4 6 . 8
7 . 5 --
8.3 6 .8 8 .1 --
6 .1 6 .2
6 .3 --
F-1 0

TABLE 1-3 (Cont'd)
Batch Concentrations (mg/l) Wastewater Source or Date BOD, COD TSS Phenolics pH
_I
Bleach Bath
Bleach Rinse
Bleach Dechlorination Bath
Bleach Dechlorination Rinse
Bleach Softening Bath
Final Effluent
1
2
Average
1
2
Average
1 2
Average
1
2 Average
1
2 Average
4 / 2 9 / 8 2
4 / 3 0 / 8 2 5 / 1 / 8 2
Average
380 260
320
37
35 36
22
23
22
-- 12 12
19
18 18
68 140
48
85
840
870
855
170
130
150
-- 140 140
-- 94
94
100
78
89
280
310 270 290
< 1
6
< 4
< 1
6
< 4
5 6
6
-- 6
6
15
2 8
15 26
100 47
< .040 < .040
< .040
< .040
< .040 < .040
-- < ,040 < .040
-- < .040 < .040
< .040 --
< .040
.054
< .040 --
< .047
3.6 3 . 5 --
6.5 6 .1 --
-- 6.0 --
-- 6.3 --
6.4
5 .3 --
7.3
7 .3 5 . 9 --

TABLE 1-4
POLLUTANT LOADINGS
Flow BOD, COD TSS Phenolics J
Wastewater Source gal/day % Total lb/day % Total lb/day % Total lb/day % Total lb/day % Total
Basic Dyeing Bath Basic Dyeing Rinse Disperse Dyeing Bath
w Disperse Dyeing Rinse N Bleach Bath I r
Bleach Rinse Bleach Dechlorination Bath Bleach Dechlorination Rinse Bleach Softening Bath Other Flows" Final Effluent
96,782
96,782
32,263
32,263
13,195
13,195
13,195-
13,195
13,195
500,935
825 ,OOO*
12 331 57 952
12 81 14 460
4 78 13 334
4 24 4 78
2 35 6 94 2 4 1 17
2 2 < 1 15
2 1 < 1 10
2 2 < 1 10
30 _- 27 -- 100 585 100 2,000
48 22 7 < .032
23 19 6 < .032
17 < 1 <1 < .013
4 2 < 1 < ,011
5 < 1 < 1 < .004 1 < 1 < 1 < .004
1 < 1 <1 < .004
1 <1 < 1 < .004
< 1 < .a04 1 < 1
< ,323 -- 270
100 320 100 < .323
-
_ _
10
10
4
3
1
1
1
1
1 --
100
* Miscellaneous streams such as flows from other finishing activities, machine washing in yarn dyeing area, sanitary, cooling, utility, and other plant flows. between measurements of the final effluent and measurements of the basic dyeing, disperse dyeing, and bleaching
operations.
Flow and loadings attributed to this classification represent the difference
+kBased on water use minus estimated product losses, evaporation, and steam losses
EVALUATION OF RECYCLE/REUSE TECHNOLOGIES The recycle/reuse technologies applicable to Mill Y-4 that are
evaluated in this report.are the following: 1. Basic dye wastewater - chlorine oxidation for
decolorization. 2. Alternative reconstitution methods - holding tanks; in
situ reconstitution with separate rinse tanks. Reconstitution of exhausted basic dyebaths. Reconstitution of exhausted disperse dyebaths.
3. 4. 5. Reconstitution of exhausted bleach baths.
..
F- 13

SECTION I1 CHLORINE OXIDATION OF BASIC DYE WASTEWATER
DESCRIPTION OF MANUFACTURING PROCESS AND PROPOSED MODIFICATION Dyeing is performed 6 days a week at Mill Y-4. In a typical
week, approximately 277 batches of yarn would be basic dyed. Wastewater due to basic dyeing, including rinsing, during this period would be 1.16 million gallons. Typical daily figures would be as follows: 46 batches and 193,000 gpd. A schematic of the flows, production, and chemicals associated with a typical batch was illustrated in Figure 1-2. It is estimated that approximately 57 percent of the wastewater from yarn dyeing is associated with basic dyeing. Table 11-1 presents the wastewater characteristics associated with these flows.
A comparison of the existing and revised process schematic incorporating chlorine oxidation is shown in Figure 11-1. Scheduling and piping modifications will be necessary in order to segregate the basic dye wastewater from other mill wastewaters. An equalization tank is necessary prior to the chlorine oxidation system to enable blending of the wastewater and thus prevent sudden changes in the wastewater being treated. The wastewater next enters a series of treatment tanks in which it is decolored by chlorine oxidation. Liquid caustic is used as a buffer to maintain proper pH during oxidation, and sulfur dioxide gas is employed as an antichlor. Decolored water is filtered to remove larger particulates and is stored briefly before being returned to the dyehouse for reuse in basic dyeing. It is important that the water returned to the mill be segregated and used only for basic dyeing to prevent problems with other activities such as bleaching and disperse dyeing.
TECHNICAL FEASIBILITY AND DESIGN CRITERIA
Literature and Previous Applications Both Perkins, et al. (Reference l), and Textile Systems, Inc.
(TSI) have investigated decolorization of various dye wastewaters by chemical oxidation. Ozone and chlorine have both been successful with
F-14

TABLE 11-1 BASIC DYE WASTEWATER CHARACTERIZATION
Average Concentration (mg/l)+ Parameter Dyebath Rinsewater
pH (median) 4 . 4 7.2 Temperature ["F("C)] 209 (98) 99 ( 3 7 ) BOD 410 100
COD 1,180 570 (5 samples) TS 9,500 840
TDS 9,180 710 TSS 21 24 Hardness (as CaC03) 43*: 1 Phenolics < 0.040 < 0.040 (5 samples) Color (ADMI) 14 430$~+~ 150 Selected metals were also analyzed in the wastewater from one basic dyebath sample and the results were as follows: Cu - < 0 . 1 mg/l; Fe - 0.2 mg/l; Ni - 0.1 mg/l; Zn - 1.8 mg/l
Cd -<0.1 mg/l; Cr -<0.1 mg/l;
"Based on 6 grab samples unless otherwise noted *One value was 240. Without this value, the average is 4 .
*One value was 83,000. Without this value, the average is 710.
F- 15

TO POTW 825,000
SETTLING
CIM w m 925,000
GPD I
LOSSES (275,000 GPD)
W O O GPD LOSSES (275,000 GPO)
S 650,000 C
- R E POND E N
SETTLING , GPO - L I 907,000 GPD
BLOWDOWN 18,000 GPD
I ' BLEACHING I 1 (66,000GPD) I
I \OTHER ACTIVITIES/ I (626,000GPD)
FIGUREE-I . COMPARISON OF EXISTING AND REVISED DYEHOUSE WASTEWATER TREATMENT SYSTEMS EMPLOYING CHLORINE OXIDATION.
F-16
,

”
certain dyes in producing a water suitable for reuse in dyeing, and test dyeings over a series of reuse applications have been acceptable.
Oxidation has been shown to decrease the molecular weight of dye molecules by attacking amide and other molecular linkages, thereby destroying chromophoric groups and decoloring the wastewater.
Thus far, only oxidation by chlorine has been employed in full-scale applications for dye wastewater decolorization, and this has been primarily for acid dyes. Ozone has not been applied because of costs of generation, practicality, and safety hazards.
Research by Perkins considered only acid, direct, disperse, and reactive dyes. Of dye classes that TSI has had experience with, basic dye wastewaters are more expensive to treat than acid o r disperse dye wastewaters, but cost somewhat less to treat than fiber reactive dye wastewaters. In general, TSI’s attitude is that although most dyes are treatable with their system, acid and disperse dyes are most appropriate for treatment by chlorine oxidation due to complications associated with treatment of other dyestuffs.
Bench Scale Results Bench scale chlorine decolorization tests were performed on
three basic dye wastewater samples. Each sample was comprised of 4
exhausted basic dyebaths combined in equal portions. The samples were dosed at three levels: approximately 25, 50, and 100 mg/l of chlorine. A dilute solution of commercial bleach was standardized and added in varying amounts to each aliquot of waste. A common dilution factor of 5 percent was obtained by adding chlorine demand-free dilution water to compensate for the varying volumes of chlorine solution needed. Samples were placed in a darkened area immediately after dosing for 15 minutes. Optimum dosage for decolorization was determined visually and noted for additional testing. Aliquots were then taken from all samples for total, free, and available chlorine analyses and the remaining samples were dechlorinated with an excess of solid sodium thiosulfate. ADMI color was run on all dechlorinated samples. In addition, milliliters titrant to pH 7, total dissolved solids, and turbidity were run on those

samples previously selected as being the most decolored. The charac- teristics of these wastewater samples prior to treatment are shown in Table 11-2. Pertinent information concerning the treated samples is presented in Table 11-3.
As can be seen from Table 11-3, color levels decreased sig- nificantly as chlorine dosages increased with samples A and C. Sample B was relatively color free to start, and treatment had little effect. And in all three samples, turbidity and total dissolved solids levels increased somewhat following treatment.
These bench scale tests show that the basic dye wastewater is readily decolored by chlorine but that a dose of 100 mg/l is generally required. A 10- to 15-minute reaction time appears sufficient.
Technical Design Criteria TSI has a patent covering the decolorization of textile dye
wastes by chlorination. The smallest standard TSI treatment unit employing this technology is sized at 175 gpm (250,000 gpd). However, the relevant flow at Mill Y-4 is only 175,000 gpd. A 250,000 gpd unit provides a hydraulic safety factor of 1.4 .
The information developed in the aforementioned bench scale trials indicate a chlorine dose of 100 mg/l to be necessary for decolor- ization of basic dye wastewaters. However, the wastewater in these experiments was dye wastewater only. Fifty percent of the flow to the full-scale decolorization system would be comprised of "colorless" rinse water. Hence a design chlorine dosage of 50 mg/l should be sufficient for the combined dye and rinse waters.
A holding tank providing 10,000 gallons storage (approximately one hour) prior to the treatment system is necessary. Storage capacity for return to the mill is equal to the volume anticipated in two hours of average flow, i.e., 15,000 gallons.
Design criteria are summarized in Table 11-4. The discussions in this section assume that dyebath
reconstitution is not practiced at the mill. It is impractical for a
mill that reconstitutes a significant fraction of its dyebaths to institute chlorine oxidation since the primary economic impetus for both
F-18

TABLE 11-2 BENCH-SCALE CHLORINE DECOLORIZATION STUDY -
UNTREATED SAMPLE CHARACTERIZATION
Concentration (mg/l) Parameter Sample A;: Sample BJ; Sample C* PH 3.8 3.9 6.0 Turbidity < 1 < 1 < 1 BOD NA 340 1,090 COD 1,470 340 1,500 TS 9,895 8,600 9,030 TDS 6,140 8,420 8,520 TSS 3 15 11 Hardness (as CaCO ) 48 8 . 1 <1 Phenolics <0.040 < 0.040 < 0.040 Color (ADMI) 26,000 35 7 17,200
3
Alkalinity (as CaC03) 0 0 0 Chloride 694 41 120 Total Phosphorus (as P) NA NA 1.2 Sodium 4,100 3,900 NA
*Samples are each comprised of 4 exhausted basic dyebaths combined in equal portions NA - No Analysis
F- 19

I <
TABLE 11-3 BENCH-SCALE CHLORINE DECOLORIZATION STUDY
mATF.D SAIfpLE CBARACTERIZATION
Chlorine Acid to* Total Chlorine Remaining Chlorine mm color* Adjust to Dissolved
~
Dosage After 15 minutes Consumed Original Final pH = 7 Solids Turbidity Sample (mgll) (mK/l) ( m s m Pi3 pE = 7.6 (dl25 m1 dosed sample) (UKm (NTU) Comments
Sample A 110 20 54 See Co-nt 27 see conPent -_ 7 u 0
0
Sample B 110 54 27
0
42 10 11 _ _
Sample C 110 39 54 See Comment 27 See Comment -- 0
640 7,700 14.000 25,000
220 490 440 361
310 980
6,200 34,100
700 5.900
11,000 26,000
230 460 900 357
410 1,300 5,400 17,200
9900 -- -- 6140
9000 -- -- 8420
9400 _= _ _
a m
10 Very red
_ _ masked C12 < 1 DPD endpoint
_ _ sample-color
Distinct color
green to
13 _ _ change from __ < 1 yellow
89 Orange sample _ _ which turned red - color DPD endpoint
__ 2 < I masked C1
*Values for dosed samples not corrected for 5% dilution factor. "0.025N Sodium hydroxide (NaON).

wastewater recycle/reuse schemes is auxiliary chemical recovery. In addition, reconstitution leads to lower flows and may cause the buildup of certain interfering substances that could affect the chlorine dosage and reaction time needed for decoloring.
ECONOMIC FEASIBILITY Cost savings are realized in the areas of water use, waste-
water discharge, energy savings, and auxiliary chemical use. In addi- tion to capital costs for the treatment system, additional operating costs will be encountered both for labor and chemicals for the oxidation/recycle process.
Table 11-5 presents an analysis of the annual cost savings realized through dyebath oxidation and recycle. The basis of these costs and savings is as follows:
0
0
0
0
0
0
0
0
0
0
0
average daily flow due to basic dyeing is 193,000 gpd, evenly divided between dye wastewater and rinse wastewater blowdown from system is 10 percent plant operates 300 days per year treatment chemical requirements are as given in Table 2-4
treatment chemical costs: chlorine at $0.08/lb caustic at $0.27/1b sulfur dioxide at $0.15/lb
annual labor requirement is 4 man years cost of water supply is 24.63C/1,000 gallons cost of wastewater discharge is 58.90C/1,000 gallons forty percent recovery of leveler, sodium sulfate, and wetter chemicals used in basic dyeing; six percent recovery of sof- tener mill pays $5.64/million Btu source water available at 90°F; return from chlorine decolor- ization storage tanks at 12O0F. The estimated capital cost (June, 1982) of an oxidation
recycle system for this mill is approximately $350,000, including cost for the reaction and storage tanks, chemical feed and control systems,
F- 21

Oxidation Reaction Time Chlorine Dose
Reaction pH Caustic Feed
Dechlorination Reaction Time Sulfur Dioxide Dose
TABLE 11-4 DESIGN CRITERIA
DYEBATH OXIDATION/RECYCLE
Total Treatment Capacity
Storage Capacity
Hydraulic Flow (average)
Design Flow
minutes
m g l l lb/day
mg/l lb/day
minutes
mg/l lb/day
10
50 75
90
130
5 50 75
gallons 10,000 hours at average flow 1.4
gallons 15,000 hours at average flow 2
120 0.175
175
F- 22

TABLE 11-5 ECONOMICS
DYEBATH OXIDATION
Annual Operating Costs
Oxidation Process Chemicals Oxidation Process Labor Oxidation Process Maintenance
Total
Annual Savings
,Water Supply Sewer Use Charges Auxiliary Chemicals Energy (Steam Savings)
Total
Capital Cost
Equalization and Chlorine Oxidation
Payback
Payback is estimated at approximately 2.5 years.
$ 16,000
80,000
20,000 $116,000
$ 13,000
31,000
138,000
75,000 $257,000
$355,000
F- 23

piping, pumps, electrical service, site work, and engineering costs. The resulting payback period is about 2.5 years based on annual operating savings of approximately $140,000. However, the payback period is sensitive to projected chemical savings. For example, if only 50 percent of the chemical savings projected above were realized, the payback period would nearly double to 5 years.
In addition, the mill has identified a number of other factors that could affect the economics o r practicality of chlorine oxidation here. Among the items that would need to be examined prior to implementation of a chlorine decolorization system are the following:
o potential oxidation of retarder-levelers, resulting in lower chemical savings
o possibility that exhaustion curves and retarders would be altered resulting in dyeing problems for particular shades ability to control softener amounts when using reuse water for dyeing Although potential problems such as these may be solvable, the
costs of overcoming o r minimizing these problems may result in a significantly longer payback period than that projected in Table 11-5.
o
ENVIRONMENTAL BENEFITS The recirculation of 175,000 gpd as a result of chlorine
oxidation would reduce the mill's yarn dyeing wastewater discharge by 54 percent; total mill discharge would be reduced by 20 percent. Total mill BOD5 and COD discharge amounts would be reduced by about 40 percent, o r by 250 lb/day and 875 lb/day respectively. Energy savings of approximately 44 million Btu per day would be realized.
CONCLUSIONS o The economics of chlorine oxidation at this mill appear mar-
ginal due to high capital costs. o Additional testing is necessary to determine optimal dosages,
percent of auxiliary chemical recovery, and the effect on product quality of reusing the decolorized water for dyeing and rinsing.
F- 24

o Potential formation of chlorinated organics as a result of treatment needs to be studied. The mill feels chlorinated aromatics are likely due to the levelers and softener used in dyeing.
F- 25

SECTION I11 ALTERNATIVE RECONSTITUTION METHODS
DESCRIPTION OF MANUFACTURING PROCESS AND PROPOSED MODIFICATION The batch dyeing process, both at this and other textile
mills, generally consists of the following procedures. Source water and the product to be dyed are first added to the dyeing vessel. Dyes and auxiliary chemicals, such as pH control agents, leveling agents, softening agents, and wetting agents, are next added. The dyebath is then slowly heated to the appropriate dye strike temperature, and this temperature is maintained f o r the appropriate dyeing period. Upon
completion of dyeing, the bath is cooled and dumped. This exhausted dyebath, although devoid of most of the original dyestuffs, still con- tains nearly all of the auxiliary chemicals, as these are theoretically unchanged by the dyeing process and do not generally exhaust onto the product.
Dyebath reconstitution is a modification to this traditional dyeing process wherein the spent dyebath following each dyeing cycle is analyzed, reconstituted to the desired concentration of dyes and auxili- ary chemicals, and reused. Depending on the dyestuff and degree of accuracy required, analysis and reconstitution can be performed using a spectrophotometer o r using rule-of-thumb estimates based on operating experience.
Two alternative approaches to dyebath reconstitution that have been explored at Mill Y - 4 are presented in this report. These alter- natives are as follows:
Alternative 1. Pumping the exhausted dyebath to a holding tank, while the product is rinsed in the same machine in which it was dyed. Once the dyed yarn has been removed, and undyed yarn has been loaded, the exhausted dyebath is returned to the machine and reconstituted.
Alternative 2 . Removing the dyed yarn from the exhausted dyebath and placing it in a separate dye machine for rinsing. Simultaneously another batch of undyed yarn is placed into the original machine con- taining the exhausted dyebath, and this dyebath is reconstituted.
F- 26

This section discusses and compares these alternatives as an introduction to specific applications in Sections IV, V, and VI.
TECHNICAL FEASIBILITY AND DESIGN CRITERIA
Literature and Previous AEplications Virtually all literature documenting experience with dyebath
reconstitution have investigated Alternative 1, the use of holding tanks. No references providing information on Alternative 2 were found. The exclusive use of Alternative 1 is warranted for certain segments of the textile industry. For example, it is generally impractical for carpet dyers to move carpet from one dye machine to another simply to achieve rinsing. However, at mills where the dyed products are items such as yarn o r piece goods, either of the alternatives listed above may be applicable.
General Considerations The most desirable alternative at a particular mill will
depend on a number of circumstances. Factors to be considered include the following:
1. Effect on product quality. Will product quality be adversely affected if the dyed goods are removed from the dye machine prior to rinsing and/or not rinsed immediately?
2. Level of production at the mill. Is excess dye machine capacity available for the foreseeable future; if so, can the idle dye machines be converted to holding tanks to reduce capital costs for Alternative l? Is excess dye machine capacity presently available, but production requirements for the future uncertain; if so, does the flexi- bility offered by Alternative 2 provide the most attractive situation for initial and/or long-term reconstitution efforts?
3 . Labor requirements. Will the amount of labor involved in transferring dyed goods elsewhere from the dye machine f o r rinsing adversely affect productivity o r manpower requirements?
4. Volume of rinse water required. Can rinse water be used to rinse more than one batch of goods under Alternative 2; if so , how much will water use and wastewater volumes be reduced as a result?
F- 27
5. Amount of energy savings. Is the temperature at which the dyed goods can be safely removed for rinsing low enough f o r undyed goods to be loaded; if so, does Alternative 2 provide a substantial energy savings relative to Alternative l?
6. Space available for reconstitution equipment. Do space limitations preclude, limit, or otherwise affect the feasibility of installing holding tanks for Alternative 1; if this is the principal limitation to reconstitution, is Alternative 2 practical at the mill?
Item 1, the effect on product quality, is obviously the most important factor to be considered in an evaluation of reconstitution alternatives. If rinsing in situ is required, than Alternative 2 cannot be applied. However, the effect on product quality can be easily determined by simulation at most mills without additional capital investment, and should be assessed prior to additional investigation of and/or commitment to any single alternative.
Design Criteria Design criteria for reconstitution are straightforward regard-
less of the alternative. Most of the criteria deal with factors such as initial and final dyebath temperature, dye and auxiliary chemical makeup requirements, number of batches processed per reconstitution series, etc., and are more dependent upon the type of dyeing being performed than the reconstitution alternative employed.
The holding tanks for Alternative 1 should be insulated, closed top, vertical fiberglass vessels to maximize heat retention and minimize space requirements. Each holding tank at Mill Y - 4 requires a capacity of 2 , 3 0 0 gallons. Existing equipment is utilized under Alternative 2 .
ECONOMIC FEASIBILITY Table 111-1 summarizes the relative economics of the dyebath
reconstitution alternatives described. Relative economics rather than complete economics are presented to increase the general applicability of this information. Specific economic evaluations for reconstitution
F- 28

TABLE 111-1 RELATIVE ECONOMICS*
DYEBATH RECONSTITUTION ALTERNATIVES7'*
Annual Operation and Maintenance Costs Pumping to Elevated Storage Tanks Additional Labor
Annual Savings Water Supply Sewer Use Charges Auxiliary Chemicals Energy
Capital Costs Required Equipment
Alternative 1 Alternative 2
-- $3,600
$12,300 --
7k Figures shown are for relative differences in cost or savings only. ' Where there was no relative difference between the alternatives,
this fact is represented by a dash (--).
"*Assumes reconstitution instituted at one dye machine only.
F- 29

of various dyebaths (basic, disperse, bleach) using the alternatives are presented in subsequent sections. The following assumptions were employed in developing Table 111-1:
O reconstitution economics developed for one dye machine only
0
0
0
0
only relative costs and savings are presented, by repre- senting lowest cost or savings alternative for a line item as zero (shown by a dash) dyebath used for dyeing five batches of yarn before being discharged five batches (one reconstitution series) dyed per day plant operates 300 days per year plant has excess dye machine capacity extra loading and unloading of machines associated with Alternative 2 requires two hours per day rinsing in original o r other dye machine uses 2100
gallons per reconstituted batch; i.e., water use not affected by alternative selected auxiliary chemical savings not affected by reconstitution alternative selected
' both alternatives "return" reconstituted dyebath water to dye machine for next dyeing cycle at the maximum allowable initial temperature
O Alternative 1 requires a 2,300 gallon insulated, elevated fiberglass holding tank, pump, and plumbing modifi- cations.
As can be seen from Table 111-1, where Alternative 2 is technically feasible, it offers a chance for significant capital cost savings relative to Alternative 1. Alternative 2 requires no capital investment in new equipment; however, it is more labor intensive than Alternative 1. Significant water savings could be achieved with Alternative 2 if rinse water is used for more than one batch. In summary, Alternative 2 is seen to be the more economically attractive
F30

alternative. It takes 3% years for the cumulative labor costs of Alternative 2 to become greater than the initial capital costs of Alternative 1. It becomes even more attractive as the number of dye machines incorporating reconstitution is increased.
ENVIRONMENTAL BENEFITS No relative energy, water, or pollutant savings can be claimed
by either of the alternatives over the other.
CONCLUSIONS Although dyebath reconstitution is commonly thought of as
requiring a holding tank for the exhausted dyebath, alternatives are available to allow in situ reconstitution of the dyebath.
The feasibility of a given alternative at a mill depends upon a number of factors including product type, effect on product quality, level of production, labor considerations, rinse water volumes required, available energy savings, and space restrictions.
O The use of dye machines for rinsing only should be investi- gated further to see if the total amount of fresh water used for rinsing each batch of dyed goods can be reduced.
F- 31

SECTION IV RECONSTITUTION OF BASIC DYEBATHS
DESCRIPTION OF MANUFACTURING PROCESS AND PROPOSED MODIFICATION Approximately 70 percent of yarn dyeing at Mill Y - 4 consists
of basic dyeing of acrylic yarns. Nearly four-fifths of the total basic yarn dyeing production is performed in pressure package dye machines. A description of the dyeing sequence was presented in Section I and is not repeated here. Figure 1-2 can be compared with Figure IV-1 to observe the differences between the existing basic dyeing operation and a revised dyeing operation employing reconstitution.
Most of the yarn dyeing machines at Mill Y-4 are similar-sized pressure machines. These machines are the most logical candidates for reconstitution at this mill, and full-scale reconstitution series have been performed with this equipment. Therefore discussions of
reconstitution in this report focus on these machines. Figure IV-1 shows a reconstitution arrangement as it would
exist if Alternative 1 (see Section 111) was implemented at this mill. This is the "classic" approach to reconstitution. Alternative 2, employing in situ reconstitution and a separate rinse tank, would also be an acceptable arrangement here. For illustrative purposes, Alter- native 1 is presented in this section and Alternative 2 is presented in Section V.
TECHNICAL FEASIBILITY AND DESIGN CRITERIA
Literature and Previous Applications A significant amount of research into the feasibility and
technical aspects of dyebath reconstitution has been performed by the School of Textile Engineering at the Georgia Institute of Technology (Georgia Tech). Some of this research has focused on pressure batch dyeing of yarn, albeit with disperse dyes. A small amount of informa- tion on reconstitution of basic dyebaths has also been developed recently (December 1981); however, these investigations were concerned
F- 32

2,333 GAL., BATCH I 233 GAL., BATCHES 2-5 (3,267 G A L )
UNDYED YARN ........
r~~~~~ DYE SODIUM SULFATE ACETIC ACID SOFTENER LEVELER c WETTER
2,333 GAL. (I 1,667 GAL.) r
I 1
I BASIC . . . . I . . - I ?RINSING
FINISHEDYARN TO EXTRACTION AND DRYING
WATER OF 233 GAL. 2.100 GAL. WITH ENTRAPPED (10,500 GAL.)
2'333GAL' (1,167GAL) 2,100 GAL, (11.667GAL.) I' d' BATCH 5 1
J 2,100 GAL., BATCHES 1-4 (8,400GAL.1
TO SEWER HOLDING (13,767GAL)
2,100 GAL BATCH ES 2- 5 (8,400 GAL.)
WATER AND WASTEWATER CHEMICALS PRODUCT
----- .............
EXAMPLE ASSUMES IOOOLB LOT SIZES,FlVE BATCHES PER RECONSTITUTION SERIES. NUMBERS IN PARENTHESES ARE FOR ONE SERIES
FIGURE Ip-I REVISED BASIC DYEING CYCLE EMPLOYING R ECO N S TI TUT ION ALTER N AT I VE I

with jet dyeing of Nomex fabric rather than pressure package dyeing of acrylic yarn. The results of these bench- and pilot-scale investi- gations. indicate that commercially acceptable pressure yarn dyeings can be achieved with reconstituted dyebaths. A more detailed discussion of dyebath reconstitution research and applications is found in Volume 1.
Preliminary Full-scale Investigations Prior to initiation of this project, Mill Y - 4 had performed
preliminary investigations into full-scale reconstitution of basic dyebaths. This mill, in fact, was selected for the Phase I1 portion of
this study due to their pioneering effort in the reconstitution of basic dyebaths; it was felt that Mill Y-4 provided a unique opportunity to evaluate the economic and technical feasibility of dyebath reconstitution and to draw on plant personnel expertise that would not be available at other mills. The following discussion is a summary of efforts to date.
One yarn dyeing pressure machine has been modified to enable dyebath reconstitution in conjunction with a holding tank. After dye- ing, the "exhausted" dyebath from the dye machine is pumped into a holding vessel. While the exhausted dyebath is held in the tank for use as makeup in the next dyebath, the temperature usually falls from 185'F to 160'F. During this time the dyed goods are rinsed and removed, and a fresh batch of yarn loaded into the dye machine. The dyeing operation usually requires 3 basic dyes for each bath. From experience, plant personnel have learned that all basic dyes used at the mill exhaust at similar rates (approximately 95 percent) and that the product also carries about 10 percent of the water with it. Thus they know how much dye, chemicals, and make-up water are needed to reconstitute the dyebath. Most commonly the baths are reused ten times before being dumped, although running as many as 20 lots is not unusual, and they have been able to reuse the bath over 30 times in a series. When they run different colors under this arrangement, the color sequence becomes progressively deeper. Trials to date show no difference relative to conventional procedures in the ratio of acceptable to unacceptable
F-34

dyeings. Mill personnel expressed great satisfaction with the savings realized by this reconstitution setup and eventually plan to institute it at other machines. The primary impediment at present appears to be finding space to install holding tanks for each machine. In addition, the mill has begun investigating alternative methods to achieve reconstitution without the use of holding tanks. Trials in which rinsing is achieved using a separate dye machine have been performed. Preliminary results indicate that this method is an acceptable means to achieve rinsing. Additional information concerning reconstitution alternatives has been presented in Section 111.
Design Criteria Much of the design criteria persented below are based on
operating data developed by Mill Y - 4 . Reconstitution Alternative 1, the use of a holding tank, is used in this evaluation.
Although this mill has successfully and consistently achieved reconstitution trials of ten or more cycles in length, a more conserva- tive assumption of five batches per series is used in the following analysis. W. W. Carr and F. L. Cook, in an article entitled "Savings in Dyebath Reuse Depend on Variations in Impurity Concentrations" (Reference 21, note that "long, multi-cycle sequences are not necessary to economically justify implementation of dyebath reuse. An appreciable percentage of the maximal achievable savings can be obtained with only a short sequence of runs." For example, relative to conventional dyeing a maximum savings per dye cycle of 80 percent is obtained with a 5 cycle series (based on a maximum savings per cycle of 100 percent for an infinite cycle series). This is not to suggest that there is no value in employing reconstitution series of the maximum length practical, only that long series are not necessary for a mill to obtain large savings from reconstitution.
Proper sequencing of dye cycles within a multi-shade series is important. As the proportion of dye machines at a mill at which recon- stitution is practiced increases, proper scheduling may become more difficult. Shorter sequences may actually increase savings under these circumstances. For example, assume two machines are available to dye a

total of 20 batches of yarn, i.e. 10 cycles per machine. It may be possible to schedule a 10 cycle reconstitution series for one machine, while dyeing ten batches conventionally in the second machine; eleven dyebath drops result. However, if four sequences of 5 batches each can be scheduled between the two machines, only f o u r dyebath drops result, and savings can be nearly doubled. Thus it is seen that the number of machines at which reconstitution is consistently practiced is more important than lengthy reconstitution series for achieving maximum savings.
ECONOMIC FEASIBILITY Cost savings are realized in the areas of water use, waste-
water discharge, energy savings, and auxiliary chemical use. In addi- tion to the capital costs for the holding tank, pump, pipe, valves, etc., additional expenses will be encountered for pumping and other operating costs.
Table IV-1 presents an analysis of the economics of basic dyebath reconstitution. The basis of these costs and savings is as follows:
o capital requirements for reconstitution include a 2,300-gallon, insulated, elevated fiberglass holding tank, pump, and plumbing modifications
o holding tank and related equipment must be purchased (i.e., capital equipment not already available at the mill)
o reconstitution economics developed for one dye machine only o dyebath used for dyeing five batches of yarn before being
discharged o 1,350 batches (270 reconstitution series) dyed per year o initial dyebath requires 2,333 gallons of water; subsequent
dyebaths in reconstitution series require 233 gallons per batch as makeup
o
o
o dye and chemical costs for 5 batches dyed in the conventional manner is $195; a five-batch reconstitution series uses $87 in dyes and chemicals
cost of water supply is 24.63C/1000 gallons cost of wastewater discharge is 58.9OC/lOOO gallons
F-36

TABLE IV-1 ECONOMICS
BASIC DYEBATH RECONSTITUTION"
Annual Operation and Maintenance Costs
Pumping to Elevated Storage Tanks Other Operation and Maintenance Costs
Annual Savings
Water Supply Sewer Use Charges Auxiliary Chemicals Energy
Capital Costs Holding Tank, Pump, Piping, Valves
$ 80 $980
Total $ 1,060
$ 560 1,335
29,270
7,470 Total $38,635
$12,300
Payback The payback period associated with implementing this reuse
alternative is approximately 4 months.
+(Costs and savings are for reconstitution on a full-time basis at ane dye machine only .
series. Reconstitution series are assumed at 5 batches per
F- 37

o
o source water available at 90'F; exhausted dyebath water at energy costs are $5.64 per million Btu
260°F
As can be seen from the table, the payback period associated with this reconstitution scheme is approximately four months. Over three-fourths of the total savings associated with reconstitution are due to auxiliary chemical recovery. Capital costs and annual savings will be directly proportional to the number of dye machines that are apportioned to reconstitution.
ENVIRONMENTAL BENEFITS The environmental benefits due to institution of basic dyebath
reconstitution at Mill Y-4 are dependent upon the number of dye machines employed for reconstitution. For each dye machine at which reconstitu- tion regularly occurs, water use and wastewater discharge will be reduced by 45,360 gallons per week. Assuming no buildup in successive batches, BOD will be reduced by 16 pounds per day (2.1 percent of daily mill BOD loading) per machine and COD will be reduced by 48 pounds per day (1.8 percent of daily mill COD loading). With reconstitution, energy savings of 26.5 million Btu per machine per week will be realized.
5 5
Characterization of exhausted basic dye wastewater from both conventional and reconstituted dyeings are presented in Tables 11-1 and IV-2 , respectively. There appears to be a buildup in BOD5, COD, suspended solids, and other parameters during reconstitution, although the data presented in these tables are an insufficient basis for such a conclusion. However, this question should and can be answered in further investigations. If such a buildup does occur, the estimated reductions in pollutant loadings noted above may be optimistic.
CONCLUSIONS o Dyebath reconstitution has been successful in basic dyeing of
acrylic yarn in full-scale operation at this mill. o With a payback period measured in terms of months, the
economics of reconstitution at this mill are extremely attractive. o Considerable environmental benefits may result from the
implementation of basic dyebath reconstitution. F- 38

TABLE IV-2
RECONSTITUTED BASIC DYE WASTEWATER CHARACTERIZATION
Concentration (mg/l) Reconstitution Reconstitution Reconstitution
Series A Exhausted Series B Exhausted Series B Exhausted Parameter Intermediate Bath Intermediate Bath End Bath PH 6.2 5.9 6.2 Temperature
BOD 940 1,150 1,500 COD 1,800 3,000 5,700 TS 5,380 6,400 6,210 TDS 4,670 5,760 5,460 TSS 2 13 18 Hardness
Phenolics 0.046 0.066 0.093 Color (ADMI ) 316 370 785 Cadmium -- -- Chromium -- -- Copper -- Iron -- -- Nickel -- Zinc -- --
[OF ("C)l 181 (83) 210 (99) 203 (95)
(as CaC03) < 1 < 1 < 1
< 0 . 1 < 0.1 -- < 0 . 1
0.50 -- <0.1 7 . 7
F-39

..
SECTION V RECONSTITUTION OF DISPERSE DYEBATHS
DESCRIPTION OF MANUFACTURING PROCESS AND PROPOSED MODIFICATION Disperse dyeing of acrylic fibers accounts for approximately
20 percent of yarn dyeing at Mill Y-4. A description of the disperse dyeing procedure was presented in Section I and is not repeated here. Figure 1-3 can be compared with Figures V-1 and V-2 to observe the differences between the existing disperse dyeing operation and two alternative revised dyeing operations employing reconstitution. Figure V-1 represents Alternative 1 as presented in Section 111; Figure V-2 shows Alternative 2. Additional discussion of these alternative reconstitution methods has been presented in Sections I11 and IV.
TECHNICAL FEASIBILITY AND DESIGN CRITERIA
Literature and Previous Applications As noted in Section IV, research into reconstitution of
disperse dyes used in pressure package dyeing of (polyester) yarn has been conducted at Georgia Tech. Pilot-scale reconstitution investiga- tions into disperse dyeing o f nylon and polyester carpet and polyester yarn have also been carried out at this school.
In the yarn dyeing experiments at Georgia Tech, a spun yarn package was placed in a small pressure dyeing machine. Water was added and raised to a temperature of 175'F. Acetic acid, carrier, and dye were added and circulated. The machine was then sealed as the bath was raised to 250°F. The yarn was dyed for 30 minutes before the bath was cooled to 200°F and pumped into a holding tank. While the dyed yarn was being rinsed and removed, the exhausted bath was analyzed with a spectrophotometer. The bath was then returned to the dye machine, the temperature brought to 175'F, the next package positioned, and the dye added. As many as eleven cycles were included in each of the several series that were performed in this manner. Both spun and textured yarn were evaluated, as well as single and multi-shade reconstitution series.
F- 40

DISPERSE DYE 2,333 GAL., BATCH I WETTER
(3,267 GAL.) 233GALr., BATCHES 2-5 I
I 2,333 GAL. I 1 I (11,667 GAL.,^ I
-.I
UNDYED YARN .......
- ...... .C
--c RINSING
DYEING
FINISHED YARN TO EXTRACTION
HOLDING ( 13,767 GAL)
WATER AND WASTEWATER CHEMICALS PRODUCT
----- .............
EXAMPLE ASSUMES IOOOLB LOT SIZES,FlVE BATCHES PER SERIES NUMBER IN PARENTHESES ARE FOR ONE SERIES.
FIGUREY-I. REVISED DISPERSE DYEING CYCLE EMPLOYING RECONSTITUTION ALTERNATIVE I
F-4 I

DISPERSE DYE WETTER
I
I I I
( 1,167 GAL.)
2,333 GAL. (11.667 GAL) 1 2.100 GAL..BATCH 5
(2.100 GAL.) I UNDYED
YARN ....... c
t TO SEWER (13,767GAL)
RI NSl NG D'SPERSE ........ * ......)
DYEING
- AND DRYING
WATER AND WASTEWATER CHEMICALS PRODUCT
EXAMPLE ASSUMES 1000 LE LOT SIZES. FIVE BATCHES PER SERIES NUMBER IN PARENTHESES ARE FOR ONE SERIES.
----- .............
FIGUREY-2. REVISED DISPERSE DYEING CYCLE EMPLOYING RECONSTITUTION ALTERNATIVE 2
F-42

The color formulations in these experiments consisted of light shades, medium shades, and dark shades. Additional details of dyebath recon- stitution research and applications are found in Volume 1.
Pilot Scale Results Mill Y-4 has performed laboratory studies of disperse dyebath
reconstitution. The investigations were performed using 70-lb lot sizes. These efforts demonstrated to the mill that each exhausted bath to be reconstituted would have to be spectrophotometrically analyzed subsequent to solvent extraction of the dye.
Unlike basic dyes, nearly all of which exhaust at a 94 to 96
percent rate in each dyebath, disperse dyes used at this mill are ex- tremely variable in exhaustion rates. Therefore, experience alone is insufficient to enable successful reconstitution of exhausted disperse dyebaths, and analytical methods are required. With soluble dyes (such as acid, basic, direct, and reactive) spectrophotometric analysis can be carried out directly on the dyebath. Disperse dyes are not water soluble, however, and modified techniques are required to correctly analyze these solutions. A technique used at Georgia Tech to analyze disperse dyebaths involves placing the exhausted dyebath sample in a separatory funnel and adding a measured amount of organic solvent such as benzene O K toluene. The mixture is shaken to extract the dye into the organic layer, and a spectrophotometric analysis conducted on the dissolved dye in the organic layer.
Design Criteria Reconstitution Alternative 2 , the use of a separate dye
machine for rinsing, is used in this evaluation for three reasons. Y First, the lack of readily available space in the dyehouse at this mill
limits convenient placement of additional holding tanks. Second, Alternative 2 should not have a detrimental effect on product quality. And third, as presented in the Section I11 discussion of relative economics, it takes over three years before the additional labor costs of this alternative equal the capital costs of Alternative 1.
' \
F-43

As noted in Section IV, proper sequencing of the dye cycles within a multi-shade series is important, and in some circumstances fairly short reconstitution series may be desirable. Thus, even though the cycle time for disperse dying is short, due to the relatively small amount of disperse dyeing (i.e., 20 percent) performed at Mill Y-4, it is unlikely that reconstitution sequences of more than 5 cycles could be typically scheduled. In addition, reconstitution of disperse dyebaths will likely be performed at one o r at most two dye machines (exclusive of any machines for rinsing).
ECONOMIC FEASIBILITY Cost savings are realized in the areas of water use, waste-
water discharge, energy savings, and auxiliary chemical use. In addition to the capital costs for analytical and related equipment, additional operating costs will be encountered for labor and various operating supplies.
Table V-1 presents an analysis of disperse dyebath reconstitu- tion. The basis of these costs and savings is as follows:
o reconstitution economics developed for one dye machine only o dyebath used for dyeing five batches of yarn before being
o 1,350 batches (270 reconstitution series) dyed per year o labor requirement for transporting yarn to a separate machine
discharged
for rinsing is 2 hours per day o labor requirement for solvent extraction, analysis, calcu-
lations, and adjustments averages 3-1/3 hours per day. o initial dyebath requires 2,333 gallons of water; subsequent
dyebaths in reconstitution series require 233 gallons per batch as makeup.
o o
o dye and chemical costs for 5 batches dyed in the conventional manner is $75; a five-batch reconstitution series uses $45 i n dyes and chemicals
cost of water supply is 24.63C/lOOO gallons cost of wastewater discharge is 58.90C/1000 gallons
F- 44

TABLE V-1 ECONOMICS
DISPERSE DYEBATH RECONSTITUTION” ,’
Annual Operation and Maintenance Costs Labor - Yarn Transport $ 3,600 Labor - Dyebath Analysis 6,000 x
Operating Supplies 5,040 Total $14,640
‘i
3
Annual Savings Water Supply Sewer Use Charges Auxiliary Chemicals Energy
$ 560 1,340 8,130
7,470 Total $17,500
Capital Costs Spectrophotometer and Microprocessor $ 9,450
Total $ 9,450
Payback Payback on capital costs is approximately 3-113 years.
*Costs and savings are f o r reconstitution on a full-time basis at one dye machine only. series.
Reconstitution series are assumed at 5 batches per
F- 45
o
o source water available from effluent heat exchanger at 90'F; energy costs are $5.64 per million Btu
exhausted dyebath water at 160°F o mill has excess dye machine capacity.
A s can be seen from Table V-1, the payback period associated with disperse dyebath reconstitution at this mill is a little over three years. Total capital costs are approximately two-thirds of one year's operating costs. Capital costs do not increase as the number of machines employing disperse dyebath reconstitution increases. If the number of machines employing disperse dyebath reconstitution is raised to two, the period required for capital cost payback is reduced by half.
ENVIRONMENTAL BENEFITS The environmental benefits due to implementation of disperse
dyebath reconstitution at this mill depend upon the extent to which this approach is employed. For each dye machine at which disperse dyebath reconstitution regularly occurs, water use and wastewater discharge will be reduced by 45,360 gallons per week. There is insufficient infor- mation to characterize BOD5 and COD reductions. Energy savings of 26.5 million Btu per machine per week will be realized.
Characterization of exhausted disperse dye wastewater is presented in Table V-2.
CONCLUSIONS o A considerable amount of research on disperse dyebath recon-
stitution has been conducted at Georgia Tech. Disperse dyebath recon- stitution has been shown successful on a pilot-scale by these researchers.
o The economics of disperse dyebath reconstitution are not nearly as attractive as basic dyebath reconstitution at this mill due to a number of factors: lower per cycle auxiliary chemical savings, higher capital costs due to the need for analytical equipment, higher labor costs due to the need for dyebath analysis, and fewer total machines at which disperse dyebath reconstitution can be located. With a payback period of 1+ to 3% years, disperse dyebath reconstitution is only marginally attractive at this mill from an economic viewpoint.
F- 46
1
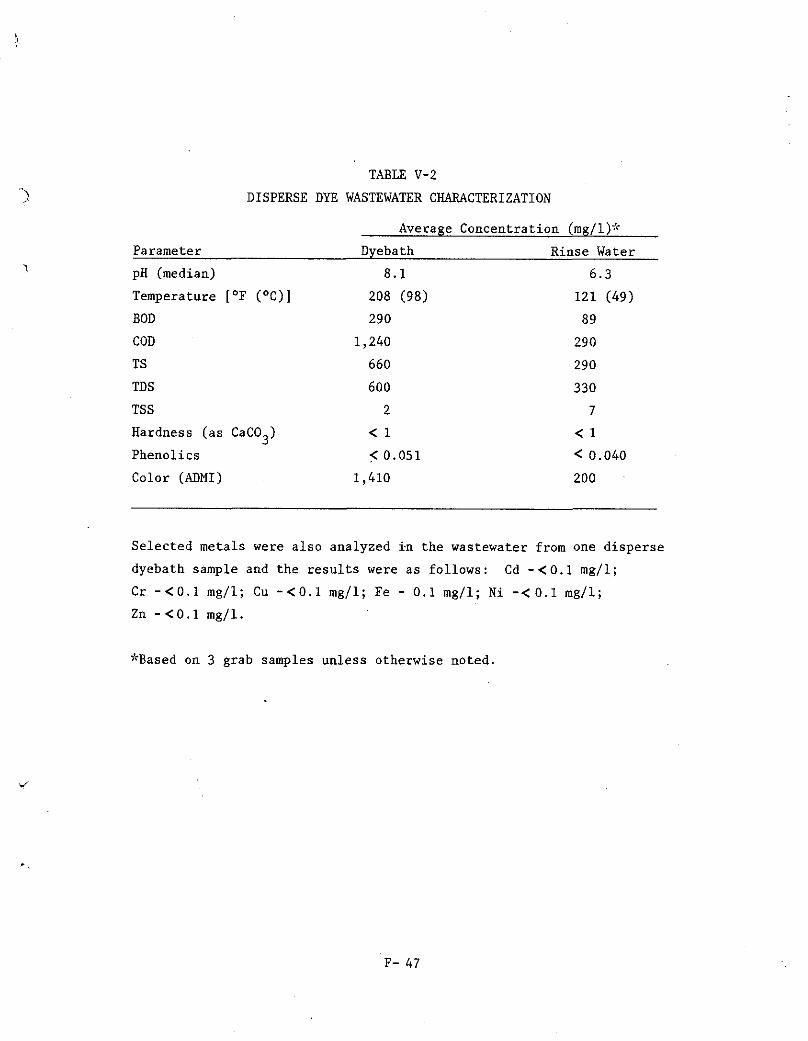
TABLE V-2 DISPERSE DYE WASTEWATER CHARACTERIZATION
Average Concentration (mg/l)"
Parameter Dyebath Rinse Water pH (median) 8.1 6 . 3
Temperature [OF ("C)] 208 (98) 121 (49) BOD 290 89 COD 1,240 290 TS 660 290 TDS 600 330 TSS 2 7 Hardness (as CaCO ) < 1 < 1
Color (ADMI ) 1,410 200
3 Phenolics < 0.051 < 0.040
Selected metals were also analyzed i n the wastewater from one disperse dyebath sample and the results were as follows: Cr - < 0 . 1 mgjl; Cu - < 0 . 1 mg/l; Fe - 0.1 mg/l; Ni -<0.1 mg/l; Zn - < 0 . 1 mg/l.
Cd - < 0 . 1 mg/l;
*Based on 3 grab samples unless otherwise noted.
F- 47

o Moderate environmental b e n e f i t s may r e s u l t from t h e imple-
mentat ion o f d i s p e r s e dyebath r e c o n s t i t u t i o n .
F- 48

SECTION VI RECONSTITUTION OF BLEACH BATHS
. DESCRIPTION OF MANUFACTURING PROCESS AND PROPOSED MODIFICATION
Bleaching of acrylic fibers accounts for approximately 10 percent of yarn finishing at Mill Y - 4 . A description of the bleaching operation was presented in Section I and is not repeated here. Figure 1-4 can be compared with Figure VI-1 to observe the differences between the existing bleaching procedure and the revised bleaching procedure employing reconstitution. Due to the several baths and rinses in a bleach cycle, Alternative 1 (reconstitution using a holding tank) is the only practical reconstitution alternative for bleaching at this mill.
TECHNICAL FEASIBILITY AND DESIGN CRITERIA
Literature and Previous Applications Although substantial amounts of research have been performed
on reconstitution of dyebaths, little o r no information on the reconsti- tution of bleach baths has been published. A general discussion of reconstitution, primarily as related to dyebaths, is presented in Volume 1.
Preliminary Full-scale Investigations In addition to perfdrming preliminary investigations into
full-scale reconstitution of basic dyebaths, this mill has also evalu- ated full-scale reconstitution of bleach baths. After bleaching is performed, the exhausted bleach bath is pumped to a holding tank while dechlorination, rinsing, and softening are all separately performed in the original dye machine to complete the bleaching cycle. Once the bleached yarn is removed, and fresh yarn added to machine, the exhausted bleach bath is returned from the holding tank and reconstituted to initiate the next cycle. When a reconstitution sequence of bleaching is performed at this mill, the bleach bath is reconstituted over and over again until many cycles have been run o r the mill is through with bleaching.
9'
r
F-49
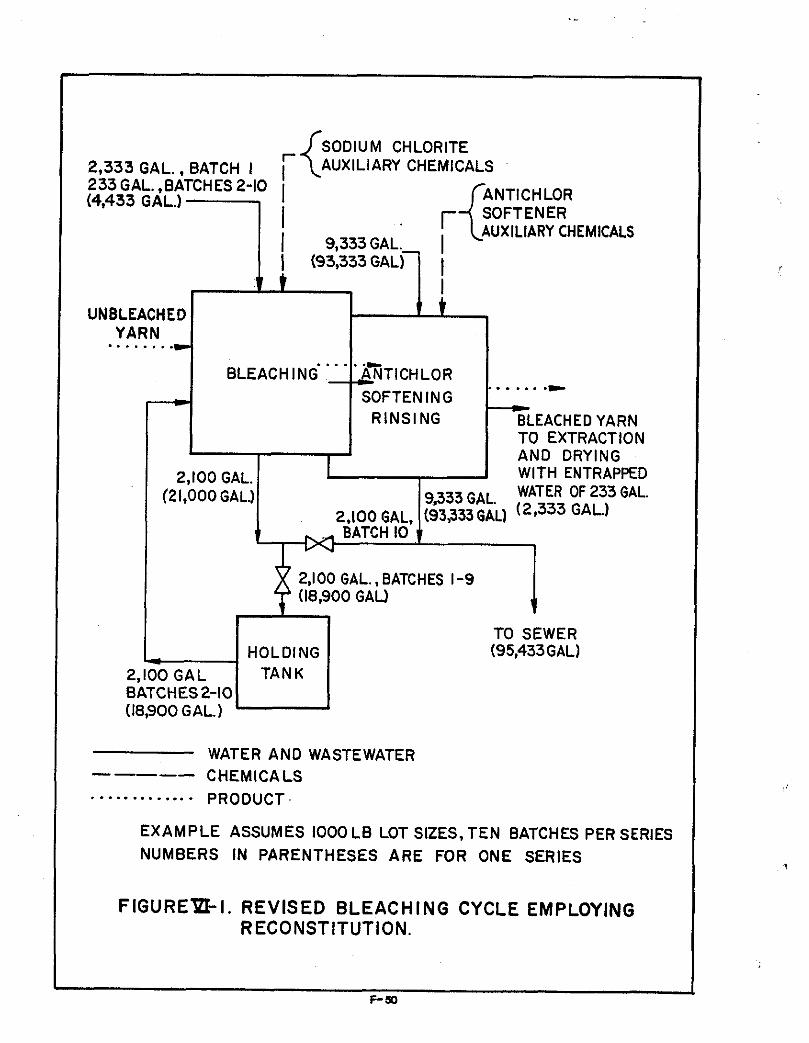
SODIUM CHLORITE ~ 2,333 GAL., BATCH I I AUXILIARY CHEMICALS
I (4,433 GAL.) SOFTENER
233 GAL. ,BATCHES 2-10 I I I 9,333GAL.- I I (93,333GAL) I
T t UNBLEACHED r t
I
YARN . . . . . . . .c ... ... .* ---c
BLEACH I N G '1 NTICHLOR - SOFTENING RINSING BLEACHED YARN
TO EXTRACTION AND DRYING
2,100 GAL. WITH ENTRAPPED WATER OF 233 GAL.
I 9'333 GAL' (2,333 GAL.)
(21,000 GAL.) 2,100 GAL, (93,333 GAL)
1
I i
HOLDING 2.100 '-1 GAL TANK 1 BATCHES2-10 (18,900 GAL.)
TO SEWER (95,433 GAL)
WATER AND WASTE WATER CHEMICALS -----
. . . . . . . . . . . . . PRODUCT.
EXAMPLE ASSUMES 1000 LB LOT SIZES.TEN BATCHES PER SERIES NUMBERS IN PARENTHESES ARE FOR ONE SERIES
FIGURE=-I. REVISED BLEACHING CYCLE EMPLOYING RECONSTITUTION.
L F- M

Design Criteria Unlike dyeing, bleaching is very predictable and routine from
one batch to the next. Batches do not need to be sequenced in a particular order as with dyeing, and hence scheduling is not a consideration at a particular machine as long as there is bleaching to be done. No analysis of the exhausted bleach bath is required. The bleaching agent is assumed to be completely exhausted, while the degree of exhaustion in auxiliary chemicals is based on experience. Mill experience has shown that the quality of finished product is not affected by bleach reconstitution series of 10 cycles or more.
ECONOMIC FEASIBILITY Cost savings are realized in the areas o f water use,
wastewater discharge, energy savings, and chemical use. In addition to the capital costs for the holding tank and related equipment (e.g. pump, piping, valves, etc.), a small additional operating cost for pumping will be experienced.
Table VI-1 presents an analysis of the economics of bleach bath reconstitution. The basis of these costs and savings is as follows:
o capital requirements for reconstitution include a 2,300-gallon, insulated, elevated fiberglass holding tank, pump, and plumbing modifications
o holding tank and related equipment must be purchased (i.e. capital equipment not already available at mill)
o reconstitution economics developed for one dye machine only o bath used for bleaching ten batches of yarn before being
discharged o 1,350 batches (135 reconstitution series bleached per year) o plant operates 300 days per year o initial bleach cycle requires 2,333 gallons of water; subse-
quent bleach baths in reconstitution series require 233 gallons per batch as makeup
o cost of water supply is 24.63C/1000 gallons
F-51

TABLE VI-1 ECONOMICS
BLEACH BATH RECONSTITUTION"
Annual Operation and Maintenance Costs
Pumping to Elevated Storage Tanks $ 80
Other Operation and Maintenance Costs 980 Total $ 1,060
Annual Savings Water Supply $ 630 Sewer Use Charges 1,500 Chemicals 15,080 Energy 8,400
Total $25,610
Capital Costs Holding Tank $ 6,000 Pump, Piping, Valves, and Other Costs 6,300
Total $12,300
Payback Payback on capital costs is approximately 6 months
"Costs and savings are for reconstitution on a full-time basis at one dye machine only. Reconstitution series are assumed at 10 batches per series.

o cost of wastewater discharge is 58.90C/1000 gallons o chemical costs (except completely exhausted chemicals) for 10
batches bleached in the conventional manner (first step only) is $246; a ten-batch reconstitution series (first step only) uses $134 in chemicals (not including completely exhausted chemicals)
o
o
energy costs are $5 .64 per million Btu source water available at 90°F; exhausted bleach bath water at
160°F As can be seen from the table, the payback period associated
with bleach bath reconstitution using holding tanks at this mill is approximately 6 months. Nearly 60 percent of the savings are due to chemical recovery, while another one-third of the savings are due to reduced energy costs.
With only 10 percent of yarn dyeing at this mill attributable to bleaching, only 1 dye machine should be allocated f o r reconstitution of bleach baths.
ENVIRONMENTAL BENEFITS The environmental benefits due to the allocation of one dye
machine f o r full-time bleach bath reconstitution are water use and wastewater discharge savings of 51,000 gallons per week and weekly energy savings of 29.8 million Btu. BOD5 discharged will be reduced by 16 pounds per day (2.1 percent of daily mill BOD5 loading), while COD will be reduced by 8 pounds per day (0.3 percent of daily mill COD loading).
Characterization of exhausted bleach wastewater from both conventional and reconstituted baths are presented in Tables VI-2 and VI-3, respectively. I n comparing the first column of Table VI-2 with Table VI-3, note that some buildup in pollutant concentrations does occur due to bleach bath reconstitution and reuse.
CONCLUSIONS o Bleach bath reconstitution has been successful in bleaching of
acrylic yarn in full-scale operation at this mill.

TABLE VI-2 BLEACH WASTEWATER CHARACTERIZATION
Average Concentration (mg/l)" Dechlorina- Dechlorina- Softening
Parameter Bleach Bath Bleach Rinse tion Bath tion Rinse Bath
pH (median) 3.6 6.3 6.0" 6.3" 5 .8 Temperature
BOD 320 36 22 12 18 COD 855 150 1 4 0 1 ~ 94x r 89 TS 1,380 330 880 330'3" 360 TDS 1,160 340 880 330" 340 TSS < 4 < 4 6 6 M 8 Hardness
[OF ("C)l 204 ( 9 6 ) 92 ( 3 3 ) 131 (551x4 88 (31)** 105 ( 4 1 )
(as CaC03) < 1 Pheno 1 i c s < 0.040 Color (ADMI) 3,080 Cadmium <O.l** Chromium < 0. I$,* Copper < 0.1" Iron < 0 . 3"" Nickel
* Based on 2 grab samples unless otherwise noted. Based on 1 grab sample.
F- 5 4

TABLE VI-3 RECONSTITUTED BLEACH WASTEWATER CHARACTERIZATION
Concentration (mg/l) Parameter Exhausted Intermediate Bath Exhausted End Bath
uH
COD TS TDS TSS Hardness (as CaCO ) Phenolics Color (ADMI) Cadmium Chromium Copper Iron Nickel Zinc
3
6.2 162 (72) 620
4,600 3,830 3.070
" L
< 1
24 0.042
--
6.3 171 (77)
a < 1 < 0.040 168 < 0 . 1 < 0 . 1 < 0 . 1
1.1 < 0.1
0.14
F- 55

o With a payback period of six months, the economics of recon- stitution at this mill are attractive.
o Significant environmental benefits result from the implementa- tion of bleach bath reconstitution.
F- 56

REFERENCES
1. Perkins, W. S. , J. F. Judkins, Jr., and W. D. Perry. "Renovation of Dyebath Water by Chlorination or Ozonation," Textile Chemist and Colorist, Vol. 12, Nos. 8-10 (August-October, 1980), pp. 182-272.
1
1.
2. Carr, W. W. and F. L. Cook. "Savings in Dyebath Reuse Depend on
Variations in Impurity Concentrations," Textile Chemist and Colorist, Vol. 12, No. 5 (May 1980), pp. 106-110.