u.s. department of commerce: innovation that matters report 2016
TRANSCRIPT

INNOVATION THAT MATTERS
2016

PARTNERSHIP
We are at the dawn of an extraordinary technological revolution, and it is transforming every part of the U.S. economy. In major commerce centers, yesterday’s expertise will not guarantee tomorrow’s economic wins. Innovation That Matters is a report created in partnership between 1776, Free Enterprise and the U.S. Chamber of Commerce Foundation to examine and rank 25 cities’ readiness to capitalize on the inevitable shift to a digital economy and recommendations to provide a framework for success.
ACKNOWLEDGMENTSThe authors and researchers would like to thank all the interview participants who devoted their time to take part in Innovation that Matters, especially our local partners including American Underground in Durham; the Center for Civic Innovation in Atlanta; Cross Campus in Los Angeles; Startup Hall in Seattle; Think Big Partners in Kansas City; Church & State in Salt Lake City; The Commons on Champa in Denver; and Benjamin's Desk in Philadelphia.
We would also like to recognize the support of Microsoft CityNext for sponsoring roundtable discussion in each city; Brunswick Insights for conducting the Innovation that Matters survey; Luminant Data for managing data collection and analysis; and Go Fish Digital for the design and production of the report.
AUTHOR
Donna Harris
Patrick McAnaney
EDITORS
Morgan Gress
Erin McPike
RESEARCHERS
Michael Hendrix
Patrick McAnaney
CONTRIBUTORS
Clare Corthell
Siobhan Gorman

INNOVATION THAT MATTERS
4
8 15
20
INNOVATION THAT MATTERS Table of Contents
CONTENTS
Executive Summary 4
Introduction: 6 The World Has Changed
Part 1: Tomorrow’s Winning Cities 7
Part 2: Creating the Future 10
Part 3: Digging In 11
Part 4: City Rankings 12
Part 5: City Snapshots 13
Part 6: Conclusion 22
Appendix A: Rankings in Detail 23
Appendix B: Methodology 30
3
4
7 13
23

INNOVATION THAT MATTERSINNOVATION THAT MATTERS Executive Summary
EXECUTIVE SUMMARY
We are at the dawn of an extraordinary technological revolution, and it is transforming every part of the U.S. economy. Beyond social media and e-commerce, advances are coming to every industry and leaving a wake that could be either disastrous or transformative to every city in the country. In the same way a handful of cities became major commerce centers in the industrial era, new cities will emerge as leaders in the digital economy. Yesterday’s expertise will not guarantee tomorrow’s economic wins. Without leaders who understand this and act to help their communities transition, cities will fall behind.
Innovation that Matters examines and ranks 25 cities’ readiness to capitalize on the inevitable shift to a digital economy. It carves out critical trends every U.S. city leader can learn from and offers recommendations local leaders can adopt to strengthen their region’s digital competitiveness.
Of the 25 cities examined, five rose to the top:
1. Boston
2. San Francisco Bay Area
3. Denver
4. Raleigh-Durham
5. San Diego
While the San Francisco Bay Area is the clear leader in total startup activity, its lack of a cohesive community and declining quality of life for residents helped move Boston to the top spot. Denver and Raleigh-Durham were surprise stars: They have fewer startups than larger cities like New York and Los Angeles but stronger ties between the startups and institutions in the community. San Diego performed well thanks to its strong talent and capital base, dense community and growing specializations in health and IT.
4

INNOVATION THAT MATTERSINNOVATION THAT MATTERS Executive Summary
Given the findings of this study, there are key steps local leaders can take to keep their communities at the forefront of technological change and secure a prosperous future for their citizens:
1. Understand the inevitable trajectory of the digital economy
2. Imagine a new future that includes history; where technological possibility intersects with legacy assets and unique strengths
3. Focus beyond startups to include corporations, universities, nonprofits and local government
4. Work proactively toward a new governing framework that marries technological possibility and regulation
Then, leaders can get started by establishing the basics to make way for the big opportunity.
5
Critical questions loom. How will every American city respond?
Which ones will emerge as the economic powerhouses as this massive economic shift takes hold? There is no single model of success, but Innovation that Matters provides key observations,
shares specific city insights and rankings, and delivers a framework that can enable cities to embrace and lead the digital era.

INNOVATION THAT MATTERSINNOVATION THAT MATTERS Introduction: The World Has Changed
INTRODUCTION: THE WORLD HAS CHANGED
The next wave of the digital economy is under way. Over the last 50 years, computer hardware has evolved from large systems in research labs to smartphones in every pocket. Our daily lives increasingly run on software and the Internet. Technology is transforming everything.
The digital economy is still in its infancy. To date, the focus has been on the consumer. In industries like media, music and retail, simple platforms allow people to connect to each other easily. Transformative technology inevitably is coming to industries like education, energy, health and urban infrastructure. The further technology embeds into every aspect of life, the more innovators will shift from straightforward apps and tools to solving much harder challenges. What might be a daunting challenge to all cities can be a massive opportunity for some to be successful in the digital economy.
6

INNOVATION THAT MATTERSINNOVATION THAT MATTERS Part 1: Tomorrow’s Winning Cities
PART 1: TOMORROW’S WINNING CITIES
Geographically, the digital economy is not advancing consistently across the country. It is concentrating in cities: densely populated and highly connected urban centers where people can work together closely to share and discuss ideas, build and test new products, and bring companies to scale with access to large pools of customers.
Innovation that Matters focuses on 25 American cities and what they can do to thrive in this new era. A new generation of entrepreneurs and the institutions that guide them have the power to position urban centers to either rise or fall as they aim to keep pace with changing times. This year’s study confirmed the foundation laid out in last year’s report—that modern innovation economies depend on open, collaborative networks—and further examines how city leaders can apply this theory to keep their communities at the forefront of technological change and secure a prosperous future for their citizens.
While there are many ways for each city to analyze its own data in depth and compare itself against its peers, ITM evaluated 25 cities, digging into six themes:
1. Talent: Does the city have the workforce it needs?
2. Capital: Has the city mobilized adequate financial resources?
3. Industry Specialization: As tech evolves from general IT to specialized sectors, is the city ready to capitalize on this shift?
4. Density: Is the community concentrated enough to form a cohesive identity?
5. Connectivity: Are the city’s key actors well integrated with the startup community?
6. Culture: Does the city have the mindset and lifestyle to attract entrepreneurs?
7

INNOVATION THAT MATTERSINNOVATION THAT MATTERS Part 1: Tomorrow’s Winning Cities
Specific rankings and city analyses are outlined later1. Here are five key national findings critical to community leaders:
1. The San Francisco Bay Area is the clear leader in startup activity, but its lack of a collaborative community and a declining quality of life for wide swaths of its citizens vaulted Boston to the top spot
While the region is the clear leader in overall startup activity, a survey of local entrepreneurs suggests it is becoming too cutthroat to inspire success. It has the highest levels of talent, the most startups and more money invested than any other city. Yet, our survey of local entrepreneurs uncovered concerns. Entrepreneurs do not believe the startup community is well integrated with local universities (21st), institutions (14th) or local citizens (16th). The survey also ranks the area quite low in terms of quality of life (22nd), which may be reflective of the increasing cost of living. Boston, by contrast, comes in second to the Bay Area on most traditional metrics of startup activity, but local entrepreneurs indicate stronger connections with universities (7th), institutions (10th) and citizens (3rd). Boston entrepreneurs also indicate a much higher quality of life (5th).
2. Cities that dominated legacy industries in the 20th Century may not in the 21st
Many cities are not producing enough new digital companies in the sectors that they traditionally specialize in because their workforces and native corporations aren’t adapting. Portland, for example, is a traditional health care hub (5th in this specialization), but not a digital health hub (23rd). Atlanta has strong local specialization in electric power (1st) but is not an energy tech hub (13th). Houston is a national leader in construction (1st) but is not a hub for smart city tech (22nd).
3. Economically struggling cities are creating ways to compete
Baltimore, Pittsburgh and New Orleans are not major drivers of the digital economy yet, but they are attracting educated young people, building collaborative innovation communities and creating the right cultural foundation to rise beyond recent challenges to stay relevant. Baltimore topped our connectedness survey. Pittsburgh best connected startups to local universities. New Orleans recorded the fastest increase in educated millennials.
8
1. Appendix A: Rankings in Detail

INNOVATION THAT MATTERSINNOVATION THAT MATTERS Part 1: Tomorrow’s Winning Cities
4. Few cities are connecting their existing corporations and institutions to startups effectively
Local leadership must establish mechanisms to introduce up-and-coming digital companies to local anchor institutions like corporations, universities, foundations and city government. A survey of local entrepreneurs revealed the gap between startups and these established organizations. Just 32% of entrepreneurs nationwide felt connected to local corporations, and only 33% felt connected to other local institutions, like foundations and city government.
5. Health is currently king among digital industries in the new era
Of the industries studied in the rankings, health had the most startup activity. When looking at the combined education, energy, health and smart city industries, health comprised 60% of all new startups. It also made up 60% of all “champions” (fast-growing companies) and 34% of acquisitions and public offerings. There are still opportunities available to other sectors, but health is the industry most ripe for cities to build competency and leadership.
Across the board, there is evidence that the cities that dominate in the digital era may indeed be those that embrace the words of President Abraham Lincoln: “The best way to predict the future is to create it.”
9
“The best way to predict
the future is to create it.”
- Abraham Lincoln

INNOVATION THAT MATTERSINNOVATION THAT MATTERS Part 2: Creating the Future
PART 2: CREATING THE FUTURE
How cities have thrived in the past 100 years will no longer lead to success in the digital economy. The rapid pace of technological evolution brings endless possibilities to create wholesale change in entire industries. It opens the door for unexpected cities to become tomorrow’s leaders. The cities that succeed in creating a brighter new future will rely on an entirely new playbook.
1. Understand the inevitable trajectory of the digital economy: Leaders must grapple with the possibilities of the major technological advances of our time -- artificial intelligence, robotics, smart objects, virtual reality, bio-security, drones and more. Becoming a leading city for the digital era means deeply understanding technology, embracing the inevitable role it will play in every arena of life, being willing to question long-held norms of how we live and work and imagining and implementing entirely new ideas.
2. Imagine a new future that includes its history: Cities can lean on the unique strengths they already have as they imagine a new future. Success lies at the crossroads of assets and opportunities. Whether cultural, tied to industry expertise or some other resource, every city has a fountain of untapped potential that can be the cornerstone for their digital economy.
3. Focus on startups...but go beyond them: In the quest to become vibrant hubs of tomorrow’s startup activity, cities and their leaders must not ignore their region’s corporate entities. As uncovered in last year’s report and advanced in this year’s research, entrepreneurs and corporations need each other for their different perspectives, ideas, capital, influence, access and connections. Winning cities will bring both to the table and create lines of collaboration that accelerate results.
4. Work toward a proactive governing framework: Government touches nearly every aspect of our lives: the food we eat, the roads we drive on, the houses we live in, and even the showers and toilets we use. Most rules were put in place decades before today’s technologies were even a glimmer of an idea. As technology has advanced, governments have been playing defense while innovators take random shots on goal, leaving us with a patchwork of laws and tension between key actors. We must acknowledge that new rules are required for the new era. Governments, together with startups and corporations, ought to proactively re-examine the body of regulation through the lens of technological possibility.
10

INNOVATION THAT MATTERSINNOVATION THAT MATTERS Part 3: Digging In
PART 3: DIGGING IN
The fourfold framework is essential for cities to succeed in the digital economy. But getting started is hard, knowing how to put it all together can be overwhelming, and getting it done takes patience for the long game. The research shows there are four fundamental actions that can help advance a city’s trajectory.
First things first: All cities have a fundamental layer of challenges in common -- get more people to start companies; find mentors to help companies grow and talent to fill open roles; and free available capital to fuel growth. Removing these roadblocks is the first, important step for every city.
Start by trying methods that have worked in other cities. Back a super hub that creates density for the startup community; celebrate the innovation already happening; encourage the wealthy to invest in local entrepreneurs; convene major programs and festivals that recognize startups and innovators; and connect to other cities, institutions and corporations in order to spark more growth.
Identify your assets: Every city has industries, companies, people, resources or other assets that can be tapped to create the future. What makes your city unique? What lies beneath the surface that, if unleashed, could completely change the trajectory of your community? Startups, corporations, universities, investors and government should contribute, because they each see the community through different lenses.
Paint a vision: We can agree that making each city a better place for innovation is important. But few can articulate what “better” actually looks like. Without a common vision of possibility, people with excellent intentions cross wires and conflict can emerge. The communities that take the time to take stock and come together to imagine new possibilities and articulate a vision for the future are well equipped to determine how to get there.
Measure outcomes, not activity: In a world increasingly centered on data-centric decision-making, finding the right metrics to demonstrate impact of startup community-building efforts is a priority. Traditional economic development statistics such as dollars invested, jobs created or patents filed serve as trailing indicators and are only partially helpful. There are no effective leading indicators that show the community connections essential to innovation. As organizations around the globe try to establish universally agreed upon measures, Innovation that Matters provides a variety of metrics city leaders can use to evaluate their progress in developing their digital era economies.
11

INNOVATION THAT MATTERSINNOVATION THAT MATTERS Part 4: City Rankings
PART 4: CITY RANKINGS
The Innovation that Matters rankings evaluate which cities are best positioned to lead the digital economy. The rankings are based on how well the top 25 U.S. startup hubs attract talent, increase investments, develop specializations, create density, connect the community and build a culture of innovation.2
The city results are:
12
2. For more detail on the index, see Appendix A: Rankings in Detail.

INNOVATION THAT MATTERSINNOVATION THAT MATTERS Part 5: City Snapshots
PART 5: CITY SNAPSHOTS The city rankings tell us who seems to be succeeding right now, but that’s only half the picture. Breaking down the data from the rankings with observations from visits to the following eight cities, it is evident that each has followed a different formula. Highlighted below are five behind-the-curtain insights into what is happening in each city. Through these observations and the data, we can glean who is emerging and drawing on their strengths, and how the four-fold framework is being leveraged to ignite the shift to embrace the digital economy. Just because a city may rank high in a particular area, did not mean that they were consistent across. These are the eight cities we visited to find out what was happening around the country regardless of ranking.
13
3. For more detail on the index, see Appendix A: Rankings in Detail.
ATLANTA 1. Engaged universities, investors and civic institutions are key strengths of the region. These three groups rated strongest in the ecosystem survey (2nd, 2nd and 6th respectively), suggesting that their involvement in the startup community has been an asset for Atlanta.
2. Atlanta’s startup community is strong, but has yet to join the new wave of digitization. The region performed well in overall startup community metrics, but the activity has not yet translated into performance in the harder industries that make up the majority of the global GDP. The region’s strength in its established energy (1st), construction (7th), transportation and logistics sectors (1st and 9th) suggests strong local expertise that, if tapped into properly, could make the region a leader in both energy and smart cities.
3. A challenging regulatory environment is holding Atlanta’s startups back. The city came in last (24th) in this survey question, suggesting that work needs to be done to improve the governing rules.
4. Low engagement by corporates remains a problem. The city came in 20th in this metrics, despite the large Fortune 500 presence in Atlanta. This suggests a significant opportunity for improvement.
5. Recent increases in residential density among young people and local tech skills are favorable indicators. Atlanta’s strong performance in these metrics (7th and 9th, respectively) suggests assets for city and community leaders to lean on.

INNOVATION THAT MATTERSINNOVATION THAT MATTERS Part 5: City Snapshots
DENVER
1. The future looks bright for the Mile High City. With a strong supply of educated young people (4th), a vibrant cultural foundation (3rd), a healthy quality of life (1st) and a well-connected ecosystem (2nd), Denver has the pieces in place to become a leader in the new digital economy.
2. Denver’s energy startup sector is building on the city’s strengths. Of the emerging digital industries included in this study, energy (5th) emerges as Denver’s obvious competitive advantage. Denver has a historically strong cluster of legacy energy companies (4th), and its startup community is growing on top of that foundation.
3. Beyond energy, the picture is murkier. The city continues to punch below its weight in terms of Ed Tech (15th), Health Tech (17th), and particularly Smart City tech (14th). Despite Denver’s traditional strengths in real estate development (4th), transportation (9th) and logistics (7th), its startup community has yet to penetrate these sectors.
4. Capital is still a challenge. Relatively weak funding and exit numbers (14th in total investment and IPOs) reveal that Denver has yet to build the capital base to take its digital economy to the next level. However, entrepreneurs do consider local investors to be highly involved and supportive of the ecosystem (1st), suggesting that the key is to bring more investors into the community.
5. Denver may be booming, but it’s not yet becoming a global city. Strong domestic population inflows (3rd) combined with weak international inflows (23rd) suggest that Denver is pulling in talent from all over the country, but not the world. To take its startup success to the next level, it will have to find ways to compete with more globalized cities such as San Francisco, New York and Washington, DC.
14

INNOVATION THAT MATTERSINNOVATION THAT MATTERS Part 5: City Snapshots
KANSAS CITY
1. Kansas City is in the early stages of building its startup community, but a well-connected ecosystem is becoming its greatest asset. The city came in 24th overall in the Index, but it performed well in the ecosystem connectivity survey (9th), suggesting that entrepreneurs perceive strong support from other actors in the community. Involvement from corporate (3rd) and institutional partners (7th), engaged citizens (4th), and loud local cheerleaders trumpeting the region’s successes (7th) are key building blocks for the city’s transformation.
2. The local regulatory environment and quality of life emerged as strong points of the region, but a lack of openness to new ideas may be the city’s greatest cultural weakness. The city came in 14th and 17th on the first two indicators, but 21st on the third.
3. Kansas City as a whole may not be a talent magnet, but the pieces exist to compete in the digital economy. The region performed poorly in terms of both general population inflows from outside the region (25th) and talented millennial inflows from outside the region (21st), but it performed very well in terms of tech talent (10th). To stay competitive, it will be important to nurture this growing talent pool.
4. The city can build on its strength in construction, transportation and logistics, but first it needs to build out its startup community. Established business clusters in these smart city sectors (7th) suggest a potential competitive advantage in the digital economy, but this has not translated yet into a vibrant smart city startup scene (21st).
5. Millennials repopulating old urban neighborhoods may be the first step to launching Kansas City’s startup scene. The city reported one of the fastest rates of increase in young people already within the region’s vicinity moving into dense, urban neighborhoods (6th). This could be a sign of things to come, if the startup community is able to build on that foundation.
15

INNOVATION THAT MATTERSINNOVATION THAT MATTERS Part 5: City Snapshots
LOS ANGELES
1. Los Angeles has the startups—and the capital—to compete. Los Angeles was one of the top regions when it came to many of the traditional metrics: companies started (4th), money invested (4th), and exits produced (4th in acquisition totals). These indicators matter, and they show the success that the LA startup scene has had in recent years.
2. Talent may be the city’s Achilles’ Heel. Somewhat surprisingly, LA seemed to struggle on every dimension of the talent question. Weak population flux (20th), educational attainment (14th), and concentration of tech skills (18th) combined to give it a low score on this indicator. While part of this may be attributed to the city’s size, it nevertheless represents a real challenge for the region. Strong international inflows (9th) represent LA’s greatest strength when it comes to talent, while domestic outflows (23rd) signal underlying weaknesses.
3. When it comes to the next generation of digital startups, Los Angeles is in a strong position across the board. Strong performance in the Ed Tech (5th), Energy Tech (4th), Health Tech (5th) and Smart City tech (3rd) sectors highlight the power of the region’s digital economy. Surprisingly, its established business clusters in these sectors do not perform as well (10th, 23rd, 12th, and 21st, respectively), demonstrating that, while legacy assets matter, communities can emerge as digital era leaders in entirely new arenas.
4. Citizen and investor engagement are key elements of the ecosystem’s success, but work needs to be done to get the established business community more involved. The region ranked 1st and 6th in the first two indicators, but lack of support from institutions (14th), corporates (12th) and professional services firms (15th) suggests that entrepreneurs do not feel well plugged into the traditional business community. Lack of support from cheerleaders (16th) implies that the region is not doing a good enough job of celebrating its successes and telling its story.
5. The regulatory environment is a major problem for Los Angeles startups. In our survey of entrepreneurs, the city ranked near the very bottom on this score (23rd), suggesting the challenge startups face in navigating existing regulations. Los Angeles may want to look to some of its other peers—Dallas-Fort Worth (2nd), Boston (6th) or Raleigh-Durham (7th) to figure out how to solve this problem.
16

INNOVATION THAT MATTERSINNOVATION THAT MATTERS Part 5: City Snapshots
PHILADELPHIA
1. Philadelphia’s established sector specializations and favorable demographic trends will make it strong if it can capitalize on them. Much of the city’s strong performance in the Index was due to its established education (3rd), energy (2nd) and health (2nd) clusters, as well as a spike in young, educated residents (10th). The real test will be how the city takes advantage of these assets to build its next generation of startups.
2. Startup-focused professional service firms, investors and universities are all strengths of the local ecosystem, but corporate and institutional engagement remains low. The region ranked 2nd, 5th, and 6th in the first three indicators, but 18th and 22nd in the latter two. This suggests that work remains to bridge the gap between Philadelphia’s startup community and its established economic anchors.
3. The city is underperforming in its Ed Tech and Energy Tech startup sectors, but Health Tech is the clear bright spot of the ecosystem. Strong established clusters in education (3rd) and energy (2nd) have not translated into strong startup clusters (20th and 16th). By contrast, its established cluster in health is ranked 3rd, and 6th for startups. The city is also emerging as a force in the field of smart city entrepreneurship (9th).
4. Talent challenges are holding Philadelphia back. A relatively stagnant population base (22nd) and middling levels of educational attainment (16th) suggest that the talent pool in the city is not as robust as that of its competitors. But a strong base of civic sector skills (1st), particularly in health, suggests a major opportunity. Finding ways to grow the talent base and use existing skills will be pivotal for future success.
5. High quality of life is an important factor driving the region’s success, but lack of openness to new ideas and a difficult regulatory environment are a burden for entrepreneurs. Philadelphia ranked 8th in the first category, but 19th and 16th in the latter two. Finding creative ways to shift these cultural barriers could help stimulate new business activity.
17

INNOVATION THAT MATTERSINNOVATION THAT MATTERS
RALEIGH-DURHAM
1. Raleigh-Durham may not be one of the largest startup communities in the country, but its well-connected ecosystem, density of startup activity, strong cultural foundation and deep talent pool positions it well to thrive in the new digital economy. Indeed, due to the region’s ecosystem expanding beyond traditional boundaries of its metropolitan area, the region likely performs even better. The ingredients are all there for the region to continue to compete and win.
2. Despite serving as the crown jewel of the region, Raleigh-Durham’s universities are surprisingly not the focal point of its entrepreneurial ecosystem. Entrepreneurs cited connections with local corporations (2nd), institutions (1st), mentors (6th) and advisors (6th) as the strongest components of the ecosystem, but rated university engagement as relatively low (12th). This suggests that opportunities remain to further integrate the startup and university communities, particularly across cities within the region.
3. A strong openness to new ideas, a high quality of life and a favorable regulatory environment have created a world-class culture for attracting entrepreneurs to the area. Raleigh-Durham performed strongly across all three categories (3rd, 2nd and 7th, respectively), making it a national leader in fostering culture conducive to startup entrepreneurship.
4. Demographic trends should be a sign of concern for the region. A significant drop in the percentage of educated young people as a portion of the overall population (24th) and a lack of residential density (16th) in the Raleigh area, combined with limited transportation links between downtown hubs, suggest that the region still has a lot of work to do to create the vibrant urban environment that is often pivotal to the success of startup communities.
5. Health startups are keeping Raleigh-Durham at the forefront of digital entrepreneurship, but the inability to capitalize on potential in the Ed Tech and Energy Tech sectors suggests room for improvement. The region has strong established clusters in the education (10th) and energy (3rd) sectors, but this has not translated into much specialized startup activity (18th in both categories). Its established health cluster (5th) has led to a stronger concentration of health startups (7th).
18

INNOVATION THAT MATTERSINNOVATION THAT MATTERS Part 5: City Snapshots
SALT LAKE CITY
1. Salt Lake City’s startup community is gaining momentum, but it hasn’t broken out yet. The region has a strong IT cluster (7th) and has been competitive in attracting venture funding (10th), but relatively few companies have had successful exits so far (18th in IPOs). It may take some time for the uptick in funding to translate into results, but Salt Lake City is headed in the right direction.
2. The region’s ability to harness its capital base may be its most distinct advantage. Salt Lake City performs in the middle of the pack in terms of overall investment (15th), but it punches well above its weight relative to its size and wealth (3rd in unlocking capital). This suggests that the region is already well ahead of its competitors in harnessing its existing capital base to drive startup success.
3. Strong engagement from anchor institutions and established businesses are strengths of the Salt Lake City startup ecosystem, but a lack of cheerleaders to highlight the region’s successes is a major weakness. The city ranked 2nd and 6th in the first two categories, but 20th in the third. Further integrating cheerleaders—media outlets, event organizers, and industry associations—into the entrepreneurial community could enhance local connectivity.
4. Ed Tech is becoming Salt Lake City’s strongest specialization in the new digital economy. While this is not a historical strength of the region (22nd), data suggests that it has the most recent momentum (8th). It remains to be seen whether Salt Lake City can capitalize on its traditional specializations in the real estate (1st), transportation and logistics (2nd/4th), environmental services (3rd), medical devices (1st) and utility management (5th) sectors.
5. Lack of openness to new ideas points to a cultural challenge for the region. While local entrepreneurs pointed to a favorable regulatory environment (5th) and good quality of life (10th), they noted a distinct lack of openness to novel ways of thinking within the community (23rd). Finding ways to shift this aspect of the local culture could pay dividends for the startup ecosystem.
19

INNOVATION THAT MATTERSINNOVATION THAT MATTERS Part 5: City Snapshots
SEATTLE
1. Seattle’s tech sector is booming, but connectivity and culture indicators point to challenges ahead. The city’s world-class IT companies (1st) have vaulted it into the upper echelon of U.S. tech hubs, but survey results suggest that work needs to be done to build the collaborative community (22nd) and cultural foundations (22nd) needed for long-term success.
2. The talent base in Seattle is thriving. The city’s robust population inflows (6th), highly educated young residents (9th) and skilled tech workforce (2nd) combine to make it one of the top talent pools in the country (4th).
3. Within the ecosystem, support from professional service firms, universities and civic institutions such as city government are relative strengths, whereas lack of engaged corporations, citizens, cheerleaders and mentors remain weaknesses. The city ranked 8th, 15th and 18th in the first three categories, but 24th, 22nd, 22nd and 21st in the latter four. Connecting the dots between these actors and the entrepreneurs they support could improve the ecosystem dynamics.
4. Startups in Seattle are doing well in a variety of sectors, but no clear specialization has emerged yet. The city ranks 5th in overall specialization and is relatively even in its performance across the Ed Tech (7th), Energy Tech (10th), Health Tech (8th) and Smart City Tech (8th) industries. When it comes to established company specializations, the general IT cluster—driven by Amazon and Microsoft—stands out (1st).
5. A high concentration of tech startups means that Seattle should feel like a dense community, but local entrepreneurs don’t perceive it that way. The strong disconnect between the indicators of general startup density (5th) and perceived density (21st) suggest that there is a lot of activity on the ground, but that activity may be occurring in isolated pockets. Only New York City recorded a similar trend.
20

INNOVATION THAT MATTERSINNOVATION THAT MATTERS Conclusion
CONCLUSION
Underpinning everything discussed here is that building innovation economies should combine equal parts technical challenge and community building. To get results, cities need to develop and patent breakthrough technologies, train people in a specific set of skills and channel more financial resources into these initiatives. They also need to make connections for entrepreneurs to help them test ideas and grow their businesses, serve as translators to increase collaboration between the startup community and the outside world, break down cultural barriers, and unite the community behind a common goal.
A city will thrive in the digital economy by mastering both the technical and community domains, and by maximizing the engagement from every corner of the community. Everyone must play a role: the entrepreneurs already doing the heavy lifting to create new companies; city government “startup advocates” who focus on strengthening the local entrepreneurship community; city government “innovation leads” who work with the startup community to improve city services; chamber of commerce “entrepreneurship directors” who serve as a bridge between established businesses and startups; private sector “startup reps” who lead entrepreneur groups and organize broad discussions about the future of the startup community; and university innovation and entrepreneurship program leads who connect universities to the community by facilitating student entrepreneurship programs, developing external partnerships and spearheading technology commercialization.
Communities that succeed will embrace technology’s disruptive presence and unify around a shared vision that emboldens everyone in the city to carve out a role that advances the collective goal. The resulting momentum can bring fresh life to the city, enable creative initiatives to take root and drive the community to a leadership position in the digital era. As one roundtable participant explained, “We have a lot of leaders here, but not a lot of leadership. We need people to learn how to work together more effectively and unite around a plan for the region.”
21

INNOVATION THAT MATTERSINNOVATION THAT MATTERS Appendix
APPENDIX A: RANKINGS IN DETAIL
The Innovation that Matters rankings evaluate which cities are best positioned to lead the evolving digital economy. The rankings include the following categories:
Talent: Does the city have the workforce it needs?
Capital: Has the city mobilized adequate financial resources?
Industry Specialization: As tech evolves from general IT to specialized sectors, is the city ready to capitalize on this shift?
Density: Is the community concentrated enough to form a cohesive identity?
Connectivity: Are the city’s key actors well integrated with the startup community?
Culture: Does the city have the right mindset and lifestyle to attract entrepreneurs?
Here’s how each city stacked up:
22
Industry Specialization
Ecosystem Connectivity
City TOTAL SCORE Talent Capital Density Culture
Boston 22.0 8 1 2 1 8 4Bay Area 20.8 1 1 1 2 17 9Denver 19.5 2 10 13 9 2 3
Raleigh-Durham 19.2 5 14 11 7 3 1San Diego 18.7 2 5 7 3 18 9
Austin 18.0 5 13 11 9 5 5Los Angeles 15.7 20 4 6 5 11 16Philadelphia 15.5 18 12 4 4 10 15
Washington DC 15.0 7 8 10 7 16 18New York City 14.8 11 3 3 11 19 20
Seattle 13.7 4 7 5 14 22 22Chicago 13.5 22 6 7 6 12 22Portland 13.5 10 23 18 14 5 5
Pittsburgh 13.3 13 10 9 19 13 12Nashville 12.0 14 21 25 12 5 7
Minneapolis 11.7 14 17 15 12 4 24Salt Lake City 11.5 12 16 14 17 14 14
Baltimore 11.3 9 19 19 19 1 21Dallas 10.8 16 15 16 18 24 2
Houston 8.7 16 9 22 24 20 13Atlanta 7.8 21 18 17 21 15 17Miami 7.8 23 20 21 14 23 8
Phoenix 5.8 24 22 20 25 21 9Kansas City 5.5 25 24 23 23 9 19
New Orleans 3.5 19 25 24 22 N/A N/A
Innovation that Matters Index

INNOVATION THAT MATTERSINNOVATION THAT MATTERS Appendix
TALENT
Any analysis of a city’s economic potential has to start with its people. Innovation is not created by dollars, machines, or buildings, it is created by people interacting with each other to develop and execute on new ideas. The talent score looks at three dimensions:
Population Flux: Are people—domestic and foreign—moving to your city? Are you attracting newcomers to expand your workforce and flow of innovative ideas?
Educational Attainment: Is your city attracting educated young people who can support the next generation of startups and act as early adopters for new digital technologies?
Skills: Is your workforce ready to navigate the next wave of the digital economy? Does it have both tech skills to build digital products and specialized industry knowledge that can adapt these products to the evolving needs of each sector?
23
City TOTAL SCORE Domestic Population Inflows
International Population
Percentage of Educated
Percentage Change in
Tech Skills Civic Industry Skills
Bay Area 19.2 12 1 2 20 1 5Denver 18.0 3 23 4 6 10 2
San Diego 18.0 18 7 13 3 4 3Seattle 17.7 11 6 9 17 2 5Austin 17.5 1 15 5 22 3 5
Raleigh-Durham 17.5 2 10 8 24 4 3Washington DC 16.7 13 3 1 14 20 5
Boston 16.3 20 5 2 19 10 2Baltimore 15.8 17 10 11 7 13 3Portland 15.7 8 20 13 11 7 3
New York City 15.3 25 3 6 8 17 5Salt Lake City 15.0 14 19 17 4 N/A 5
Pittsburgh 14.8 15 25 15 2 7 3Minneapolis 14.3 19 12 6 16 13 4
Nashville 14.3 3 21 11 9 22 4Dallas 13.7 6 15 22 23 4 4
Houston 13.7 7 8 23 12 20 4Philadelphia 13.5 22 14 15 10 13 1New Orleans 13.3 9 17 20 1 N/A 4Los Angeles 13.0 23 9 19 5 17 5
Atlanta 12.5 10 12 20 25 9 5Chicago 12.3 24 17 10 13 13 5Miami 12.2 16 2 24 15 22 4
Phoenix 10.5 5 22 24 21 17 4Kansas City 10.2 21 24 18 18 10 4
Talent Rank
Population Flux Educational Attainment Skills
INNOVATION THAT MATTERSINNOVATION THAT MATTERS Appendix
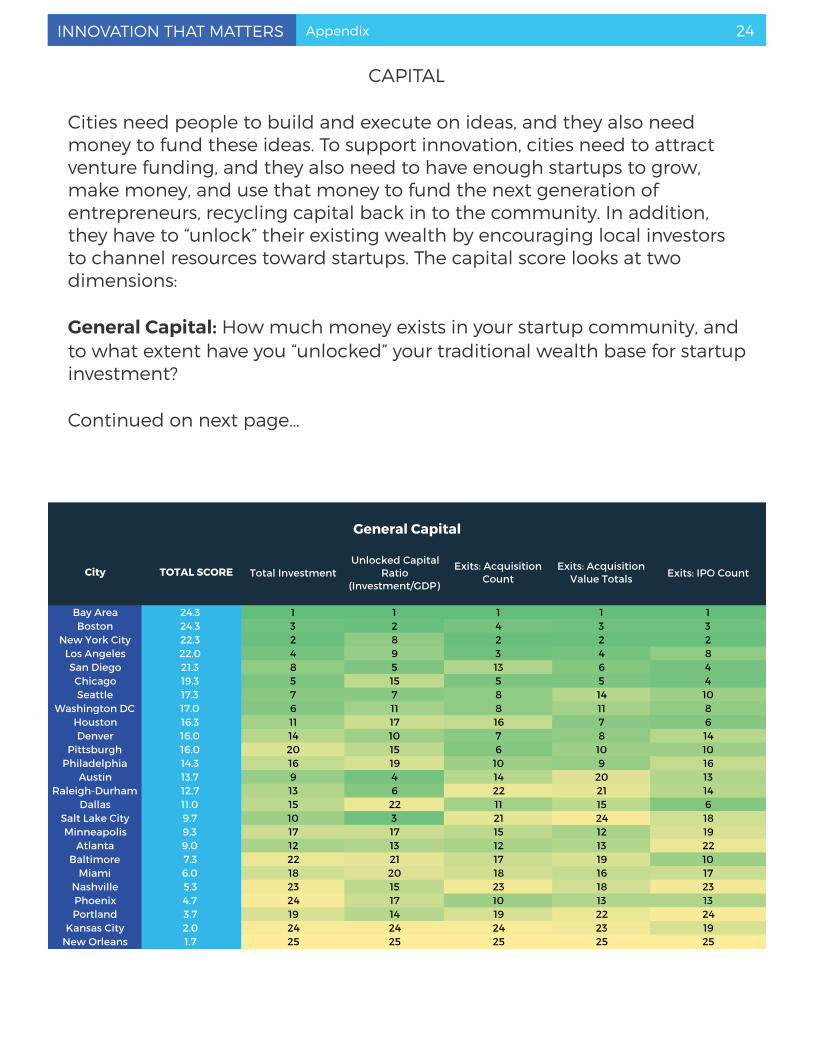
CAPITAL
Cities need people to build and execute on ideas, and they also need money to fund these ideas. To support innovation, cities need to attract venture funding, and they also need to have enough startups to grow, make money, and use that money to fund the next generation of entrepreneurs, recycling capital back in to the community. In addition, they have to “unlock” their existing wealth by encouraging local investors to channel resources toward startups. The capital score looks at two dimensions:
General Capital: How much money exists in your startup community, and to what extent have you “unlocked” your traditional wealth base for startup investment?
Continued on next page…
24
City TOTAL SCORE Total InvestmentUnlocked Capital
Ratio (Investment/GDP)
Exits: Acquisition Count
Exits: Acquisition Value Totals Exits: IPO Count
Bay Area 24.3 1 1 1 1 1Boston 24.3 3 2 4 3 3
New York City 22.3 2 8 2 2 2Los Angeles 22.0 4 9 3 4 8San Diego 21.3 8 5 13 6 4Chicago 19.3 5 15 5 5 4Seattle 17.3 7 7 8 14 10
Washington DC 17.0 6 11 8 11 8Houston 16.3 11 17 16 7 6Denver 16.0 14 10 7 8 14
Pittsburgh 16.0 20 15 6 10 10Philadelphia 14.3 16 19 10 9 16
Austin 13.7 9 4 14 20 13Raleigh-Durham 12.7 13 6 22 21 14
Dallas 11.0 15 22 11 15 6Salt Lake City 9.7 10 3 21 24 18Minneapolis 9.3 17 17 15 12 19
Atlanta 9.0 12 13 12 13 22Baltimore 7.3 22 21 17 19 10
Miami 6.0 18 20 18 16 17Nashville 5.3 23 15 23 18 23Phoenix 4.7 24 17 10 13 13Portland 3.7 19 14 19 22 24
Kansas City 2.0 24 24 24 23 19New Orleans 1.7 25 25 25 25 25
General Capital

INNOVATION THAT MATTERSINNOVATION THAT MATTERS Appendix
CAPITAL CONTINUED…
Next Wave Capital: How much startup investment in your city is directed toward the next wave of the digital economy: Ed Tech, Energy Tech, Health Tech and Smart Cities?
25
City TOTAL SCORE
Bay Area 24.3Boston 24.3
New York City 22.3Los Angeles 22.0San Diego 21.3Chicago 19.3Seattle 17.3
Washington DC 17.0Houston 16.3Denver 16.0
Pittsburgh 16.0Philadelphia 14.3
Austin 13.7Raleigh-Durham 12.7
Dallas 11.0Salt Lake City 9.7Minneapolis 9.3
Atlanta 9.0Baltimore 7.3
Miami 6.0Nashville 5.3Phoenix 4.7Portland 3.7
Kansas City 2.0New Orleans 1.7
Investment in Next Wave Startups
Percentage of Total
Investment
Exits: Acquisition
Count
Exits: Acquisition Value Totals
Exits: IPO Count
1 12 1 3 12 5 2 1 23 19 2 4 34 13 4 2 75 2 6 9 48 22 7 8 156 15 10 19 1011 23 12 14 59 11 19 10 1015 17 9 6 1520 3 5 7 712 6 7 15 1013 20 21 5 1010 7 17 17 716 16 14 12 177 9 22 21 1417 8 13 13 1714 18 11 20 2122 14 14 18 618 10 19 23 2219 1 18 16 1724 17 10 13 1323 24 23 24 2425 25 24 22 1724 4 25 24 24
Next Wave Capital

INNOVATION THAT MATTERSINNOVATION THAT MATTERS Appendix
INDUSTRY SPECIALIZATION
As digital technology expands, it is penetrating deeper into industries that until recently, were not considered part of the digital economy. In many ways, Uber is actually a transportation, not a tech company and Air BnB is a hospitality company. The digital economy is evolving beyond a general IT sector into more specialized fields, and cities must start to develop their new competitive advantages. The specialization score looks at two dimensions:
Startup Specialization: How competitive is your city in the Ed Tech, Energy Tech, Health Tech and Smart City sectors?
Continued on next page…
26
City TOTAL SCORE Education Energy Health Smart Cities
Bay Area 20.0 1 1 1 1Boston 19.7 2 2 2 6
New York City 18.9 3 3 3 1Philadelphia 16.3 20 16 6 9
Seattle 15.9 7 10 8 8Los Angeles 15.6 5 4 5 3
Chicago 15.2 6 11 11 4San Diego 15.2 13 8 4 11Pittsburgh 14.8 10 21 12 18
Washington DC 14.3 4 9 9 5Austin 13.7 8 6 14 7
Raleigh-Durham 13.7 18 18 7 19Denver 13 15 5 17 14
Salt Lake City 12.7 8 17 18 20Minneapolis 12.0 19 19 10 13
Dallas 11.7 23 12 14 12Atlanta 11.3 20 13 16 16
Portland 11.1 25 14 23 15Baltimore 10.8 11 15 19 22Phoenix 10.7 13 20 22 9Miami 10.4 12 22 20 17
Houston 10.2 22 6 21 22Kansas City 7.6 17 23 24 21
New Orleans 7.4 24 25 25 25Nashville 6.4 16 24 13 24
Startups

INNOVATION THAT MATTERSINNOVATION THAT MATTERS Appendix
INDUSTRY SPECIALIZATION CONTINUED…
Legacy Business Specialization: Do you have strong traditional business clusters in the IT, Education, Energy, Health, and urban development sectors that can be mobilized to support the next generation of startups in your community?
27
City TOTAL SCORE
Bay Area 20.0Boston 19.7
New York City 18.9Philadelphia 16.3
Seattle 15.9Los Angeles 15.6
Chicago 15.2San Diego 15.2Pittsburgh 14.8
Washington DC 14.3Austin 13.7
Raleigh-Durham 13.7Denver 13
Salt Lake City 12.7Minneapolis 12.0
Dallas 11.7Atlanta 11.3
Portland 11.1Baltimore 10.8Phoenix 10.7Miami 10.4
Houston 10.2Kansas City 7.6
New Orleans 7.4Nashville 6.4
Legacy Businesses
IT Education Energy Health Smart Cities
2 8 16 8 154 1 15 1 2421 6 9 3 1512 3 2 2 171 17 8 18 1411 10 23 12 2116 13 16 9 115 9 21 4 2210 7 5 10 816 1 12 25 243 17 22 15 198 10 3 5 23
20 21 4 17 47 22 16 11 16 15 19 5 2015 24 7 19 318 20 1 23 58 17 9 5 1822 3 20 15 1014 12 24 19 519 13 12 13 1213 25 9 22 223 23 14 14 725 5 5 24 924 16 25 21 13

INNOVATION THAT MATTERSINNOVATION THAT MATTERS Appendix
DENSITY
Innovation economies require a critical mass of people working together in close proximity where they can easily and regularly interact with each other. It is no coincidence that the next generation of startup communities are sprouting up not in isolated suburban areas, but rather small, dense neighborhoods such as Kendall Square in Boston and South of Market in San Francisco. The density score looks at four dimensions:
Startups: Do you have a critical mass of startups, given the size of your city?
Next Wave Startups: Do you have a critical mass of startups in the Ed Tech, Energy Tech, Health Tech and Smart Cities sectors?
Residential Density: Are young people moving back into your city’s urban core, driving the development of new innovation districts?
Perceived Density: Do local entrepreneurs feel that the community is dense enough to help them grow their businesses?
28
Perceived Density
City TOTAL SCORE Total StartupsStartups/Populati
onTotal Next Wave
Startups
Next Wave Startups/Total
Startups
Percentage of Millennials in Urban
Areas
Percentage Change 2000-2012 Survey Mean
Boston 23.8 3 2 2 9 3 11 3Bay Area 21.8 1 1 1 22 1 20 3
San Diego 19.0 7 7 5 4 15 8 12Philadelphia 17.3 10 17 7 5 9 5 16Los Angeles 16.5 4 10 4 21 24 3 10
Chicago 15.8 8 18 9 19 12 9 11Raleigh-Durham 15.5 16 5 11 3 16 17 6Washington DC 15.5 6 11 6 16 7 10 23
Austin 14.0 8 3 12 20 10 24 2Denver 14.0 13 9 15 15 13 18 1
New York City 13.8 2 8 3 25 6 23 17Minneapolis 13.3 15 14 10 2 14 14 18
Nashville 13.3 22 13 17 1 19 15 3Miami 12.3 14 18 14 11 21 1 20
Portland 12.3 18 11 20 17 4 21 7Seattle 12.3 5 5 8 24 11 16 21
Salt Lake City 11.8 17 4 18 18 5 25 9Dallas 11.5 12 18 13 14 22 2 19
Baltimore 11.0 23 18 23 7 8 4 22Pittsburgh 11.0 20 15 21 8 17 13 8
Atlanta 10.5 11 15 16 23 18 7 14New Orleans 8.7 25 25 25 12 2 19 N/AKansas City 7.8 24 23 24 10 23 6 13
Houston 6.8 21 24 19 6 20 12 24Phoenix 4.8 19 22 22 13 25 22 15
General Startups Next Wave Startups Residential Patterns
Density Rank

INNOVATION THAT MATTERSINNOVATION THAT MATTERS Appendix
CONNECTIVITY
It’s not enough to have strong talent, capital, and density in your city. You need to make sure people are actually working with each other in meaningful ways that are helping new businesses to succeed. The connectivity score looks at eight key actors: universities; mentors and advisors; professional services firms such as legal, accounting and office space; investors; corporations; cheerleaders such as event organizers, tech media and industry associations; civic institutions such as public schools, hospitals and government agencies; and local citizen advocacy groups.
29
City TOTAL SCORE Universities Mentors and Advisors Professional Services
Investors Corporates Cheerleaders Civic Institutions Citizen Engagement
Baltimore 18.8 3 2 5 14 12 3 7 12Denver 18.6 9 12 2 1 10 1 19 5
Raleigh-Durham 18.1 12 6 14 11 2 9 1 8Minneapolis 17.5 5 1 17 9 3 10 4 19
Austin 17.4 10 6 5 7 14 5 9 13Nashville 17.4 13 8 10 4 15 5 12 2Portland 17.4 15 8 2 12 1 3 4 24Boston 16.4 7 10 11 3 21 12 10 3
Kansas City 16.0 15 15 13 16 3 7 7 4Philadelphia 15.8 6 13 2 5 18 8 22 8Los Angeles 15.6 8 11 15 6 12 16 14 1
Chicago 15.5 4 5 7 17 7 13 11 20Pittsburgh 15.3 1 4 23 15 16 2 12 13
Salt Lake City 14.1 15 17 8 20 6 20 2 7Atlanta 14.0 2 18 18 2 20 14 6 16
Washington DC 13.6 14 19 18 10 11 18 3 6Bay Area 11.9 21 15 16 8 8 15 14 16
San Diego 10.5 24 24 1 18 3 21 20 13New York City 9.8 15 3 11 13 18 24 23 23
Houston 8.8 15 20 20 23 8 16 20 16Phoenix 7.6 11 13 24 24 22 19 14 20Seattle 7.4 15 21 8 19 24 22 18 22Miami 7.1 23 23 21 22 17 11 24 10Dallas 6.5 22 22 21 21 23 23 14 10
New Orleans N/A N/A N/A N/A N/A N/A N/A N/A N/A
Connectivity Score

INNOVATION THAT MATTERSINNOVATION THAT MATTERS Appendix
CULTURE
For cities to succeed in the digital economy, they need to have the right type of culture to set the ground rules for how people should interact with each other. The culture score looks at three dimensions:
Openness to New Ideas: Is your city willing to experiment with new ways of doing business? Is it excited to move into the future or resistant to change?
Quality of Life: Is the general experience of living in the city an asset or a hindrance for entrepreneurs?
Regulatory Environment: Is the local government proactive in adjusting its policies for the new digital economy?
30
City TOTAL SCOREOpenness to
New Ideas Quality of LifeRegulatory
Environment
Raleigh-Durham 22.0 3 2 7Dallas 21.3 8 5 1Denver 20.7 2 1 13Boston 20.3 6 5 6Austin 19.3 3 2 15
Portland 19.3 7 5 8Nashville 18.3 15 4 4
Miami 16.7 5 14 9Bay Area 15.3 1 22 9Phoenix 15.3 17 12 3
San Diego 15.3 12 8 12Pittsburgh 14.3 11 13 11
Houston 14.0 20 14 2Salt Lake City 13.3 23 10 5Philadelphia 11.7 19 8 16Los Angeles 11.0 8 14 23
Atlanta 10.0 13 11 24Washington DC 9.0 16 18 17
Kansas City 8.7 21 17 14New York City 8.0 10 24 20
Baltimore 6.7 14 23 21Chicago 6.3 22 19 18Seattle 6.3 17 20 22
Minneapolis 5.0 24 21 18New Orleans N/A N/A N/A N/A
Culture Score

INNOVATION THAT MATTERSINNOVATION THAT MATTERS Appendix
APPENDIX B: METHODOLOGY
31
Index Categories Metric Source Calculation
TALENT
Population Flux
Domestic Population Inflows
U.S. Cluster Mapping Project
Change in domestic population as percentage of total population, 2011-2015
International Population Inflows
U.S. Cluster Mapping Project
Change in international population as percentage of total population, 2011-2015
Educational Attainment
Percentage of Educated Millennials
"Young and Restless" Report by
City Observatory
Number of 25-34 year olds with secondary degree as percentage of total population
Percentage Change in Educated Millennials
"Young and Restless" Report by
City Observatory
Change in above, 2000-2012
Skills
Tech Skills"India's Got Tech Talent" LinkedIn
Study
Percentage of incoming residents with tech skills
Next Wave Industry Skills
"Defining a City by its Professoinal
Skillset" LinkedIn Study
Number of Education, Energy, Health, and Smart Cities skills in top 10 city skills
Index Categories Metric Source Calculation
CAPITAL
General Capital
Total Investment Mattermark Total investment 2011-2015
Unlocked Capital Ratio (Investment/
GDP)Calculation
Total investment 2011-2015 as percentage of 2015 MSA GDP
Exits: Acquisition Count Mattermark
Number of acquisitions in MSA, 2011-2015
Exits: Acquisition Value Totals Mattermark
Total publicized value of acquisitions in MSA, 2011-2015
Exits: IPO Count Mattermark Number of IPOs in MSA, 2011-2015
Next Wave Capital
Investment in Next Wave Industries Mattermark
Total investment in Education, Energy, Health and Smart Cities, 2011-2015
Percentage of Total Investment Calculation
Investment in Civic Industries / Total Investment
Exits: Acquisition Count Mattermark
Number of acquisitions in Education, Energy, Health, Smart Cities in MSA, 2011-2015
Exits: Acquisition Value Totals Mattermark
Total publicized value of acquisitions in Education, Energy, Health, Smart Cities in MSA, 2011-2015
Exits: IPO Count Mattermark
Number of IPOs in Education, Energy, Health, Smart Cities in MSA, 2011-2015

INNOVATION THAT MATTERSINNOVATION THAT MATTERS Appendix 32
Index Categories Metric Source Calculation
INDUSTRY SPECIALIZATION STARTUP
Education
Starts MattermarkVertical Search Tags: "Education"; Number of total companies in MSA
Champions MattermarkVertical Search Tags: "Education"; Number of companies with $5 million+ in funding in MSA
Exits - Acquisition Count Mattermark - New Exit Dataset
New dataset (not yet available on website); Vertical Search Tags: "Education"; Number of acquired companies in MSA, 2011-2015
Exits - Acquisition Value Totals
Mattermark - New Exit Dataset
New dataset (not yet available on website); Vertical Search Tags: "Education"; Total publicized value of acquired companies in MSA, 2011-2015
Exits - IPO Count Mattermark - New Exit Dataset
New dataset (not yet available on website); Vertical Search Tags: "Education"; Number of IPOs in MSA, 2011-2015
Energy
Starts MattermarkVertical Search Tags: "Energy, Clean Tech"; Number of total companies in MSA
Champions MattermarkVertical Search Tags: "Energy, Clean Tech"; Number of companies with $5 million+ in funding in MSA
Exits - Acquisition Count Mattermark - New Exit Dataset
New dataset (not yet available on website); Vertical Search Tags: "Energy, Clean Tech"; Number of acquired companies in MSA, 2011-2015
Exits - Acquisition Value Totals
Mattermark - New Exit Dataset
New dataset (not yet available on website); Vertical Search Tags: "Energy, Clean Tech"; Total publicized value of acquired companies in MSA, 2011-2015
Exits - IPO Count Mattermark - New Exit Dataset
New dataset (not yet available on website); Vertical Search Tags: "Energy, Clean Tech"; Number of IPOs in MSA, 2011-2015
Health
Starts MattermarkVertical Search Tags: "Healthcare"; Number of total companies in MSA
Champions MattermarkVertical Search Tags: "Healthcare"; Number of companies with $5 million+ in funding in MSA
Exits - Acquisition Count Mattermark - New Exit Dataset
New dataset (not yet available on website); Vertical Search Tags: "Healthcare"; Number of acquired companies in MSA, 2011-2015
Exits - Acquisition Value Totals
Mattermark - New Exit Dataset
New dataset (not yet available on website); Vertical Search Tags: "Healthcare"; Total publicized value of acquired companies in MSA, 2011-2015
Exits - IPO Count Mattermark - New Exit Dataset
New dataset (not yet available on website); Vertical Search Tags: "Healthcare"; Number of IPOs in MSA, 2011-2015
Smart Cities
Cities - Construction U.S. Cluster Mapping Project
MSA Location Quotient (Percentage of employment in industry compared to national average)
Cities - Envir. Services U.S. Cluster Mapping Project
MSA Location Quotient (Percentage of employment in industry compared to national average)
Cities - Real Estate U.S. Cluster Mapping Project
MSA Location Quotient (Percentage of employment in industry compared to national average)
Cities - Traded Transport/Logistics
U.S. Cluster Mapping Project
MSA Location Quotient (Percentage of employment in industry compared to national average)
Cities - Local Transport/Logistics
U.S. Cluster Mapping Project
MSA Location Quotient (Percentage of employment in industry compared to national average)

INNOVATION THAT MATTERSINNOVATION THAT MATTERS Appendix 33
Index Categories Metric Source
INDUSTRY SPECIALIZATION
ESTABLISHED BUSINESSES
IT IT U.S. Cluster Mapping Project
MSA Location Quotient (Percentage of employment in industry compared to national average)
Education
Education - Traded U.S. Cluster Mapping Project
MSA Location Quotient (Percentage of employment in industry compared to national average)
Education - Local U.S. Cluster Mapping Project
MSA Location Quotient (Percentage of employment in industry compared to national average)
Energy
Electric Power - Traded U.S. Cluster Mapping Project
MSA Location Quotient (Percentage of employment in industry compared to national average)
Energy Utilities - Local U.S. Cluster Mapping Project
MSA Location Quotient (Percentage of employment in industry compared to national average)
Health
Health - Biopharma U.S. Cluster Mapping Project
MSA Location Quotient (Percentage of employment in industry compared to national average)
Health - Med Devices U.S. Cluster Mapping Project
MSA Location Quotient (Percentage of employment in industry compared to national average)
Health - Local U.S. Cluster Mapping Project
MSA Location Quotient (Percentage of employment in industry compared to national average)
Smart Cities
Cities - Construction U.S. Cluster Mapping Project
MSA Location Quotient (Percentage of employment in industry compared to national average)
Cities - Envir. Services U.S. Cluster Mapping Project
MSA Location Quotient (Percentage of employment in industry compared to national average)
Cities - Real Estate U.S. Cluster Mapping Project
MSA Location Quotient (Percentage of employment in industry compared to national average)
Cities - Traded Transport/Logistics
U.S. Cluster Mapping Project
MSA Location Quotient (Percentage of employment in industry compared to national average)
Cities - Local Transport/Logistics
U.S. Cluster Mapping Project
MSA Location Quotient (Percentage of employment in industry compared to national average)

INNOVATION THAT MATTERSINNOVATION THAT MATTERS Appendix 34
Index Categories Metric Source Calculation
DENSITY
Startups
Total Startups MattermarkNumber of total companies in MSA
Startups/Population Calculation
Number of total companies in MSA divided by 2014 population
Next Wave Startups
Total Next Wave Startups Mattermark Vertical Search
Tags: "Education
Next Wave Startups / Total
StartupsCalculation
Number of companies in Education, Energy, Health and Smart Cities divided by number of total companies in MSA
Residential Patterns
Percentage of Milennials in Urban Areas
"Young and Restless" Report
by City Observatory
Percentage of 25-34 year olds who live within 3 miles of downtown
Percentage Change
2000-2012
"Young and Restless" Report
by City Observatory
Percentage change in percentage of 25-34 year olds who live within 3 miles of downtown
Perceived Density Survey Mean
Startup Survey Conducted by
Brunswick Insights
Rate Engagement by Actor, Scale of 1-4, Mean Score

INNOVATION THAT MATTERSINNOVATION THAT MATTERS Appendix 35
Index Categories Metric Source Calculation
CONNECTIVITY Survey
Universities
Startup Survey Conducted by
Brunswick Insights
Rate Engagement by Actor, Scale of 1-4, Mean Score
Mentors and Advisors
Startup Survey Conducted by
Brunswick Insights
Rate Engagement by Actor, Scale of 1-4, Mean Score
Professional Services
Startup Survey Conducted by
Brunswick Insights
Rate Engagement by Actor, Scale of 1-4, Mean Score
Investors
Startup Survey Conducted by
Brunswick Insights
Rate Engagement by Actor, Scale of 1-4, Mean Score
Corporates
Startup Survey Conducted by
Brunswick Insights
Rate Engagement by Actor, Scale of 1-4, Mean Score
Cheerleaders
Startup Survey Conducted by
Brunswick Insights
Rate Engagement by Actor, Scale of 1-4, Mean Score
Civic Institutions
Startup Survey Conducted by
Brunswick Insights
Rate Engagement by Actor, Scale of 1-4, Mean Score
Citizen Engagement
Startup Survey Conducted by
Brunswick Insights
Rate Engagement by Actor, Scale of 1-4, Mean Score
Index Categories Metric Source Calculation
CULTURE Survey
Openness to New Ideas
Startup Survey Conducted by
Brunswick Insights
Rate Impact on Business, Scale of 1-4, Mean Score
Quality of Life
Startup Survey Conducted by
Brunswick Insights
Rate Impact on Business, Scale of 1-4, Mean Score
Regulatory Environment
Startup Survey Conducted by
Brunswick Insights
Rate Impact on Business, Scale of 1-4, Mean Score