u.s. department of commerce economics and … · u.s. department of commerce economics and...
TRANSCRIPT

U.S. DEPARTMENT OF COMMERCE ECONOMICS AND STATISTICS
ADMINISTRATION
Economic and Statistical Analysis Budget
Budget Estimates
Fiscal Year 2016
As Presented to Congress
February 2015

This page intentionally left blank.

Exhibit 1
Economic and Statistical Analysis BudgetEconomics and Statistics Administration / Bureau of Economic Analysis
Budget Estimates, Fiscal Year 2016Congressional Submission
Table of Contents
Exhibit PageNumber Exhibit Number
1 Table of Contents ESA- 12 Organization Chart ESA- 23 Executive Summary ESA- 55 Summary of Resource Requirements ESA- 96 Summary of Reimbursable Obligations ESA- 107 Summary of Financing ESA- 119 Justification of Inflation Adjustments ESA- 12
10 Program and Performance: Direct Obligations ESA- 1412-15 Justification of Program and Performance (by subactivity) ESA- 17
Policy Support ESA- 17Bureau of Economic Analysis ESA- 20Big Data for Small Business ESA- 26Energy Satellite Account ESA- 32Services Trade Initiative ESA- 40GSA Required Relocation / Renovation Funding ESA- 48
16 Summary of Requirements by Object Class ESA- 5034 Advisory & Assistance Services ESA- 5135 Periodical, Pamphlets, & Audiovisual Services ESA- 5236 Average Grade & Salaries ESA- 53
APP/ APR Summary of Goals, Objectives and Performance Measures ESA- 54
ESA - 1

This page intentionally left blank.

EXHIBIT 2 DEPARTMENT OF COMMERCE
Economic and Statistical Analysis Budget Economics and Statistics Administration / Bureau of Economic Analysis
Organization Chart
The Economics and Statistics Administration (ESA) includes Policy Support and Management Oversight, the Bureau of Economic Analysis (BEA) and the Bureau of the Census. The Bureau of the Census budget is submitted separately. Policy Support and Management Oversight consists of the Under Secretary for Economic Affairs and the Office of the Chief Economist. The Under Secretary for Economic Affairs provides leadership and critical oversight of the Census Bureau and Bureau of Economic Analysis. The policy support staff, located within the Office of the Chief Economist, conducts economic research and policy analysis in direct support of the Secretary of Commerce and the Administration. ESA monitors and interprets economic developments, domestic fiscal and monetary policies, and analyzes economic conditions and policy initiatives of major trading partners. The Bureau of Economic Analysis (BEA), one of 13 principal Federal statistical agencies, promotes a better understanding of the U.S. economy by providing timely, relevant, and accurate economic accounts data in an objective and cost-effective manner. BEA’s national, industry, regional, and international economic accounts present valuable information on key issues such as U.S. economic growth, regional economic development, inter-industry relationships, and the Nation's position in the world economy. Some of the widely used statistical measures produced by BEA include gross domestic product (GDP), personal income and outlays, corporate profits, GDP by state and by metropolitan area, balance of payments, and GDP by industry. These statistics are used by Federal, state, and local governments for budget development and projections; by the Federal Reserve for monetary policy; by the business sector for planning and investment; and by the American public to follow and understand the performance of the Nation’s economy. BEA’s strategic vision is to remain the world’s most respected producer of economic accounts.
Economics and Statistics
Administration
Bureau of the Census Bureau of Economic Analysis
ESA - 2
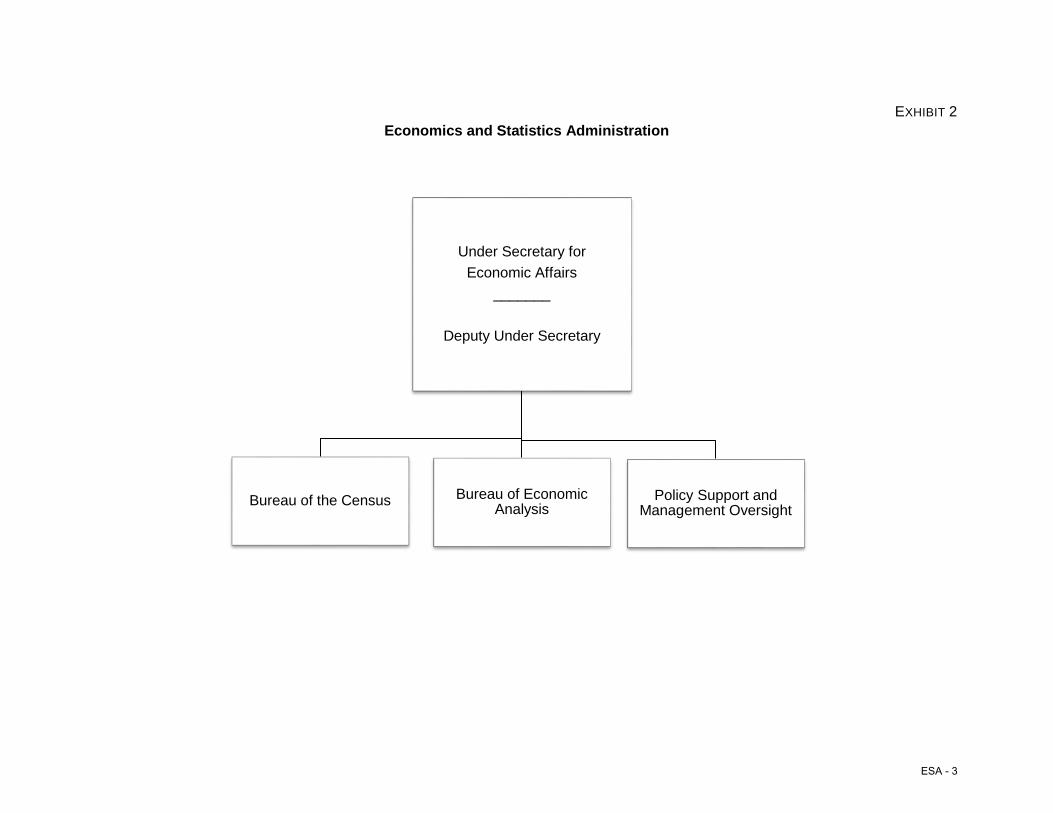
EXHIBIT 2 Economics and Statistics Administration
Under Secretary for Economic Affairs
_______
Deputy Under Secretary
Policy Support and Management Oversight
Bureau of the Census Bureau of Economic Analysis
ESA - 3

EXHIBIT 2
Bureau of Economic Analysis
Director _______
Deputy Director
Associate Director for National Economic
Accounts
Government Division
National Income and Wealth Division
Associate Director for International Economics
Balance of Payments Division
Direct Investment Division
Associate Director for Regional Economics
Regional Product Division
Regional Income Division
Associate Director for Industry Accounts
Industry Sector Division
Industry Applications
Division
Chief Information Officer
Office of Network and Telecommunications
Office of Applications Development
Office of Customer Service and Security
Office of Desktop Support
Chief Statistician Chief Economist
Chief Administrative Officer
ESA - 4

This page intentionally left blank.

Exhibit 3
DEPARTMENT OF COMMERCE Economic and Statistical Analysis Budget
Economics and Statistics Administration / Bureau of Economic Analysis
Executive Summary
The United States is widely recognized as being the world’s economic information leader. This is due, in large part, to the timely and accurate data provided by the Economics and Statistics Administration (ESA) through the Bureau of Economic Analysis (BEA) and the Census Bureau. BEA provides vital economic information, including the gross domestic product (GDP) and international balance of payments, which are essential to decision making by the President, Congress, American business leaders, and participants in the world’s financial markets.
FY 2015 Enacted 100,000Inflationary Adjustments 1,981WCF Program Increases 442FY 2016 Base Request 102,423Big Data for Small Business 1,918Energy Satellite Account 2,028Services Trade Initiative 3,189GSA Required Buildout/ Relocation 4,291FY 2016 OMB Request 113,849
The Bureau of Economic Analysis, although a relatively small agency, produces some of the most closely watched national economic statistics that directly affect decisions made by policy makers, business leaders, and the American public.
For FY 2016, ESA/BEA is submitting a budget at a level that is sufficient to preserve the timeliness, relevance, and accuracy of the nation’s economic accounts. Base funds will be used for economic policy support provided by the ESA headquarters staff and work outlined in the BEA Strategic Plan, which provides a detailed plan for maintaining and improving those accounts. The increase of $442,000 will cover additional shared service investments within the Departmental Working Capital Fund (WCF). A full discussion of all WCF program changes is in the WCF section of the Departmental Management OMB Submission document. The $1.9 million in Inflationary Adjustments will fund the estimated 2016 Federal pay raise of 1.3 percent and will provide for inflationary increases for non-labor activities, including service contracts, utilities, and rent.
ESA - 5

Exhibit 3
Additionally, BEA is requesting funds for:
Big Data for Small Business: Small businesses are a critical element of the overall economy, and are often at the leading edge of risk-taking, entrepreneurship, and economic growth. Yet, unlike large corporations who have staffs of economists, advisors, and consultants to assist in interpreting and understanding the economy and guiding investments, small businesses largely depend on limited publically available data. Recognizing this, and the Department’s role in supporting small business growth and decision-making, as well as the need for more insight into the health of the small business sector, for $1.9M, BEA proposes a new suite of small business data products. BEA will expand data on small business by developing a Small Business Satellite Account including a new Small Business GDP to track the overall growth and health of America’s small business sector. Beyond the public policy arena, expanding the Department’s data offerings to this essential constituency will only further enhance the ability of America’s entrepreneurs to innovate, grow, and lead successful businesses.
Energy Satellite Account: Meeting the Nation’s energy goals will require major structural changes in the economy related to energy. The development of an energy satellite account will focus attention on U.S. energy production and prices, its global supply chain, investments in direct and indirect energy-related technology and infrastructure, and the use of energy goods and services by consumers and businesses. The account will provide inflation-adjusted measures of industry outputs, inputs, and value added, including the energy sector’s contribution to overall GDP growth and price change. It will also provide meaningful economic statistics to evaluate the impacts of structural changes in the U.S. economy at both the national and regional level and their effects on—among others—total national employment, occupational distributions, domestic energy use, demand for raw materials, high-technology and innovative capital investments, and international trade flows for energy goods and services. The development of such an account could prove to be valuable for informing public policymaking related to taxation, international trade, and the environment.
Services Trade Initiative: Growth in services exports is increasingly important to the U.S. economy and the trade balance. Exports of services represented 30% of total U.S. exports and led to a $229 billion surplus in services trade in 2013. BEA proposes to expand and improve the data it publishes on some of the most dynamic industries with high value jobs including research and development, intellectual property, medical services, financial services, and information and communication technology. BEA will provide more frequent data on traded services by publishing additional detail on a quarterly rather than just an annual basis, and will provide greater geographic detail regarding the destination of U.S. service exports and the source of U.S. service imports. Enhanced information on U.S. trade in services will inform our trade negotiations, which are increasingly focused on issues related to intellectual property and information and communication technology, and support our trade promotion efforts by identifying overseas markets with increased potential for U.S. service exports. BEA will update the coverage of its surveys to ensure that coverage is keeping pace with the growing number of
ESA - 6

Exhibit 3
U.S. globally engaged business and will continue to improve survey design to obtain accurate and timely responses with minimal respondent burden. Finally, BEA will make our service trade data more accessible through user-friendly tables, charts, and downloadable data.
GSA Required Relocation and/or Renovation: BEA is currently under a short-term lease extension at 1441 L Street, NW, Washington, D.C. that expires in June, 2016. As part of establishing a new long-term lease, the General Services Administration (GSA) looked at options to (1) build out and relocate to a new facility or (2) reconfigure its current facility to a smaller footprint. The GSA estimated these costs at approximately $16 million. BEA had requested $8 million in FY 2015 to partially pay for this one-time required build and planned to request the remaining $8 million in FY 2016. The Department, in conjunction with OMB and GSA, has decided to move BEA to Suitland, MD and co-locate them with the Census Bureau. Bringing these two operating units closer together will help us better deliver our important mission through greater collaboration. Financially, BEA will reduce the one time renovation costs by approximately $8 million and their rent will be cut by $2.5 million a year. The FY 2016 request for BEA includes $4.3 million to move to Suitland, MD. This request is a $12 million reduction compared to initial GSA estimates.
The continuing growth, increasing complexity, and changing structure of the American economy make it increasingly important for policy makers and business leaders to have the timeliest, most relevant, and most accurate economic information possible. The work performed by ESA and BEA helps maintain a sound Federal statistical system to provide such information. The data produced, including the GDP, personal income, and balance-of-payments accounts, have a major effect on government spending and taxing decisions, the allocation of Federal funds to states, and private sector business planning of all types. The GDP and related accounts data are critical inputs to monetary, fiscal, trade, and regulatory policies, and because they influence interest rates and financial markets, they affect every American who runs a business, saves for retirement, or borrows to buy a home.
ESA - 7

Exhibit 3
Bureau of Economic Analysis: Economic Accounts 10,000 time series produced each month - Nearly 2 million other data produced quarterly and annually
National Income and Product Accounts
Gross Domestic Product (GDP) – The broadest measure of the U.S. economy. Components of GDP show how specific sectors of the economy are performing. GDP and the other components of the National Income and Product Accounts are key ingredients into Federal budget planning, monetary policy, and business planning. Personal Income and Outlays – Comprehensive and timely monthly statistics on all income received by persons in the United States, the money they spend on goods and services, and the income they save. Corporate Profits – The only comprehensive, timely, and consistent statistics on corporate earnings. These statistics are an important baseline for businesses and individuals in judging corporate earnings. Fixed Assets – Comprehensive statistics on U.S. wealth including capital stocks, consumer durable goods, and depreciation. These statistics are crucial in the analysis of the effect of wealth on consumer spending, investment, and economic growth.
International Accounts
Balance of Payments – The international transactions accounts are a statistical summary of transactions between U.S. and foreign residents, including, for example, transactions in goods and services, debt forgiveness, and transactions in U.S.-owned assets abroad and foreign-owned assets in the United States. U.S. International Trade in Goods and Services – Monthly estimates of U.S. imports and exports of goods and services. International Investment Position – The only comprehensive comparison of the value of U.S.-owned assets abroad and the value of foreign-owned assets in the United States. These statistics facilitate analysis of the economic effects of international lending and investment on the U.S. economy. MNC Financial and Operating Data – These data sets cover the financial structure and operations of U.S. multinational companies (MNCs) and of U.S. affiliates of foreign MNCs. The data are used to analyze the characteristics and performance of MNCs and to assess their impact on the U.S. and foreign host economies.
Industry Accounts
Annual Industry Accounts – These accounts are a set of integrated statistics that include the GDP-by-industry and the annual input-output accounts. These accounts provide detailed information on the changing structure of the U.S. economy, including the annual contributions of private industries and government to the Nation’s GDP and the annual flows of goods and services used in the production processes of industries. Benchmark Input-Output Accounts – These accounts show how industries interact at detailed levels; specifically, how approximately 500 industries provide input to, and use output from, each other to produce gross domestic product. These accounts provide detailed information on the flows of goods and services that make up the production processes of industries. U.S. Travel and Tourism Accounts – This satellite account is the most comprehensive and timely picture of direct and indirect sales made in tourism-related industries and their role in the U.S. economy.
Regional Accounts
State and Local Personal Income – This measure reports income for state, county, metropolitan and micropolitan areas, and BEA economic areas, and is used along with GDP by State to allocate over $226 billion in Medicaid and other grants to states. States use state personal income to project tax receipts and set spending caps. Gross Domestic Product (GDP) by State and by Metropolitan Area – GDP by State shows the portion of the Nation’s output produced in each state and the portion of each industry’s output by state; it is used to distribute Federal grants to states. GDP by Metropolitan Area statistics are useful for determining the overall size and growth of metropolitan economies. Regional Input-Output Multipliers – These statistics provide a measure of the local economic impacts of changes in government regulations, policies, or programs or in private-sector economic development plans. Multipliers have been used to study the effects of military base closings, firm relocation, sports facility construction, natural disasters, and terrorist attacks.
ESA - 8

Exhibit 5
Department of CommerceEconomic and Statistical Analysis Budget
Economics and Statistics Administration / Bureau of Economic AnalysisSalaries and Expenses
SUMMARY OF RESOURCE REQUIREMENTS(Dollar amounts in thousands)
Budget DirectPositions FTE Authority Obligations
FY 2015 Enacted 481 470 100,000 103,964less: Unobligated Balance, start of year (3,964)plus: Inflationary Adjustments 0 0 1,981 1,981plus: Working Capital Fund Program Increases 0 0 442 442
FY 2016 Base 481 470 102,423 102,423plus: Big Data for Small Business 12 9 1,918 1,918plus: Energy Satellite Account 12 9 2,028 2,028plus: Services Trade Initiative 15 11 3,189 3,189plus: GSA Required Buildout/ Relocation 0 0 4,291 4,291
FY 2016 Estimate 520 499 113,849 113,8492014 2015 2016 2016 2016
Comparison by activity/subactivity IncreasePersonnel Amount Personnel Amount Personnel Amount Personnel Amount Personnel Amount
Bureau of Economic Analysis Pos/BA 456 95,378 467 96,264 467 98,549 506 109,975 39 11,426FTE/Obl. 437 93,558 457 100,043 457 486 29
Policy support Pos/BA 14 3,622 14 3,736 14 3,874 14 3,874 0 0FTE/Obl. 13 3,625 13 3,921 13 13 0
TOTALS Pos/BA 470 99,000 481 100,000 481 102,423 520 113,849 39 11,426FTE/Obl. 450 97,183 470 103,964 470 499 29
Adjustments to Obligations
Recoveries and Refunds (1,625) Unobligated Balance, start of year (572) (3,964) Unobligated Balance, end of year 3,964 Unobligated Balance, rescission - Unobligated balance expiring 50
Appropriation 450 99,000 470 100,000 470 102,423 499 113,849 29 11,426
Actuals BaseEnacted Estimate
ESA - 9

Department of Commerce Exhibit 6Economic and Statistical Analysis Budget
Economics and Statistics Administration / Bureau of Economic AnalysisSalaries and Expenses
SUMMARY OF REIMBURSABLE OBLIGATIONS(Dollar amounts in thousands)
2014 2015 2016 2016 2016 Increase/Comparison by activity (Decrease)
Personnel Amount Personnel Amount Personnel Amount Personnel Amount Personnel Amount
Reimbursable projectsBureau of Economic Analysis Pos/BA 7 1,458 10 2,101 10 2,950 10 2,950 0 0
FTE/Obl. 7 10 10 10 0
Policy support Pos/BA 18 4,069 23 4,039 23 4,855 23 4,855 0 0FTE/Obl. 18 23 23 23 0
Total, Reimbursable projects........................... Pos/BA 25 5,527 33 6,140 33 7,805 33 7,805 0 0FTE/Obl. 25 33 33 33 0
Subscription and fee sales
Bureau of Economic Analysis Pos/BA 2 359 3 1,361 1 404 1 404 0 0FTE/Obl. 2 3 1 1 0
Policy support Pos/BA 0 0 0 0 0 0 0 0 0 0FTE/Obl. 0 0 0 0 0
Total, Subscription and fee sales..................... Pos/BA 2 359 3 1,361 1 404 1 404 0 0FTE/Obl. 2 3 1 1 0
Total, Reimbursable Obligations..................... Pos/BA 27 5,886 36 7,501 34 8,209 34 8,209 0 0FTE/Obl. 27 36 34 34 0
Actual BaseEnacted Estimate
ESA - 10

Department of Commerce Exhibit 7Economic and Statistical Analysis Budget
Economics and Statistics Administration / Bureau of Economic AnalysisSalaries and Expenses
SUMMARY OF FINANCING(Dollar amounts in thousands)
Comparison by activity 2014 2015 2016 2016 2016 Increase/Actual Enacted Base Estimate (Decrease)
Total Obligations 103,069 111,465 110,632 122,058 11,426
Offsetting collections from:Federal Funds (5,527) (6,140) (7,805) (7,805) 0Trust funds 0 0 0 0 0Non-Federal sources (359) (1,361) (404) (404) 0
Recoveries and Refunds (1,625) 0 0 0 0
Unobligated balance direct, start of year (572) (3,964) 0 0 0Unobligated balance reimbursable, start of year 0 0 0 0 0Unobligated balance transferred 0 0 0 0 0Unobligated balance direct, end of year 3,964 0 0 0 0Unobligated balance reimbursable, end of year 0 0 0 0 0Unobligated balance expiring 50 0 0 0 0
Budget Authority 99,000 100,000 102,423 113,849 11,426
Financing:Unobligated balance rescission 0 0 0 0 0Transferred from other accounts (-) 0 0 0 0 0Transferred to other accounts (+) 0 0 0 0 0
Appropriation 99,000 100,000 102,423 113,849 11,426
ESA - 11
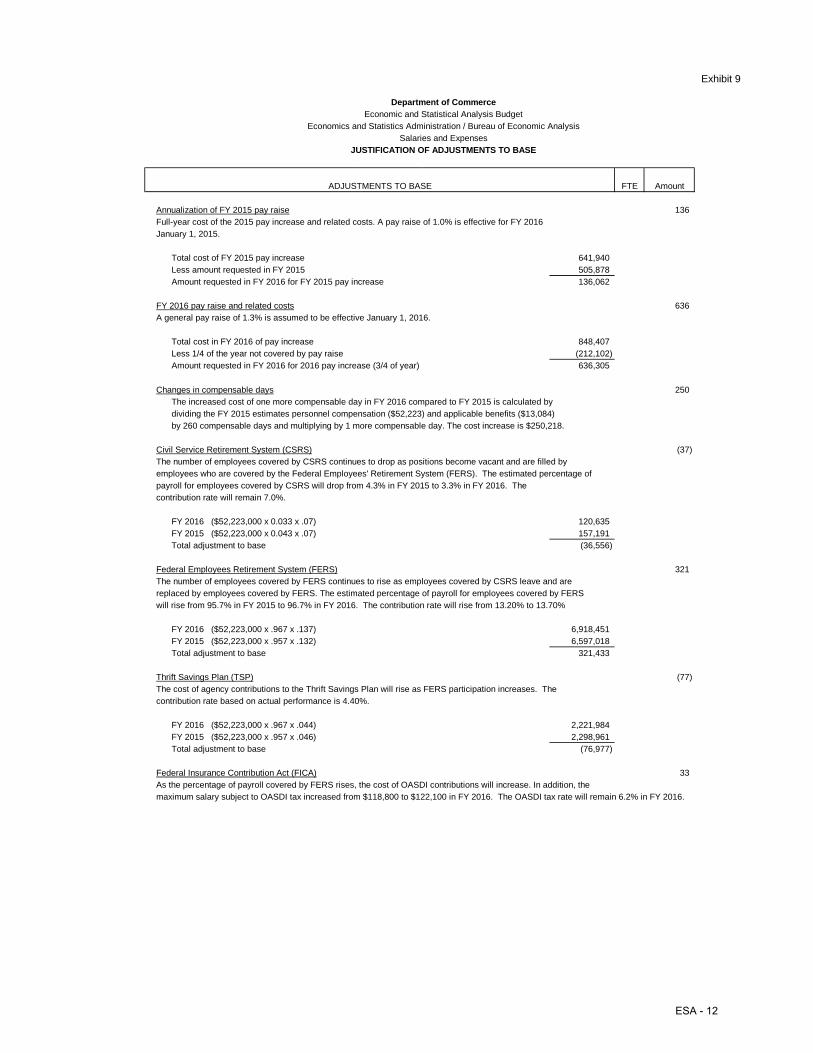
Exhibit 9
Department of CommerceEconomic and Statistical Analysis Budget
Economics and Statistics Administration / Bureau of Economic AnalysisSalaries and Expenses
JUSTIFICATION OF ADJUSTMENTS TO BASE
FTE Amount
Annualization of FY 2015 pay raise 136Full-year cost of the 2015 pay increase and related costs. A pay raise of 1.0% is effective for FY 2016January 1, 2015.
Total cost of FY 2015 pay increase 641,940Less amount requested in FY 2015 505,878Amount requested in FY 2016 for FY 2015 pay increase 136,062
FY 2016 pay raise and related costs 636A general pay raise of 1.3% is assumed to be effective January 1, 2016.
Total cost in FY 2016 of pay increase 848,407Less 1/4 of the year not covered by pay raise (212,102)Amount requested in FY 2016 for 2016 pay increase (3/4 of year) 636,305
Changes in compensable days 250The increased cost of one more compensable day in FY 2016 compared to FY 2015 is calculated bydividing the FY 2015 estimates personnel compensation ($52,223) and applicable benefits ($13,084)by 260 compensable days and multiplying by 1 more compensable day. The cost increase is $250,218.
Civil Service Retirement System (CSRS) (37)The number of employees covered by CSRS continues to drop as positions become vacant and are filled by employees who are covered by the Federal Employees' Retirement System (FERS). The estimated percentage ofpayroll for employees covered by CSRS will drop from 4.3% in FY 2015 to 3.3% in FY 2016. Thecontribution rate will remain 7.0%.
FY 2016 ($52,223,000 x 0.033 x .07) 120,635FY 2015 ($52,223,000 x 0.043 x .07) 157,191Total adjustment to base (36,556)
Federal Employees Retirement System (FERS) 321The number of employees covered by FERS continues to rise as employees covered by CSRS leave and arereplaced by employees covered by FERS. The estimated percentage of payroll for employees covered by FERSwill rise from 95.7% in FY 2015 to 96.7% in FY 2016. The contribution rate will rise from 13.20% to 13.70%
FY 2016 ($52,223,000 x .967 x .137) 6,918,451FY 2015 ($52,223,000 x .957 x .132) 6,597,018Total adjustment to base 321,433
Thrift Savings Plan (TSP) (77)The cost of agency contributions to the Thrift Savings Plan will rise as FERS participation increases. The contribution rate based on actual performance is 4.40%.
FY 2016 ($52,223,000 x .967 x .044) 2,221,984FY 2015 ($52,223,000 x .957 x .046) 2,298,961Total adjustment to base (76,977)
Federal Insurance Contribution Act (FICA) 33As the percentage of payroll covered by FERS rises, the cost of OASDI contributions will increase. In addition, themaximum salary subject to OASDI tax increased from $118,800 to $122,100 in FY 2016. The OASDI tax rate will remain 6.2% in FY 2016.
ADJUSTMENTS TO BASE
ESA - 12

Exhibit 9
Department of CommerceEconomic and Statistical Analysis Budget
Economics and Statistics Administration / Bureau of Economic AnalysisSalaries and Expenses
JUSTIFICATION OF ADJUSTMENTS TO BASE
FTE AmountADJUSTMENTS TO BASE
Full-time and part-time salariesFY 2016 ($52,223,000 x .967 x .923 x .062) 2,889,892FY 2015 ($52,223,000 x .957 x .922x .062) 2,856,909
32,984Other salariesFY 2016 ($633,000 x .967 x .923 x .062) 35,029FY 2015 ($633,000 x .957 x .922 x .062) 34,629
400
Health Insurance 165Effective January 2016 the cost of the ESA's contribution to the Federal employees' health insurance premium increased by 4.73%. Applied against the FY 2015 estimate of $3,485,000, the additional amount requested is $164,841.
Employee's Compensation Fund 22The Employee's Compensation Fund is based on the actual billing from the Department of Labor.
Rental payments to GSA 124GSA rates are projected to increase 1.5% over the FY 2015 estimate of $8,239,000 for currently occupied space.This results in an increase of $123,585.
GPO Printing 1GPO has provided an estimated rate increase of 1.6%. This percentage was applied to the 2015 estimate of $52,000 for an increase of $832.
National Archives & Records Administration 8The National Archives and Records Administration (NARA) projects storage costs will increase in price by $8,308 for ESA.
Working Capital Fund 505The amount of $63,000 to fund inflationary costs, and $442,000 to fund program changes within the Departmental Working Capital Fund.
Postage 5Effective January 26, 2014, the Governors of the Postal Service implemented a rate increase for first-class mail of 5.3%. This was applied to the FY 2014 estimate of $95,000 to arrive at an increase of $5,035.
General Pricing Level AdjustmentThis request applies a 1.6% general pricing adjustment based on OMB economic assumptions for FY 2016 to object classes where the prices that the Government pays are established through the market system. Factors are applied to the following:
Communications, utilities and miscellaneous charges (Including HCHB utility adjustments) 4Other Services / Rental Payments to Others / Transportation of things 301Supplies and materials 22Equipment 4
Total, Adjustments to Base 0 2,423
ESA - 13

Department of Commerce Exhibit 10Economic and Statistical Analysis Budget
Economics and Statistics Administration / Bureau of Economic AnalysisSalaries and Expenses
PROGRAM AND PERFORMANCE: DIRECT OBLIGATIONS(Dollar amounts in thousands)
Activity: Bureau of Economic AnalysisSubactivity: National Economic Accounts
2014 2016Actuals Estimate (Decrease)
Comparison by line item Personnel Amount Personnel Amount Personnel Amount Personnel Amount Personnel Amount
National Economic Accounts........ Pos/BA 155 32,428 159 32,730 159 33,507 171 36,884 12 3,377 FTE/Obl. 148 31,810 155 34,015 155 164 9
Direct Obligations............... Pos/BA 155 32,428 159 32,730 159 33,507 171 36,884 12 3,377 FTE/Obl. 148 31,810 155 34,015 155 164 9
Activity: Bureau of Economic AnalysisSubactivity: International Economic Accounts
2014 2016Actuals Estimate (Decrease)
Comparison by line item Personnel Amount Personnel Amount Personnel Amount Personnel Amount Personnel Amount
International Economic Accounts. Pos/BA 155 32,429 159 32,730 159 33,506 174 38,154 15 4,648 FTE/Obl. 149 31,810 155 34,015 155 166 11
Direct Obligations............... Pos/BA 155 32,429 159 32,730 159 33,506 174 38,154 15 4,648 FTE/Obl. 149 31,810 155 34,015 155 166 11
2015 Base
Base
Enacted
2015Enacted
2016
2016
2016
2016
ESA - 14
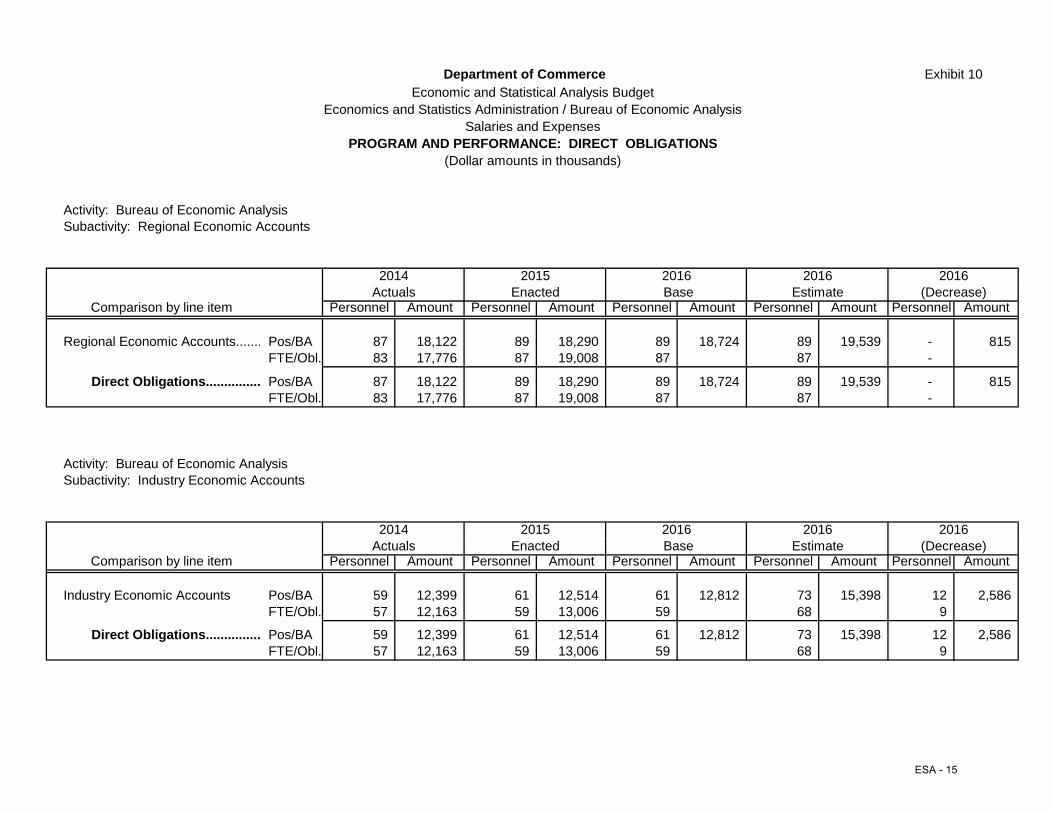
Department of Commerce Exhibit 10Economic and Statistical Analysis Budget
Economics and Statistics Administration / Bureau of Economic AnalysisSalaries and Expenses
PROGRAM AND PERFORMANCE: DIRECT OBLIGATIONS(Dollar amounts in thousands)
Activity: Bureau of Economic AnalysisSubactivity: Regional Economic Accounts
2014Actuals Estimate (Decrease)
Comparison by line item Personnel Amount Personnel Amount Personnel Amount Personnel Amount Personnel Amount
Regional Economic Accounts....... Pos/BA 87 18,122 89 18,290 89 18,724 89 19,539 - 815 FTE/Obl. 83 17,776 87 19,008 87 87 -
Direct Obligations............... Pos/BA 87 18,122 89 18,290 89 18,724 89 19,539 - 815 FTE/Obl. 83 17,776 87 19,008 87 87 -
Activity: Bureau of Economic AnalysisSubactivity: Industry Economic Accounts
2014Actuals Estimate (Decrease)
Comparison by line item Personnel Amount Personnel Amount Personnel Amount Personnel Amount Personnel Amount
Industry Economic Accounts Pos/BA 59 12,399 61 12,514 61 12,812 73 15,398 12 2,586 FTE/Obl. 57 12,163 59 13,006 59 68 9
Direct Obligations............... Pos/BA 59 12,399 61 12,514 61 12,812 73 15,398 12 2,586 FTE/Obl. 57 12,163 59 13,006 59 68 9
Base2015
Enacted
Base2015
Enacted
2016
2016 2016
20162016
2016
ESA - 15

Department of Commerce Exhibit 10Economic and Statistical Analysis Budget
Economics and Statistics Administration / Bureau of Economic AnalysisSalaries and Expenses
PROGRAM AND PERFORMANCE: DIRECT OBLIGATIONS(Dollar amounts in thousands)
Activity: Policy SupportSubactivity: Policy Support
2014Actuals Estimate (Decrease)
Comparison by line item Personnel Amount Personnel Amount Personnel Amount Personnel Amount Personnel Amount
Policy support............................... Pos/BA 14 3,622 14 3,736 14 3,874 14 3,874 - - FTE/Obl. 13 3,625 13 3,921 13 13 -
Direct Obligations............... Pos/BA 14 3,622 14 3,736 14 3,874 14 3,874 - - FTE/Obl. 13 3,625 13 3,921 13 13 -
Base2015 2016
Enacted20162016
ESA - 16

EXHIBIT 12 – 15
APPROPRIATION ACCOUNT: Economics and Statistics Administration The Economics and Statistics Administration (ESA) plays three key roles within the Department of Commerce (DOC). ESA provides timely economic analysis, disseminates national economic indicators, and oversees the U.S. Census Bureau (Census) and the Bureau of Economic Analysis (BEA). In this latter role, ESA works closely with the leadership at BEA and Census on high priority management, budget, employment, and risk management issues, integrating the work of these agencies with the priorities and requirements of DOC and other government entities. ESA’s expert economists and analysts produce in-depth reports, fact sheets, and briefings on policy issues and current economic events. DOC and White House policymakers rely on these tools, as do American businesses, state and local governments, and news organizations around the world. The mission of ESA is to provide high-quality economic analysis and foster the missions of the Census Bureau and the Bureau of Economic Analysis. BUDGET PROGRAM: Economic Policy Support For FY 2016, ESA requests $3,874,000 for Economic Policy Support. ESA requests no program increases for Policy Support in FY 2016.
PROGRAM JUSTIFICATION: Economic Policy Support
ESA provides broad and targeted economic data, analyses and forecasts for use by government and private sector needs, as well as develops policy proposals on issues affecting multiple business sectors. Data are the fuel that power the 21st century economy. Commerce Department data enable the Department to set the conditions for economic growth. It touches every American and informs daily business decisions. Commerce data enable start-ups, move markets, protect life and property, and power both small and multi-billion dollar companies. The BEA produces the Gross Domestic Product (GDP), a key indicator of the health of our economy. The Census Bureau carries out the constitutionally mandated decennial census, which determines the allocation of billions in federal
PROGRAM BUDGET PROFILE
(Dollars in thousands)
Funding Requirements by Sub-Program:
FY 2014
FY 2015
FY 2016
FY 2017
FY 2018
FY 2019
FY 2020
Economic Policy Support 3,622 3,736 3,874 3,951 4,030 4,111 4,193 Total Dollars: 3,622 3,736 3,874 3,951 4,030 4,111 4,193
Total FTEs: 13 13 13 13 13 13 13
ESA - 17

EXHIBIT 12 – 15
dollars to states and the drawing of congressional districts. Data are not only a means of advancing the trade, innovation, and environment goals; they are also a national asset with untapped potential. The Economic Policy Support efforts within ESA will work with the private sector to harness Big Data and accelerate a data-enabled economy.
The economic policy staff advises the Secretary, Deputy Secretary, Under Secretary, and other Government officials on matters related to economic developments and forecasts and the development of options and positions relating to economic policy. The staff supports the Secretary's and Under Secretary's participation in White House policy councils, in similar Administration economic policy forums, and on the Board of the Pension Benefit Guaranty Corporation. The economic policy staff analyzes domestic and international economic developments; conducts studies contributing to economic policy development; provides weekly analyses on the near-term prospects and composition of economic activity in the U.S.; produces periodic analyses of international macroeconomic issues and their implications for the U.S. economy; and maintains a tabulation of diverse economic indicators. The staff provides research on contemporary industrial performance and analyses of cross-industry effects of economic trends, proposed and current policies, and unique events such as supply interruptions, strikes, natural disasters, and threats to homeland security.
ESA’s policy staff prepares in-depth economic analysis including briefings and reports to support the Secretary of Commerce on the prevailing topics of the day. Recent report titles include:
• Fostering Innovation, Creating Jobs, Driving Better Decisions: The Value of Government Data (July 2014);
• Winning Business Investment in the U.S.( May 2014); • Digital Economy and Cross-Border Trade: The Value of Digitally-Deliverable Services (January
2014); and • Foreign Direct Investment in the U.S (October 2013).
ESA economists have also produced reports on manufacturing, broadband availability, and the economic impact of hurricane Sandy. ESA analysts have provided policy makers with current analysis on oil heat price, foreign direct investment in the United States, and pension reform. Recent briefing topics have included: Recent U.S. Export Trends and Foreign Economic Growth, and Earnings of New Hires in Manufacturing.
ESA’s policy staff provides the Secretary’s Office and other operating units within the Department with ongoing expert analysis of the economic data available and describes trends and changing conditions in the U.S. and world economy. ESA’s economists are the only group in Commerce that provides this type of economic analysis and data-based economic reporting. ESA’s economists specialize in policy analysis using the vast amount of statistical data from the Census Bureau and BEA.
ESA’s policy support cuts across the entire Department. ESA’s economists and policy analysts, under the leadership of the Under Secretary and the Chief Economist, contribute to the
ESA - 18

EXHIBIT 12 – 15
Department’s mission by providing the Secretary’s office and other operating units with the following:
• Description of trade patterns and U.S. competitiveness and advice on the evaluation of policies regarding trade promotion.
• Expert analysis of the data available that describe innovation in the economy, innovation in business, and job market environment, as well as advise on the evaluation of policies regarding the promotion of innovation and entrepreneurship, and market development and commercialization.
• Expert analysis of the data available that describe trends relating to environmental questions and the economic issues that they raise. This includes identifying business sectors that could benefit most from integrating natural capital into their operations and decision-making, and advice on the evaluation of policies regarding environmental stewardship.
• Counsel on the opportunities to use data sets effectively to promote decision-making at all levels-from governmental to individual, and reassess ways the Department’s data can add value to the public and to the economy.
SIGNIFICANT ADJUSTMENTS-TO-BASE (ATBs):
The ESA Policy Support activity’s share of the adjustments to base in FY 2016 is $138,000. The increases are attributed to the estimated pay raise of 1.3 percent as well as inflationary increases for non-labor activities, service contracts, utilities, rent, the Department’s Working Capital Fund that will be funded internally, and restoration of base. Also, the increases include $70,000 to cover ESA’s share of the additional shared service investments within the Departmental Working Capital Fund (WCF). These Departmental requirements include necessary investments in Department-wide systems, network security initiatives, and replacement of degrading Information Technology (IT) infrastructure. A full discussion of all WCF program changes is in the WCF section of the Departmental Management Congressional submission document.
ESA - 19

EXHIBIT 12 – 15
BUDGET PROGRAM: Bureau of Economic Analysis (BEA)
For FY 2016, BEA requests an increase of $13.7 million over the FY 2015 enacted level for a total of $109,975,000. This level will ensure BEA is able to preserve the timeliness, relevance, and accuracy of the nation’s economic accounts, as well as provide for two important efforts discussed below.
PROGRAM JUSTIFICATION: Bureau of Economic Analysis (BEA)
The Bureau of Economic Analysis is a principal Federal statistical agency promoting better understanding of the U.S. economy by providing timely, relevant, and accurate economic accounts data in an objective and cost-effective manner. BEA’s national, industry, regional, and international economic accounts present valuable information on key issues such as U.S. economic growth, regional economic development, inter-industry relationships, and the Nation's position in the world economy. Some of the widely used statistical measures produced by BEA include gross domestic product (GDP), personal income and outlays, corporate profits, GDP by state and by metropolitan area, balance of payments, and GDP by industry. These statistics are used by Federal, state, and local governments for budget development and projections; by the Federal Reserve for monetary policy; by the business sector for planning and investment; and by the American public to follow and understand the performance of the Nation’s economy. BEA’s strategic vision is to remain the world’s most respected producer of economic accounts.
PROGRAM BUDGET PROFILE
(Dollars in thousands)
Funding Requirements by Sub-Program:
FY 2014
FY 2015
FY 2016
FY 2017
FY 2018
FY 2019
FY 2020
National Economic Accounts 32,428 32,730 36,884
36,133
36,856
37,593
38,345
International Economic Accounts 32,429 32,730 38,154
37,429
38,178
38,942
39,721
Regional Economic Accounts 18,122 18,290 19,539
19,099
19,481
19,871
20,268
Industry Economic Accounts 12,399 12,514 15,398
15,137
15,440
15,749
16,064
Total Dollars: 95,378 96,264 109,975 107,798
109,955
112,155
114,398
Total FTEs: 437 457 486 486 486 486 486
ESA - 20

EXHIBIT 12 – 15
The objective of BEA is to promote a better understanding of the U.S. economy by providing the timeliest, most relevant, and accurate economic accounts data in an objective and cost-effective manner.
The following list describes BEA’s four economic accounts and their products. BEA conducted a thorough review of all of its programs in FY 2013, and will continue to conduct these reviews in the future to ensure relevance and efficiency. The review determined that BEA’s products support the core mission of the Agency and either feed into the development of GDP and other core accounts, are required by law, or are used to implement Federal programs.
• National Economic Accounts: GDP and related accounts are the basis for Federal budget projections and are the foundation of macroeconomic analysis;
• International Economic Accounts: Balance-of-payments data are required by the Bretton Woods Agreement and are critical to monetary, trade, investment, exchange rate, and financial policies. BEA’s direct investment programs are also required by law and are critical to understanding the impact of U.S. and foreign multinational companies on the U.S. and world economies;
• Regional Economic Accounts: Regional data are used to allocate over $300 billion in Federal funds and are the basis for virtually all states’ spending and revenue forecasts; and,
• Industry Economic Accounts: Industry data are the basis for the infrastructure for the National Income and Product Accounts and many other key government statistics, such as the Bureau of Labor Statistics’ Producer Price Index. They are also critical to industry and macroeconomic analyses.
SIGNIFICANT ADJUSTMENTS-TO-BASE (ATBs):
BEA’s share of the adjustments to base in FY 2016 is $2,285,000. The increase will fund the estimated 2016 Federal pay raise of 1.3 percent, and inflationary increases for non-labor activities, including service contracts, utilities, and rent. Also, $372,000 will cover BEA’s share of the additional shared service investments within the Departmental Working Capital Fund (WCF). These Departmental requirements include necessary investments in Department-wide systems, network security initiatives, and replacement of degrading Information Technology (IT) infrastructure. A full discussion of all WCF program changes is in the WCF section of the Departmental Management Congressional submission document.
Sub-Program Descriptions:
National Economic Accounts
This work consists of the preparation, analysis, and publication of the National Income and Product Accounts (NIPAs), the wealth accounts, and the associated government accounts.
The NIPAs, summarized by GDP, provide a comprehensive, up-to-date picture of U.S. domestic production, consumption, investment, and exports and imports as well as national and personal income and savings. The wealth accounts provide statistics on physical structures, capital equipment and software, and consumer durable goods held by businesses, governments, and others. The
ESA - 21

EXHIBIT 12 – 15
government accounts provide statistics on Federal, state, and local government transactions in a national accounts framework. Finally, now a part of GDP, statistics of investments in innovation and intangibles provide detail on research and development and health-care-related innovation and their impact on economic growth. BEA continuously modernizes and expands all of these accounts to improve their reliability, relevance, and their alignment with international guidelines.
The data produced by BEA include some of the Nation’s most important and closely-watched economic statistics, such as the GDP, the broadest measure of economic activity. GDP is used by the White House and Congress to prepare the Federal budget, by the Federal Reserve to formulate monetary policy, by Wall Street as an indicator of economic activity, and by the business community to prepare forecasts of economic performance that provide the basis for production, investment, and employment planning.
GDP is only one among many measures found in the NIPAs; measures such as personal consumption expenditures, business investment, government spending, personal income, and corporate profits help to answer questions about the sources of economic growth and the levels and composition of the incomes resulting from that growth. These data are used to inform key policy decisions made by Congress and the Administration and by businesses to help determine the right mix of investment to grow businesses and create jobs.
The National Economic Accounts program supports the Department’s objective of improving the understanding of the US economy, society and environment by providing timely, relevant, trusted and accurate data, standards and services enabling entities to make informed decisions under the strategic goals of supporting a data–enabled economy. Specifically, the objective is supported by the comprehensive view of the United States economy and the detail on U.S. production, income, consumption, investment, saving, and international trade that is provided by the NIPAs.
Statistics of investments in innovation and intangibles, produced jointly with the Industry Economic Accounts program, support the Department’s strategic goal of catalyzing Innovation and the objective of promoting competiveness of disadvantaged and distressed communities and businesses through their detailed statistics, by facilitating research into the effects of R&D and other intangibles on the economy. Analysts have long recognized the significant role played by innovation in fostering economic growth, but the detailed data to test and expand this understanding have been lacking. By providing theoretically meaningful and accurate data on intangible assets, these statistics provide a key to understanding the impact of innovation—and to using this understanding to support policies that foster economic growth and the development of new businesses.
Finally, this program supports the Operational Excellence and objective of promoting information access and transparency through technology, understanding customer requirements, and creating new data products and services, by providing economic statistics that are relevant to the needs of policymakers, business decision-makers, and academics in the most timely manner; by continuously improving those data or supplementing them with new measures as economic conditions require; and by delivering those data through various accessible media.
Additional information and products can be found at ://bea.gov/national/index.
ESA - 22

EXHIBIT 12 – 15
International Economic Accounts
This work consists of the preparation, analysis, and publication of the International Transactions Accounts (ITAs), also referred to as balance of payments accounts and International Investment Position accounts (IIPs). The ITAs provide a comprehensive and detailed view of economic transactions between the United States and other countries. Major types of transactions covered are trade in goods; trade in travel, transportation, and other private services; income from international investment; U.S. Government military and other services; private remittances; foreign aid programs; private financial flows; and changes in foreign official assets in the United States and U.S. official reserve assets. The IIPs provide statistics on the accumulated stocks of U.S.-owned assets abroad and of foreign-owned assets in the United States, as well as statistics on the value of the net international investment position of the United States. BEA continuously modernizes and expands these accounts to improve their reliability and relevance and their alignment with international guidelines.
Economic globalization has profoundly affected patterns of cross-border trade in goods and services, the size, and location of direct investment by U.S. and foreign multinational companies (MNCs), international financial flows and asset holdings, and the sources of U.S. aid to developing countries. Policymakers and other decision makers need complete, timely, and reliable data to properly assess the impact of these trends and to develop effective policies related to trade, direct investment, financial regulation, and foreign aid. The ITAs and the IIPs provide those data. The accounts shed light on, among other things, the level of the trade balance and its rate of change; on factors that influence the trade balance; on the influence the trade balance itself has on GDP and on incomes in the United States; on the impacts of recessions abroad on U.S. exports and imports; and on the composition of international investments in the United States by foreigners and in other countries by the United States.
Under the Department’s strategic goal of Trade and Investment and the objective of improving understanding of the U.S. economy, society and environment by providing timely, relevant, trusted and accurate data enabling entities to make informed decisions, the International Economic Accounts support a comprehensive view of the position and performance of the United States within the global trade community. This program also contributes to the BEA objective to prepare and continuously improve timely and accurate international statistics to track the performance of the U.S. economy. These accounts provide detail on the relative strength of the United States with respect to trade and international investment, as well as on the value of U.S. international assets and liabilities and direct investment by multinational companies. Additionally, the data on direct investment are the most detailed data set on the operations of multinational companies available.
The international statistics provide the foundation for businesses and policymakers to make decisions that will improve the global competitiveness of the United States. BEA’s objective of preparing and continuously improving timely and accurate international statistics to foster U.S. trade is also served by this program.
Finally, this program supports the Department’s Operational Excellence strategic goal and objective of promoting information access and transparency through technology, understanding customer requirements, and creating new data products and services that deliver added value by providing economic statistics that are relevant to the needs of policymakers, business decision-makers, and academics. These data are provided in the timeliest manner, continuously improved
ESA - 23

EXHIBIT 12 – 15
and supplemented with new measures as economic conditions require. The International Economic Accounts deliver data through various accessible media.
Additional information and products can be found at ://bea.gov/international/index.
Regional Economic Accounts
This work consists of the preparation, analysis, and publication of economic accounts that show detail on economic activity by region, state, metropolitan area, and county. The accounts include estimates of gross domestic product (GDP) by state and of personal income by state and local area. These regional statistics are consistent with those statistics in the Bureau’s national economic accounts. BEA also prepares regional economic multipliers for other geographies defined by our users. BEA continuously modernizes and expands these accounts to improve their reliability and relevance. The statistics on gross domestic product by state, on state and local area personal income, and their accompanying detail provide a consistent framework for analyzing and comparing state and local area economies and meeting these objectives.
The regional statistics on gross domestic product by state and metropolitan area and on state and local area personal income are critical in federal government spending decisions: They are used to distribute over $300 billion in federal funds to states. Twenty states have set constitutional or statutory limits on state government revenues or spending that are tied to BEA’s state personal income statistics and related components. Additionally, the data are used by academics and businesses, trade organizations, and labor organizations for area-specific market research.
Under the Department’s Data strategic goal, the Regional Economic Accounts support the objective of improving the understanding of the U.S. economy, society, and environment by providing timely, relevant, trusted and accurate data, standards and services. The Regional Economic Accounts also support the BEA provision of timely and accurate detail on the state, regional, and metropolitan geographic distribution of U.S. economic activity and growth.
The Regional Economic Accounts provide the details to business and communities that allow them to make informed business decisions and to identify issues and opportunities associated with their efforts to develop markets.
This program also supports the Department’s Operational Excellence strategic goal and objective of promoting information access and transparency through technology, understanding customer requirements, and creating new data products and services. The Regional Economic Accounts engage in research to continuously improve its statistics or supplement its statistics with new measures as economic conditions require. It provides statistics in a timely manner, and uses cutting edge technology to provide its statistics in a variety of user-friendly formats, including interactive maps, charts, and graphs as well as interactive tables and input-output multipliers customized to individual customer needs that can be ordered online.
Additional information and products can be found at ://bea.gov/regional/index.
ESA - 24

EXHIBIT 12 – 15
Industry Economic Accounts
The Industry Economic Accounts, presented both in an input-output accounting framework and as a time series, provide a detailed view of the interrelationships between U.S. producers and users of goods and services, and the contribution to production across industries. Specifically, the benchmark input-output (I-O) accounts show the flow of goods and services from each industry to other industries and to final users in the economy and the income originating in them, and the annual input-output (I-O) accounts provide a time series of detailed, consistent information on these flows. The GDP-by-industry accounts include estimates of value added by industry-a measure of the contribution of each private industry and of government to the Nation’s GDP. These accounts can be used to examine changes in the structure of the U.S. economy and the importance of an industry and its contribution to GDP. The Travel and Tourism Satellite Accounts present a detailed picture of travel and tourism activity and its role in the U.S. economy. These accounts present estimates of expenditures by tourists, or visitors, on 24 types of goods and services. The capital flow table shows the destination of the new capital investment in equipment, software, and structures by the industries that purchase or lease these capital goods and services. BEA continuously modernizes and expands these accounts to improve their reliability, relevance, and their alignment with international guidelines.
The Industry Accounts data are used extensively by policymakers, businesses, and academics to understand industry interactions and the sources and trends of productivity in the United States, as well as the changing structure of the U.S. economy. The Input-Output (I-O) tables allow researchers to analyze the economic effects of specific events. For example, they can be used in emergency planning and in estimating the economic effects of natural disasters and strikes. Businesses use I-O data to develop forecasting models, which estimate future earnings, among other things, and help guide critical investment decisions. The accounts are also used by other statistical agencies as a framework for preparing further economic statistics: the I-O accounts provide the detail that is essential in determining quantity weights for price indexes, such as the producer price indexes produced by the Bureau of Labor Statistics.
BEA also uses the benchmark I-O accounts as a source of data. In fact, the I-O accounts, which are released at approximately 5-year intervals and are based on the most comprehensive source data available, are the most important statistical source for the comprehensive revision of the NIPAs. They are used to establish the benchmark levels for consumer spending and private equipment and for software investment, and to provide information on the composition of final demand, providing the basis for the estimates of GDP for the non-benchmark years.
The Industry Economic Accounts program supports the Department’s objective of improving the understanding of the US economy, society and environment by providing timely, relevant, trusted and accurate data, standards and services enabling entities to make informed decisions under the Data strategic goal. This program contributes to this objective, as well as to the BEA objective to prepare and continuously improve timely and accurate industry statistics to track the performance of the U.S. economy. The Industry Economic Accounts provide the most in-depth statistics available on the production processes underlying detailed goods and services as well as the detailed relationships between industries in the United States.
Statistics of investments in innovation and intangibles, produced jointly with the National Economic Accounts program, support the Department’s Innovation strategic goal and objective of promoting competiveness of disadvantaged and distressed communities and businesses through their detailed statistics, designed to facilitate research into the effects of R&D and other intangibles on the economy.
ESA - 25

EXHIBIT 12 – 15
This program also supports the Departmental theme of Operational Excellence and objective of promoting information access and transparency through technology, understanding customer requirements, and creating new data products and services, by providing these economic statistics in a timely manner by continuously improving those data or supplementing them with new measures as economic conditions require, and by delivering those data through various accessible media.
Additional information and products can be found at ://bea.gov/industry/index.
PROGRAM CHANGE:
BIG DATA FOR SMALL BUSINESS ($1.9M / 9 FTE)
Small businesses are a critical element of the overall economy and are often at the leading edge of risk-taking, entrepreneurship, and economic growth. Yet, unlike large corporations who have staffs of economists, advisors, and consultants to assist in interpreting and understanding the economy and guiding investments, small businesses largely depend on limited publicly-available data.
Recognizing this, and the Department’s role in supporting small business growth and decision-making, as well as the need for more insight into the health of the small business sector, BEA proposes a new suite of small business data products. To inform policy, as well as Main Street decision-making, BEA proposes to expand data on small business by developing a Small Business Satellite Account including a new Small Business GDP to track the overall growth and health of America’s small business sector. This will be a key new measure, offering insight into the leading edge of the economy, as small businesses are often the first to react to growth or contraction in their sectors or regions, often reacting to changes in policy before larger corporations. Gaining such insight will also fulfill a key lesson learned from the 2008 financial crisis in terms of expanding the granularity of data on business activity.
In addition to the new Small Business GDP measure, the small business satellite account will present new data on the distribution of small businesses by size of employment and sales; legal form of business, taxes, and net income; by industry; and by region of the country. This data will provide meaningful descriptions and the ability to understand trends over time regarding the changes in composition, industry, and geography of the small business sector. In addition to supporting good public policy at the national level, these data will also be of substantial value to state and local government as well as business development officials in understanding their regional economic dynamics.
Coupled with BEA’s other products, such as GDP by State and Real State Personal Income, these new statistics will represent a wealth of new information to guide small business growth and policy. Beyond the public policy arena, expanding the Department’s data offerings to this essential constituency will only further enhance the ability of America’s entrepreneurs to innovate, grow, and lead successful businesses.
There are no risks to the development and production of new data, and particularly not as it relates to a new satellite account focusing on small businesses. In this case, particularly given that no new data
ESA - 26

EXHIBIT 12 – 15
collection is proposed (the new account will be built from existing, primarily administrative, data), and thus no additional burden will be placed on businesses to develop the necessary data.
The opportunities presented by this proposal are considerable given the well-defined record of accomplishment of accurate, reliable, official statistical data providing the knowledge basis for economic growth as well as smart decisions in the public policy sector.
Further, the benefit of this initiative to the Department goes to the heart of the Department’s role in economic policy – the Department is the primary source of actionable statistics on the state of the economy. Along with the daily provision of weather information, the weekly issuance of economic indicators is one of the Department’s most important and visible functions. Expanding the Department’s data offerings to such an important constituency is a highly valuable proposition for both the Department as well as policy and business sectors.
The risk of not pursuing this proposal is perpetuating the continued lack of direct knowledge of the economic health of the small business sector and what that sector can tell us about the health of the overall economy. There is a clear need and desire for this information, as demonstrated by multiple efforts over the years by SBA and various trade associations to develop similar data sets. BEA is uniquely suited to develop this data set given its role as the custodian of the nation’s economic accounts. Further, data on small businesses published by BEA will have the official imprimatur of BEA as well as the full, symmetric, and broad access to the data that is true for all BEA data products.
Also of importance is that, as a BEA data set, the Small Business Satellite Account will provide data in a consistent times series, as well as in a format and methodology consistent with all of BEA’s accounts thus allowing expanded analysis in full context.
Given the role and importance of small businesses in economic growth and recovery, the addition of new and better information to assist small business decision-making and investment will only serve to support small business success. This is an outstanding opportunity for the Department to expand its service offering to this critical constituency.
Costs are largely personnel in nature, with a $500k expected expenditure on data purchase.
ESA - 27

EXHIBIT 12 – 15
Targets without increase FY
2016 FY
2017 FY
2018 FY
2019 FY
2020 Score on Customer Satisfaction Survey
Greater than 4.0
Greater than 4.0
Greater than 4.0
Greater than 4.0
Greater than 4.0
Complete all Major Strategic Plan milestones related to improving the economic accounts
Successfully complete related milestones
Targets with increase FY
2016 FY
2017 FY
2018 FY
2019 FY
2020 Score on Customer Satisfaction Survey
Greater than 4.0
Greater than 4.1
Greater than 4.1
Greater than 4.1
Greater than 4.1
Complete all Major Strategic Plan milestones related to improving the economic accounts
Successfully complete additional milestones specifically tied to initiative goals
Statement of Need and Economic Benefits
The additional economic statistics resulting from the implementation of this proposal will provide policy makers, the Administration, and the Department of Commerce with key information to assess the economic health and capacity of the small business sector to engage in economic activity. Small businesses comprise a large portion of the business sector in the U.S. and are often the leading edge of economic growth and contraction; yet no current Federal statistical programs exist to provide a complete picture of the small business sector. While some features of the sector are measured in varying ways, this proposal will pull them together into a concise picture, allowing policy makers and business leaders to assess and anticipate small business economic capacity and respond accordingly.
Specific economic benefits of this investment:
• As has been demonstrated repeatedly since the introduction of regular, consistent, public-sector economic data in the 1930s, detailed and quality economic statistics contribute significantly to the overall stability of the economy, which itself contributes to economic growth.
Specific cost savings:
• While this proposal will not result in cost savings to BEA, it will result in significantly improved economic statistics. These improved and expanded statistics will provide the right information to develop policies and affect business investments that will improve U.S. competitiveness and create new jobs.
ESA - 28

EXHIBIT 12 – 15
Possible return on investment:
• The return on investment to the Bureau, and the nation, is significant, as this initiative will serve to fill notable existing gaps in official government statistics and will provide highly valuable new detail on the small business sector, its composition, employment, and growth by region and industry. Of great value to economic policy makers, this new data will also be of high value to the business community, in particular small businesses. Major corporations have staffs of economists, advisors, and consultants assisting in interpreting and understanding the economy and guiding investments – small businesses do not.
• Better statistics allow policies to be more accurately calibrated and optimized by permitting a
more accurate assessment of their costs and benefits. The potential gains from this initiative will certainly far exceed the relatively small cost.
Schedule and Milestones:
FY16: Research and develop methodology; conduct outreach to stakeholders to gain additional information; and expand collaboration with other Federal agency stakeholders.
FY17: Publish methodology papers and develop initial estimates; present and secure endorsement of methodology and initial estimates from BEA Advisory Committee
FY18: Publish prototype satellite account
FY19: Publish official data series
Deliverables:
Papers, prototype data series and final official data series published on an annual basis.
ESA - 29

EXHIBIT 12 – 15
PROGRAM CHANGE PERSONNEL DETAIL
(Actual Dollars)
Budget Program: Bureau of Economic Analysis Sub-program: National Economic Accounts Program Change: Big Data for Small Business
Title Band Interval NumberAnnual Salary Total Salary
Senior Economist V 1 1 152,087 152,087Senior Economist IV 1 2 128,575 257,150Economist III 1 3 87,411 262,233Economist II 1 4 64,633 258,532IT Specialist III 1 2 92,802 185,604
Total 12 1,115,606Less Lapse (3) (278,902)Total Full-time permanent (FTE) 9 836,704
2015 Pay Adjustment (1.0%) 8,3672016 Pay Adjustment (1.3%) 10,986Total 856,057
Personnel Data
Full-time Equivalent Employment:Full-time permanent 9Other than full-time permanent 0
Total 9
Authorized Positions:Full-time permanent 12Other than full-time permanent 0
ESA - 30

EXHIBIT 12 – 15
PROGRAM CHANGE DETAIL BY OBJECT CLASS
(Dollars in Thousands)
Budget Program: Bureau of Economic Analysis Sub-program: National Economic Accounts Program Change: Big Data for Small Business
FY 2016 FY 2016Object Class Increase Total Program
11.0 Personnel compensation11.1 Full-time permanent 856 85611.3 Other than full-time permanent 0 011.5 Other personnel compensation 0 011.8 Special personnel services payments 0 011.9 Total personnel compensation 856 85612.0 Civilian personnel benefits 242 24213.0 Benefits for former personnel 0 021.0 Travel and transportation of persons 9 922.0 Transportation of things 0 023.1 Rental payments to GSA 0 023.2 Rental Payments to others 0 023.3 Communications, utilities and miscellaneous charges 7 724.0 Printing and reproduction 0 025.1 Advisory and assistance services 0 025.2 Other services 58 5825.3 Purchases of goods & services from Gov't accounts 582 58225.4 Operation and maintenance of facilities 0 025.5 Research and development contracts 0 025.6 Medical care 0 025.7 Operation and maintenance of equipment 0 025.8 Subsistence and support of persons 0 026.0 Supplies and materials 39 3931.0 Equipment 125 12599.0 Total obligations 1,918 1,918
ESA - 31

EXHIBIT 12 – 15
PROGRAM CHANGE:
Energy Satellite Account ($2.0M / 9 FTE)
The energy sector in the U.S. is one of the most dynamic, quickly evolving and fastest growing sectors in our economy, as well as one that is a key input to nearly all other sectors. Currently, BEA’s GDP accounts provide a comprehensive, macroeconomic view of national industry-level data on the U.S. energy sector. And while these accounts are well-suited for studying broad macroeconomic trends, they are not ideal for detailed cross-sectional or time-series analysis on the production or use of energy. Given the dynamic nature of this sector, and its importance to manufacturing, trade, attracting inward investment and the environment, this information gap can no longer be permitted. BEA proposes to address this gap with the development of an energy satellite account that will provide insight into the changing structure of energy supply and consumption in the United States, as well as the impacts of economic growth and inflation. This new satellite account will focus attention on:
national and regional energy production in the United States, the use of energy goods and services by consumers and businesses in the United States, energy prices, U.S. investments in direct and indirect energy-related technology and infrastructure, and global and domestic supply chains for energy goods and services.
The proposed energy satellite account will use existing data available within BEA’s Industry, National, International, and Regional Accounts to detail the linkages of directly- and indirectly-related industries that are critical to the energy sector, including specialized manufacturing and mining for oil, gas, and other minerals. With that as a foundation, the account will provide insight on industries’ uses of energy, downstream uses of energy-intensive products, and critically, impacts of price fluctuations on production. Further, and building on BEA’s unique expertise, the account will include inflation-adjusted measures of industry outputs, inputs, and value added, including the energy sector’s contribution to overall GDP growth and price change. Finally, it will provide measures to evaluate the impacts of energy-related structural changes in the U.S. economy including effects on national and regional levels of employment, occupational distributions, domestic energy use, demand for raw materials, high-technology and innovative capital investments, and international trade flows for energy goods and services.
The statistics included in this account will be invaluable for informing business and public policy decision-making on a variety of major issues, including innovation, taxation, international trade and investment, and the environment. In short, the energy sector fuels the economy, and thus our need to understand and observe its dynamics cannot be understated. There are no risks to the development and production of new data, particularly not as it relates to a new satellite account focusing on energy. In this case, given that no new data collection is proposed (i.e., the new account will be built from existing data), businesses will face no additional burden, yet will benefit from the value of insightful new information.
The opportunities presented by this proposal are considerable given BEA’s record of performance producing the nation’s official statistical data. Among the many benefits of this proposed satellite account, or energy data toolkit, is the ability for public and private sector analysts to build upon it as a foundation to facilitate environmental and economic impact analysis on topics ranging from globally-supplied energy products, emissions, and other shifts in the U.S. industrial and consumer landscape,
ESA - 32

EXHIBIT 12 – 15
including shifts in motor-vehicle technology, electricity-delivery infrastructure, and consumer purchasing behavior.
This proposal benefits the Department and speaks directly to the objectives of the Open for Business Strategic Plan, in particular objectives 4.1, 4.2 and 4.3. With respect to these objectives, the Department is the primary source of actionable data and official statistics on the state of the economy. Along with the daily provision of weather information, the weekly issuance of economic indicators is one of the Department’s most important and visible functions. The energy satellite account will equip businesses, community leaders and government policymakers with new and insightful data to inform decisions across public and private programs and investments (4.2). Moreover, satellite accounts have a proven record of accomplishment of making complex and obscure data more accessible and usable (4.1). As the downtown inlay is to a map, the satellite account is to a key sector of the economy, a focused, clear view of a critical sector. Given the dynamic characteristics of the energy sector, this sector more than any other must remain a focus to meet the ever-changing needs of data customers (4.3). This proposal is not only applicable to the Department’s data agenda, however, as environmental objectives 3.1 and 3.5 are also advanced by this proposal, as would objectives related to trade and innovation. The risk of not pursuing this proposal is perpetuating a continued lack of direct knowledge of the economic impact of energy, and what the sector can tell us about the health of the overall economy. BEA is well suited to develop this data set given its role as the custodian of the nation’s economic accounts. Data on energy published by BEA will have the official imprimatur of BEA, as well as the full, symmetric, and public access that is true for all BEA data products. As a BEA product, the energy satellite account will provide data in a format and methodology that is consistent with all of BEA’s accounts.
Given the importance of energy to the U.S. economy, the addition of new and improved information will assist decision-making at multiple levels. This is an outstanding opportunity for the Department to expand its portfolio of data offerings. Costs are largely personnel in nature. Additional expected expenditures include $200K for data purchases, $125K for contracting with research economists who are experts in the area of energy supply chains and new-energy technologies for feasibility and other studies, and $125K for upgrades to, and maintenance for, statistical production systems. Over the last several years, BEA has embarked on a limited expansion of energy goods and services detail in the U.S. GDP and Industry Accounts. The successful outcomes underscore the merits of this proposal. For example, BEA’s “KLEMS” (K-capital, L-labor, E-energy, M-materials, and S-purchased services) statistics—which provided a modest expansion of energy detail in the accounts—have subsequently been incorporated into the official U.S. productivity statistics prepared by the Department of Labor’s Bureau of Labor Statistics. Limited new detail was also introduced in the U.S. benchmark account for 2007 to identify electric-utility generation by fuel source.
In addition, BEA has a long track record of successfully developing satellite accounts that provide a granular view of macroeconomic dynamics. Given its role in the federal statistical system, its traditions of transparent methodology, and its considerable access to leading private and academic sector voices on the topic, BEA is uniquely suited to accomplishing this task.
ESA - 33

EXHIBIT 12 – 15
Targets without increase FY
2016 FY
2017 FY
2018 FY
2019 FY
2020 Score on Customer Satisfaction Survey
Greater than 4.0
Greater than 4.0
Greater than 4.0
Greater than 4.0
Greater than 4.0
Complete all Major Strategic Plan milestones related to improving the economic accounts
Successfully complete related milestones
Targets with increase FY
2016 FY
2017 FY
2018 FY
2019 FY
2020 Score on Customer Satisfaction Survey
Greater than 4.0
Greater than 4.1
Greater than 4.1
Greater than 4.1
Greater than 4.1
Complete all Major Strategic Plan milestones related to improving the economic accounts
Successfully complete additional milestones specifically tied to initiative goals
Because BEA is the sole producer of official U.S. national account statistics, there are no alternative means to producing expanded energy statistics that are consistent with measures of U.S. GDP and the other official industry, international, and regional statistics that BEA produces. This comparability is the key value of these data, as it allows for cross tabulation with other industry and regional data, without which the data are of limited value.
BEA has and will continue to explore collaborative partnerships with the Energy Information Administration (EIA), the Census Bureau, and the Bureau of Labor Statistics (BLS) as both subject matter experts as well as producers of key source material to develop the necessary methodologies to expand the energy-related statistics. These expanded statistics would provide more accurate, comprehensive, and integrated measures for the energy sector and would link macroeconomic statistics for the United States with micro-analysis on energy supply, consumption, and prices within industries. Finally, more detailed energy-related information by industry and energy use would allow BEA data to be directly linked to existing EIA and Environmental Protection Agency (EPA) information on emissions—a key requirement for environmental and economic impact analysis (Open for Business Objective 3.5).
Although there are no direct measurable long-term savings of this program change, expanded energy accounts would improve the accuracy of existing federal energy usage forecasts, along with the accuracy of quarterly measures of consumer spending and investment on energy-related goods and services in the U.S. GDP accounts. Over the years multiple efforts have been made, both within and external to government, but none have led to the development of expanded energy measures consistent with U.S. GDP and BEA’s official economic statistics. However, given the central role of energy in the U.S. economy, there is clear evidence of the need for more granular data related to energy.
ESA - 34

EXHIBIT 12 – 15
BEA would supply the baseline energy satellite account and would provide analysis to develop linkages between economic statistics, such as production and income, to emissions. This information could then be used by BEA or other agencies and researchers to translate these measures into comprehensive “damage” functions that account for the full environmental cost of global industrial and trade policy.
Statement of Need and Economic Benefits
Prices of commodities, such as energy, have a direct impact on the performance of the economy and can often be quite volatile, with measurable impacts across nearly all industry sectors and consumers. Historically, run-ups in world commodity prices have dramatically affected U.S. living standards, production methods, and overall economic performance. Unfortunately, the current official U.S. economic accounts contain limited type-of-energy detail, meaning that valuable information on the impact of price volatility and energy usage by industry is unavailable to policy makers.
The need for the data is pressing. Since 2000, consumer spending on energy products has doubled, reaching nearly $635 billion in 2013. Prices paid by domestic consumers for energy accounted for about 9 percent of average yearly inflation since 2000, nearly three times that of the previous decade, and second only to health care and housing costs. In 2012, domestic industries spent over 50 percent more on energy products than they did in 2000. The air transportation industry, for example, more than doubled its spending on energy over the period, with that increase in cost rippling through its production cycle, and throughout the many industries which depend on air transport. More recently, however, mining exploration for oil and gas extraction and other minerals, and petroleum refining and downstream industries have been important contributors to the ongoing recovery of the U.S. economy, based in part, on relative pricing advantages due to new technologies such as hydraulic fracking and horizontal drilling, and on strong growth in export markets. Most projections—such as those by the EIA and the Government Accountability Office—suggest that energy costs, the heightened need for energy security, and the advent of new energy technologies will likely continue, making energy a key economic policy issue for the coming decade.
Specific economic benefits of this investment:
More accurate, detailed and integrated measures for the energy sector are critical for understanding U.S. competitiveness and the prospects for future economic growth. For example, integrating EIA volume and price data on physical units and linking these statistics with the U.S. GDP and Industry accounts will provide a more complete analysis on energy commodities. Such data are essential for developing a comprehensive U.S. energy policy built on accurate forecasts of energy supply and consumption. These statistics are also required by policymakers and industry leaders for assessing alternative energy options and for identifying infrastructure enhancements, such as new information technology and key capital investments, which will improve the domestic supply chain for energy goods and services.
This initiative will lead directly to an enhancement in the accuracy, and expansion, of energy statistics for the U.S. economy. Funds provided by this initiative will allow BEA to address critical new developments in production, supply, and consumption of energy goods and services, including new renewable energy and high-technology capital investments made by businesses to promote energy efficiency and a reduced carbon footprint. This initiative will also provide more timely and relevant statistics to BEA’s entire range of customers.
ESA - 35

EXHIBIT 12 – 15
Specific cost savings:
While this proposal will not result in specific cost savings to BEA, it will result in significantly improved economic statistics. These improved and expanded statistics will provide the necessary information to develop policies and affect business investments that will improve U.S. competitiveness and create new jobs.
Possible return on investment:
Investments in enhancements to BEA data can generate significant returns. Undertaking this initiative could introduce a five-fold expansion of energy goods and services highlighted in the U.S. GDP, industry, regional and international accounts. Such an expansion could provide additional specificity on upwards of $800 billion of business investment purchases in energy infrastructure and high-technology equipment that is currently captured in broad expenditure categories. Such information is critical for businesses in assessing investment decisions, for creating jobs, and for deciding where to locate new production facilities—in the United States or overseas. Moreover, an Energy Satellite Account establishes a robust framework for environmental impact analysis by establishing a mechanism to link energy supply and demand with carbon emissions, enhancing the ability to evaluate the carbon footprint of the global supply chain for energy goods and services.
Schedule and Milestones:
• FY16: Begin research to link EIA micro-data on energy prices and production with BEA statistics on energy supply and consumption within the framework of the U.S. GDP and Industry Accounts. Develop a preliminary estimation methodology and information-technology infrastructure for the energy satellite account, based on the benchmark input-output account—the first place that changes in the industrial structure of the U.S. economy are introduced in the U.S. GDP Accounts.
• FY17: Finalize the core structure of expanded energy industries and commodities to
incorporate into BEA’s national, industry-level energy satellite account. Construct preliminary estimates on energy production, capital investments, international trade flows and national and regional consumption—for example, by providing inflation-adjusted outputs, inputs, and the value added created by the U.S. energy supply chain.
• FY18: Release a prototype energy satellite account including expanded industry, national,
regional and international statistics that incorporate expanded detail on the changing structure of the energy sector. Vet prototype statistics with key stakeholders such as BEA’s Advisory Committee.
• FY19: Introduce an energy satellite account that highlights specific energy-related goods and
services in the U.S. economy as well as exports and imports of energy goods and services, including new technologies and renewable energy.
Deliverables:
• Expanded commodity detail. Much of the potential expansion of Industry Input-Output Accounts depends on evaluating the quality of working-level commodity data. Starting
ESA - 36

EXHIBIT 12 – 15
with a list of energy-related commodities from the most recent Input-Output Account (2007), BEA will work collaboratively with Census and EIA to expand currently available categories of these data that will be most useful to energy-account data users.
• Expanded price information. BEA and EIA will reconcile conceptual and statistical
differences between dollar-denominated aggregates and physical-volume-based aggregates. BEA will explain “chained-dollar” methodology while learning more about EIA's price data and their applicability to constructing commodity price indexes for energy-related commodities and aggregates.
• Expanded international trade flows of energy-related commodities. The Industry framework tracks the imports and exports of energy-related commodities, their impact on U.S. supply, consumption and business investment. BEA, in collaboration with Census and EIA, will review the working-level data on trade flows from the most recent Benchmark Account to determine if data can be expanded.
• Publish detailed statistics on an energy sector satellite account. Prepare data tables and
reports highlighting production, consumption, and investment-related activities of the U.S. energy sector and track how the sector interacts with and contributes to the broader U.S. economy.
• Expanded U.S. asset boundary to include non-produced mineral and energy
resources. BEA will research and develop measures of the economic value of the stock of mineral and energy resources owned by businesses and governments in the United States in order to improve its measures of U.S. wealth. This work will be done in collaboration with the Federal Reserve Board (FRB) and consistent with the BEA-FRB integrated macroeconomic accounts.
• Expanded oil and gas exploration information. BEA will separate spending on oil and gas
exploration from spending on mining-related structures in order to better capture the value of capital investments of energy-related exploration activity.
• Expanded measures of energy’s impact on the sources of U.S. economic growth and
productivity. BEA will research and develop measures on energy-related industries and their sources of growth and productivity, and will identify the contribution of innovation in the energy sector and its impact on U.S. economic growth. This work will be done within a framework that is consistent with the BEA-BLS integrated GDP & Productivity account at the industry level.
ESA - 37

EXHIBIT 12 – 15
PROGRAM CHANGE PERSONNEL DETAIL
(Actual Dollars)
Budget Program: Bureau of Economic Analysis Sub-program: Industry Accounts Program Change: Energy Satellite Account
Title Band Interval NumberAnnual Salary Total Salary
Senior Economist V 3 1 157,100 157,100Senior Economist IV 3 3 138,136 414,408Economist III 3 4 98,305 393,220Economist II 3 3 74,654 223,962IT Specialist III 3 1 98,305 98,305
Total 12 1,286,995Less Lapse (3) (321,749)Total Full-time permanent (FTE) 9 965,246
2015 Pay Adjustment (1.0%) 9,6522016 Pay Adjustment (1.3%) 12,674Total 987,572
Personnel Data
Full-time Equivalent Employment:Full-time permanent 9Other than full-time permanent 0
Total 9
Authorized Positions:Full-time permanent 12Other than full-time permanent 0
ESA - 38

EXHIBIT 12 – 15
PROGRAM CHANGE DETAIL BY OBJECT CLASS
(Dollars in Thousands)
Budget Program: Bureau of Economic Analysis Sub-program: Industry Accounts Program Change: Energy Satellite Account
FY 2016 FY 2016Object Class Increase Total Program
11.0 Personnel compensation11.1 Full-time permanent 988 98811.3 Other than full-time permanent 0 011.5 Other personnel compensation 0 011.8 Special personnel services payments 0 011.9 Total personnel compensation 988 98812.0 Civilian personnel benefits 283 28313.0 Benefits for former personnel 0 021.0 Travel and transportation of persons 9 922.0 Transportation of things 0 023.1 Rental payments to GSA 0 023.2 Rental Payments to others 0 023.3 Communications, utilities and miscellaneous charges 7 724.0 Printing and reproduction 0 025.1 Advisory and assistance services 0 025.2 Other services 250 25025.3 Purchases of goods & services from Gov't accounts 330 33025.4 Operation and maintenance of facilities 0 025.5 Research and development contracts 0 025.6 Medical care 0 025.7 Operation and maintenance of equipment 0 025.8 Subsistence and support of persons 0 026.0 Supplies and materials 38 3831.0 Equipment 123 12399.0 Total obligations 2,028 2,028
ESA - 39

EXHIBIT 12 – 15
PROGRAM CHANGE:
Services Trade Initiative ($3.2M / 11 FTE)
Growth in services exports is increasingly important to the U.S. economy and the trade balance. Exports of services represented 30% of total U.S. exports and led to a $229 billion surplus in services trade in 2013. Given the importance of trade in services, there are improvements that can and should be made in the measurement of traded services. BEA proposes to expand the level of detail it publishes on key traded services such as R&D, the distribution and use of intellectual property products, financial services, medical services, environmental services, computer and information services, travel-related services, personal, cultural, and recreational services, and transport services. In addition, BEA will explore the feasibility of publishing information on services associated with global supply chains, such as contract manufacturing services, and information on services enabled by information and communications technology, or ICT-enabled services. Enhancing information available on U.S. trade in services will highlight trade with countries in support of our trade promotion and trade agreement efforts and shed light on expanding trade in high value services categories (e.g., research and development, intellectual property, medical, environmental, and information technology services) that are target areas for future growth in service exports and related high value employment.
BEA will expand measurement of trade in services by:
• Providing more detail in categories of traded services. New service categories include some of the most dynamic industries with high value jobs including research and development, intellectual property, financial services, and information technology services.
• Introducing new information regarding the mode of delivery and determine if services are delivered through the use of information and communications technology or in person.
• Providing more frequent data on traded services. BEA will publish additional detail on traded services on a quarterly rather than only an annual basis.
• Providing expanded geographic detail (to such countries as Ireland, Spain and Switzerland) regarding the destination of U.S. service exports and the source of U.S. service imports.
• Updating the coverage of its surveys to ensure that coverage is keeping pace with the growing population of U.S. globally engaged businesses.
• Continuing to improve survey design to obtain accurate and timely responses with minimal respondent burden.
• Making the data more accessible through web-based interactive tables.
ESA - 40

EXHIBIT 12 – 15
There are no risks to the development and production of new data, particularly not as it relates to new expanded data on high value traded services. In this case, given that no new data collection is proposed (the detail will be collected from improving existing survey coverage), minimal burden will be placed on businesses to develop the necessary data.
The opportunities presented by this proposal are considerable. More detailed data on trade in services would provide U.S. businesses, trade negotiators, state and local economic planners and developers, staff of the International Trade Administration, and other policy analysts with critical information to understand and develop policies to promote export opportunities in services. By improving the geographic coverage and detail of data related to trade in services, this initiative will help identify overseas markets with increased potential for U.S. service exports. Data developed through these efforts will be particularly valuable in negotiating pending trade agreements and evaluating the impact of recently signed trade agreements. For example, the export of information technology services can raise questions of intellectual property protection in countries where computer servers are physically located. Providing trade negotiators and policymakers focused on trade promotion with information regarding the destination and mode of exports of information technology services may help identify and settle terms beneficial to U.S. businesses. Knowing where and how to focus trade negotiations promotes the protection of U.S. assets such as intellectual property without impeding the export of services.
This initiative will also provide greater detail related to imports of services, which are of particular interest to policymakers focused on promoting insourcing, or the relocation of business processes from overseas back to the United States. As BEA collects more detailed data on what kinds of services are being imported by U.S. companies, policymakers can use this information to tailor policies aimed at making the U.S. service sectors more attractive, which in turn encourages insourcing and the creation of jobs for U.S. workers.
This initiative speaks directly to the Secretary’s goal of expanding the U.S. economy through increased exports and inward foreign investment that will lead to more and better jobs. Additional trade detail for key traded services will give new insight into American competitiveness, trade promotion, and market development. The risk of not pursuing this proposal is perpetuating the continued lack of direct knowledge of the economic impact of traded services, as well as the growing importance of trade to the overall health of the U.S. economy. There is a clear and growing need for this information, as demonstrated by the heightened attention paid to international trade issues. BEA is uniquely suited to develop this data set given its role as the custodian of the nation’s economic accounts. Expanded data on traded services published by BEA will have the official imprimatur of BEA as well as the full, symmetric, and public access to the data that is true for all BEA data products.
Given the role of traded services to the trade balance and the U.S. economy, the addition of new and better information will assist decision-making at multiple levels. This is an outstanding opportunity for
ESA - 41

EXHIBIT 12 – 15
the Department to act on its strategic objectives of expanding its portfolio of data offerings that help U.S. businesses and policymakers better understand the growing importance of exporting to the U.S. economy, specifically in the area of key traded services. Costs are largely personnel in nature. Additional expenditures include $500,000 for data purchases, $400,000 for contracting with research economists, and $350,000 for statistical production system upgrades/maintenance. BEA currently reports service trade statistics for 38 countries and country groups on a quarterly basis. If fully funded, BEA will report exports and imports of services for at least 55 countries and country groups on a quarterly basis in all reporting categories. The additional countries include those that BEA currently publishes on an annual basis, Free Trade Agreement countries not already published, and other countries of interest including Russia, Colombia, CAFTA-DR (Dominican Republic-Central America Free Trade Agreement), Jordan, Morocco, Nicaragua, Panama, Peru, and Vietnam (see table below for a full list of potential additional countries and country groups). This initiative will also allow BEA to develop new and improved methods for estimating trade in more categories of services for the expanded list of countries.
Potential Additional Countries/ Country Groups
Ireland New Zealand Spain Philippines Norway Thailand Russia Bahrain Switzerland Israel Chile Jordan Columbia Oman Panama Saudi Arabia Peru Morocco Bermuda Nigeria Indonesia Trans-Pacific Partnership Malaysia CAFTA-DR
ESA - 42

EXHIBIT 12 – 15
The performance impact of the proposed change is illustrated in the table below.
Targets without increase FY
2016 FY
2017 FY
2018 FY
2019 FY
2020
Score on Customer Satisfaction Survey Greater than 4.0
Greater than 4.0
Greater than 4.0
Greater than 4.0
Greater than 4.0
Complete all Major Strategic Plan milestones related to improving the economic accounts
Successfully complete related milestones
Targets with increase FY
2016 FY
2017 FY
2018 FY
2019 FY
2020
Score on Customer Satisfaction Survey Greater than 4.0
Greater than 4.1
Greater than 4.1
Greater than 4.1
Greater than 4.1
Complete all Major Strategic Plan milestones related to improving the economic accounts
Successfully complete additional milestones specifically tied to initiative goals
This initiative calls for expanding BEA’s traded services data and improving U.S. international trade statistics. There are no other approaches to developing and improving these data that would render timely, accurate, and relevant economic statistics. Currently, data on traded services is directly collected from BEA-administered surveys. However, BEA would consult with its sister agency in producing trade statistics, the Census Bureau, before expanding the coverage of its surveys to tap its expertise in collecting data from various industry sectors. For some of the categories of traded services that are more difficult to measure, such as trade in financial services, BEA would work with other partner agencies, such as the Treasury Department and the Federal Reserve Board, to develop an implementation plan for improving the coverage of missing data flows. While this initiative will not result in cost savings to BEA, it will result in significantly improved economic statistics. These improved and expanded statistics will provide the necessary information to develop policies and affect business investments that will improve U.S. competitiveness abroad and create new jobs. BEA’s comprehensive set of trade in services, balance of payments, and U.S. industry economic statistics have been developed over many decades, and are continuously being improved. BEA’s primary function is to produce economic statistics, as well as to identify when there are gaps in data or a need for additional data to answer a growing economic need. Several studies have been conducted regarding the usefulness of BEA’s data in studying the impact of the off-shoring of services on the U.S. economy, including studies by the National
ESA - 43

EXHIBIT 12 – 15
Academy of Public Administration, the Services Off-shoring Working Group at the Massachusetts Institute of Technology’s Industrial Performance Center, and the U.S. Government Accountability Office. (These studies are summarized in the Report to the Committee on Finance of the Senate and the Committee on Ways and Means of the House of Representatives on Trade in Services Statistics dated January 25, 2010.) Many of the improvements that BEA has made to its statistics in recent years address the recommendations made in these and other studies. More recently, the American Economic Association’s Committee on Statistics released a report that evaluates the quality of U.S. statistics on international trade and investment and suggests improvements that could increase the usefulness of these statistics ( ://www.vanderbilt.edu/AEA/AEAStat/pdfs/Report_on_Trade_Data_April_23_2010_FINAL.pdf) This proposed expansion of trade in services data directly supports President Obama’s NEI (National Export Initiative) Next program, specifically by expanding data and information available to American businesses for export market information. This proposal also directly supports the missions of a number of government agencies, including the International Trade Administration, the Office of the U.S. Trade Representative, the Departments of the Treasury and Homeland Security, the Federal Reserve Board, and the U.S. Agency for International Development. Additionally, this information would prove highly beneficial to the business community, particularly those businesses in the service sector, by providing improved data on trade in services critical to understanding market size and dynamics.
Statement of Need and Economic Benefits
The additional economic statistics resulting from the implementation of this proposal will provide policymakers, the Administration, and the Department of Commerce with key information to assess the economic impact of traded services. BEA will provide more frequent data on traded services by publishing additional detail on traded services on a quarterly rather than only an annual basis, and will provide greater geographic detail regarding the destination of U.S. service exports and the source of U.S. service imports.
Specific economic benefits of this investment:
This initiative would further BEA’s mission by providing complete and accurate statistics for use by economic policymakers and the general public. Improved statistics on international trade would provide:
• Better statistical support for programs such as the National Export Initiative • Improved statistics for the negotiation and monitoring of trade agreements. • More complete and timely data on trade between multinational companies and their
affiliates providing insight into global supply chains. • More detailed data for better tailoring policies aimed at showcasing U.S. service sector
attractiveness, which in turn encourages insourcing, or the relocation of business processes from overseas back to the United States creating of jobs for U.S. workers.
ESA - 44

EXHIBIT 12 – 15
Specific cost savings:
While this proposal will not result in cost savings to BEA, it will result in significantly improved economic statistics. These improved and expanded statistics will provide the right information to develop policies and affect business investments that will improve U.S. competitiveness and create new jobs.
Possible return on investment:
The return on investment to the Bureau, and the nation, is significant, as this initiative will serve to fill notable existing gaps in official government statistics and will provide highly valuable new detail on traded services, regarding both the destination of U.S. service exports and the source of U.S. service imports.
Better statistics allow policies to be accurately calibrated and optimized by permitting a more realistic assessment of their costs and benefits. The potential gains from this initiative will far exceed the relatively small cost.
Schedule and Milestones:
FY16: Develop implementation plan for changes to BEA’s surveys. Devise feasibility study on publishing more detail data on traded services associated with global supply chains and Information and Communication Technology (ICT)-enabled services.
FY17: Begin implementing changes to surveys including:
• Lower reporting thresholds on existing surveys of trade in services. • Expand the types of trade in services data collected. • Conduct outreach to companies and users on the trade in services surveys.
FY18: Vet new traded services statistics and results of feasibility study with key stakeholders such as BEA’s Advisory Committee.
FY19: Publish new detailed and timelier statistics on exports and imports of key traded services.
Deliverables:
• Implementation plan for changes to BEA’s surveys. • Feasibility study on publishing more detail data on traded services associated with global
supply chains and ICT-enabled services. • Survey of Current Business article on improvements to trade in services statistics. • Release of higher frequency data (quarterly versus annual) on traded services. • Access to detailed data on traded services by type of service and by country/country group
available on www.bea.gov.
ESA - 45

EXHIBIT 12 – 15
PROGRAM CHANGE PERSONNEL DETAIL
(Actual Dollars)
Budget Program: Bureau of Economic Analysis Sub-program: International Economic Accounts Program Change: Services Trade Initiative
Title Band Interval NumberAnnual Salary Total Salary
Senior Economist V 3 2 157,100 314,200Senior Economist IV 3 2 138,136 276,272Economist III 3 6 98,305 589,830Economist II 3 4 74,654 298,616IT Specialist III 3 1 98,305 98,305
Total 15 1,577,223Less Lapse (4) (394,306)Total Full-time permanent (FTE) 11 1,182,917
2015 Pay Adjustment (1.0%) 11,8292016 Pay Adjustment (1.3%) 15,532Total 1,210,278
Personnel Data
Full-time Equivalent Employment:Full-time permanent 11Other than full-time permanent 0
Total 11
Authorized Positions:Full-time permanent 15Other than full-time permanent 0
ESA - 46

EXHIBIT 12 – 15
PROGRAM CHANGE DETAIL BY OBJECT CLASS
(Dollars in Thousands)
Budget Program: Bureau of Economic Analysis Sub-program: International Economic Accounts Program Change: Services Trade Initiative
FY 2016 FY 2016Object Class Increase Total Program
11.0 Personnel compensation11.1 Full-time permanent 1,210 1,21011.3 Other than full-time permanent 0 011.5 Other personnel compensation 0 011.8 Special personnel services payments 0 011.9 Total personnel compensation 1,210 1,21012.0 Civilian personnel benefits 346 34613.0 Benefits for former personnel 0 021.0 Travel and transportation of persons 11 1122.0 Transportation of things 1 123.1 Rental payments to GSA 0 023.2 Rental Payments to others 0 023.3 Communications, utilities and miscellaneous charges 8 824.0 Printing and reproduction 0 025.1 Advisory and assistance services 0 025.2 Other services 750 75025.3 Purchases of goods & services from Gov't accounts 663 66325.4 Operation and maintenance of facilities 0 025.5 Research and development contracts 0 025.6 Medical care 0 025.7 Operation and maintenance of equipment 0 025.8 Subsistence and support of persons 0 026.0 Supplies and materials 47 4731.0 Equipment 153 15399.0 Total obligations 3,189 3,189
ESA - 47
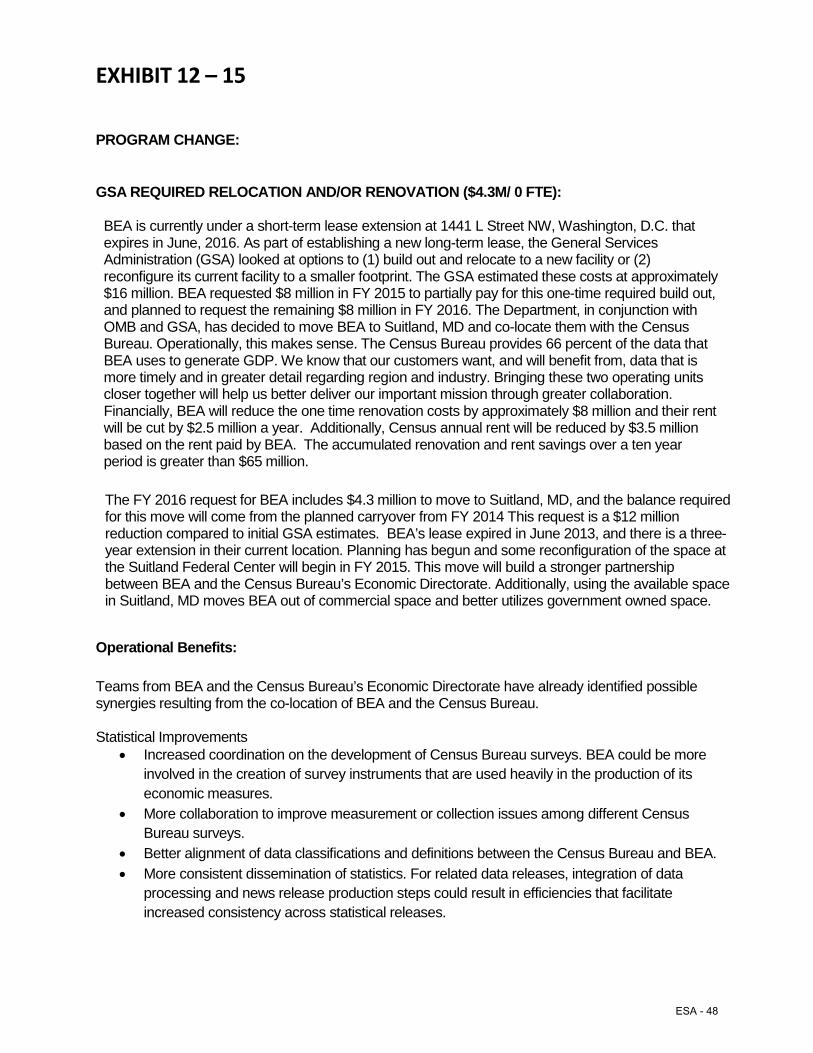
EXHIBIT 12 – 15
PROGRAM CHANGE:
GSA REQUIRED RELOCATION AND/OR RENOVATION ($4.3M/ 0 FTE): BEA is currently under a short-term lease extension at 1441 L Street NW, Washington, D.C. that expires in June, 2016. As part of establishing a new long-term lease, the General Services Administration (GSA) looked at options to (1) build out and relocate to a new facility or (2) reconfigure its current facility to a smaller footprint. The GSA estimated these costs at approximately $16 million. BEA requested $8 million in FY 2015 to partially pay for this one-time required build out, and planned to request the remaining $8 million in FY 2016. The Department, in conjunction with OMB and GSA, has decided to move BEA to Suitland, MD and co-locate them with the Census Bureau. Operationally, this makes sense. The Census Bureau provides 66 percent of the data that BEA uses to generate GDP. We know that our customers want, and will benefit from, data that is more timely and in greater detail regarding region and industry. Bringing these two operating units closer together will help us better deliver our important mission through greater collaboration. Financially, BEA will reduce the one time renovation costs by approximately $8 million and their rent will be cut by $2.5 million a year. Additionally, Census annual rent will be reduced by $3.5 million based on the rent paid by BEA. The accumulated renovation and rent savings over a ten year period is greater than $65 million.
The FY 2016 request for BEA includes $4.3 million to move to Suitland, MD, and the balance required for this move will come from the planned carryover from FY 2014 This request is a $12 million reduction compared to initial GSA estimates. BEA’s lease expired in June 2013, and there is a three-year extension in their current location. Planning has begun and some reconfiguration of the space at the Suitland Federal Center will begin in FY 2015. This move will build a stronger partnership between BEA and the Census Bureau’s Economic Directorate. Additionally, using the available space in Suitland, MD moves BEA out of commercial space and better utilizes government owned space.
Operational Benefits:
Teams from BEA and the Census Bureau’s Economic Directorate have already identified possible synergies resulting from the co-location of BEA and the Census Bureau. Statistical Improvements
• Increased coordination on the development of Census Bureau surveys. BEA could be more involved in the creation of survey instruments that are used heavily in the production of its economic measures.
• More collaboration to improve measurement or collection issues among different Census Bureau surveys.
• Better alignment of data classifications and definitions between the Census Bureau and BEA. • More consistent dissemination of statistics. For related data releases, integration of data
processing and news release production steps could result in efficiencies that facilitate increased consistency across statistical releases.
ESA - 48

EXHIBIT 12 – 15
Better Information Sharing • Sharing of technical expertise. The Census Bureau has expertise in survey design, cognitive
review, and data collection methods that it could share with BEA’s International Directorate survey program staff. In return, BEA has expertise in time-series analysis that it could share to help Census Bureau staff identify and address data inconsistencies.
• More regular meetings between BEA and the Census Bureau. Closer physical proximity will permit more meetings between BEA and the Census Bureau to discuss current issues and upcoming changes.
• Improved “special sworn status” access. Currently, BEA employees with special sworn status must travel from Downtown DC to Suitland in order to view the Census Bureau’s micro data. Co-location will allow those with sworn status to more easily and frequently work with the micro data, and to interact regularly with the Census Bureau experts on those data.
• Earlier source data delivery. Co-location may help the Census Bureau to provide source data to BEA under an accelerated timeframe.
• Collaboration on protecting data confidentiality. The Census Bureau’s disclosure review board has a robust process for deciding on procedures for protecting confidential data in published statistics. BEA could participate in the review board to share ideas for ensuring confidentiality and improve and validate current BEA procedures.
Enhanced Public Relations
• Increase public awareness of the importance of government statistical agencies. As the leading statistical agencies in the United States, BEA and Census have opportunities to jointly improve the public’s awareness of the importance of economic data. For example, by pooling resources, training sessions for universities could be developed that help enhance student awareness of the importance of economic data and its construction. These sessions would ensure that future users of the data are aware of the critical role played by government statistical agencies.
ESA - 49

Exhibit 16
Object Class 2014 2015 2016 2016 2016Actual Enacted Base Estimate Increase
11 Personnel compensation11.1 Full-time permanent 48,397 51,720 52,795 55,849 3,05411.3 Other than full-time permanent 749 766 773 773 0
Subtotal 11-01 and 11-03 49,146 52,486 53,568 56,622 3,05411.5 Other personnel compensation 747 625 625 625 011.8 Special personnel services payments 0 0 0 0 011.9 Total personnel compensation 49,893 53,111 54,193 57,247 3,05412.1 Civilian personnel benefits 15,462 16,645 17,293 18,164 87113.0 Benefits for former personnel 200 25 25 25 021.0 Travel and transportation of persons 358 304 311 340 2922.0 Transportation of things 13 19 19 20 123.1 Rental payments to GSA 6,602 8,312 8,436 8,436 023.2 Rental payments to others 0 355 361 369 823.3 Communications, utilities and miscellaneous 738 682 703 717 1424.0 Printing and reproduction 90 53 53 53 025.1 Advisory and assistance services 410 196 200 200 025.2 Other services from non-federal sources 11,755 9,352 9,502 10,310 80825.3 Purchases of goods and services from Gov't 9,830 12,883 9,272 15,058 5,78625.4 Operation and maintenance of facilities 1 248 250 580 33025.7 Operation and maintenance of equipment 94 184 187 187 026.0 Supplies and materials 1,269 1,372 1,393 1,517 12431.0 Equipment 468 224 226 627 401
99.0 Total Obligations 97,183 103,964 102,423 113,849 11,426
Less, Prior Year Unobligated Balance (572) (3,964)Less, Prior Year Recoveries and Refunds (1,625)Plus, Unobligated Balance, EOY 3,964Plus, Unobligated Balance, Expiring 50
Total Budget Authority 99,000 100,000 204,846 227,698 22,852
Personnel Data 2014 2015 2016 2016 2016Actual Enacted Base Estimate Increase
Full-Time Equivalent Employment: 450 470 470 499 29
Positions: 470 481 481 520 39
(Dollar amounts in thousands)
Department of CommerceEconomic and Statistical Analysis Budget
Economics and Statistics Administration / Bureau of Economic AnalysisSalaries and Expenses
SUMMARY OF REQUIREMENTS BY OBJECT CLASS
ESA - 50

Exhibit 34
Department of CommerceEconomic and Statistical Analysis Budget
Economics and Statistics Administration / Bureau of Economic AnalysisSalaries and Expenses
ADVISORY AND ASSISTANCE SERVICES(dollars in thousands)
FY 2014 FY 2015 FY 2016Object Class 25.1 Actual Enacted Estimate
Management and Professional Services $410 196 200
Special Studies and Analyses $0 0 0
Engineering and Technical Services $0 0 0
TOTALS $410 196 200
Management and professional services, and special studies are utilized to the extent that they provide a cost-effective source for services.
Further, it is not practical for ESA to work in an insulated environment. Consulting and related servicescontribute to the overall stability of ESA's work by: (1) providing cross-checks to ESA's work; and (2) supplementing staff to investigate important issues or problems.
ESA - 51

Exhibit 35
Department of CommerceEconomic and Statistical Analysis Budget
Economics and Statistics Administration / Bureau of Economic AnalysisSalaries and Expenses
PERIODICALS, PAMPHLETS, AND AUDIOVISUAL SERVICES(dollars in thousands)
FY 2014 FY 2015 FY 2016Actual Enacted Estimate
Periodicals $71 $72 $74
Pamphlets $11 $11 $11
Audiovisual Services $0 $0 $0
TOTALS $82 $83 $85
A central component of BEA’s mission is to gather and disseminate information about U.S. economic accounts in a timely and cost effective manner. BEA accomplishes this dissemination through its public Web site, www.bea.gov. The site provides a comprehensive set of data tables, economic indicator releases, methodology papers, the BEA Strategic Plan, and other key information developed by the Bureau. Another important means of disseminating BEA information is through creation and public distribution of periodicals, reports, pamphlets, and related printed or audiovisual materials. BEA has developed an effective portfolio of these communications tools, maximizing public access to economic account information. follows: Periodicals – On a monthly basis, BEA publishes the Survey of Current Business (SCB). The SCB is BEA’s flagship journal containing numerous articles written by BEA staff interpreting economic data being disseminated by BEA. In addition, the SCB includes extensive tables and charts of economic data gathered and tracked by BEA. The data collectively serve as a resource for government officials, economists, the media, financial professionals, academicians, and the general public. The SCB also serves to fulfill BEA’s legal requirement to make public the data it collects across the national, international, regional, and industry economic accounts both in print and online versions. Pamphlets and other publications – Each year BEA produces and distributes a variety of publications to support its mission of providing available data and services to thousands of external customers. These products are often distributed to the public through trade shows and regional conferences where BEA staff are present, or at meetings with other government agencies or congressional officials. Products include the BEA brochure, the BEA Strategic Plan, the BEA Customer Service Guide, economic account fact sheets, release schedules, regional data wheels, instructional literature on using BEA data, and the BEA Customer Satisfaction Report.
ESA - 52

Exhibit 36
FY 2014 FY 2015 FY 2016
EnactedPresident's
Budget Estimate
Average ES Salary $173,470 $175,290 $177,568
Average GS/GM Grade 13 13 13
Average GS/GM Salary $104,178 $105,271 $106,639
AVERAGE GRADE AND SALARIES
Department of CommerceEconomic and Statistical Analysis Budget
Economics and Statistics Administration / Bureau of Economic AnalysisSalaries and Expenses
ESA - 53

FY 2016 APP / FY 2014 APR
FY 2016 Annual Performance Plan / FY 2014 Annual Performance Report
Economics and Statistics Administration / Bureau of Economic Analysis Part 1: Agency and Mission Information Section 1.1: Overview Headed by the Under Secretary for Economic Affairs, the Economics and Statistics Administration’s (ESA) three principal analytical components are the Office of the Chief Economist, the U.S. Census Bureau, and the Bureau of Economic Analysis (BEA). ESA develops policy options, analyzes economic developments, manages economic data distribution systems, and produces a major share of U.S. economic and demographic statistics, including the national economic indicators. Representative economic indicators produced by ESA are gross domestic product (GDP), retail sales, and international trade. Additional economic and demographic statistics available from ESA include regional information on population (benchmarked by the decennial census), poverty, income, race and ethnicity, businesses, and a variety of other information useful to government, business, and the American public.
The expert economists and analysts in ESA’s Office of the Chief Economist analyze domestic and international economic developments and produce in-depth reports, fact sheets, and briefings on policy issues, current economic events, and economic and demographic trends. DOC and White House policymakers rely on these tools, as do American businesses, state and local governments, and news organizations around the world. In overseeing the Census Bureau and BEA, ESA works closely with the leadership of those two statistical agencies on high priority management, budget, employment, and risk management issues, integrating the work of these agencies with the priorities and requirements of the Department of Commerce and other government entities.
The BEA produces some of the Nation’s most important economic statistics, including GDP and the balance of payments. BEA promotes a better understanding of the U.S. economy by providing timely, relevant, and accurate economic accounts data in an objective and cost-effective manner. Although a relatively small agency, BEA’s economic statistics are among the Nation’s most closely watched. BEA’s statistics influence critical decisions made by policymakers, business leaders, households, and individuals affecting interest rates, tax and budget projections, business investment plans, and the allocation of over $300 billion in federal funds.
The U.S. Census Bureau conducts the constitutionally mandated census of population and housing every 10 years, a census of all business establishments and of all governmental units every five years, and several ongoing business and household surveys. U.S. Census Bureau information shapes policy and operational decisions that help improve the nation’s social and economic conditions. The FY 2016 Annual Performance Plan for the U.S. Census Bureau is presented separately in their budget submission. Section 1.2: Mission Statement ESA’s Mission Statement “To provide high-quality economic analysis and foster the missions of the Census Bureau and the Bureau of Economic Analysis.” BEA’s Mission Statement
ESA - 54

FY 2016 APP / FY 2014 APR “Improve understanding of the U.S. economy by providing the most timely, relevant, and accurate economic accounts data in an objective and cost-effective manner.” Section 1.3: Vision and Values (Optional) BEA’s Vision Statement To be the world’s most respected producer of economic accounts. Section 1.4: Organizational Structure The Economics and Statistics Administration includes Policy Support and Management Oversight, BEA, and the Bureau of the Census.
ESA - 55

FY 2016 APP / FY 2014 APR
ESA - 56

FY 2016 APP / FY 2014 APR
Part 2: Cross-Agency Priority Goals Section 2.1: Overview ESA is not a leader of or a participant in any Cross-Agency Priority Goals. Part 3: Strategic Goals and Objectives Section 3.1: Corresponding DoC Strategic Goals, and Objectives
Goal Objective Number Objective Name Leader:
Innovation 2.4 Accelerate the development of industry-led skills strategies that result in a productive workforce for employers and high-quality jobs for workers.
Dr. Mark Doms, Under Secretary for Economic Affairs
Data 4.1 Transform the Department’s data capacity to enhance the value, accessibility and usability of Commerce data for government, business, and the public.
Dr. Mark Doms, Under Secretary for Economic Affairs
Data 4.2 Improve data-based service, decision making, and data sharing within the Department and with other parts for the federal government.
Dr. Mark Doms, Under Secretary for Economic Affairs
Data 4.3 Collaborate with the business community to provide more timely, accurate, and relevant data products and services for customers.
Dr. Mark Doms, Under Secretary for Economic Affairs
Operational Excellence 5.1 Deliver better services, solutions, and outcomes that benefit the
American people. Departmental Management Council
Section 3.2: Strategies for Objectives BEA’s objectives fall under the Department’s Data goal, and are designed to ensure that BEA’s economic statistics programs are timely, relevant, and accurate as demanded by our customers. BEA tracks progress on these objectives as follows:
• The timeliness measure is defined as the number of scheduled releases released on time. It is also evaluated as the number of successfully-completed milestones related to the target.
• The accuracy measure is a composite index to track BEA’s success in estimating GDP. The six components of the index include: (1) whether the economy is expanding or contracting; (2) whether the economy is growing faster or slower, (3) deviation from trend growth, (4) change in the statistical discrepancy, (5) magnitude of revision to real GDP; and (6) magnitude of revision to nominal GDP.
• The relevance objective is designed to make BEA’s economic accounts and services more responsive to the needs of its customers and partners. It is measured by the number of above-average responses on BEA’s web site customer satisfaction survey.
• Improvements to the economic account statistics are measured by the percent of progress toward annual milestones completed.
ESA - 57

FY 2016 APP / FY 2014 APR Given the importance of BEA’s statistics, BEA must fulfill its mission regardless of the challenges it may confront. Some of these challenges are constant over time, and others arise as the economy changes. The strategic planning process identifies and mitigates these challenges. The challenges now confronting BEA include:
• A constantly changing economy: BEA must be diligent in updating its statistics to capture the structural changes that occur in the U.S. and global economies.
• Integration of federal economic accounts: Federal statistical agencies are working together to harmonize definitions, methodologies, and analytical techniques to meet data users’ need for greater consistency of economic accounts provided by the decentralized U.S. statistical system.
• Relevance of economic accounts: Maintaining the relevance of economic accounts to address the public policy issues of today calls for new and expanded statistics that extend the GDP and related accounts beyond their long-established boundaries.
• Efficiently exploiting information technology: To meet the urgency associated with rapidly changing economic and customer needs, BEA looks to exploit highly flexible, adaptive, and cost-effective IT systems that can respond quickly to changing statistical and dissemination needs.
• Maintaining and expanding the expertise and satisfaction of its workforce: BEA must intensify its recruitment, hiring, retention, and training programs to keep its staff at the leading edge of economic change and innovative measurement solutions.
Section 3.3: Progress Update for Strategic Objectives Benefits BEA’s national, industry, regional, and international economic accounts present valuable information on key issues such as U.S. economic growth, regional economic development, inter-industry relationships, and the Nation's position in the world economy. Some of the widely used statistical measures produced by BEA include gross domestic product (GDP), personal income and outlays, corporate profits, GDP by state and by metropolitan area, balance of payments, and GDP by industry. These statistics are used by Federal, state, and local governments for budget development and projections, by the Federal Reserve for monetary policy, by the business sector for planning and investment, and by the American public to follow and understand the performance of the Nation’s economy. Accomplishments Recent accomplishments include:
• Released several new statistical products to better measure the dynamic U.S. economy giving businesses, policymakers and ordinary Americans additional tools to make informed decisions:
o To provide further insight into the relative purchasing power of consumers in different states and metro areas, BEA released new measures of inflation adjusted Personal Income for State and Metropolitan Areas.
o New prototype statistics on Personal Consumption Expenditures by State provide a better gauge of how consumers are faring across different states offering a richer picture of economic activity across the U.S.
o Finally, BEA is now providing more frequent data on how much economic activity is generated by different industries and across states with its new Quarterly GDP by Industry and Quarterly GDP by State statistics (previously only available annually).
• BEA was rated in the “2014 Best Place to Work” 56th out of 314 agency subcomponents.
ESA - 58

FY 2016 APP / FY 2014 APR Section 3.4: Next Steps The BEA Five-Year Strategic Plan is a comprehensive plan of action that tracks BEA’s progress toward accomplishing its mission. BEA’s progress is tied to its contributions to the Department’s initiatives of making key investments in each of the core areas of: trade and investment, innovation, data and the environment. The Plan has nearly 200 detailed milestones, which ensure that BEA statistics are as timely, relevant, and accurate as possible. These milestones allow managers and senior staff to plan resources and staff allocations and encourage personal accountability by connecting the achievement of milestones to individuals’ annual performance plans. This direct progression from DOC themes to the BEA mission and, finally, to the objectives, goals, and milestones of the BEA Five-Year Strategic Plan reinforces the link between the DOC mission and the employees at BEA. Part 4 Performance Goals / Indicators Section 4.1: Summary of Performance
Status is based on the following standard: Exceeded More than 100 percent of target Met 90 - 100 percent of target Not Met Below 90% of target An indicator with a positive trend is one in which performance is improving over time while a negative trend is an indicator that has declining performance. A stable trend is one in which the goal is to maintain a standard, and that that is occurring. A varying trend in one in which the data fluctuates too much to indicate a trend. At a minimum these indicators must have three years of data.
.Section 4.2: Summary of Indicator Performance Objective 4.3: Collaborate with the business community to provide more timely, accurate, and relevant data products and services for customers Indicator Target Actual Status Trend Timeliness- Reliability of delivery of economic data statistics (the number of scheduled releases issued on schedule) 62 65 Exceeded Positive
Relevance- Customer satisfaction (on a 5 point scale) 4.0 4.0 Met Slightly negative
Status of FY 2014 Indicators
Exceeded
Met
Not Met
Actual Trends of Indicators
Positive
Negative
Stable
Varying
ESA - 59

FY 2016 APP / FY 2014 APR Accuracy- Percent of GDP estimates correct >83% 86% Exceeded Positive Strategic Milestones Completed Completed Completed Met Stable Section 4.3 Detailed Indicator Plans and Performance Objective 4.3: Collaborate with the business community to provide more timely, accurate, and relevant data products and services for customers Indicator Timeliness- Reliability of delivery of economic data statistics (scheduled releases issued on time)
Description
The importance of data as an ingredient for sound economic decision-making requires BEA to deliver data to decision-makers and other data users not only quickly but also reliably—that is, on schedule. Each fall, BEA publishes a schedule for the release of its economic data the following year; this measure is evaluated as the number of scheduled releases issued on time. BEA has an outstanding record of releasing its economic data on schedule and on time. In FY 2014, BEA met the target of planned releases and has no indication that this target will not be met in 2015.
FY 2009 FY 2010 FY 2011 FY 2012 FY 2013 FY 2014 FY 2015 FY 2016 Target 57 55 62 62 62 62 69 69 Actual 56 of 57 61 of 55 62 of 62 62 of 62 62 of 62 65 of 62 Status Met Exceeded Met Met Met Exceeded Trend The trend for this indicator is positive. Actions to be taken / Future Plans BEA has no plans to change this indicator.
Adjustments to targets Adjustments to targets have not been made.
Information Gaps There are no information gaps for this indicator.
Validation and Verification Data Source A schedule of release dates for the calendar year is published each fall in the Survey of Current Business and is posted on the BEA website. BEA maintains a
record of subsequent actual release dates. Frequency Quarterly Data Storage BEA maintains the schedule of future release dates and the record of actual release dates. Both sets of information are available on the BEA website. Internal Control Procedures Scheduled and actual release dates are a matter of public record and can be verified via the Internet at www.bea.gov. Data Limitations Not all releases may be included in the published annual schedule because their release dates cannot be established that far in advance. Actions to be Taken FY 2015 target will be added when the schedule is made available to OMB and published in the Survey of Current Business in the fall of the preceding year.
ESA - 60

FY 2016 APP / FY 2014 APR Indicator Relevance- Customer satisfaction (on a 5 point scale)
Description
Customer satisfaction is a critical measure of BEA’s ability to provide the types of data that are relevant, accurate, and needed by users. BEA measures the level of customer satisfaction through an on-going online survey of users. FY 2014 scores will be available in FY 2015, however, BEA has received indication that users continue to be satisfied with the overall quality of BEA’s products.
FY 2009 FY 2010 FY 2011 FY 2012 FY 2013 FY 2014 FY 2015 FY 2016 Target 4.0 4.0 4.0 4.0 4.0 4.0 4.0 4.0 Actual 4.2 4.2 4.4 4.3 4.1 4.0 Status Exceeded Exceeded Exceeded Exceeded Exceeded Met
Trend The trend for this indicator is slightly negative. Eroding web site usability was a main contributor to the slightly negative trend in customer satisfaction. However, continued research and development of new and improved web technologies should reverse this trend.
Actions to be taken / Future Plans BEA has no plans to change this indicator.
Adjustments to targets Adjustments to targets have not been made.
Information Gaps There are no information gaps for this indicator.
Validation and Verification Data Source BEA customer satisfaction survey conducted online at BEA’s website, www.bea.gov. Frequency Continually
Data Storage BEA conducts the survey, compiles results, and retains records of raw data and computations that lead to final results. A report is written and available to the public on the BEA website.
Internal Control Procedures BEA provides a copy of the survey results to OMB, the DOC Budget Office, and the Economics and Statistics Administration. The report is made available on the BEA website.
Data Limitations The customer satisfaction survey is an ongoing, voluntary survey conducted via the website. As a voluntary survey, responses are representative of those who choose to respond.
Actions to be Taken Survey is continually conducted with results monitored quarterly and reported after the end of the fiscal year.
ESA - 61

FY 2016 APP / FY 2014 APR Indicator Accuracy- Percent of GDP estimates correct
Description
This performance measure tracks BEA’s ability to accurately estimate its most important statistic, the gross domestic product (GDP). This measure is a composite index of six indicators of accuracy, applied using three-year rolling averages to develop a single measure of the correctness of the GDP statistics. FY 2014 results will become finalized in FY 2015, but BEA expects to exceed this target.
FY 2009 FY 2010 FY 2011 FY 2012 FY 2013 FY 2014 FY 2015 FY 2016 Target 85% 85% 85% 85% 83% 83% 83% 83% Actual 94% 88% 87% 87% 84% 86% Status Exceeded Exceeded Exceeded Exceeded Exceeded Exceeded Trend The trend for this indicator is stable. Actions to be taken / Future Plans BEA has no plans to change this indicator.
Adjustments to targets Adjustments to targets have not been made.
Information Gaps There are no information gaps for this indicator.
Validation and Verification Data Source Data used for this measure are produced by BEA and made available in press releases, in our monthly publication, the Survey of Current Business (SCB), and
on the Website: www.bea.gov. Background research studies are published in the SCB. Frequency Annually Data Storage The Survey of Current Business is published monthly online.
Internal Control Procedures DOC has evaluated this measure and BEA has submitted a Validation and Verification report. The Survey of Current Business is a matter of public record and can be verified via the Internet.
Data Limitations The measure is the best single point estimation of the accuracy of GDP. Economic conditions, rather than statistical practices, could dramatically change the measure.
Actions to be Taken
ESA - 62

FY 2016 APP / FY 2014 APR Indicator Complete all major strategic milestones related to improving economic accounts
Description
BEA must continually update its economic accounts to keep pace with the ever-changing U.S. and global economies. The BEA Five-Year Strategic Plan tracks BEA’s progress toward achieving the milestones related to this measure. In FY 2014, BEA completed all of its major milestones related to improving GDP and the economic accounts and expects to meet this target in current and future years.
FY 2009 FY 2010 FY 2011 FY 2012 FY 2013 FY 2014 FY 2015 FY 2016
Target Complete Milestone
Complete Milestone
Complete Milestone
Complete Milestone
Complete Milestone
Complete Milestone
Complete Milestone
Complete Milestone
Actual Completed Successfully
Completed Successfully
Completed Successfully
Completed Successfully
Completed Successfully
Completed Successfully
Status Met Met Met Met Met Met Trend The trend for this indicator is stable. Actions to be taken / Future Plans BEA has no plans to change this indicator.
Adjustments to targets Adjustments to targets have not been made.
Information Gaps There are no information gaps for this indicator.
Validation and Verification Data Source The BEA five-year Strategic Plan provides annual milestones for this measure. At the end of each fiscal year, BEA evaluates and reports its progress in
achieving scheduled milestones. Frequency Annually Data Storage BEA compiles and maintains data annually available on BEA website. Internal Control Procedures Internal review and analysis by BEA. Data Limitations BEA’s annual review and update of its Strategic Plan could result in changes to the milestones. Actions to be Taken Milestones will be adjusted as necessary to match the BEA five-year Strategic Plan. Non-Recurring Indicators None. Part 5: Other Indicators None. Part 6: Agency Priority Goals None.
ESA - 63

FY 2016 APP / FY 2014 APR Part 7: Resource Requirements Table
FY 2009 Actual
FY 2010 Actual
FY 2011 Actual
FY 2012 Actual
FY 2013 Actual
FY 2014 Actual
FY 2015 Enacted
FY 2016 Base
Increase / Decrease
FY 2016 Request
Bureau of Economic Analysis
Total Obligations 90.0 96.7 96.3 94.7 93.2 95.4 99.8 101.8 11.4 113.2 Direct 87.4 94.1 93.7 92.5 89.4 93.6 96.3 98.5 11.4 109.9 Reimbursable 2.6 2.6 2.6 2.2 3.8 1.8 3.5 3.3 0.0 3.3 Total FTE 496 503 497 497 461 446 470 468 29 497
ESA
Total Obligations 7.4 8.5 9.0 8.3 7.9 7.7 8.2 8.8 0.0 8.8 Direct 3.7 4.0 3.8 3.9 3.4 3.6 3.7 3.9 0.0 3.9 Reimbursable 3.7 4.5 5.2 4.4 4.5 4.1 4.0 4.9 0.0 4.9 Total FTE 35 34 37 36 33 31 36 36 0 36
Total Obligations
Total Obligations 97.4 105.2 105.3 103.0 101.1 103.1 107.5 110.6 11.4 122.0 Direct 91.1 98.1 97.5 96.4 92.8 97.2 100.0 102.4 11.4 113.8 Reimbursable 6.3 7.1 7.8 6.6 8.3 5.9 8.0 8.2 0.0 8.2 Total FTE 531 537 534 533 494 477 506 504 29 533
ESA - 64

FY 2016 APP / FY 2014 APR Part 8: Other Information Section 8.1: Major Management Priorities, Challenges, and Risks This FY 2016 budget request enables BEA to maintain “core” statistical programs in three categories: statistics that feed into the estimation of GDP and related products, statistics that are required by law, and statistics that are required for the administration of federal programs. BEA faces long-term challenges to its mission: 1. Stay relevant: Given our constantly changing economy, keeping our accounts relevant has always been one of our top challenges. To tell the “right story,” BEA must be quick to recognize and understand the changes occurring in the economy. The most pressing public policy issues today call for new and expanded statistics that extend the GDP and related accounts beyond their long-established boundaries to address national priorities such as health care, innovation and energy. At the same time, data users have long demanded greater consistency among the federal economic accounts provided by the decentralized U.S. statistical system, and that demand has only grown stronger as the economy has become more complex. As a leading statistical agency, BEA must contribute to the effort to integrate the federal economic accounts. 2. Manage for flexibility: The rapidity of the recent changes in the economy poses considerable methodological and computational challenges. In response, BEA must be flexible enough to quickly adapt its measures to changing economic conditions. As technological capabilities increase, customers expect easier access, quicker turnaround, and accessible interface mechanisms. In addition, BEA must make information readily available to all types of data uses. Information should be available to everyone, from the least to the most experienced data user, which requires cost-effective strategies for the continued delivery of useful information to a very diverse customer base. 3. Build future leaders: As much of BEA’s senior staff nears retirement, BEA is experiencing firsthand the importance of institutional knowledge and experience. BEA is devoting itself to the preparation of a new generation of cutting-edge experts and leaders. These challenges threaten BEA’s ability to fulfill its highest priority, its mission to promote a better understanding of the U.S. economy by providing the timeliest, most relevant, and accurate economic accounts data possible. BEA’s FY 2016 budget submission is designed to address these challenges and enable BEA to not only maintain but also improve its high-priority statistics. Section 8.2: Cross-Agency Collaborations BEA works with several statistical agency partners to provide even further comprehensive information on the U.S. economy. The Integrated Macroeconomic Accounts of the U.S. produced jointly with the Federal Reserve Board link production and income flows to changes in net worth for the U.S. economy. In FY 2014, the Integrated Macroeconomic accounts were updated to reflect an improved treatment of defined contribution pension plans (i.e., 401K plans). In addition, BEA jointly produces the Integrated GDP and Productivity Account with the Bureau of Labor Statistics, which allows users to better understand sources of economic and productivity growth within an integrated framework. In FY 2014, this account was updated to recognize expenditures for intellectual property products as capital investment since these types of expenditures have characteristics that are more aligned with other types of fixed assets such as IT equipment. As a result, these updated accounts now give users new information on the contribution of intellectual property products as a capital input and its impact on U.S. economic growth and productivity by industry.
ESA - 65

FY 2016 APP / FY 2014 APR Section 8.3: Evidence Building ESA and BEA participate in the risk management efforts led by the Department’s Office of Program Evaluation and Risk Management (OPERM). Risk information is reported as part of the Department’s DASHER report available at ://csc.eas.commerce.gov/dasher/home/Top_ . In FY 2014, there are no mission critical areas specific to ESA or BEA. Financial internal control review efforts as outlined in Appendix A of OMB Circular A-123 are conducted annually and are led by the Department’s Office of Financial Management (OFM). Audits and reports from the Government Accountability Office (GAO) and the Department’s Office of Inspector General (OIG) provide valuable information on programmatic and managerial challenges. ESA and BEA had no findings or unimplemented GAO or OIG recommendations as of May 2014. Cumulative GAO and OIG reports are available at ://csc.eas.commerce.gov/dasher/home/gaorecommendations/cumulative_ and ://csc.eas.commerce.gov/dasher/home/unresolved_oig_ , respectively. BEA uses evidence-based strategies to measure and drive performance at various levels of operations: • Assessing accuracy of GDP estimates: BEA conducts studies that assess the accuracy of GDP estimates. The studies examine whether the early
estimates to the latest estimates present a consistent and general picture of the economy. • Measuring electronic filing rate of international surveys: Measuring the electronic filing rate helps BEA monitor its ability to collect accurate international
transactions data in an efficient and cost-effective manner. • Improving economic accounts: BEA conducts research and develops satellite or prototype statistics, and graduates selected statistics into regular
production within the core accounts. • Assessing the workplace: BEA uses results of the Federal Employee Viewpoint Survey to evaluate employees’ overall work experience and job satisfaction
and to identify areas for improvement. • Evaluating internal customer satisfaction: the Administrative Services Division uses results of an internal customer satisfaction survey to identify trends in
functional areas (e.g., Human Capital), and enhance the customer experience. • Evaluating external customer satisfaction: BEA’s statistics are only as useful as its customers’ ability to access, use, and understand them. BEA’s two-way
communication with its customers is facilitated by new instructional videos posted on BEA’s public website, Frequently Asked Questions format, and semi-annual Advisory Committee meetings, which provide BEA with invaluable outside expertise as well as insight into the needs of our expert users. To assess customers’ opinions about its statistical products, customer service, and Web site, BEA has conducted annual surveys since 2000. These surveys allow BEA to establish a reliable, continuous metric for measuring the satisfaction of site visitors; diagnose and prioritize areas for improvement by identifying the impact of change on satisfaction and site visitors’ future behaviors; and proactively identify Web site areas for improvement.
Section 8.4: Hyperlinks BEA’s budget and performance information is available at ://www.bea.gov/about/index. . ESA’s mission statement is available at ://www.esa.doc.gov/esa-mission-.
Section 8.5: Data Validation and Verification The FY 2014 Summary of Performance and Finance Information includes, in the Secretary’s Statement, an assessment of the reliability and completeness of the Department’s performance data.
ESA - 66

FY 2016 APP / FY 2014 APR
Indicators Timeliness Relevance Accuracy Strategic Milestones Completed
Number of data dissemination tools and improvements fueled by Commerce Department data
on the U.S. workforce
Percent of milestones met for business
assistance analysis.
Percent of milestones met for stakeholder
outreach.
Validation and Verification
Data Source
A schedule of release dates for the calendar year is published each fall in the Survey of Current Business and is posted on the BEA website. BEA maintains a record of subsequent actual release dates.
BEA customer satisfaction survey conducted online at
BEA’s website, www.bea.gov
Data used for this measure are
produced by BEA and made
available in press releases, in our
monthly publication, the
Survey of Current Business (SCB),
and on the Website:
www.bea.gov. Background
research studies are published in
the SCB.
The BEA five-year Strategic Plan
provides annual milestones for this
measure. At the end of each fiscal year, BEA evaluates and
reports its progress in achieving scheduled
milestones.
Frequency Quarterly Continually Annually Annually
Data Storage
BEA maintains the schedule of future release dates and the record of actual release dates. Both sets of information are available on the BEA website.
BEA conducts the survey, compiles results, and retains records of raw data and computations that lead to final results. A report is written and available to the public on the BEA website.
The Survey of Current Business is published monthly and available online.
BEA compiles and maintains data annually, available on BEA website.
Internal Control Procedures
Scheduled and actual release dates are a matter of public record and can be verified via the Internet at www.bea.gov.
BEA provides a copy of the survey results to OMB, the DOC Budget Office, and the Economics and Statistics Administration. The report is made available on the BEA website.
DOC has evaluated this measure and BEA has submitted a Validation and Verification report. The Survey of Current Business is a matter of public record and can be verified via the Internet or hardcopy.
Internal review and analysis by BEA.
Data Limitations
Not all releases may be included in the published annual schedule because their release dates
The customer satisfaction survey is an ongoing, voluntary survey conducted via the
The measure is the best single point estimation of the accuracy of GDP. Economic
BEA’s annual review and update of its Strategic Plan could result in changes to the milestones.
ESA - 67

FY 2016 APP / FY 2014 APR cannot be established that far in advance.
website. As a voluntary survey, responses are representative of those who choose to respond.
conditions, rather than statistical practices, could dramatically change the measure.
Actions to be Taken
FY 2014 target will be added when the schedule is made available to OMB and published in the Survey of Current Business in the fall of the preceding year.
Survey is continually conducted with results monitored quarterly and reported after the end of the fiscal year.
Research to calculate the new measure will be conducted, following the completion of the annual revisions, in August 2014.
Milestones will be adjusted as necessary to match the BEA five-year Strategic Plan.
Section 8.6: Lower-Priority Program Activities The President’s Budget identifies the lower-priority program activities, where applicable, as required under the GPRA Modernization Act, 31 U.S.C. 1115(b)(10). The public can access the volume at: ://www.whitehouse.gov/omb/ .
ESA - 68

Last Page