u.s. baseline briefing book - fapri-mu - food and ... · u.s. baseline briefing book . ... larger...
TRANSCRIPT

U.S. Baseline Briefing Book Projections for Agricultural and Biofuel Markets
March 2014
FAPRI-MU Report #02-14
Prepared by the Integrated Policy Group, Division of Applied Social Sciences
www.fapri.missouri.edu amap.missouri.edu
Agricultural Markets and Policy

Published by the Food and Agricultural Policy Research Institute (FAPRI) at the University of Missouri
(MU), 101 Park DeVille Drive, Suite E; Columbia, MO 65203. FAPRI–MU is part of the Division of
Applied Social Sciences (DASS) in the College of Agriculture, Food and Natural Resources (CAFNR).
www.fapri.missouri.edu
This material is based upon work supported by the U.S. Department of Agriculture, under Agreement
Nos. 58-0111-12-003 and 58-0111-13-002.
Any opinion, findings, conclusions, or recommendations expressed in this publication are those of the
authors and do not necessarily reflect the view of the U.S. Department of Agriculture nor the University
of Missouri.
The crop, biofuel, government cost and farm income projections in this report were prepared by the
team at FAPRI-MU, including Pat Westhoff ([email protected]), Scott Gerlt
([email protected]), Jarrett Whistance ([email protected]), Julian Binfield
([email protected]) and Wyatt Thompson ([email protected]).
The livestock, poultry, dairy and consumer price projections were prepared by the MU Agricultural
Markets and Policy (AMAP) team, including Scott Brown ([email protected]) and Daniel
Madison ([email protected]).
FAPRI-MU and AMAP are both part of the Integrated Policy Group in the MU Division of Applied
Social Sciences.
U.S. crop trade figures reported here were prepared with the help of Mike Helmar
([email protected]) at the University of Nevada-Reno, Eric Wailes ([email protected]) and
Eddie C. Chavez ([email protected]) at the University of Arkansas and Darren Hudson
([email protected]) at Texas Tech University.
The Agricultural and Food Policy Center at Texas A&M University will prepare a companion set of
estimates of the farm-level impacts of these projections (www.afpc.tamu.edu).
The authors would like to thank participants in a workshop reviewing a preliminary version of these
estimates in Washington in December 2013. Any remaining errors are those of the authors.
Permission is granted to reproduce this information with appropriate attribution to the authors and
FAPRI–MU.
The University of Missouri–Columbia does not discriminate on the basis of race, color, religion, national origin, sex,
sexual orientation, age, disability or status as a qualified protected veteran. For more information, call Human
Resource Services at 573-882-4256 or the US Department of Education, Office of Civil Rights.

Table of contents Summary ................................................................................................................................... 1
Lower crop prices and farm income overview ............................................................................ 3
New farm bill provisions and effects ............................................................................................ 4
Livestock and dairy outlook highlights ........................................................................................ 5
Other highlights: Biofuels, exports and food prices ..................................................................... 6
Policy assumptions under the new farm bill ................................................................................ 7
Crop program participation under the new farm bill .................................................................... 9
Macroeconomic assumptions and farm prices .......................................................................... 11
Corn ......................................................................................................................................... 13
Soybeans ................................................................................................................................ 15
Wheat ..................................................................................................................................... 17
Upland cotton ........................................................................................................................... 19
Sorghum and barley ................................................................................................................. 21
Oats and hay .......................................................................................................................... 23
Rice and sugar ......................................................................................................................... 25
Peanuts and sunflower seed .................................................................................................... 27
Land use .................................................................................................................................. 29
Soybean products .................................................................................................................... 31
Corn products ......................................................................................................................... 33
Ethanol and biofuel policies ..................................................................................................... 35
Biomass-based diesel and biofuel plant returns ...................................................................... 37
Cattle and hogs ....................................................................................................................... 39
Meat ........................................................................................................................................ 41
Dairy ....................................................................................................................................... 43
Food prices and expenditures ................................................................................................. 45
Government costs ................................................................................................................... 47
Payments and crop insurance ................................................................................................. 49
Farm receipts and expenses ................................................................................................... 51
Farm income ........................................................................................................................... 53
Ranges from the 500 alternative futures .................................................................................. 55

FAPRI-MU Report #02-14 - 2014 U.S. Baseline Briefing Book - Page 1
Summary
Larger global crop harvests in 2013 have contributed to a major reversal of fortunes in agricultural markets. Grain prices and crop producer income have dropped sharply, while prices for cattle have reached record levels. Meanwhile, a new farm bill changes the nature of federal support to the farm sector. These baseline projections for agricultural and biofuel markets were prepared based on market information available in January 2014. Macroeconomic assumptions are based on forecasts by IHS Global Insight and suggest moderate growth in the U.S. and global economies. The baseline incorporates many key provisions of the Agricultural Act of 2014 (the new farm bill). In several cases the analysis requires important assumptions about how the bill will be implemented and how people will respond to the new options provided. As more information becomes available, these assumptions and estimates will need to be revisited. The figures reported here represent the average of 500 alternative outcomes based on different assumptions about the weather, oil prices and other factors. In some of the 500 outcomes, prices, quantities and values are much higher or much lower than the reported averages. Some key results: • Prices for most crops are likely to remain below recent peaks. Under average market conditions, projected corn prices over the next ten years are about $4 per bushel and soybeans prices are about $10 per bushel.
• In 2014, projected corn area planted declines by 4 million acres, while the area devoted to soybeans and several other crops increases. Lower prices discourage production on marginal acres, but more normal weather conditions this spring may allow some land that could not be planted in 2013 to return to crop production. • The current policy baseline assumes that the Environmental Protection Agency (EPA) proposal to modify the 2014 Renewable Fuel Standard (RFS) will be adopted and that a similar approach will be used to set biofuel use mandates in subsequent years. Projected growth in ethanol production over the next several years is limited. • Reduced cattle numbers, caused in part by multiple years of drought, limit beef production in 2014 and result in record cattle prices. Cattle prices and returns to cow-calf operators are likely to remain high until herds have a chance to rebuild, which will take time.
• Lower projected feed costs help improve the profitability of livestock production. One uncertainty is the effect of porcine epidemic diarrhea (PED) virus on the pork sector.
• New farm bill provisions include programs that pay farmers only when crop prices or per-acre revenues are below trigger levels. Unlike the old direct payment program that made constant annual payments, the new programs could make no payments in some years and very large payments to producers in other years.
• On average, the projected cost of major commodity programs under the new farm bill is about $5 billion per year, and crop insurance costs average a little over $8 billion per year.
• Net farm income in 2014 is projected to decline by more than $30 billion (24 percent) from the 2013 record, as sharply lower crop prices and reduced government payments more than offset the impact of strong cattle and milk prices and a slight reduction in production costs.
• Food price inflation was less than expected in 2013. Food prices are projected to increase by 2 percent in 2014.

FAPRI-MU Report #02-14 - 2014 U.S. Baseline Briefing Book - Page 2
Key results
2008/09-2012/13 2015/16-2023/24Marketing year average 2013/14 2014/15 average
Crop prices Corn farm price, dollars per bushel 5.18 4.42 4.17 4.00 Soybean farm price, dollars per bushel 11.55 12.57 9.84 9.82 Wheat farm price, dollars per bushel 6.47 6.82 5.55 5.27 Upland cotton farm price, cents per pound 70.6 74.2 67.3 66.2
Crop area planted, million acres Corn 89.9 95.4 91.3 90.7 Soybeans 76.6 76.5 78.7 76.6 Wheat 57.2 56.2 57.0 56.4 Upland cotton 11.1 10.2 10.5 10.5 12 major crops* 256.0 260.1 259.0 256.2
2008-2012 2015-2023Calendar year except as noted average 2013 2014 average
Livestock sector prices Fed steers, 5-area direct, dollars per cwt 101.80 125.89 137.20 126.28 Barrows and gilts, 51-52% lean, dollars per cwt 54.23 64.05 64.25 57.20 National wholesale broiler, cents per pound 81.24 99.70 93.56 91.55 All milk, dollars per cwt 17.31 19.99 20.59 17.86
Biofuel production, billion gallons Ethanol 12.1 13.5 14.4 14.8 Corn starch-based ethanol 11.9 13.1 14.1 14.4 Biomass-based diesel 0.7 1.5 1.3 1.5
Government outlays, billion dollars, fiscal year Commodity Credit Corporation net outlays 9.5 9.2 8.6 7.5 Major commodity programs 6.0 5.3 5.1 5.1 All other CCC net outlays 3.5 3.9 3.5 2.4 Crop insurance net outlays 5.6 13.8 9.7 8.2
Net farm income, billion dollars 90.8 130.5 99.4 91.3
Annual consumer food price inflation 2.9% 1.4% 2.0% 1.7%
*Includes corn, soybeans, wheat, upland cotton, sorghum, barley, oats, rice, peanuts, sunflowers, sugarcane and sugar beets.
Note: The estimates are based on market information available in January 2014 and incorporate provisions of the Agricultural Act of 2014, the new farm bill. Projections are averages across 500 outcomes.

Rebounding from the 2012 U.S. drought, world production of grains and oilseeds increased sharply in 2013. Stocks build as world production exceeds use in the 2013/14 marketing year. Since 1993, production of these crops has increased by about 1 billion metric tons, or more than 50 percent. Larger global supplies of corn, wheat, soybeans and other crops have been a major factor behind the decline in prices from the record levels of 2012/13.
After peaking at $6.89 per bushel for the drought-reduced crop harvested in 2012, projected corn prices for 2014-2018 average $4.08 per bushel. Soybean prices decline from $14.40 per bushel in 2012/13 to $9.76 for 2014-2018. Wheat prices drop from $7.77 per bushel in 2012/13 to $5.37 for 2014-2018. Corn and soybean prices return to very near the 2007-2009 average after four straight years (2010-2013) of below-trend corn yields.
Net farm income reached record levels in 2013 in nominal terms and hit the highest level since the 1970s in inflation-corrected, real terms. Lower crop prices contribute to a sharp reduction in net farm income in 2014, even though most livestock producers should experience a more profitable year. Projected farm income declines further in subsequent years but remains above the levels of 2006-2011, in part because of a moderation in production expenses.
Lower crop prices and farm income
FAPRI-MU Report #02-14 - 2014 U.S. Baseline Briefing Book - Page 3
World grain and oilseed production rebounds
1.6
1.8
2.0
2.2
2.4
2.6
2.8
3.0
93/94 97/98 01/02 05/06 09/10 13/14
Marketing yearBi
llion
met
ric to
ns
Production Use
Crop prices fall back to 2007-2009 levels
02468
10121416
06/07 08/09 10/11 12/13 14/15 16/17 18/19
Marketing year
Dolla
rs p
er b
ushe
l
Soybeans Wheat Corn
Net farm income declines from 2013 record
99.4
130.5
0
20
40
60
80
100
120
140
2006 2008 2010 2012 2014 2016 2018
Calendar year
Billio
n do
llars

The baseline incorporates provisions of the Agricultural Act of 2014, the new farm bill. For crop producers, this includes the elimination of direct and countercyclical (DCP) payments and the average crop revenue election (ACRE) program. It also includes the creation of two new options, price loss coverage (PLC) and agriculture risk coverage (ARC), as well as new crop insurance policies and more. The new PLC and ARC programs cost little when crop prices and revenues are high, but could make large payments when prices or revenues are low. Given all of the assumptions of the baseline, average PLC and ARC payments for the 2014-18 crops are just under $5 billion per year. ARC spending is greatest in 2014 and 2015 but declines in later years as the moving averages that determine benchmark revenues adjust.
Crop insurance budgetary costs reached record highs in fiscal year (FY) 2013 because of the 2012 drought. Lower prices reduce the value of crops insured and thus of premium subsidies. Offsetting this effect is the impact of new crop insurance options. Net CCC outlays (covering commodity programs, the conservation reserve and other programs) dip in FY 2015 but rebound to about $8 billion per year.
New farm bill provisions and effects
FAPRI-MU Report #02-14 - 2014 U.S. Baseline Briefing Book - Page 4
Baseline incorporates new farm bill provisions
0.000.501.001.502.002.503.003.504.00
06/07 08/09 10/11 12/13 14/15 16/17 18/19
Marketing yearDo
llars
per
bus
hel
Corn target/reference Corn loan Corn direct payment
New crop payments replace DCP and ACRE
012345678
06/07 08/09 10/11 12/13 14/15 16/17 18/19
Marketing year
Billio
n do
llars
DCP and ACRE PLC ARC
Crop insurance costs can exceed CCC net outays
02468
10121416
2007 2009 2011 2013 2015 2017 2019
Fiscal year
Billio
n do
llars
CCC net outlays Crop insurance net outlays

Livestock producers have faced sharply higher input costs in recent years. Higher feed prices have contributed most to higher livestock production costs, although higher energy prices and land values have also played a role. As input costs decline over the next couple of years, the prospects for improved profitability brighten for many operations.
Total meat production in 2013 was lower than the 2008 level. As feed costs decline, chicken and pork producers are able to increase production more quickly than beef producers. It will take years for beef production to increase in response to higher profitability. Animals held back from market allow inventory numbers to grow, leading to a sharp decline in 2014 beef production.
The monthly choice boxed beef cutout value topped $2.40 per pound in January 2014, which is an increase of more than 25 percent from the January 2013 level. Wholesale pork and chicken prices are expected to decline modestly through 2015 due to higher domestic availability. International dairy product prices are also near record levels in early 2014, leading to expectations of strong U.S. dairy prices.
Livestock and dairy outlook highlights
Beef prices reach record highs
$0.40$0.60$0.80$1.00$1.20$1.40$1.60$1.80$2.00$2.20$2.40
2001 2003 2005 2007 2009 2011 2013 2015
Dolla
rs p
er p
ound
Boxed beef Pork cutout Chicken
FAPRI-MU Report #02-14 - 2014 U.S. Baseline Briefing Book - Page 5
Input costs continue to decline
80
100
120
140
160
180
200
220
2001 2003 2005 2007 2009 2011 2013 2015In
dex,
199
5-20
00 =
100
Cow-calf Farrow-finish Milk
Meat production growth varies by species in 2014
-6-5-4-3-2-101234
2001-08 2009-12 2013 2014 2015 2016-23
Perc
ent c
hang
e
Beef Pork Chicken
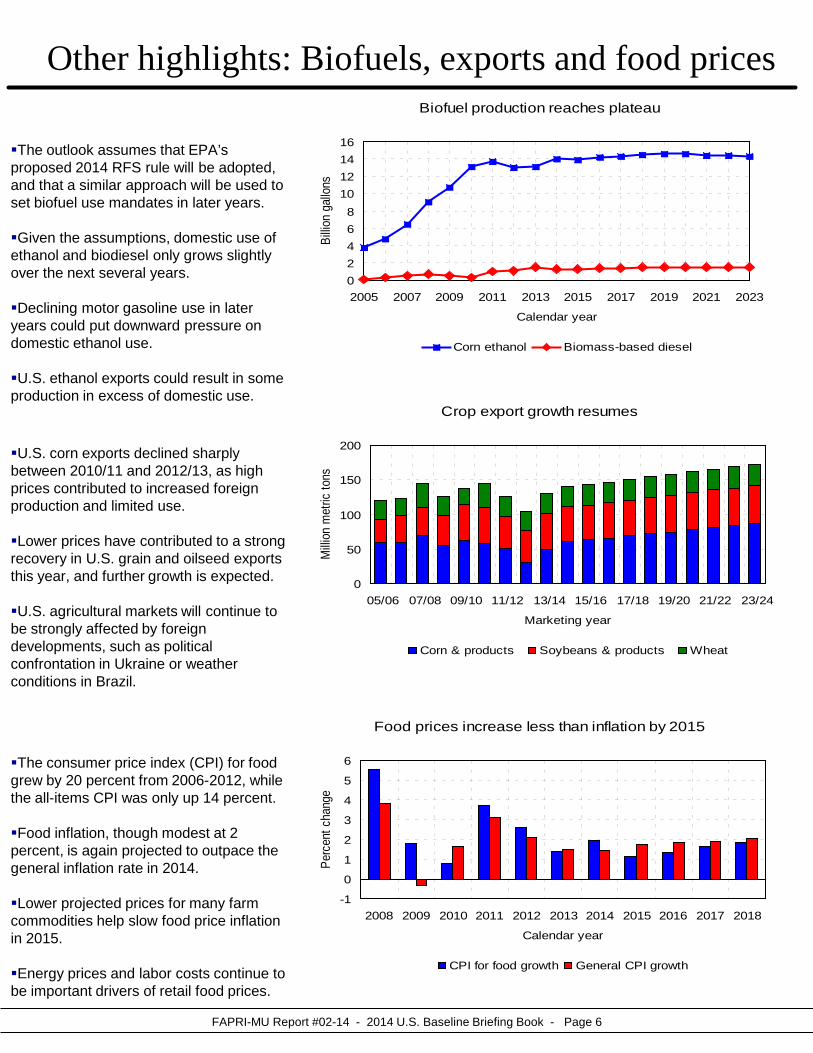
U.S. corn exports declined sharply between 2010/11 and 2012/13, as high prices contributed to increased foreign production and limited use. Lower prices have contributed to a strong recovery in U.S. grain and oilseed exports this year, and further growth is expected. U.S. agricultural markets will continue to be strongly affected by foreign developments, such as political confrontation in Ukraine or weather conditions in Brazil.
The consumer price index (CPI) for food grew by 20 percent from 2006-2012, while the all-items CPI was only up 14 percent. Food inflation, though modest at 2 percent, is again projected to outpace the general inflation rate in 2014. Lower projected prices for many farm commodities help slow food price inflation in 2015. Energy prices and labor costs continue to be important drivers of retail food prices.
Other highlights: Biofuels, exports and food prices
The outlook assumes that EPA’s proposed 2014 RFS rule will be adopted, and that a similar approach will be used to set biofuel use mandates in later years. Given the assumptions, domestic use of ethanol and biodiesel only grows slightly over the next several years. Declining motor gasoline use in later years could put downward pressure on domestic ethanol use. U.S. ethanol exports could result in some production in excess of domestic use.
FAPRI-MU Report #02-14 - 2014 U.S. Baseline Briefing Book - Page 6
Food prices increase less than inflation by 2015
-1
0
1
2
3
4
5
6
2008 2009 2010 2011 2012 2013 2014 2015 2016 2017 2018
Calendar year
Perc
ent c
hang
e
CPI for food growth General CPI growth
Biofuel production reaches plateau
02468
10121416
2005 2007 2009 2011 2013 2015 2017 2019 2021 2023
Calendar yearBi
llion
gallo
nsCorn ethanol Biomass-based diesel
Crop export growth resumes
0
50
100
150
200
05/06 07/08 09/10 11/12 13/14 15/16 17/18 19/20 21/22 23/24
Marketing year
Milli
on m
etric
tons
Corn & products Soybeans & products Wheat

ARC is the other new option for grain and oilseed producers. Payments occur when county or farm-level revenues per acre fall below 86 percent of a benchmark. The benchmark depends on moving five-year Olympic averages of national prices and county or farm yields. For illustration purposes only, the chart uses national average soybean prices and yields. With these assumptions, payments would occur in 2014/15 and 2015/16, but not in later years.
Under the previous farm bill, up to 32 million acres could be enrolled in the conservation reserve. The new farm bill reduces that cap in steps to 24 million acres by 2017. Actual enrollment was far below the legislated cap in 2012 and 2013. Projected enrollment is near the new limit.
Policy assumptions under the new farm bill Reference prices exceed old target prices
0123456789
08/09 10/11 12/13 14/15 16/17 18/19
Marketing yearDo
llars
per
bus
hel
Soybeans Wheat Corn
The new farm bill eliminates the DCP and ACRE programs and creates several new programs. PLC is one new option for grain and oilseed producers. Participating producers receive a payment when national season-average farm prices fall below fixed reference prices. The new reference prices are higher than the target prices that were used in calculating countercyclical payments under the previous farm bill.
Conservation reserve cap is reduced
05
10152025303540
2008 2010 2012 2014 2016 2018
Year
Milli
on a
cres
CRP cap Enrolled area
FAPRI-MU Report #02-14 - 2014 U.S. Baseline Briefing Book - Page 7
ARC benchmarks depend on moving averages
0
100
200
300
400
500
600
700
08/09 10/11 12/13 14/15 16/17 18/19
Marketing year
Dolla
rs p
er a
cre
Soybean revenue/a. 86% of benchmark

FAPRI-MU Report #02-14 - 2014 U.S. Baseline Briefing Book - Page 8
Selected policy assumptions, 2014-23
Policy Description
Direct payments Not available for 2014 and subsequent crop years
Countercyclical payments Not available for 2014 and subsequent crop years
ACRE program Not available for 2014 and subsequent crop years
Price loss coverage Makes payments when season average price falls below fixed reference prices: (PLC) Corn $3.70/bu.
Soybeans $8.40/bu.Wheat $5.50/bu.Rice $14.00/cwt ($16.10/cwt for Japonica)Sorghum $3.95/bu.Barley $4.95/bu.Oats $2.40/bu.Peanuts $535/tonSunflowers 20.15 cents/lb.Cotton not available
Paid on 85% of base acreage and program yields
Agriculture Risk Coverage Makes payments when county or farm per-acre revenues fall below 86% of a benchmark (ARC) County option benchmark: 5-year Olympic average price multiplied by 5-year Olympic average yield
Farm option benchmark: 5-year Olympic average of weighted farm revenue per acreMaximum payment is 10% of benchmark valuePaid on 85% (county option) or 65% (farm option) of base acreageAlternative to price loss coverageAvailable for program crops (not upland cotton)
Marketing loan program Continues 2008 farm bill provisions for crops other than upland cotton
Supplemental coverage option Available for PLC participants beginning in 2015Area crop insurance available in addition to conventional insuranceCovers range between 86% and individual coverage level65% of premium subsidized
Upland cotton Stacked income protection program (STAX)Area crop insurance availabe in addition to conventional insurance80% of premium subsidized
Transition payment in 2014 (STAX not available until 2015)Loan rate varies in range dependng on recent world cotton pricesNo cotton PLC or ARC programsFormer cotton base eligible for PLC or ARC if planted to other crops
Sugar Continues 2008 farm bill provisions
Conservation reserve Caps conservation reserve acreage at 24 million acres by 2017
Dairy Margin insurance program establishedMILC not available after new margin program beginsDairy product price support program not available for 2014 and subsequent years

The story for soybeans is similar, although expected ARC payments exceed PLC payments for the first four years. Producers would also need to consider possible SCO benefits, which are only available to PLC participants. Producers can enroll in the county-based ARC program, which pays on 85 percent of base area, or in the farm-based ARC, which considers all program crops on a farm and pays on 65 percent of base area.
Changing market circumstances, final sign-up rules and many other factors will affect producer enrollment choices. Based in part on projected average payments, the baseline assumes most producers of wheat, sorghum, rice, barley and peanuts will enroll in PLC. For soybeans and corn, assumed enrollment is split more evenly between ARC and PLC. Of those enrolled in ARC, three-fourths are assumed to choose the county-based option.
Crop program participation under the new farm bill Paths differ for projected average corn payments
0
5
10
15
20
25
30
14/15 15/16 16/17 17/18 18/19
Marketing yearDo
llars
per
acr
e
ARC PLC
Under the new farm bill, producers must make a one-time choice to participate in ARC or PLC for the 2014-2018 crops. Estimated national average ARC payments for corn producers exceed PLC payments in 2014/15 and 2015/16, but the opposite is true in later years. This suggests some corn producers may face a difficult choice. PLC participants also have the option of purchasing Supplemental Coverage Option (SCO) beginning in 2015/16.
More PLC enrollment assumed for most crops
0%10%20%30%40%50%60%70%80%90%
100%
Soybeans Corn Wheat Sorghum Rice, barley,peanuts
PLC County ARC Farm ARC
FAPRI-MU Report #02-14 - 2014 U.S. Baseline Briefing Book - Page 9
Projected soybean payments also differ
0
5
10
15
20
14/15 15/16 16/17 17/18 18/19
Marketing year
Dolla
rs p
er a
cre
ARC PLC

FAPRI-MU Report #02-14 - 2014 U.S. Baseline Briefing Book - Page 10
ARC
PLC County Farm SCO** STAX**
Corn 50.0% 37.5% 12.5% 25.0% n.a.
Soybeans 40.0% 45.0% 15.0% 20.0% n.a.
Wheat 70.0% 22.5% 7.5% 35.0% n.a.
Upland cotton n.a. n.a. n.a. 0.0% 95.0%
Sorghum 80.0% 15.0% 5.0% 40.0% n.a.
Barley 90.0% 7.5% 2.5% 45.0% n.a.
Rice 90.0% 7.5% 2.5% 45.0% n.a.
Peanuts 90.0% 7.5% 2.5% 45.0% n.a.
*PLC and ARC are percent of base acres. SCO and STAX are percent of planted acres.
**SCO and STAX are assumed to not be available until 2015
Payments per participating acre, 2014-18 average
Average
ARC PLC SCO* STAX*
Corn 20.91 22.24 8.94 n.a.
Soybeans 16.21 12.58 5.09 n.a.
Wheat 9.84 16.27 3.84 n.a.
Upland cotton n.a. n.a. n.a. 22.60
Sorghum 8.16 19.62 3.14 n.a.
Barley 10.76 30.54 4.10 n.a.
Rice 8.44 53.54 12.90 n.a.
Peanuts 19.76 60.63 ** n.a.
*SCO and STAX are averaged from 2015-18 and are calculated as change in net
indemnities per acre. This may include other non-SCO and non-STAX effects.
**Peanut net indemnities are not explicitly represented in the model.
Participation rate assumptions*

Oil and natural gas prices both fell in the recession. Since then, oil prices have recovered to new peaks, while natural gas prices have declined. IHS Global Insight forecasts lower oil prices for 2014 and 2015 but then modest increases in later years. Natural gas prices remain well below pre-recession levels. The 500 alternative outcomes examined consider a range of energy prices.
Fertilizer prices fell during 2013 and further declines are projected for 2014 and 2015. Continued low natural gas prices have reduced the cost of producing nitrogen fertilizer. Lower fuel and feed prices also contribute to a dip in the PPI for farm production items in 2014 and 2015, and the rate of increase in later years is modest.
Macroeconomic assumptions and farm prices paid U.S. economic growth expected to accelerate
-4-3-2-1012345
2007 2009 2011 2013 2015 2017 2019 2021 2023Pe
rcen
t
Real GDP growth 3-mo. Treasury bill CPI inflation
IHS Global Insight forecasted in January that U.S. real GDP growth would accelerate, averaging about 3 percent per year for the next five years. The unemployment rate continues to decline slowly. Short-term interest rates increase in 2016 and reach pre-recession levels in 2017. Inflation is forecast to remain low.
Lower fertilizer prices reduce farm production costs
100
150
200
250
300
350
400
450
2007 2009 2011 2013 2015 2017 2019 2021 2023
Inde
x, 1
990-
92=1
00
All production items Fertilizer Fuel
FAPRI-MU Report #02-14 - 2014 U.S. Baseline Briefing Book - Page 11
Oil and natural gas prices follow separate paths
0
20
40
60
80
100
120
2007 2009 2011 2013 2015 2017 2019 2021 2023
Dolla
rs p
er b
arre
l
0
2
4
6
8
10
12
Dolla
rs p
er m
illion
BTU
Refiners' acquisition oil Henry Hub natural gas

FAPRI-MU Report #02-14 - 2014 U.S. Baseline Briefing Book - Page 12
Macroeconomic assumptions
Calendar year 2013 2014 2015 2016 2017 2018 2019 2020 2021 2022 2023
Real GDP growth (Percentage change from previous year) United States 1.9 2.7 3.2 3.4 3.2 2.8 2.7 2.5 2.3 2.3 2.3 China 7.7 8.1 8.3 7.6 7.1 6.7 7.1 6.9 6.8 6.5 6.2 World 2.5 3.3 3.8 3.9 3.9 3.7 3.8 3.7 3.7 3.7 3.6Population growth United States 0.8 0.8 0.8 0.8 0.8 0.8 0.8 0.8 0.8 0.7 0.7 World 1.1 1.1 1.1 1.1 1.1 1.0 1.0 1.0 1.0 0.9 0.9U.S . CPI, all urban consumers 1.5 1.4 1.8 1.8 1.9 2.0 1.9 2.0 2.1 1.9 1.9
(Percent)U.S . unemployment rate 7.4 6.5 5.9 5.4 5.1 5.0 5.0 4.9 5.0 5.1 5.13-month Treasury bill rate 0.1 0.1 0.4 2.2 3.6 3.7 3.7 3.7 3.7 3.7 3.7Aaa corporate bond rate 4.2 4.8 4.9 5.5 6.1 6.2 6.2 6.2 6.2 6.2 6.2
Petroleum prices (Dollars per barrel) West Texas intermediate 97.97 97.86 94.64 94.89 97.31 100.28 102.82 105.56 108.33 110.28 112.27 Refiners' acquisition cost 102.07 97.96 93.61 93.73 96.27 98.82 100.82 103.04 105.37 107.20 109.09
Natural gas price (Dollars per million BTU) Henry Hub 3.66 3.69 4.17 4.49 4.21 3.85 3.66 4.13 5.07 4.62 4.43
Exchange rates (Currency per dollar) Euro 0.75 0.77 0.77 0.75 0.74 0.73 0.72 0.72 0.71 0.71 0.71 Chinese yuan 6.15 6.01 5.84 5.73 5.65 5.57 5.50 5.44 5.42 5.43 5.45
Source: IHS Global Insight, Jan. 2014
Indices of prices paid by farmers
Calendar year 2013 2014 2015 2016 2017 2018 2019 2020 2021 2022 2023
Production items, interest, (1990-92=100)taxes and wages 225 218 215 218 221 224 228 232 238 242 246 Production items 231 221 216 218 220 223 226 230 236 239 242
Feed 255 207 186 185 185 185 186 185 184 183 182 Livestock & poultry 171 185 181 174 171 167 166 167 170 171 174 Seeds 378 381 381 382 386 393 400 410 420 426 433 Fertilizer 307 278 263 267 268 270 271 277 289 293 297
Mixed fertilizer 280 258 245 248 250 251 252 258 268 272 275Nitrogen fertilizer 322 284 267 271 272 275 275 282 295 300 304Potash and phosph. 344 290 277 281 283 284 286 292 302 306 309
Agricultural chemicals 157 157 160 164 167 170 172 177 182 183 186 Fuels 357 347 340 339 343 352 360 369 379 385 391 Supplies & repairs 172 174 178 182 186 190 194 199 204 208 212 Autos & trucks 120 121 122 124 126 128 129 131 134 135 137 Farm machinery 264 270 274 280 287 294 301 310 319 326 335 Building material 179 182 186 190 193 195 197 201 204 206 208 Farm services 171 172 174 178 182 186 190 196 203 208 213
Interest* 143 151 158 173 188 194 196 201 206 209 213 Taxes** 234 239 246 253 257 261 266 273 281 286 292 Wage rates 206 210 216 222 229 236 244 252 259 267 275
*Interest per acre on farm real estate debt and interest rate on farm non-real estate debt.**Farm real estate taxes payable per acre.

U.S. corn production increased by 3 billion bushels in 2013, as yields recovered from the drought-reduced levels of 2012. In 2014, projected production declines slightly, as an increase in average yields is more than offset by lower area planted. In spite of the reduction in corn production in 2014, total corn supplies increase because of larger carry-in stocks. These increased supplies contribute to lower corn prices in 2013/14 and 2014/15.
High prices caused by the drought resulted in reduced use of corn during the 2012/13 marketing year. Much lower prices allow all major categories of corn use and ending stocks to rebound in 2013/14. Lower-priced corn and growing demand from China and other markets contributes to steady growth in U.S. corn exports. Ethanol and coproduct use of corn is fairly stable, given assumptions about biofuel policy and energy markets.
High corn prices and large insurance net indemnities (payments for losses minus producer-paid premiums) resulted in record per-acre income in 2012/13. Lower prices reduce market revenues in 2013/14 and 2014/15. Variable expenses (which exclude land costs) decline in 2014/15 with lower fertilizer prices. Projected farm program payments are small relative to corn market receipts.
Corn
Corn returns decline from recent peak
0
200
400
600
800
1,000
1,200
07/08 09/10 11/12 13/14 15/16 17/18 19/20 21/22 23/24
September-August marketing year
Dolla
rs p
er a
cre
Market Program paymentsIns. net indemnities Variable expenses
Corn supplies rebound, weigh on prices
02468
1012141618
07/08 09/10 11/12 13/14 15/16 17/18 19/20 21/22 23/24
September-August marketing yearBi
llion
bush
els
Production Beginning stocks Imports
Corn use rebounds with lower prices
01234567
07/08 09/10 11/12 13/14 15/16 17/18 19/20 21/22 23/24
September-August marketing year
Billio
n bu
shels
Feed & residual Ethanol & coproductsExports Ending stocks
FAPRI-MU Report #02-14 - 2014 U.S. Baseline Briefing Book - Page 13

FAPRI-MU Report #02-14 - 2014 U.S. Baseline Briefing Book - Page 14
Corn supply and use
September-August year 13/14 14/15 15/16 16/17 17/18 18/19 19/20 20/21 21/22 22/23 23/24
Area (Million acres) Planted area 95.4 91.3 90.6 91.1 91.0 91.3 91.2 90.8 90.5 90.1 89.9 Harvested area 87.7 83.4 82.8 83.2 83.1 83.3 83.3 82.9 82.6 82.3 82.1
(Bushels per harvested acre)Yield 158.8 163.5 165.6 167.8 169.8 171.7 173.7 175.8 177.6 179.4 181.2
(Million bushels)Supply 14,781 15,338 15,577 15,884 16,095 16,324 16,518 16,667 16,817 16,949 17,106 Beginning stocks 821 1,665 1,828 1,883 1,949 1,980 2,012 2,047 2,103 2,135 2,176 Production 13,925 13,638 13,714 13,965 14,111 14,308 14,471 14,585 14,678 14,778 14,895 Imports 35 35 35 35 35 35 35 35 35 35 35
Domestic use 11,669 11,635 11,718 11,834 11,909 11,996 12,036 12,022 12,012 11,995 11,985 Feed and residual 5,264 5,134 5,177 5,228 5,250 5,283 5,310 5,343 5,369 5,373 5,395 Ethanol and coproducts 5,007 5,081 5,112 5,170 5,214 5,259 5,267 5,215 5,171 5,142 5,103 HFCS 500 507 507 508 510 511 511 510 509 510 511 Seed 24 23 23 23 24 23 23 23 23 23 23 Food and other 875 890 898 905 912 918 925 932 939 946 953
Exports 1,447 1,875 1,976 2,100 2,205 2,316 2,435 2,541 2,669 2,778 2,883
Total use 13,116 13,510 13,694 13,935 14,114 14,312 14,471 14,564 14,682 14,773 14,868
Ending stocks 1,665 1,828 1,883 1,949 1,980 2,012 2,047 2,103 2,135 2,176 2,238 CCC inventory 0 0 0 0 0 0 0 0 0 0 0 Under loan 88 130 149 160 164 165 170 181 183 192 198 Other stocks 1,577 1,698 1,735 1,788 1,817 1,847 1,877 1,922 1,952 1,984 2,040
Prices, program provisions (Dollars per bushel) Farm price 4.42 4.17 4.09 4.07 4.06 4.04 4.02 3.97 3.93 3.92 3.87 Loan rate 1.95 1.95 1.95 1.95 1.95 1.95 1.95 1.95 1.95 1.95 1.95 Target/reference price 2.63 3.70 3.70 3.70 3.70 3.70 3.70 3.70 3.70 3.70 3.70 Direct payment rate 0.28 n.a. n.a. n.a. n.a. n.a. n.a. n.a. n.a. n.a. n.a.
(Million acres) Base area + allocated generic 84.4 87.8 87.8 87.8 87.8 87.9 87.9 87.9 87.9 87.9 87.9
(Percent) PLC participation rate n.a. 50.0 50.0 50.0 50.0 50.0 50.0 50.0 50.0 50.0 50.0 ARC participation rate n.a. 50.0 50.0 50.0 50.0 50.0 50.0 50.0 50.0 50.0 50.0
Returns and payments (Dollars) Gross market revenue/a. 701.60 676.19 669.16 673.64 680.99 685.30 690.66 690.37 691.08 694.65 693.86 Variable expenses/a. 354.48 338.29 333.37 334.56 338.15 342.55 347.08 353.82 363.44 370.06 374.88 Market net return/a. 347.12 337.89 335.79 339.08 342.84 342.75 343.58 336.55 327.64 324.59 318.98 Marketing loan benefits/a.* 0.00 0.04 0.05 0.43 0.19 0.84 0.57 1.12 0.50 0.86 1.62 DCP payments/base a.* 21.66 n.a. n.a. n.a. n.a. n.a. n.a. n.a. n.a. n.a. n.a. ACRE/planted a.* 2.22 n.a. n.a. n.a. n.a. n.a. n.a. n.a. n.a. n.a. n.a. Payments to participants PLC/base a.* n.a. 13.51 21.29 25.22 25.72 25.44 27.00 29.83 30.25 32.91 34.59 ARC/base a.* n.a. 24.65 27.14 24.20 15.63 12.94 13.28 13.60 14.36 14.92 15.34 Insurance net indemnities/a.* 42.20 22.41 23.25 23.37 23.42 23.94 23.87 23.82 23.89 24.03 24.50
*Marketing loan benefits, DCP payments, ACRE payments and insurance net indemnities are averaged across all acres. PLC and ARC payments are perparticipating acre. All projections are averages across 500 stochastic outcomes.

Soybean production increased in 2013 as yields rebounded from 2012 drought-reduced levels. Given strong soybean prices relative to corn, soybean acreage is projected to increase in 2014. If soybean yields also increase in 2014, there could be another significant increase in soybean production. Combined with large supplies from South America, the result is sharply lower projected soybean prices.
Strong demand from China has contributed to a rebound in soybean exports in 2013/14. One important uncertainty is how lower prices will affect production by competing exporters. Domestic soybean crush also increases slowly over time in response to rising demand for U.S. soybean meal and soybean oil.
High prices led to record levels of soybean returns per acre in 2012/13. In 2013/14, the decline in returns is fairly small as higher yields offset part of the effect of lower prices. The projected decline in soybean prices in 2014/15 results in much lower returns per acre.
Soybeans
Soybean exports and crush both grow
0.0
0.5
1.0
1.5
2.0
2.5
07/08 09/10 11/12 13/14 15/16 17/18 19/20 21/22 23/24
September-August marketing year
Billio
n bu
shels
Crush Exports Ending stocks
Soybean returns fall from 2012/13 record
-1000
100200300400500600700
07/08 09/10 11/12 13/14 15/16 17/18 19/20 21/22 23/24
September-August marketing year
Dolla
rs p
er a
cre
Market Program paymentsIns. net indemnities Variable expenses
Soybean production increases in 2013 and 2014
2.0
2.5
3.0
3.5
4.0
07/08 09/10 11/12 13/14 15/16 17/18 19/20 21/22 23/24
September-August marketing year Bi
llion
bush
elsProduction Total use
FAPRI-MU Report #02-14 - 2014 U.S. Baseline Briefing Book - Page 15

FAPRI-MU Report #02-14 - 2014 U.S. Baseline Briefing Book - Page 16
Soybean supply and use
September-August year 13/14 14/15 15/16 16/17 17/18 18/19 19/20 20/21 21/22 22/23 23/24
Area (Million acres) Planted area 76.5 78.7 75.7 76.0 76.5 76.3 76.6 76.8 77.0 77.2 77.3 Harvested area 75.9 77.7 74.8 75.1 75.5 75.3 75.6 75.8 76.0 76.2 76.3
(Bushels per harvested acre)Yield 43.3 44.6 45.1 45.6 46.1 46.5 46.9 47.3 47.8 48.1 48.6
(Million bushels)Supply 3,454 3,630 3,622 3,676 3,734 3,762 3,808 3,853 3,893 3,936 3,978 Beginning stocks 141 144 224 228 231 239 237 238 239 242 249 Production 3,289 3,461 3,373 3,423 3,478 3,498 3,545 3,590 3,629 3,669 3,704 Imports 25 25 25 25 25 25 25 25 25 25 25
Domestic use 1,809 1,873 1,899 1,933 1,959 1,983 2,006 2,029 2,053 2,074 2,098 Crush 1,699 1,745 1,771 1,802 1,826 1,848 1,869 1,890 1,911 1,931 1,952 Seed and residual 110 128 128 131 133 135 137 139 141 143 145
Exports 1,501 1,533 1,495 1,512 1,536 1,542 1,564 1,585 1,598 1,613 1,631
Total use 3,310 3,406 3,394 3,445 3,495 3,525 3,570 3,614 3,650 3,687 3,729
Ending stocks 144 224 228 231 239 237 238 239 242 249 248 CCC inventory 0 0 0 0 0 0 0 0 0 0 0 Under loan 7 30 32 35 37 38 38 38 40 42 42 Other stocks 137 194 195 196 201 200 200 200 203 207 207
Prices, program provisions (Dollars per bushel) Farm price 12.57 9.84 9.80 9.68 9.68 9.77 9.85 9.87 9.94 9.89 9.88 Illinois processor price 12.98 10.33 10.29 10.18 10.17 10.26 10.34 10.36 10.42 10.37 10.37 Loan rate 5.00 5.00 5.00 5.00 5.00 5.00 5.00 5.00 5.00 5.00 5.00 Target/reference price 6.00 8.40 8.40 8.40 8.40 8.40 8.40 8.40 8.40 8.40 8.40 Direct payment rate 0.44 n.a. n.a. n.a. n.a. n.a. n.a. n.a. n.a. n.a. n.a.
(Million acres) Base area + allocated generic 50.2 53.1 53.0 53.1 53.1 53.1 53.1 53.1 53.1 53.2 53.2
(Percent) PLC participation rate n.a. 40.0 40.0 40.0 40.0 40.0 40.0 40.0 40.0 40.0 40.0 ARC participation rate n.a. 60.0 60.0 60.0 60.0 60.0 60.0 60.0 60.0 60.0 60.0
Returns and payments (Dollars) Gross market revenue/a. 545.04 434.86 438.01 437.57 442.00 450.31 457.67 462.87 470.47 471.35 475.84 Variable expenses/a. 154.05 153.27 152.73 153.79 155.69 158.33 161.16 164.78 169.17 172.11 174.56 Market net return/a. 390.99 281.58 285.28 283.78 286.31 291.98 296.51 298.09 301.30 299.25 301.27 Marketing loan benefits/a.* 0.00 0.00 0.51 0.46 0.35 1.15 0.11 0.37 0.40 0.99 0.34 DCP payments/base a.* 10.26 n.a. n.a. n.a. n.a. n.a. n.a. n.a. n.a. n.a. n.a. ACRE/planted a.* 0.28 n.a. n.a. n.a. n.a. n.a. n.a. n.a. n.a. n.a. n.a. Payments to participants PLC/base a.* n.a. 9.03 11.56 13.52 14.56 14.22 14.34 12.07 13.20 14.68 12.49 ARC/base a.* n.a. 17.69 18.96 18.18 15.06 11.14 8.95 9.03 9.08 9.62 9.26 Insurance net indemnities/a.* 5.43 15.73 14.73 15.26 15.38 15.56 16.10 16.35 16.63 17.05 17.37
(Dollars per bushel)Crush margin 1.73 1.60 1.65 1.71 1.68 1.68 1.67 1.65 1.65 1.62 1.62
*Marketing loan benefits, DCP payments, ACRE payments and insurance net indemnities are averaged across all acres. PLC and ARC payments are perparticipating acre. All projections are averages across 500 stochastic outcomes.

Wheat production declined in 2013, as 11 million planted acres were not harvested. Projected wheat production averages about 2.2 billion bushels for the next several years, but will vary based on weather and market conditions. Imports have increased, in part because of changes in Canadian regulations.
U.S. wheat exports have increased in 2013/14, but could be under pressure in 2014/15 from competing international supplies of wheat and low corn prices. After peaking in 2012/13, lower corn prices reduce domestic feed use of wheat. Food use of wheat increases with population.
The combination of near-record yields and record prices resulted in record wheat market receipts per acre in 2012/13. Record yields per harvested acre offset part of the effect of lower wheat prices in 2013/14. Sharply lower prices reduce returns in 2014/15. Prices may fall to levels that trigger benefits to PLC participants.
Wheat
Wheat exports increase in 2013/14, then recede
0.0
0.2
0.4
0.6
0.8
1.0
1.2
1.4
07/08 09/10 11/12 13/14 15/16 17/18 19/20 21/22 23/24
June-May marketing year
Billio
n bu
shels
Exports Food use Feed & residual
Wheat returns decline with lower prices in 2014/15
050
100150200250300350400
07/08 09/10 11/12 13/14 15/16 17/18 19/20 21/22 23/24
June-May marketing year
Dolla
rs p
er a
cre
Market Program paymentsIns. net indemnities Variable expenses
FAPRI-MU Report #02-14 - 2014 U.S. Baseline Briefing Book - Page 17
Wheat supplies show little trend
0.0
0.5
1.0
1.5
2.0
2.5
3.0
3.5
07/08 09/10 11/12 13/14 15/16 17/18 19/20 21/22 23/24
June-May marketing yearBi
llion
bush
els
Production Beginning stocks Imports

FAPRI-MU Report #02-14 - 2014 U.S. Baseline Briefing Book - Page 18
Wheat supply and use
June-May year 13/14 14/15 15/16 16/17 17/18 18/19 19/20 20/21 21/22 22/23 23/24
Area (Million acres) Planted area 56.2 57.0 57.0 56.5 56.7 56.6 56.4 56.2 56.2 56.1 56.2 Harvested area 45.2 48.1 48.3 47.9 47.9 47.7 47.5 47.4 47.3 47.3 47.3
(Bushels per harvested acre)Yield 47.2 45.7 46.0 46.4 46.8 47.1 47.4 47.8 48.1 48.4 48.7
(Million bushels)Supply 3,007 2,964 3,040 3,067 3,096 3,110 3,123 3,136 3,150 3,168 3,187 Beginning stocks 718 611 666 697 703 711 719 720 723 726 732 Production 2,130 2,203 2,225 2,222 2,245 2,251 2,256 2,266 2,278 2,292 2,305 Imports 160 150 148 148 148 148 148 149 149 150 150
Domestic use 1,277 1,229 1,245 1,256 1,267 1,278 1,291 1,299 1,306 1,313 1,319 Feed and residual 252 196 203 207 210 213 218 218 218 217 216 Seed 74 75 74 75 75 75 75 75 75 75 75 Food and other 950 958 967 975 983 991 998 1,006 1,013 1,021 1,028
Exports 1,120 1,069 1,098 1,108 1,118 1,113 1,112 1,114 1,118 1,123 1,134
Total use 2,397 2,298 2,343 2,364 2,385 2,391 2,403 2,413 2,424 2,436 2,453
Ending stocks 611 666 697 703 711 719 720 723 726 732 734 CCC inventory 0 0 0 0 0 0 0 0 0 0 0 Under loan 12 27 32 32 33 34 35 35 35 36 36 Other stocks 599 639 665 670 678 685 686 688 691 696 698
Prices, program provisions (Dollars per bushel) Farm price 6.82 5.55 5.37 5.32 5.31 5.28 5.26 5.25 5.23 5.23 5.21 Loan rate 2.94 2.94 2.94 2.94 2.94 2.94 2.94 2.94 2.94 2.94 2.94 Target/reference price 4.17 5.50 5.50 5.50 5.50 5.50 5.50 5.50 5.50 5.50 5.50 Direct payment rate 0.52 n.a. n.a. n.a. n.a. n.a. n.a. n.a. n.a. n.a. n.a.
(Million acres) Base area + allocated generic 73.8 75.9 76.0 76.0 76.0 76.0 76.0 76.0 76.0 76.1 76.1
(Percent) PLC participation rate n.a. 70.0 70.0 70.0 70.0 70.0 70.0 70.0 70.0 70.0 70.0 ARC participation rate n.a. 30.0 30.0 30.0 30.0 30.0 30.0 30.0 30.0 30.0 30.0
Returns and payments (Dollars) Gross market revenue/a. 321.60 253.17 245.82 246.03 247.75 247.71 248.08 249.70 250.87 252.37 252.72 Variable expenses/a. 130.32 123.77 122.34 123.13 124.99 127.09 128.97 131.76 135.48 137.92 140.07 Market net return/a. 191.28 129.40 123.49 122.90 122.76 120.61 119.11 117.93 115.40 114.45 112.65 Marketing loan benefits/a.* 0.00 0.03 0.39 0.71 0.63 0.73 0.71 0.52 0.65 0.77 0.86 DCP payments/base a.* 13.56 n.a. n.a. n.a. n.a. n.a. n.a. n.a. n.a. n.a. n.a. ACRE/planted a.* 0.02 n.a. n.a. n.a. n.a. n.a. n.a. n.a. n.a. n.a. n.a. Payments to participants PLC/base a.* n.a. 10.24 17.11 17.28 17.93 18.79 19.88 19.99 19.74 20.93 20.38 ARC/base a.* n.a. 10.10 11.26 11.33 9.21 7.30 6.60 6.68 6.74 7.05 7.09 Insurance net indemnities/a.* 26.69 14.29 14.30 14.29 14.33 14.45 14.51 14.53 14.69 14.85 15.14
*Marketing loan benefits, DCP payments, ACRE payments and insurance net indemnities are averaged across all acres. PLC and ARC payments are perparticipating acre. All projections are averages across 500 stochastic outcomes.

Upland cotton production fell sharply in 2013, as planted area declined and continued drought again resulted in large abandonment. If growing conditions improve, more acres may be planted and fewer abandoned in 2014/15. The resulting increase in production would weigh on prices.
China has been the main source of uncertainty in world cotton markets. Policy choices have led to a very large increase in Chinese cotton stocks, which are now greater than annual production or use of cotton in China. Policy changes in China, especially if unanticipated, could have large impacts on world cotton trade and prices.
After peaking in 2011/12, average cotton returns per acre are projected to decline for the third straight year in 2014/15 because of lower cotton prices. The new farm bill eliminates the DCP and ACRE programs and does not extend the new PLC and ARC programs to cotton. Instead, the STAX program will provide a new crop insurance option for cotton producers beginning in 2015/16.
Upland cotton Cotton acreage, production recover in 2014
0
5
10
15
20
07/08 09/10 11/12 13/14 15/16 17/18 19/20 21/22 23/24
August-July marketing yearM
illion
bale
s
Production Use Ending stocks
China's cotton stocks remain a source of uncertainty
0
10
20
30
40
50
60
70
07/08 08/09 09/10 10/11 11/12 12/13 13/14
Marketing year
Milli
on b
ales
Production Domestic use Ending stocks Imports
Cotton returns decline with lower prices
0100200300400500600700800900
1,0001,100
07/08 09/10 11/12 13/14 15/16 17/18 19/20 21/22 23/24
August-July marketing year
Dolla
rs p
er a
cre
Market Program paymentsIns. net indemnities Variable expenses
FAPRI-MU Report #02-14 - 2014 U.S. Baseline Briefing Book - Page 19

FAPRI-MU Report #02-14 - 2014 U.S. Baseline Briefing Book - Page 20
Upland cotton supply and use
August-July year 13/14 14/15 15/16 16/17 17/18 18/19 19/20 20/21 21/22 22/23 23/24
Area (Million acres) Planted area 10.21 10.46 10.69 10.70 10.57 10.57 10.57 10.49 10.37 10.36 10.30 Harvested area 7.47 8.74 8.95 8.97 8.85 8.85 8.86 8.79 8.68 8.67 8.62
(Pounds per harvested acre)Yield 807 794 801 809 817 825 833 841 847 855 863
(Million bales)Supply 16.26 17.41 18.53 18.94 19.09 19.30 19.47 19.63 19.62 19.70 19.75 Beginning stocks 3.71 2.89 3.55 3.79 3.98 4.05 4.05 4.18 4.25 4.21 4.20 Production 12.55 14.51 14.97 15.15 15.10 15.25 15.41 15.45 15.36 15.49 15.54 Imports 0.01 0.01 0.01 0.01 0.01 0.01 0.01 0.01 0.01 0.01 0.01
Domestic mill use 3.59 3.72 3.81 3.87 3.90 3.90 3.89 3.87 3.83 3.78 3.74
Exports 9.78 10.13 10.93 11.10 11.14 11.34 11.41 11.52 11.58 11.72 11.71
Total use 13.37 13.86 14.74 14.96 15.04 15.25 15.30 15.39 15.40 15.50 15.45
Ending stocks 2.89 3.55 3.79 3.98 4.05 4.05 4.18 4.25 4.21 4.20 4.31 CCC inventory 0.00 0.00 0.00 0.00 0.00 0.00 0.00 0.00 0.00 0.00 0.00 Other stocks 2.89 3.55 3.79 3.98 4.05 4.05 4.18 4.25 4.21 4.20 4.31
Prices, program provisions (Cents per pound) Farm price 74.2 67.3 66.4 65.7 65.7 66.1 65.9 65.8 66.5 67.2 66.7 Adjusted world price 65.1 56.0 55.2 54.3 54.4 55.1 55.0 54.9 56.0 57.2 56.5 Loan rate 52.0 52.0 51.9 50.9 50.6 50.2 50.4 50.4 50.4 50.6 51.0 Target price 71.3 n.a. n.a. n.a. n.a. n.a. n.a. n.a. n.a. n.a. n.a. Direct payment rate 6.7 n.a. n.a. n.a. n.a. n.a. n.a. n.a. n.a. n.a. n.a.
(Dollars per ton) Cottonseed price 247.46 199.82 193.50 191.13 191.86 193.66 194.49 194.60 194.72 192.92 191.47
(Million acres) Base area + allocated generic 17.91 17.92 n.a. n.a. n.a. n.a. n.a. n.a. n.a. n.a. n.a.
Returns and payments (Dollars) Gross market revenue/a. 745.01 648.29 642.79 640.60 646.79 657.81 662.95 667.35 679.54 689.46 690.66 Variable expenses/a. 535.21 529.11 530.73 538.69 545.68 554.35 561.29 573.56 590.56 600.62 609.69 Market net return/a. 209.80 119.18 112.07 101.91 101.11 103.47 101.66 93.79 88.97 88.84 80.97 Marketing loan benefits/a.* 0.00 26.17 27.29 30.70 31.59 25.74 27.72 29.63 19.63 16.55 21.97 DCP payments/base a.* 30.95 n.a. n.a. n.a. n.a. n.a. n.a. n.a. n.a. n.a. n.a. ACRE/planted a.* 0.18 n.a. n.a. n.a. n.a. n.a. n.a. n.a. n.a. n.a. n.a. Transition payments/base a.* n.a. 32.14 n.a. n.a. n.a. n.a. n.a. n.a. n.a. n.a. n.a. Insurance net indemnities/a. 61.64 33.21 52.91 51.74 51.25 51.03 51.77 52.25 52.73 54.09 54.94
*Marketing loan benefits, DCP payments, ACRE payments and insurance net indemnities are averaged across all acres.All projections are averages across 500 stochastic outcomes.

U.S. average sorghum area and yields both increased in 2013, resulting in the largest sorghum crop since 2008. Large increases in global supplies of corn and other grains also contributed to a sharp reduction in sorghum prices in 2013/14. Sorghum production is projected to average about 400 million bushels each year, with prices following corn prices.
Season-average prices for sorghum, barley and oats all reached record levels in 2012/13. Increased yields only partially offset the decline in market prices in 2013/14, resulting in a significant decline in per-acre returns. Projected average sorghum prices are near or below the levels that trigger PLC payments.
Unlike corn and sorghum, barley prices have dipped only slightly in 2013/14 from the record levels of 2012/13. Competition from other crops is projected to sharply reduce barley prices and returns in 2014/15. Projected barley prices exceed corn prices on a per-bushel basis, and average about 85% of projected wheat prices. Projected average barley prices are below the barley reference price.
Sorghum and barley
FAPRI-MU Report #02-14 - 2014 U.S. Baseline Briefing Book - Page 21
Sorghum production and exports recover in 2013/14
0
100
200
300
400
500
600
07/08 09/10 11/12 13/14 15/16 17/18 19/20 21/22 23/24
September-August marketing yearM
illion
bus
hels
Production Domestic use Exports
Sorghum returns fall with lower prices
0
100
200
300
400
500
07/08 09/10 11/12 13/14 15/16 17/18 19/20 21/22 23/24
September-August marketing year
Dolla
rs p
er a
cre
Market Program paymentsIns. net indemnities Variable expenses
Barley returns also decline with lower prices
0
100
200
300
400
500
07/08 09/10 11/12 13/14 15/16 17/18 19/20 21/22 23/24
June-May marketing year
Dolla
rs p
er a
cre
Market Program paymentsIns. net indemnities Variable expenses

FAPRI-MU Report #02-14 - 2014 U.S. Baseline Briefing Book - Page 22
Sorghum supply and use
September-August year 13/14 14/15 15/16 16/17 17/18 18/19 19/20 20/21 21/22 22/23 23/24
Area (Million acres) Planted area 8.06 7.60 7.90 7.92 7.90 7.92 7.90 7.85 7.82 7.79 7.75 Harvested area 6.53 5.97 6.20 6.21 6.19 6.21 6.20 6.16 6.13 6.11 6.07
(Bushels per harvested acre)Yield 59.6 64.6 64.8 65.2 65.4 65.7 66.1 66.2 66.4 66.4 66.4
Supply and use (Million bushels) Production 389 387 403 406 407 409 411 409 409 407 405 Imports 0 0 0 0 0 0 0 0 0 0 0 Domestic use 231 233 251 255 258 255 260 256 255 254 252 Exports 150 145 146 150 148 154 149 152 153 152 152 Ending stocks 23 32 37 39 40 41 43 44 45 46 48
Prices, returns and payments (Dollars) Farm price/bu. 4.19 4.03 3.85 3.84 3.84 3.85 3.79 3.77 3.74 3.73 3.69 Market net return/a. 103.67 116.52 107.79 107.11 105.94 106.42 102.46 98.62 94.77 91.18 86.75 Marketing loan benefits/a.* 0.00 0.00 0.04 0.24 0.09 0.33 0.19 0.25 0.12 0.20 0.54 Payments to participants PLC/base a.* n.a. 13.92 20.20 21.42 21.73 20.84 22.74 23.63 24.09 25.55 26.54 ARC/base a.* n.a. 10.20 11.21 8.23 5.92 5.22 6.70 6.81 6.99 7.43 7.63 Insurance net indemnities/a.* 28.09 12.80 13.42 12.56 12.89 13.53 13.83 13.70 13.67 13.63 13.61
*Marketing loan benefits and insurance net indemnities are averaged across all acres. PLC and ARC payments are per participating acre. All projections are averages across 500 stochastic outcomes.
Barley supply and use
June-May year 13/14 14/15 15/16 16/17 17/18 18/19 19/20 20/21 21/22 22/23 23/24
Area (Million acres) Planted area 3.48 3.57 3.41 3.44 3.41 3.39 3.37 3.34 3.34 3.32 3.30 Harvested area 3.00 3.10 2.96 2.99 2.96 2.94 2.93 2.90 2.90 2.88 2.86
(Bushels per harvested acre)Yield 71.7 71.3 72.1 72.6 73.3 73.9 74.4 75.0 75.6 76.2 76.7
Supply and use (Million bushels) Production 215 222 214 218 217 218 218 218 219 220 220 Imports 24 19 19 19 17 17 17 17 16 16 15 Domestic use 219 221 218 220 220 219 220 219 220 219 218 Exports 10 14 13 14 15 15 15 15 15 16 16 Ending stocks 91 97 99 102 102 103 104 105 105 106 107
Prices, returns and payments (Dollars) All barley farm price/bu. 6.00 4.64 4.59 4.52 4.48 4.48 4.46 4.46 4.43 4.43 4.41 Feed barley price/bu. 4.23 3.62 3.56 3.52 3.50 3.49 3.47 3.45 3.42 3.41 3.38 Market net return/a. 239.82 143.46 145.72 141.25 139.83 139.54 138.04 137.68 133.27 132.99 131.77 Marketing loan benefits/a.* 0.00 0.09 0.29 0.70 0.61 0.99 0.85 1.31 0.85 1.01 1.34 Payments to participants PLC/base a.* n.a. 24.26 28.91 33.46 32.58 33.47 33.88 34.94 34.95 35.55 36.40 ARC/base a.* n.a. 9.06 11.12 12.18 11.85 9.60 8.71 9.28 9.52 9.68 9.81 Insurance net indemnities/a.* 3.47 11.42 11.04 10.87 10.61 10.73 10.78 10.83 10.95 10.94 11.03
*Marketing loan benefits and insurance net indemnities are averaged across all acres. PLC and ARC payments are per participating acre. All projections are averages across 500 stochastic outcomes.

Reduced imports and total supplies have helped keep oats prices from falling as much in 2013/14 as prices for corn and sorghum. In the baseline, prices of all the major coarse grains move together and average well below the 2012/13 peak values.
Hay yields and production increased in 2013 after the drought-reduced hay crop of 2012. With average growing conditions, hay production could increase again in 2014. Increased production in 2013 and 2014 allows stocks to rebuild. Local supplies could still be very tight in parts of the country affected by drought.
Hay prices have begun to decline from the very high levels caused by the 2012 drought. If production and stocks rebuild as projected, national average hay prices could drop to around $140 per ton beginning in 2014/15. Hay markets are particularly fragmented, so national average prices may not reflect local conditions.
Oats and hay
FAPRI-MU Report #02-14 - 2014 U.S. Baseline Briefing Book - Page 23
Hay production and stocks recover
020406080
100120140160
07/08 09/10 11/12 13/14 15/16 17/18 19/20 21/22 23/24
May-April marketing year
Milli
on to
ns
Production Disappearance Ending stocks
Hay prices decline with increased production
0
50
100
150
200
07/08 09/10 11/12 13/14 15/16 17/18 19/20 21/22 23/24
May-April marketing year
Dolla
rs p
er to
n
All hay price
Feed grain prices decline sharply from 2012/13 peak
012345678
07/08 09/10 11/12 13/14 15/16 17/18 19/20 21/22 23/24
May-April marketing yearDo
llars
per
bus
hel
All barley Corn Sorghum Oats

FAPRI-MU Report #02-14 - 2014 U.S. Baseline Briefing Book - Page 24
Oats supply and use
June-May year 13/14 14/15 15/16 16/17 17/18 18/19 19/20 20/21 21/22 22/23 23/24
Area (Million acres) Planted area 3.01 2.99 3.09 3.05 2.98 2.97 2.95 2.92 2.90 2.89 2.86 Harvested area 1.03 1.17 1.21 1.19 1.17 1.16 1.15 1.14 1.14 1.13 1.13
(Bushels per harvested acre)Yield 64.0 64.4 65.1 65.6 66.2 66.7 67.3 67.9 68.3 68.9 69.4
Supply and use (Million bushels) Production 66 76 79 79 78 78 78 78 78 79 79 Imports 94 97 94 93 93 92 92 91 90 90 89 Domestic use 162 162 167 168 168 168 167 166 166 165 165 Exports 2 2 2 2 2 2 2 2 2 2 2 Ending stocks 32 41 46 48 48 49 49 50 51 52 53
Prices, returns and payments (Dollars) Farm price/bu. 3.62 3.44 3.27 3.20 3.19 3.17 3.16 3.14 3.12 3.10 3.07 Market net return/a. 111.77 104.43 96.86 93.41 93.64 92.11 91.60 90.43 87.42 85.48 83.50 Marketing loan benefits/a.* 0.00 0.00 0.00 0.00 0.00 0.02 0.03 0.04 0.00 0.01 0.08 Payments to participants PLC/base a.* n.a. 0.12 0.95 1.45 1.78 1.58 1.62 2.09 1.97 2.04 2.34 ARC/base a.* n.a. 0.70 1.44 1.53 1.97 1.70 1.74 1.65 1.76 1.63 1.74 Insurance net indemnities/a.* 0.61 1.58 2.29 2.21 2.19 2.24 2.24 2.25 2.26 2.28 2.28
*Marketing loan benefits and insurance net indemnities are averaged across all acres. PLC and ARC payments are per participating acre. All projections are averages across 500 stochastic outcomes.
Hay supply and use
May-April year 13/14 14/15 15/16 16/17 17/18 18/19 19/20 20/21 21/22 22/23 23/24
(Million acres)Harvested area 58.3 59.1 59.1 59.1 59.2 59.3 59.5 59.6 59.6 59.5 59.4
(Tons per acre)Yield 2.33 2.36 2.37 2.38 2.38 2.39 2.39 2.40 2.41 2.42 2.42
Supply and use (Million tons) Production 135.9 139.6 140.0 140.4 141.0 141.6 142.5 143.2 143.7 143.8 143.9 Disappearance 131.1 136.1 138.2 139.9 140.9 141.7 142.4 143.1 143.4 143.4 143.4 Ending stocks 19.0 22.5 24.3 24.8 24.9 24.8 24.9 25.0 25.4 25.7 26.2
(Dollars per ton)All hay farm price 179.06 143.92 136.83 135.66 136.84 139.09 140.72 140.75 139.70 138.65 137.17

Rice production declined in 2013 as rice area fell to the lowest level since 1987. The resulting drawdown of rice stocks has contributed to higher U.S. rice prices in the 2013/14 marketing year. Concerns about drought in California and other factors have pushed prices even higher since these estimates were prepared. Projected U.S. rice prices fall in 2014/15 and 2015/16, bringing U.S. prices more in line with those of other rice exporters.
High prices and yields result in record levels of per-acre revenues for U.S. rice producers in 2013/14. The projected declines in rice prices in 2014/15 and 2015/16 reduce producer returns. Projected average rice prices drop below the levels that trigger PLC payments.
Large sugar supplies in the U.S. and Mexico contributed to a sharp decline in sugar prices in the 2012/13 marketing year. Sugar prices remain well below 2009-2011 levels in 2013/14, but projected stocks decline slightly. Reduced production allows some price recovery in 2014/15. Average sugar prices remain above loan rates, but prices could fall to support levels in years with big crops or large imports from Mexico.
Rice and sugar
FAPRI-MU Report #02-14 - 2014 U.S. Baseline Briefing Book - Page 25
Rice stocks decline in 2013/14
0
50
100
150
200
250
300
07/08 09/10 11/12 13/14 15/16 17/18 19/20 21/22 23/24
August-July marketing year Do
llars
per
hun
dred
weigh
t
Production Use Ending stocks
Rice returns peak in 2013/14, then decline
0200400600800
1,0001,2001,400
07/08 09/10 11/12 13/14 15/16 17/18 19/20 21/22 23/24
August-July marketing year
Dolla
rs p
er a
cre
Market Program paymentsIns. net indemnities Variable expenses
Sugar prices remain low in 2013/14
0
10
20
30
40
50
60
07/08 09/10 11/12 13/14 15/16 17/18 19/20 21/22 23/24
October-September marketing year
Cent
s pe
r pou
nd
Refined beet sugar Raw cane sugar

FAPRI-MU Report #02-14 - 2014 U.S. Baseline Briefing Book - Page 26
Rice supply and use
August-July year 13/14 14/15 15/16 16/17 17/18 18/19 19/20 20/21 21/22 22/23 23/24
Area (Million acres) Planted area 2.49 2.68 2.69 2.62 2.62 2.60 2.59 2.57 2.56 2.56 2.55 Harvested area 2.47 2.64 2.65 2.59 2.59 2.57 2.56 2.54 2.53 2.53 2.52
(Pounds per harvested acre)Yield 7,694 7,461 7,526 7,602 7,669 7,727 7,778 7,837 7,898 7,965 8,027
Supply and use (Million hundredweight) Production 189.9 197.3 199.8 196.9 198.8 198.6 198.8 199.2 199.7 201.2 202.6 Imports 21.0 20.8 20.7 21.3 21.8 22.4 22.9 23.5 23.9 24.2 24.6 Domestic use 119.9 120.9 123.0 124.1 125.4 126.7 127.9 129.2 130.3 131.6 132.7 Exports 99.1 97.6 96.0 93.8 94.7 93.8 93.5 93.3 93.0 93.4 93.9 Ending stocks 28.3 27.9 29.4 29.6 30.1 30.6 30.8 31.1 31.4 31.8 32.4
Prices, returns and payments (Dollars) Farm price/cwt. 15.82 14.81 13.67 13.73 13.70 13.67 13.68 13.69 13.72 13.72 13.66 Market net return/a. 660.06 563.42 491.84 502.88 503.37 498.79 497.96 494.55 490.61 490.91 486.39 Marketing loan benefits/a.* 0.00 0.00 0.00 0.00 0.00 0.00 0.00 0.00 0.00 0.00 0.00 DCP payments/base a.* 88.16 n.a. n.a. n.a. n.a. n.a. n.a. n.a. n.a. n.a. n.a. Payments to participants PLC/base a.* n.a. 21.64 61.97 59.54 61.52 63.06 63.55 64.39 62.60 63.80 65.35 ARC/base a.* n.a. 1.30 8.97 10.08 11.40 10.47 7.20 7.02 6.18 6.96 6.66 Insurance net indemnities/a.* 7.88 13.58 19.05 18.10 18.39 18.48 18.46 18.63 18.80 18.96 19.10
*Marketing loan benefits, DCP payments, and insurance net indemnities are averaged across all acres. PLC and ARC payments are per participating acre. All projections are averages across 500 stochastic outcomes.
Sugar supply and use
October-September year 13/14 14/15 15/16 16/17 17/18 18/19 19/20 20/21 21/22 22/23 23/24
Area (Million acres) Sugar cane harvested 0.857 0.848 0.867 0.877 0.883 0.884 0.884 0.881 0.877 0.872 0.867 Sugar beet planted 1.198 1.145 1.220 1.222 1.225 1.225 1.221 1.218 1.213 1.209 1.208 Sugar beet harvested 1.154 1.116 1.189 1.191 1.195 1.194 1.191 1.188 1.183 1.179 1.178
Yield (Tons per harvested acre) Cane sugar 4.38 4.29 4.31 4.34 4.36 4.38 4.40 4.42 4.44 4.45 4.46 Beet sugar 4.35 4.29 4.37 4.45 4.52 4.60 4.67 4.75 4.82 4.89 4.96
Supply and use (Thousand tons) Production 8,778 8,420 8,937 9,100 9,245 9,361 9,457 9,539 9,585 9,643 9,706 Cane sugar 3,753 3,636 3,738 3,801 3,844 3,872 3,891 3,895 3,889 3,877 3,866 Beet sugar 5,025 4,784 5,198 5,298 5,401 5,489 5,566 5,643 5,696 5,765 5,840 Imports 3,331 3,536 3,532 3,525 3,549 3,585 3,625 3,674 3,744 3,803 3,862 Domestic use 12,095 11,899 12,143 12,349 12,523 12,667 12,809 12,942 13,065 13,182 13,295 Exports 258 255 256 256 256 256 256 256 256 256 255 Ending stocks 1,916 1,718 1,788 1,808 1,824 1,847 1,864 1,879 1,887 1,896 1,914
Prices (Cents per pound) N.Y. spot raw sugar 21.82 25.49 24.97 24.96 24.97 24.69 24.46 24.34 24.22 24.11 23.85 Refined beet sugar 28.91 33.95 33.17 33.09 33.05 32.59 32.22 32.00 31.76 31.56 31.13

After the record crop of 2012, producers sharply reduced peanut area and production in 2013. Peanut yields were above the long term trend for the second straight year in 2013. If yields drop in 2014, peanut production could decline again. Reduced peanut production allows a drawdown of peanut stocks, setting the stage for a recovery in peanut prices.
High contract prices and record yields resulted in record per-acre market revenues for the 2012 peanut crop. With lower projected prices in 2013/14 and a return to more normal yields, per-acre revenues decline sharply. Projected average peanut prices are low enough to trigger PLC payments.
Sunflower seed prices decline in 2013/14 in response to larger global oilseed supplies and lower vegetable oil prices. In 2014/15, a further decline in sunflower seed prices is offset by an assumed recovery in average yields, so returns are largely unchanged. Projected average sunflower seed prices are low enough to trigger PLC payments.
Peanuts and sunflower seed Reduced production draws down peanut stocks
012345678
07/08 09/10 11/12 13/14 15/16 17/18 19/20 21/22 23/24
August-July marketing yearBi
llion
poun
dsProduction Use Ending stocks
FAPRI-MU Report #02-14 - 2014 U.S. Baseline Briefing Book - Page 27
Peanut revenues fall sharply from 2012/13 peak
0
200
400
600
800
1,000
1,200
1,400
07/08 09/10 11/12 13/14 15/16 17/18 19/20 21/22 23/24
August-July marketing year
Dolla
rs p
er a
cre
Market Program payments Variable expenses
Sunflower returns also decline with lower prices
050
100150200250300350400450
07/08 09/10 11/12 13/14 15/16 17/18 19/20 21/22 23/24
Septermber-August marketing year
Dolla
rs p
er a
cre
Market Program payments Variable expenses

FAPRI-MU Report #02-14 - 2014 U.S. Baseline Briefing Book - Page 28
Peanut supply and use
August-July year 13/14 14/15 15/16 16/17 17/18 18/19 19/20 20/21 21/22 22/23 23/24
Area (Million acres) Planted area 1.07 1.11 1.26 1.27 1.28 1.27 1.26 1.26 1.26 1.25 1.25 Harvested area 1.04 1.07 1.22 1.23 1.24 1.23 1.22 1.22 1.22 1.21 1.21
(Pounds per harvested acre)Yield 4,006 3,658 3,713 3,773 3,826 3,891 3,949 4,007 4,071 4,124 4,179
Supply and use (Million pounds) Production 4,174 3,920 4,553 4,634 4,732 4,798 4,822 4,885 4,958 5,009 5,054 Imports 65 65 65 65 65 65 65 65 65 65 65 Domestic use 3,932 3,829 3,949 4,016 4,088 4,151 4,199 4,243 4,302 4,351 4,393 Exports 765 660 643 648 667 678 672 680 687 694 697 Ending stocks 2,313 1,809 1,834 1,869 1,912 1,945 1,962 1,989 2,022 2,051 2,080
Prices, returns and payments (Dollars) Farm price/ton 469.54 519.88 523.88 517.68 510.18 505.73 505.11 500.30 494.37 489.62 483.11 Market net return/a. 359.83 375.93 397.43 395.89 388.55 386.92 392.42 385.48 376.90 374.36 366.08 Marketing loan benefits/a.* 0.00 2.55 7.92 7.06 14.99 15.14 20.21 23.75 29.96 33.54 38.30 DCP payments/base a.* 42.11 n.a. n.a. n.a. n.a. n.a. n.a. n.a. n.a. n.a. n.a. Payments to participants PLC/base a.* n.a. 50.14 53.64 59.65 67.68 72.03 72.95 76.65 85.12 86.09 92.62 ARC/base a.* n.a. 11.43 17.95 25.16 24.74 19.51 18.26 19.51 22.26 23.32 25.55
*Marketing loan benefits, DCP payments, and insurance net indemnities are averaged across all acres. PLC and ARC payments are per participating acre. All projections are averages across 500 stochastic outcomes.
Sunflower seed supply and use
September-August year 13/14 14/15 15/16 16/17 17/18 18/19 19/20 20/21 21/22 22/23 23/24
Area (Million acres) Planted area 1.58 1.49 1.65 1.69 1.71 1.72 1.73 1.74 1.75 1.76 1.77 Harvested area 1.47 1.40 1.55 1.59 1.62 1.62 1.64 1.64 1.65 1.66 1.67
(Pounds per harvested acre)Yield 1,378 1,547 1,551 1,560 1,570 1,575 1,583 1,591 1,598 1,601 1,609
Supply and use (Million pounds) Production 2,033 2,175 2,412 2,489 2,544 2,562 2,595 2,622 2,646 2,664 2,688 Imports 117 117 117 117 117 117 117 117 117 117 117 Domestic use 2,088 2,141 2,252 2,320 2,377 2,409 2,449 2,483 2,511 2,537 2,568 Exports 236 104 247 275 277 267 258 249 245 238 231 Ending stocks 164 211 242 253 260 263 268 274 281 286 291
Prices, returns and payments (Dollars) Farm price/lb. 0.200 0.182 0.181 0.180 0.179 0.180 0.179 0.179 0.179 0.177 0.177 Market net return/a. 146.66 152.20 151.63 150.60 148.76 149.85 146.93 144.45 142.59 137.85 137.69 Marketing loan benefits/a.* 0.00 0.26 0.28 0.10 0.41 0.77 1.14 1.39 1.05 1.95 0.80 Payments to participants PLC/base a.* n.a. 26.51 28.20 29.50 31.48 30.82 31.81 31.65 31.57 33.57 33.70 ARC/base a.* n.a. 10.47 10.39 9.16 7.59 7.05 8.43 8.32 8.21 8.79 9.05
*Marketing loan benefits, DCP payments, and insurance net indemnities are averaged across all acres. PLC and ARC payments are per participating acre. All projections are averages across 500 stochastic outcomes.

Land use Corn area falls in 2014, soybean area increases
0
20
40
60
80
100
120
2007 2009 2011 2013 2015 2017 2019 2021 2023
Year crops harvested M
illion
acr
esCorn Soybeans Wheat
Cotton acreage planted increases in 2014
02468
10121416
2007 2009 2011 2013 2015 2017 2019 2021 2023
Year crops harvested
Milli
on a
cres
Upland cotton Sorghum Rice
Sharply lower corn prices lead to a reduction in corn area planted in 2014. Projected soybean area increases in 2014, in part because soybean prices have remained unusually strong relative to corn. Wheat area could increase slightly in 2014 if conditions in spring wheat states are more favorable than in 2013. Low prices and returns could slightly reduce the total amount of land devoted to corn and soybeans in 2015.
Lower prices contributed to sharp reductions in cotton acreage planted in 2012 and 2013. Cotton acreage could increase slightly in 2014, given unfavorable expected returns for many competing crops. Sorghum acreage increased in 2013, and only a slight drop is projected for 2014. Strong rice prices relative to other crops results in some recovery in rice area from the 2013 low.
Land planted to 12 major crops declined slightly in 2013 from the 2012 peak, in part because of adverse planting conditions. The 12-crop area is largely unchanged in 2014, as the effect of lower prices and returns is offset by an assumed return to more normal planting conditions. Lower prices result in a slight reduction in 12-crop area in 2015. However, with less land enrolled in the conservation reserve, total planted area remains above the levels of 2009-2011.
12-crop planted area remains nearly steady in 2014
220
240
260
280
300
320
340
360
2007 2009 2011 2013 2015 2017 2019 2021 2023
Year crops harvested
Milli
on a
cres
12 crops 12 crops + hay + grasses + CRP - double-crop
FAPRI-MU Report #02-14 - 2014 U.S. Baseline Briefing Book - Page 29

FAPRI-MU Report #02-14 - 2014 U.S. Baseline Briefing Book - Page 30
Land use for major crops and the conservation reserve
Marketing year 13/14 14/15 15/16 16/17 17/18 18/19 19/20 20/21 21/22 22/23 23/24
Planted area (Million acres) Corn 95.37 91.34 90.64 91.06 90.96 91.25 91.15 90.80 90.46 90.13 89.91 Soybeans 76.53 78.69 75.75 76.04 76.46 76.27 76.58 76.84 76.97 77.19 77.28 Wheat 56.16 57.04 57.03 56.54 56.71 56.58 56.38 56.25 56.18 56.13 56.18 Upland cotton 10.21 10.46 10.69 10.70 10.57 10.57 10.57 10.49 10.37 10.36 10.30 Sorghum 8.06 7.60 7.90 7.92 7.90 7.92 7.90 7.85 7.82 7.79 7.75 Barley 3.48 3.57 3.41 3.44 3.41 3.39 3.37 3.34 3.34 3.32 3.30 Oats 3.01 2.99 3.09 3.05 2.98 2.97 2.95 2.92 2.90 2.89 2.86 Rice 2.49 2.68 2.69 2.62 2.62 2.60 2.59 2.57 2.56 2.56 2.55 Sunflowers 1.58 1.49 1.65 1.69 1.71 1.72 1.73 1.74 1.75 1.76 1.77 Peanuts 1.07 1.11 1.26 1.27 1.28 1.27 1.26 1.26 1.26 1.25 1.25 Sugar beets 1.20 1.14 1.22 1.22 1.23 1.22 1.22 1.22 1.21 1.21 1.21 Sugar cane (harvested) 0.91 0.90 0.92 0.93 0.94 0.94 0.94 0.94 0.93 0.93 0.9212 crop planted area 260.05 259.01 256.25 256.48 256.77 256.71 256.64 256.21 255.75 255.52 255.28
Hay (harvested) 58.26 59.07 59.09 59.11 59.20 59.34 59.49 59.55 59.55 59.47 59.37Warm season grasses (harvested) 0.19 0.22 0.19 0.19 0.20 0.21 0.29 0.47 0.73 0.99 1.27
12 crops + hay + grasses 318.50 318.29 315.52 315.77 316.16 316.25 316.42 316.24 316.04 315.98 315.92
Conservation reserve (CRP) 26.84 25.88 25.05 24.47 23.84 23.40 23.24 23.10 22.96 22.81 22.68
12 crops + hay + grasses + CRP 345.33 344.17 340.57 340.24 340.00 339.65 339.66 339.33 338.99 338.79 338.60
Double-crop soybeans 6.75 5.42 5.23 5.22 5.24 5.22 5.23 5.22 5.21 5.20 5.19
12 crops + hay + grasses + CRP 338.58 338.75 335.34 335.02 334.76 334.43 334.44 334.11 333.78 333.59 333.41 - double-crop soybeans

Future biodiesel use of soybean oil is constrained by competition from corn oil and other biodiesel feedstocks. Food use of soybean oil increases with population after 2013/14, as recent shifts from soy oil to other vegetable oils abate. Continued low soybean oil prices and growth in global vegetable oil demand contribute to projected increases in U.S. soybean oil exports.
Stagnant livestock and poultry production and competition from distillers grains has limited domestic use of soybean meal in recent years. Projected increases in soybean meal use result from resumed growth in poultry production and a halt in the expansion of distillers grains use. Soybean meal exports remain stable as growing world demand is met by competitors.
Soybean oil prices have declined, partly because expanding world palm oil production has depressed the prices of all vegetable oils. Soybean meal prices decline in 2014/15 in response to increased global supplies. Projected crushing margins (the difference between the value of soybean meal and soybean oil and the cost of soybeans) are fairly stable.
Soybean products
Crushing margins hold constant with lower prices
02468
1012141618
07/08 09/10 11/12 13/14 15/16 17/18 19/20 21/22 23/24
October-September marketing year
Dolla
rs p
er b
ushe
l of b
eans
Meal value Oil value IL soybean processor price
Expansion in biodiesel use of soybean oil ends
02468
10121416
07/08 09/10 11/12 13/14 15/16 17/18 19/20 21/22 23/24
October-September marketing yearBi
llion
poun
ds
Domestic food use Biodiesel use Exports
Soybean meal use grows as DDGS use stabilizes
05
10152025303540
07/08 09/10 11/12 13/14 15/16 17/18 19/20 21/22 23/24
October-September marketing year
Milli
on to
ns
Domestic use Exports
FAPRI-MU Report #02-14 - 2014 U.S. Baseline Briefing Book - Page 31

FAPRI-MU Report #02-14 - 2014 U.S. Baseline Briefing Book - Page 32
Soybean oil supply and use
October-September year 13/14 14/15 15/16 16/17 17/18 18/19 19/20 20/21 21/22 22/23 23/24
(Million pounds)Supply 21,730 22,173 22,641 23,022 23,371 23,684 23,951 24,257 24,540 24,795 25,016 Beginning stocks 1,705 1,705 1,872 1,896 1,963 2,022 2,043 2,104 2,140 2,171 2,140 Production 19,825 20,268 20,569 20,926 21,208 21,462 21,708 21,953 22,200 22,424 22,676 Imports 200 200 200 200 200 200 200 200 200 200 200
Domestic use 18,583 18,715 18,817 18,931 19,019 18,974 18,991 19,012 18,960 18,921 18,821 Biodiesel 5,195 5,083 5,013 4,909 4,840 4,710 4,617 4,541 4,377 4,206 4,040 Food and other 13,388 13,632 13,804 14,022 14,179 14,264 14,374 14,472 14,583 14,715 14,781
Exports 1,441 1,586 1,928 2,128 2,330 2,667 2,856 3,105 3,409 3,735 3,905
Total use 20,024 20,301 20,745 21,059 21,349 21,641 21,847 22,117 22,369 22,656 22,726
Ending stocks 1,705 1,872 1,896 1,963 2,022 2,043 2,104 2,140 2,171 2,140 2,290
Price (Cents per pound) Decatur 37.55 35.37 35.47 35.04 34.65 34.90 34.45 34.21 34.16 33.53 33.68
Soybean meal supply and use
October-September year 13/14 14/15 15/16 16/17 17/18 18/19 19/20 20/21 21/22 22/23 23/24
(Thousand tons)Supply 40,769 42,022 42,670 43,403 43,984 44,507 45,011 45,514 46,022 46,483 47,002 Beginning stocks 275 300 330 332 334 336 336 336 338 340 341 Production 40,329 41,557 42,175 42,906 43,485 44,007 44,510 45,013 45,520 45,979 46,496 Imports 165 165 165 165 165 165 165 165 165 165 165
Domestic use 29,848 32,408 33,234 33,888 34,438 34,758 35,053 35,434 35,899 36,414 36,961
Exports 10,621 9,285 9,104 9,181 9,211 9,413 9,622 9,743 9,784 9,727 9,698
Total use 40,469 41,693 42,338 43,069 43,649 44,171 44,675 45,176 45,683 46,142 46,659
Ending stocks 300 330 332 334 336 336 336 338 340 341 343
Price (Dollars per ton) Decatur, 48% protein 435.31 328.35 328.22 328.00 328.55 331.45 335.98 337.46 340.40 340.24 339.09

Distillers grains production and use expanded rapidly as the dry mill ethanol industry grew. Production dipped in 2012/13 when ethanol production declined but recovers in 2013/14. Almost no growth occurs after 2014/15, as corn ethanol production is relatively stable.
Prices of distillers dried grains with solubles (DDGS) and corn gluten feed have generally moved with corn prices. Export demand has sometimes helped support DDGS prices. Projected DDGS prices slightly exceed corn prices. Distillers grains primarily displace corn in beef cattle rations, but displace both corn and soybean meal in other livestock and poultry rations.
Wet mill plants produce ethanol, HFCS and other products. Food uses account for most of the corn oil produced at wet mill plants. The baseline projects a rapid increase in the share of dry mill ethanol plants that remove oil from distillers grains. The oil removed in dry mill plants is used in feed uses and biodiesel production. The share used for biodiesel production is projected to increase.
Corn products Distillers grains expansion is largely over
05
1015202530354045
07/08 09/10 11/12 13/14 15/16 17/18 19/20 21/22 23/24
September-August marketing yearM
illion
tons
Distillers, brewers grains production Domestic use Net exports
DDGS prices generally follow corn prices
0
50
100
150
200
250
300
07/08 09/10 11/12 13/14 15/16 17/18 19/20 21/22 23/24
September-August marketing year
Dolla
rs p
er to
n
Corn DDGS Corn gluten feed
Biodiesel use of corn oil increases
012345678
07/08 09/10 11/12 13/14 15/16 17/18 19/20 21/22 23/24
October-September marketing year
Billio
n po
unds
Food and other Feed Biodiesel Net exports
FAPRI-MU Report #02-14 - 2014 U.S. Baseline Briefing Book - Page 33

FAPRI-MU Report #02-14 - 2014 U.S. Baseline Briefing Book - Page 34
Corn product supply and use
Marketing year 13/14 14/15 15/16 16/17 17/18 18/19 19/20 20/21 21/22 22/23 23/24
High-fructose corn syrup (Thousand tons, Oct.-Sep. year) Production 8,931 9,069 9,094 9,133 9,189 9,229 9,240 9,231 9,245 9,281 9,314 Domestic use 7,390 7,455 7,439 7,438 7,451 7,449 7,420 7,374 7,364 7,358 7,351 Net exports 1,541 1,614 1,655 1,695 1,738 1,780 1,820 1,857 1,881 1,923 1,963
(Cents per pound, Oct.-Sep. year) Price, 42% Midwest 22.40 22.64 22.24 22.25 22.26 22.01 21.91 22.01 21.92 21.82 21.56 HFCS price/ref. sugar price 77% 67% 67% 67% 67% 68% 68% 69% 69% 69% 69%
Distillers, brewers grains (Thousand tons, Sep.-Aug. year) Production (dry equiv.) 37,542 38,350 38,802 39,292 39,619 39,971 40,045 39,676 39,445 39,342 39,148 Domestic use 28,274 28,815 29,281 29,777 30,105 30,457 30,540 30,179 29,956 29,848 29,651 Net exports 9,268 9,536 9,521 9,515 9,514 9,514 9,505 9,497 9,490 9,494 9,497
(Dollars per ton, Sep.-Aug. year) Price, IL points 183.47 159.34 158.14 158.25 158.75 158.86 159.61 159.44 159.60 159.69 158.80 DDGS price/corn price 116% 107% 108% 109% 109% 110% 111% 112% 114% 114% 115%
Corn gluten feed (Thousand tons, Sep.-Aug. year) Production 8,957 8,854 8,722 8,712 8,756 8,800 8,824 8,817 8,765 8,709 8,659 Domestic use 7,885 7,773 7,665 7,675 7,739 7,799 7,843 7,856 7,825 7,793 7,763 Net exports 1,072 1,081 1,057 1,036 1,017 1,001 981 961 939 916 895
(Dollars per ton, Sep.-Aug. year) Price, 21%, IL points 128.03 115.51 114.64 114.41 114.35 114.00 114.03 113.52 113.38 113.39 112.67 CGF price/corn price 81% 77% 79% 79% 79% 79% 79% 80% 81% 81% 82%
Corn gluten meal (Thousand tons, Sep.-Aug. year) Production 2,357 2,330 2,295 2,293 2,304 2,316 2,322 2,320 2,306 2,292 2,279 Domestic use 1,356 1,279 1,235 1,222 1,224 1,227 1,225 1,214 1,192 1,168 1,145 Net exports 1,001 1,051 1,060 1,070 1,080 1,089 1,097 1,107 1,115 1,124 1,134
(Dollars per ton, Sep.-Aug. year) Price, 60%, IL points 618.13 490.96 491.52 491.46 492.09 495.53 500.99 502.95 506.86 507.06 506.09 CGM price/soymeal price 142% 150% 150% 150% 150% 150% 149% 149% 149% 149% 149%
Corn oil (Million pounds, Oct.-Sep. year) Production 5,058 5,572 6,042 6,533 7,008 7,285 7,340 7,284 7,238 7,216 7,133 Domestic use 3,972 4,496 4,977 5,463 5,936 6,225 6,287 6,237 6,191 6,164 6,089 Biodiesel 1,066 1,064 1,505 1,921 2,275 2,545 2,687 2,754 2,795 2,820 2,849 Feed 948 1,579 1,571 1,663 1,786 1,942 1,973 1,903 1,804 1,771 1,731 Food/other 1,958 1,854 1,902 1,879 1,876 1,737 1,627 1,580 1,592 1,573 1,509 Net exports 1,034 1,042 1,042 1,044 1,046 1,047 1,049 1,049 1,049 1,051 1,049 Ending stocks 218 251 274 300 325 339 343 341 338 339 333
(Cents per pound, Oct.-Sep. year) Chicago price 41.42 39.17 39.29 38.86 38.38 38.54 38.07 37.86 37.87 37.30 37.63 Corn oil price/soyoil price 110% 111% 111% 111% 111% 110% 110% 111% 111% 111% 112%

As margins improved, a recovery in conventional ethanol production began in 2013 and it continues into 2014. Beyond 2014, ethanol production grows slowly as RFS requirements and export demand remain relatively flat. Cellulosic and non-corn ethanol production levels remain an uncertainty. Projections for cellulosic biofuel continue to be well below EISA levels.
Sugarcane ethanol imports from Brazil continue to decline in 2014 before leveling out. Lower RFS requirements for advanced biofuel could imply reduced ethanol imports. However, low-carbon fuel requirements in California provide some incentive for continued ethanol imports. Exports surge in 2014 before leveling off as low conventional ethanol prices keep U.S. competitive globally.
RFS requirements remain relatively flat under EPA’s proposed method, which this outlook assumes going forward. Sugarcane ethanol imports and domestic conventional ethanol eligible for the RFS are lower under the proposed rule than in EISA. Lower RFS requirements are easier to meet, so RIN prices fall in 2014 and remain flat to declining going forward.
Ethanol and biofuel policies Slow growth in ethanol production
02468
10121416
2007 2009 2011 2013 2015 2017 2019 2021 2023
Calendar yearBi
llion
gallo
ns
Corn starch ethanol production Other ethanol production
RFS requirements based on EPA proposed method
02468
1012141618
2011 2013 2015 2017 2019 2021 2023
Calendar year
Billio
n ga
llons
(eth
anol
eqv.
)
Conventional gap Advanced gap Biomass-based diesel Cellulosic
FAPRI-MU Report #02-14 - 2014 U.S. Baseline Briefing Book - Page 35
U.S. remains net exporter of ethanol
0.0
0.2
0.4
0.6
0.8
1.0
1.2
1.4
2007 2009 2011 2013 2015 2017 2019 2021 2023
Calendar year
Billio
n ga
llons
Imports Exports
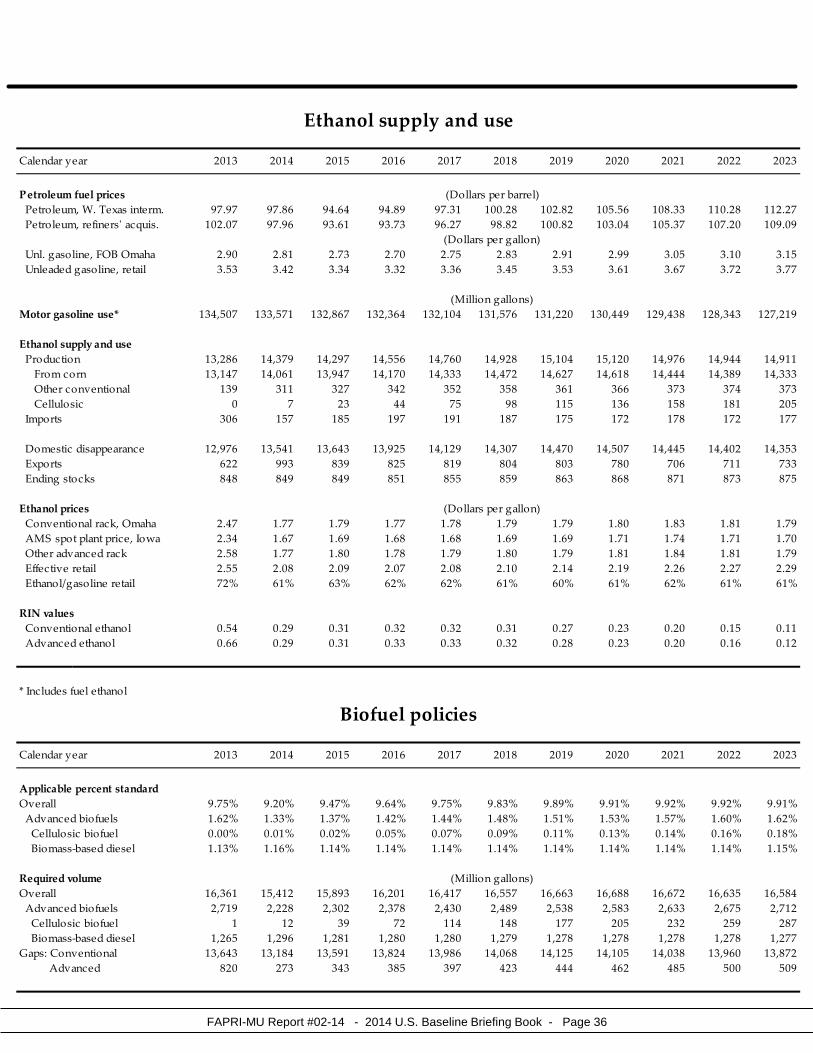
FAPRI-MU Report #02-14 - 2014 U.S. Baseline Briefing Book - Page 36
Ethanol supply and use
Calendar year 2013 2014 2015 2016 2017 2018 2019 2020 2021 2022 2023
Petroleum fuel prices (Dollars per barrel) Petroleum, W. Texas interm. 97.97 97.86 94.64 94.89 97.31 100.28 102.82 105.56 108.33 110.28 112.27 Petroleum, refiners' acquis. 102.07 97.96 93.61 93.73 96.27 98.82 100.82 103.04 105.37 107.20 109.09
(Dollars per gallon) Unl. gasoline, FOB Omaha 2.90 2.81 2.73 2.70 2.75 2.83 2.91 2.99 3.05 3.10 3.15 Unleaded gasoline, retail 3.53 3.42 3.34 3.32 3.36 3.45 3.53 3.61 3.67 3.72 3.77
Motor gasoline use* 134,507 133,571 132,867 132,364 132,104 131,576 131,220 130,449 129,438 128,343 127,219
Ethanol supply and use Production 13,286 14,379 14,297 14,556 14,760 14,928 15,104 15,120 14,976 14,944 14,911 From corn 13,147 14,061 13,947 14,170 14,333 14,472 14,627 14,618 14,444 14,389 14,333 Other conventional 139 311 327 342 352 358 361 366 373 374 373 Cellulosic 0 7 23 44 75 98 115 136 158 181 205 Imports 306 157 185 197 191 187 175 172 178 172 177
Domestic disappearance 12,976 13,541 13,643 13,925 14,129 14,307 14,470 14,507 14,445 14,402 14,353 Exports 622 993 839 825 819 804 803 780 706 711 733 Ending stocks 848 849 849 851 855 859 863 868 871 873 875
Ethanol prices (Dollars per gallon) Conventional rack, Omaha 2.47 1.77 1.79 1.77 1.78 1.79 1.79 1.80 1.83 1.81 1.79 AMS spot plant price, Iowa 2.34 1.67 1.69 1.68 1.68 1.69 1.69 1.71 1.74 1.71 1.70 Other advanced rack 2.58 1.77 1.80 1.78 1.79 1.80 1.79 1.81 1.84 1.81 1.79 Effective retail 2.55 2.08 2.09 2.07 2.08 2.10 2.14 2.19 2.26 2.27 2.29 Ethanol/gasoline retail 72% 61% 63% 62% 62% 61% 60% 61% 62% 61% 61%
RIN values Conventional ethanol 0.54 0.29 0.31 0.32 0.32 0.31 0.27 0.23 0.20 0.15 0.11 Advanced ethanol 0.66 0.29 0.31 0.33 0.33 0.32 0.28 0.23 0.20 0.16 0.12
* Includes fuel ethanol
Biofuel policies
Calendar year 2013 2014 2015 2016 2017 2018 2019 2020 2021 2022 2023
Applicable percent standardOverall 9.75% 9.20% 9.47% 9.64% 9.75% 9.83% 9.89% 9.91% 9.92% 9.92% 9.91% Advanced biofuels 1.62% 1.33% 1.37% 1.42% 1.44% 1.48% 1.51% 1.53% 1.57% 1.60% 1.62% Cellulosic biofuel 0.00% 0.01% 0.02% 0.05% 0.07% 0.09% 0.11% 0.13% 0.14% 0.16% 0.18% Biomass-based diesel 1.13% 1.16% 1.14% 1.14% 1.14% 1.14% 1.14% 1.14% 1.14% 1.14% 1.15%
Required volume (Million gallons)Overall 16,361 15,412 15,893 16,201 16,417 16,557 16,663 16,688 16,672 16,635 16,584 Advanced biofuels 2,719 2,228 2,302 2,378 2,430 2,489 2,538 2,583 2,633 2,675 2,712 Cellulosic biofuel 1 12 39 72 114 148 177 205 232 259 287 Biomass-based diesel 1,265 1,296 1,281 1,280 1,280 1,279 1,278 1,278 1,278 1,278 1,277Gaps: Conventional 13,643 13,184 13,591 13,824 13,986 14,068 14,125 14,105 14,038 13,960 13,872 Advanced 820 273 343 385 397 423 444 462 485 500 509
(Million gallons)

The outlook assumes the RFS requirements for biomass-based diesel remain at 1.28 billion gallons going forward. Biodiesel production falls in 2014 without the blenders tax credit in place. Biomass-based diesel production from corn oil continues to increase as more dry mill ethanol plants extract corn oil. Cellulosic diesel production levels increase slightly over time but remain relatively small.
Domestic biomass-based diesel use falls from the level achieved in 2013, but remains at or just above the RFS requirement going forward. The stochastic simulations include many outcomes in which extra biomass-based diesel is used to help meet the advanced or overall mandates. In 2013, the U.S. was a strong net importer of biomass-based diesel, but is projected to be a moderate net exporter going forward.
Dry mill ethanol net returns over operating costs decline in 2014 and then remain relatively stable. Biomass-based diesel net returns fall sharply in 2014 without the blenders tax credit in place. Biomass-based diesel net returns remain relatively low given excess capacity in the industry.
Biomass-based diesel and biofuel plant returns Biomass-based diesel production recovers slowly
0.00.20.40.60.81.01.21.41.6
2007 2009 2011 2013 2015 2017 2019 2021 2023
Calendar yearBi
llion
gallo
ns
Soy oil Corn oil Other fats/oils Renewable diesel Cellulosic diesel
Biomass-based diesel use exceeds RFS mandate
0.00.20.40.60.81.01.21.41.61.8
2007 2009 2011 2013 2015 2017 2019 2021 2023
Calendar year
Billio
n ga
llons
RFS requirement Domestic use
FAPRI-MU Report #02-14 - 2014 U.S. Baseline Briefing Book - Page 37
Biofuel net returns show modest growth beyond 2014
-0.20
0.00
0.20
0.40
0.60
0.80
1.00
2007 2009 2011 2013 2015 2017 2019 2021 2023
Calendar year
Dolla
rs p
er g
allon
Dry mill ethanol Soy oil biodiesel
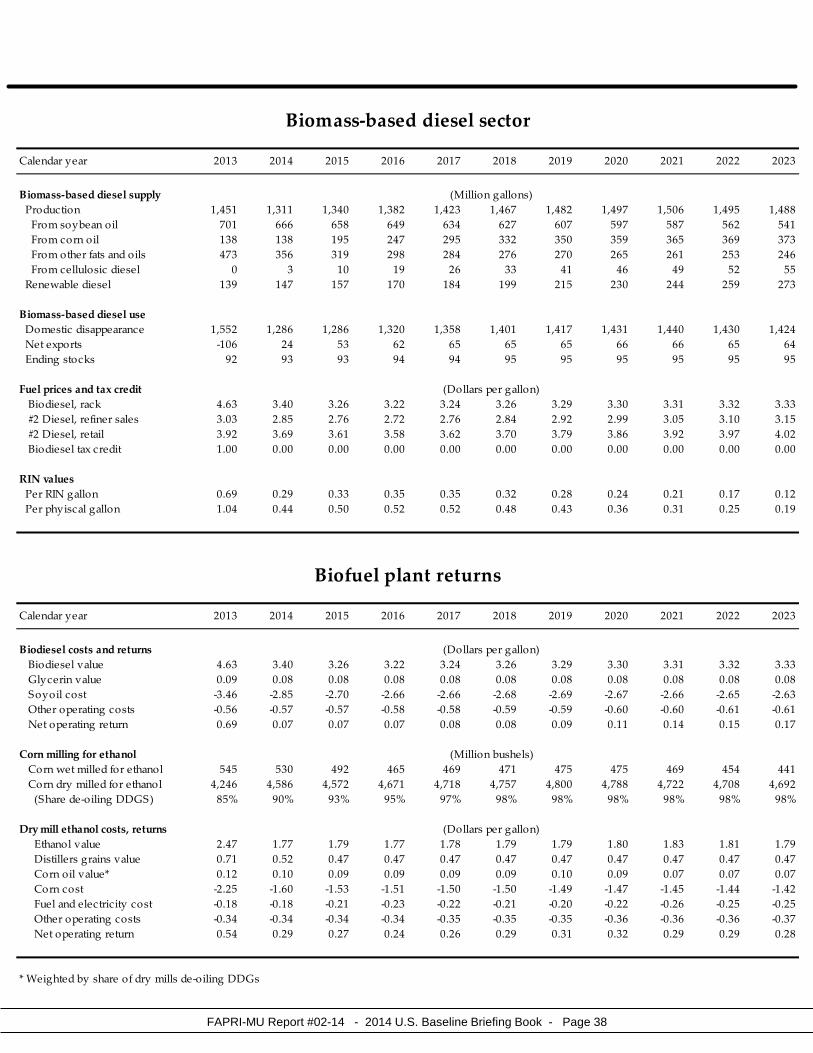
FAPRI-MU Report #02-14 - 2014 U.S. Baseline Briefing Book - Page 38
Biomass-based diesel sector
Calendar year 2013 2014 2015 2016 2017 2018 2019 2020 2021 2022 2023
Biomass-based diesel supply (Million gallons) Production 1,451 1,311 1,340 1,382 1,423 1,467 1,482 1,497 1,506 1,495 1,488 From soybean oil 701 666 658 649 634 627 607 597 587 562 541 From corn oil 138 138 195 247 295 332 350 359 365 369 373 From other fats and oils 473 356 319 298 284 276 270 265 261 253 246 From cellulosic diesel 0 3 10 19 26 33 41 46 49 52 55 Renewable diesel 139 147 157 170 184 199 215 230 244 259 273
Biomass-based diesel use Domestic disappearance 1,552 1,286 1,286 1,320 1,358 1,401 1,417 1,431 1,440 1,430 1,424 Net exports -106 24 53 62 65 65 65 66 66 65 64 Ending stocks 92 93 93 94 94 95 95 95 95 95 95
Fuel prices and tax credit (Dollars per gallon) Biodiesel, rack 4.63 3.40 3.26 3.22 3.24 3.26 3.29 3.30 3.31 3.32 3.33 #2 Diesel, refiner sales 3.03 2.85 2.76 2.72 2.76 2.84 2.92 2.99 3.05 3.10 3.15 #2 Diesel, retail 3.92 3.69 3.61 3.58 3.62 3.70 3.79 3.86 3.92 3.97 4.02 Biodiesel tax credit 1.00 0.00 0.00 0.00 0.00 0.00 0.00 0.00 0.00 0.00 0.00
RIN values Per RIN gallon 0.69 0.29 0.33 0.35 0.35 0.32 0.28 0.24 0.21 0.17 0.12 Per phyiscal gallon 1.04 0.44 0.50 0.52 0.52 0.48 0.43 0.36 0.31 0.25 0.19
Calendar year 2013 2014 2015 2016 2017 2018 2019 2020 2021 2022 2023
Biodiesel costs and returns (Dollars per gallon) Biodiesel value 4.63 3.40 3.26 3.22 3.24 3.26 3.29 3.30 3.31 3.32 3.33 Glycerin value 0.09 0.08 0.08 0.08 0.08 0.08 0.08 0.08 0.08 0.08 0.08 Soyoil cost -3.46 -2.85 -2.70 -2.66 -2.66 -2.68 -2.69 -2.67 -2.66 -2.65 -2.63 Other operating costs -0.56 -0.57 -0.57 -0.58 -0.58 -0.59 -0.59 -0.60 -0.60 -0.61 -0.61 Net operating return 0.69 0.07 0.07 0.07 0.08 0.08 0.09 0.11 0.14 0.15 0.17
Corn milling for ethanol (Million bushels) Corn wet milled for ethanol 545 530 492 465 469 471 475 475 469 454 441 Corn dry milled for ethanol 4,246 4,586 4,572 4,671 4,718 4,757 4,800 4,788 4,722 4,708 4,692 (Share de-oiling DDGS) 85% 90% 93% 95% 97% 98% 98% 98% 98% 98% 98%
Dry mill ethanol costs, returns (Dollars per gallon) Ethanol value 2.47 1.77 1.79 1.77 1.78 1.79 1.79 1.80 1.83 1.81 1.79 Distillers grains value 0.71 0.52 0.47 0.47 0.47 0.47 0.47 0.47 0.47 0.47 0.47 Corn oil value* 0.12 0.10 0.09 0.09 0.09 0.09 0.10 0.09 0.07 0.07 0.07 Corn cost -2.25 -1.60 -1.53 -1.51 -1.50 -1.50 -1.49 -1.47 -1.45 -1.44 -1.42 Fuel and electricity cost -0.18 -0.18 -0.21 -0.23 -0.22 -0.21 -0.20 -0.22 -0.26 -0.25 -0.25 Other operating costs -0.34 -0.34 -0.34 -0.34 -0.35 -0.35 -0.35 -0.36 -0.36 -0.36 -0.37 Net operating return 0.54 0.29 0.27 0.24 0.26 0.29 0.31 0.32 0.29 0.29 0.28
* Weighted by share of dry mills de-oiling DDGs
Biofuel plant returns

After reaching record annual highs in 2013, fed and feeder steer prices are expected to sharply increase again in 2014. The record feeder steer prices will combine with a decrease in cow-calf production costs to yield average net returns of well over $200 per cow in both 2014 and 2015. Feedlots margins should increase in 2014, as higher fed steer prices and cheaper corn offset more expensive feeder cattle.
Beef cow inventories declined during 2013 for the seventh consecutive year. This will result in a 2014 calf crop that is more than 10 percent below the average of the early 2000s. Cattle imports were also at their lowest level in 8 years in 2013 as the combined herds of Canada and Mexico contract.
Strong expected profitability in the pork sector will lead to an increase in the U.S. sow herd. Productivity growth in the hog sector has driven most of the pork production increase in recent years, though the PED virus has caused great uncertainty. If the disease is not effectively controlled soon, productivity and therefore pork production estimates for 2014 will need to be revised downward.
Cattle and hogs Record high cattle prices to continue
60
80
100
120
140
160
180
200
2007 2009 2011 2013 2015 2017 2019 2021 2023Do
llars
per
cwt
. Fed steer Feeder steer
FAPRI-MU Report #02-14 - 2014 U.S. Baseline Briefing Book - Page 39
It will take time to rebuild the cattle herd
3031323334353637383940
2007 2009 2011 2013 2015 2017 2019 2021 2023
Milli
on h
ead
Calf crop Cattle imports
PED virus effects on the pork supply are unknown
18
19
20
21
22
23
24
2007 2009 2011 2013 2015 2017 2019 2021 2023
Pig
crop
/ av
erag
e so
w nu
mbe
rs
Pig crop per sow

FAPRI-MU Report #02-14 - 2014 U.S. Baseline Briefing Book - Page 40
Cattle and hogs
Calendar year 2013 2014 2015 2016 2017 2018 2019 2020 2021 2022 2023
CATTLE (Million head)Beef cows (Jan. 1) 29.3 28.9 29.4 30.0 30.6 30.9 30.9 30.8 30.5 30.3 30.1Dairy cows (Jan. 1) 9.2 9.2 9.3 9.4 9.5 9.6 9.6 9.6 9.6 9.6 9.7Cattle and calves (Jan. 1) 89.3 87.7 87.9 89.0 89.9 90.8 91.3 91.1 90.5 89.8 89.2Cattle on feed (Jan. 1) 13.4 12.5 13.0 13.4 13.5 13.7 13.9 13.9 13.9 13.9 13.8
Calf crop 33.6 33.5 34.2 34.9 35.5 35.8 35.8 35.7 35.6 35.4 35.2Cattle slaughter 33.3 31.5 31.4 32.1 32.7 33.5 34.2 34.5 34.4 34.2 34.0
Cattle imports 2.0 2.0 2.1 2.1 2.2 2.2 2.2 2.3 2.3 2.3 2.3Cattle exports 0.2 0.2 0.2 0.2 0.2 0.2 0.2 0.2 0.2 0.2 0.2
Prices Total all grades, (Dollars per hundredweight) 5-Area direct steers 125.89 137.20 137.74 131.94 128.01 124.09 121.08 120.22 122.29 124.44 126.73 600 - 650 #, Oklahoma City Feeder steers 158.80 184.07 185.82 173.66 165.11 156.33 150.09 147.64 150.96 154.73 158.70 Utility cows, S ioux Falls 76.38 85.66 86.60 78.89 72.71 68.88 64.54 61.94 62.95 64.49 66.00
Cow-calf returns (Dollars per cow) Receipts 837.50 938.98 942.78 875.11 827.03 784.03 751.36 737.37 753.07 771.39 790.57 Feed expenses 259.75 227.22 205.51 202.86 202.67 205.13 207.24 208.07 207.23 206.21 204.87 Non-feed expenses 469.91 479.49 486.12 491.77 500.02 503.59 506.80 512.78 521.98 529.31 537.02 Net returns 107.84 232.28 251.16 180.48 124.34 75.30 37.32 16.52 23.86 35.86 48.69
HOGS (Million head)Hogs for breeding (Dec. 1*) 5.82 5.76 5.82 5.92 5.93 5.86 5.78 5.70 5.63 5.63 5.64Market hogs (Dec. 1*) 60.6 60.2 60.0 62.4 64.1 64.5 64.4 64.1 64.0 64.2 64.9
Sows farrowed 11.41 11.54 11.79 11.93 11.89 11.75 11.61 11.48 11.44 11.47 11.52Pig crop 116.6 118.8 123.2 125.8 126.6 126.4 126.1 125.9 126.6 128.2 129.9Barrow and gilt slaughter 108.6 109.6 111.9 115.4 117.5 117.9 117.9 117.7 118.0 119.1 120.6
Hog imports 4.9 5.0 5.0 5.1 5.1 5.1 5.2 5.2 5.3 5.3 5.3Hog exports 0.0 0.0 0.0 0.0 0.0 0.0 0.0 0.0 0.0 0.0 0.0
Prices Natl. base 51-52% lean equiv. (Dollars per hundredweight) Barrows & gilts 64.05 64.25 61.10 56.62 54.65 54.99 56.01 57.72 58.81 58.06 56.81 IA-S . Minn. #1-2, 300-400 # Sows 59.99 58.17 51.50 47.97 46.45 46.77 47.59 49.06 49.81 49.08 47.99
Farrow-finish returns (Dollars per hundredweight) Receipts 66.82 66.50 63.02 58.23 56.23 56.57 57.61 59.35 60.45 59.69 58.42 Feed expenses 47.81 37.93 34.79 34.46 34.28 34.33 34.28 34.29 34.17 34.08 33.98 Non-feed expenses 21.97 21.92 21.95 22.14 22.37 22.57 22.74 22.97 23.24 23.43 23.63 Net returns -2.96 6.65 6.29 1.63 -0.41 -0.32 0.59 2.09 3.04 2.18 0.82
* Preceding year

The total of U.S. beef, pork, chicken and turkey production will increase at a rate slower than U.S. population growth for the fourth time in a row in 2014. As all livestock sectors adjust to the reduced input costs that have now been in effect for a few months, production growth will resume in 2015. It will still take several years to return to the 2008 level of meat production per person.
Reduced meat supplies have not yet negatively affected trade volumes. With international demand for U.S. meat products remaining strong, the amount of meat available for the domestic market will decline in 2014 for the seventh time in eight years. The U.S. exported 17 percent of total meat production in 2013, and this share will show modest growth during the projection period.
Retail prices for most meat products will continue to climb in 2014, though at a slower rate than in recent years. Beef prices remain firm relative to other products. One pound of beef at the retail level will cost about the same as one pound of pork plus one pound of chicken in 2014. A slowly strengthening economy should allow meat demand strength to remain at or above current levels in the absence of a food safety scare.
Meat
FAPRI-MU Report #02-14 - 2014 U.S. Baseline Briefing Book - Page 41
Meat production has lagged U.S. population growth
280
285
290
295
300
305
310
315
2007 2009 2011 2013 2015 2017 2019 2021 2023Po
unds
per
U.S
. res
ident
Meat production (carcass weight basis)
Meat trade remains firm even as prices increase
4
6
8
10
12
14
16
18
2007 2009 2011 2013 2015 2017 2019 2021 2023
Billio
n po
unds
Meat net exports
Retail beef prices climb in 2014
0
1
2
3
4
5
6
7
2007 2009 2011 2013 2015 2017 2019 2021 2023
Dolla
rs p
er p
ound
Pork Chicken Beef

FAPRI-MU Report #02-14 - 2014 U.S. Baseline Briefing Book - Page 42
Meat sector
Calendar year 2013 2014 2015 2016 2017 2018 2019 2020 2021 2022 2023
Beef (Million pounds) Production 25,800 24,451 24,473 25,143 25,731 26,426 27,025 27,377 27,408 27,360 27,266 Imports 2,254 2,357 2,458 2,539 2,578 2,612 2,650 2,685 2,727 2,730 2,730 Domestic use 25,533 24,399 24,475 25,079 25,563 26,154 26,649 26,948 26,981 26,920 26,812 Exports 2,534 2,479 2,453 2,576 2,726 2,860 3,006 3,102 3,152 3,174 3,189 Ending stocks 595 525 529 556 576 600 619 631 633 630 625
Pork Production 23,212 23,674 24,341 25,202 25,760 25,938 26,025 26,081 26,245 26,576 27,013 Imports 876 880 885 901 902 908 916 926 935 944 951 Domestic use 19,139 19,372 19,734 20,361 20,741 20,771 20,702 20,584 20,561 20,720 20,984 Exports 4,974 5,194 5,493 5,707 5,901 6,074 6,243 6,429 6,620 6,791 6,966 Ending stocks 600 589 588 623 643 644 640 633 632 640 654
Broiler Production 37,347 38,626 39,905 40,674 41,396 42,046 42,650 43,200 43,759 44,317 44,904 Domestic use 30,001 31,150 32,235 32,875 33,434 33,923 34,366 34,754 35,151 35,555 35,976 Exports 7,416 7,583 7,752 7,905 8,073 8,240 8,405 8,570 8,733 8,891 9,056 Ending stocks 700 705 737 748 755 758 760 760 761 761 762
Turkey Production 5,734 5,794 6,040 6,184 6,287 6,368 6,437 6,488 6,533 6,580 6,625 Domestic use 5,030 5,004 5,237 5,377 5,470 5,542 5,603 5,645 5,680 5,719 5,755 Exports 767 780 800 815 830 842 852 862 872 882 892 Ending stocks 255 285 309 323 331 337 341 346 350 353 356
Wholesale prices (Dollars per hundredweight) Boxed beef cutout 195.66 212.19 213.09 206.17 202.05 197.92 194.65 194.18 197.60 201.10 204.76 Pork cutout 91.73 93.61 90.07 84.18 82.22 83.53 85.83 88.96 90.78 90.71 89.85 National wholesale broiler 99.70 93.56 89.58 89.22 89.64 90.47 91.15 92.15 93.07 94.00 94.72 Natl. wholesale turkey hens 99.80 102.05 95.53 93.55 93.47 94.12 94.79 95.50 96.41 97.19 98.01
Retail prices (Dollars per pound) Beef 5.29 5.51 5.64 5.59 5.52 5.46 5.41 5.39 5.53 5.65 5.77 Pork 3.64 3.70 3.67 3.58 3.53 3.61 3.73 3.85 3.95 3.94 3.92 Broiler 1.96 1.95 1.93 1.93 1.94 1.96 1.99 2.01 2.04 2.06 2.09 Turkey 1.66 1.67 1.65 1.62 1.63 1.65 1.67 1.69 1.72 1.74 1.76
Per capita consumption (Pounds, retail) Beef 56.4 53.5 53.3 54.2 54.8 55.6 56.2 56.4 56.1 55.6 54.9 Pork 46.9 47.1 47.6 48.7 49.3 49.0 48.4 47.8 47.4 47.4 47.7 Broiler 81.4 83.8 86.1 87.1 87.9 88.5 89.0 89.3 89.7 90.0 90.4 Turkey 15.9 15.7 16.3 16.6 16.7 16.8 16.9 16.9 16.9 16.9 16.8 Total 200.6 200.1 203.2 206.6 208.7 210.0 210.6 210.5 210.0 209.9 209.9

Cheese and nonfat dry milk prices are expected to average near $1.80 per pound in 2014. These projected product prices translate to an all milk price expected to exceed $20 per cwt. this year, before declining to the $17-18 range later in the projection period. Milk prices at that level, when combined with declining feed costs, should lead to strongly positive profit margins for most dairy producers in 2014.
Milk production is projected to increase at its highest rate since 2006 in 2014. Even with a strong rate of production growth in 2014, demand should be strong enough to prevent a decline in milk prices, setting the stage for another year of strong growth in 2015. The dairy margin program contained in the 2014 farm bill would provide more support to producers in the event of poor margin years such as 2012 and 2009.
International dairy product prices are near record highs at the beginning of 2014. The U.S. is able to export large quantities of milk powders into world markets at these price levels. Cheese and butter exports benefit to a lesser extent. The strong international market prices are due in part to supply factors in major exporting nations, which are likely temporary. However, strong demand, particularly for milk powder in China, may be a longer lasting market phenomenon.
Dairy
FAPRI-MU Report #02-14 - 2014 U.S. Baseline Briefing Book - Page 43
High international prices fuel dairy product exports
0200400600800
1,0001,2001,4001,6001,800
2007 2009 2011 2013 2015 2017 2019 2021 2023
Milli
on p
ound
s
Nonfat dry milk Cheese Butter
Better margins will lead to higher milk output
-0.5
0.0
0.5
1.0
1.5
2.0
2.5
3.0
2007 2009 2011 2013 2015 2017 2019 2021 2023
Perc
ent
Milk production growth
Cheese and NFD prices to remain strong
0.80
1.00
1.20
1.40
1.60
1.80
2.00
2.20
2007 2009 2011 2013 2015 2017 2019 2021 2023Do
llars
per
pou
nd
Cheese Butter Nonfat dry milk
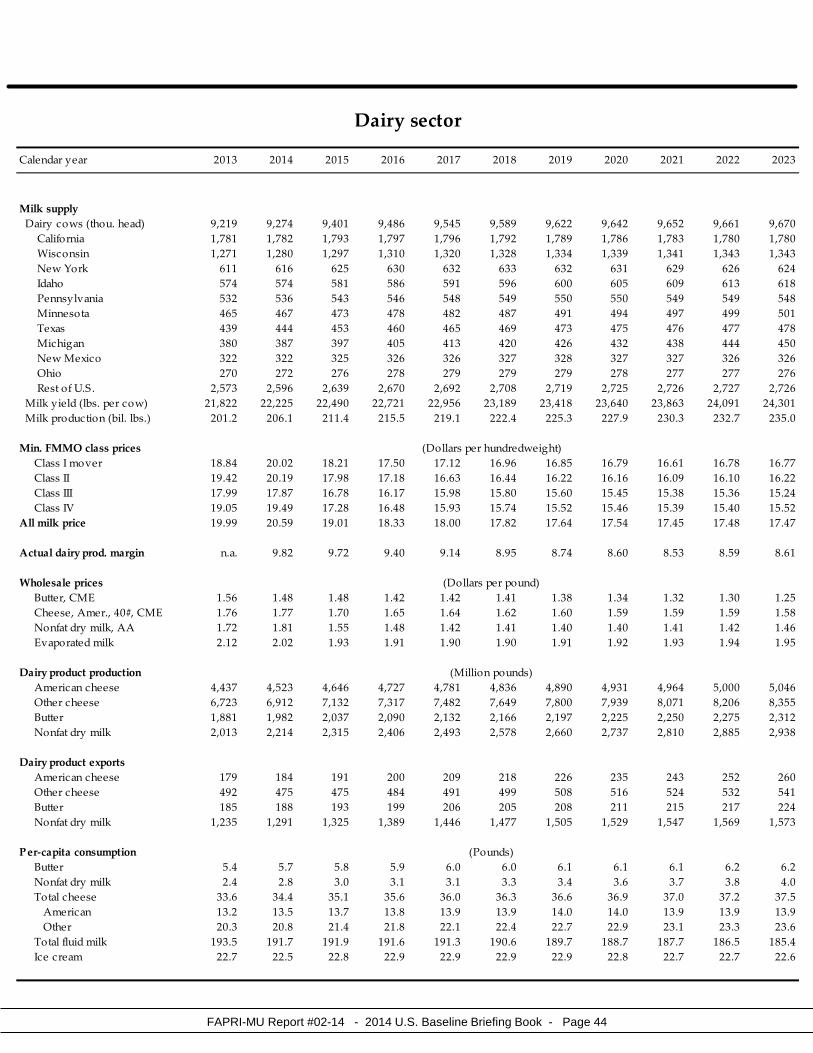
FAPRI-MU Report #02-14 - 2014 U.S. Baseline Briefing Book - Page 44
Dairy sector
Calendar year 2013 2014 2015 2016 2017 2018 2019 2020 2021 2022 2023
Milk supply Dairy cows (thou. head) 9,219 9,274 9,401 9,486 9,545 9,589 9,622 9,642 9,652 9,661 9,670 California 1,781 1,782 1,793 1,797 1,796 1,792 1,789 1,786 1,783 1,780 1,780 Wisconsin 1,271 1,280 1,297 1,310 1,320 1,328 1,334 1,339 1,341 1,343 1,343 New York 611 616 625 630 632 633 632 631 629 626 624 Idaho 574 574 581 586 591 596 600 605 609 613 618 Pennsylvania 532 536 543 546 548 549 550 550 549 549 548 Minnesota 465 467 473 478 482 487 491 494 497 499 501 Texas 439 444 453 460 465 469 473 475 476 477 478 Michigan 380 387 397 405 413 420 426 432 438 444 450 New Mexico 322 322 325 326 326 327 328 327 327 326 326 Ohio 270 272 276 278 279 279 279 278 277 277 276 Rest of U.S . 2,573 2,596 2,639 2,670 2,692 2,708 2,719 2,725 2,726 2,727 2,726 Milk yield (lbs. per cow) 21,822 22,225 22,490 22,721 22,956 23,189 23,418 23,640 23,863 24,091 24,301 Milk production (bil. lbs.) 201.2 206.1 211.4 215.5 219.1 222.4 225.3 227.9 230.3 232.7 235.0
Min. FMMO class prices Class I mover 18.84 20.02 18.21 17.50 17.12 16.96 16.85 16.79 16.61 16.78 16.77 Class II 19.42 20.19 17.98 17.18 16.63 16.44 16.22 16.16 16.09 16.10 16.22 Class III 17.99 17.87 16.78 16.17 15.98 15.80 15.60 15.45 15.38 15.36 15.24 Class IV 19.05 19.49 17.28 16.48 15.93 15.74 15.52 15.46 15.39 15.40 15.52All milk price 19.99 20.59 19.01 18.33 18.00 17.82 17.64 17.54 17.45 17.48 17.47
Actual dairy prod. margin n.a. 9.82 9.72 9.40 9.14 8.95 8.74 8.60 8.53 8.59 8.61
Wholesale prices (Dollars per pound) Butter, CME 1.56 1.48 1.48 1.42 1.42 1.41 1.38 1.34 1.32 1.30 1.25 Cheese, Amer., 40#, CME 1.76 1.77 1.70 1.65 1.64 1.62 1.60 1.59 1.59 1.59 1.58 Nonfat dry milk, AA 1.72 1.81 1.55 1.48 1.42 1.41 1.40 1.40 1.41 1.42 1.46 Evaporated milk 2.12 2.02 1.93 1.91 1.90 1.90 1.91 1.92 1.93 1.94 1.95
Dairy product production (Million pounds) American cheese 4,437 4,523 4,646 4,727 4,781 4,836 4,890 4,931 4,964 5,000 5,046 Other cheese 6,723 6,912 7,132 7,317 7,482 7,649 7,800 7,939 8,071 8,206 8,355 Butter 1,881 1,982 2,037 2,090 2,132 2,166 2,197 2,225 2,250 2,275 2,312 Nonfat dry milk 2,013 2,214 2,315 2,406 2,493 2,578 2,660 2,737 2,810 2,885 2,938
Dairy product exports American cheese 179 184 191 200 209 218 226 235 243 252 260 Other cheese 492 475 475 484 491 499 508 516 524 532 541 Butter 185 188 193 199 206 205 208 211 215 217 224 Nonfat dry milk 1,235 1,291 1,325 1,389 1,446 1,477 1,505 1,529 1,547 1,569 1,573
Per-capita consumption (Pounds) Butter 5.4 5.7 5.8 5.9 6.0 6.0 6.1 6.1 6.1 6.2 6.2 Nonfat dry milk 2.4 2.8 3.0 3.1 3.1 3.3 3.4 3.6 3.7 3.8 4.0 Total cheese 33.6 34.4 35.1 35.6 36.0 36.3 36.6 36.9 37.0 37.2 37.5 American 13.2 13.5 13.7 13.8 13.9 13.9 14.0 14.0 13.9 13.9 13.9 Other 20.3 20.8 21.4 21.8 22.1 22.4 22.7 22.9 23.1 23.3 23.6 Total fluid milk 193.5 191.7 191.9 191.6 191.3 190.6 189.7 188.7 187.7 186.5 185.4 Ice cream 22.7 22.5 22.8 22.9 22.9 22.9 22.9 22.8 22.7 22.7 22.6
(Dollars per hundredweight)

The CPI for food at home is projected to increase by 2.0 percent in 2014, very near the average of the previous five years. Food away from home price inflation, which is typically less volatile than food at home inflation, will also be near two percent. Spending on food away from home accounts for nearly one half of all U.S. food consumer expenditures.
After generally larger increases from 2007-2013 vs. the previous decade, most components of food inflation are expected to grow more slowly in the next decade. Fruit and vegetable prices have not followed the general trend, and they could be higher than projected if the drought in California persists. Macroeconomic projections are a key factor in future food price inflation, as raw commodity values only account for 15-20 percent of U.S. consumer food spending.
Food prices and expenditures
Food accounted for less than 7 percent of U.S. consumer expenditures in 2012, lower than all of the other 80 countries that USDA tracks. However, the increase in per capita real food expenditures from 2010-2013 does pose a challenge for many families, particularly when combined with a slowly recovering economy. Food costs should moderate for the next couple of years, assuming that average weather allows for projected crop yields.
Food inflation expected near 2 percent in 2014
0
1
2
3
4
5
6
7
2007 2009 2011 2013 2015 2017 2019 2021 2023Pe
rcen
t cha
nge
Food at home Food away from home
FAPRI-MU Report #02-14 - 2014 U.S. Baseline Briefing Book - Page 45
Real per capita food expenditures to decline in 2015
4,000
4,050
4,100
4,150
4,200
4,250
4,300
4,350
2007 2009 2011 2013 2015 2017 2019 2021 2023
2013
doll
ars
per p
erso
n
Food expenditures
Lower inflation expected for most food categories
0.0
0.5
1.0
1.5
2.0
2.5
3.0
3.5
4.0
Food C & B Meat Dairy F & V Away
Aver
age
perc
ent c
hang
e
1997-2006 2007-2013 2014-2023

FAPRI-MU Report #02-14 - 2014 U.S. Baseline Briefing Book - Page 46
Consumer price indices for food
Calendar year 2013 2014 2015 2016 2017 2018 2019 2020 2021 2022 2023
(1982-84=100)Total food 237.0 241.7 244.4 247.6 251.7 256.3 261.0 265.8 271.1 276.4 281.6 (Inflation rate) 1.4% 2.0% 1.1% 1.3% 1.7% 1.8% 1.8% 1.8% 2.0% 2.0% 1.9%
Food at home 233.9 238.4 240.3 243.0 246.7 250.9 255.2 259.7 264.9 270.0 274.9 Cereal and bakery 270.4 270.4 270.6 273.7 277.3 281.2 284.9 289.0 293.3 297.5 301.5 Meat 236.0 243.1 246.0 247.1 249.7 253.3 257.6 262.6 269.0 275.4 281.4 Dairy 217.6 221.0 220.2 221.8 224.5 227.8 231.2 234.8 238.8 242.9 246.7 Fruit and vegetables 290.0 298.7 303.2 309.6 317.3 325.2 332.8 340.4 348.3 356.2 363.9 Other food at home 204.8 207.6 209.1 211.4 214.2 217.3 220.4 223.5 226.9 230.3 233.5 Sugar and sweets 211.0 212.3 214.8 218.5 221.5 224.9 228.2 231.5 235.1 238.7 242.1 Fats and oils 229.3 232.1 232.4 235.3 239.3 243.4 247.6 252.0 256.6 261.1 265.4 Other prepared items 217.7 220.9 221.9 223.7 226.5 229.6 232.9 236.1 239.6 243.1 246.6 Non-alc . beverages 166.9 169.4 171.9 174.4 176.8 179.4 181.9 184.4 187.2 190.0 192.6
Food away from home 243.1 247.8 251.7 255.7 260.4 265.5 270.7 275.9 281.4 287.1 292.8
Consumer expenditures for food
Calendar year 2012 2013 2014 2015 2016 2017 2018 2019 2020 2021 2022
(Dollars per person)Total food per capita 4,255 4,320 4,374 4,457 4,559 4,669 4,774 4,878 4,986 5,091 5,192
Food at home 2,191 2,209 2,218 2,244 2,281 2,322 2,361 2,402 2,445 2,488 2,528 Food away from home 2,064 2,110 2,157 2,213 2,277 2,347 2,413 2,477 2,541 2,603 2,664
Multiply by population for: (Billion dollars)Total U.S. food expenditures 1,337 1,371 1,402 1,442 1,489 1,540 1,590 1,640 1,692 1,744 1,795

Government costs
Net CCC outlays were $9 billion in FY 2013, with direct payments accounting for half the total. Under the new farm bill, net CCC outlays dip sharply in FY 2015. The first payments under the PLC and ARC programs will not be made until October 2015 (FY 2016). After FY 2015, net outlays average about $8 billion per year. The last tobacco trust fund payments are made in FY 2014.
Mandatory government outlays under the crop insurance program and certain conservation and disaster programs are not included in the CCC account. Crop insurance net outlays jumped in FY 2013 because of indemnities paid on losses associated with the 2012 drought. Crop insurance net outlays average about $8 billion per year over the FY 2014-23 period.
CRP spending reflects changes in CRP area under contract and rental rates when new contracts are signed. For other mandatory conservation programs, projected expenditures are based on preliminary CBO estimates. Provisions of the 2014 farm bill lead to increased spending on the Conservation Stewardship Program, the Environmental Quality Incentive Program and other conservation programs.
CCC net outlays total $76 billion over FY 2014-23
0
2
4
6
8
10
12
14
2007 2009 2011 2013 2015 2017 2019 2021 2023
Fiscal yearBi
llion
dolla
rs
Grains, oilseeds & cotton Conservation All other
Crop insurance share of program spending increases
0
5
10
15
20
25
30
2007 2009 2011 2013 2015 2017 2019 2021 2023
Fiscal year
Billio
n do
llars
Net CCC Crop insurance Non-CCC conservation Other non-CCC
CRP outlays fall, other conservation programs rise
0
1
2
3
4
5
6
7
2007 2009 2011 2013 2015 2017 2019 2021 2023
Fiscal year
Billio
n do
llars
Conservation reserve Other mandatory conservation programs
FAPRI-MU Report #02-14 - 2014 U.S. Baseline Briefing Book - Page 47

FAPRI-MU Report #02-14 - 2014 U.S. Baseline Briefing Book - Page 48
Net government outlays
Fiscal year 2013 2014 2015 2016 2017 2018 2019 2020 2021 2022 2023
Feed grains (Million dollars) Corn 1,916 1,984 247 1,689 2,160 2,182 1,875 1,732 1,861 1,944 2,031 Sorghum 188 174 5 156 219 223 222 211 233 241 246 Barley 77 75 3 479 510 525 530 527 537 546 556 Oats 3 3 1 1 4 5 6 5 5 6 6
Food grains Wheat 1,116 1,114 94 852 1,242 1,257 1,243 1,236 1,278 1,293 1,285 Rice 292 433 17 41 160 155 160 165 167 167 158
Oilseeds Soybeans 539 586 64 798 886 895 881 666 617 577 651 Peanuts 107 36 4 84 88 109 118 131 139 151 170 Other oilseeds 18 17 12 62 65 68 73 72 75 74 76
Other commodities Upland cotton 562 695 777 314 349 354 304 324 340 240 216 Sugar, feedstock flexibility 222 -1 21 36 32 45 49 57 58 69 80 Dairy 272 -10 -17 -6 86 133 185 246 311 340 312
CCC conservation Conservation reserve 1,928 1,852 1,780 1,701 1,644 1,620 1,595 1,549 1,594 1,598 1,559 Other CCC conservation 4 5 5 5 5 1 1 1 1 1 1
Tobacco trust fund 857 960 0 0 0 0 0 0 0 0 0
Other CCC Disaster payments, NAP 318 146 142 142 142 142 142 141 141 141 141 Other net costs 745 -9,679 -5,796 -9,128 -10,416 -10,597 -10,349 -10,107 -10,095 -10,053 -10,160
Net CCC outlays 9,165 8,576 3,682 6,953 8,260 8,391 8,059 7,743 8,038 8,069 8,169
NRCS conservation 2,811 3,205 3,308 3,540 3,745 3,880 4,017 4,165 3,928 3,891 3,886
Supplem. revenue (SURE) 1,095 0 0 0 0 0 0 0 0 0 0Other non-CCC disaster 7 904 364 314 296 295 297 300 302 303 306
Crop insurance 13,807 9,715 7,751 8,003 8,082 8,131 8,238 8,311 8,321 8,366 8,463
Total mandatory outlays 26,885 22,400 15,104 18,811 20,383 20,697 20,611 20,519 20,590 20,629 20,824
Note: "NRCS Conservation" denotes mandatory spending on conservation programs authorized by the 2002, 2008 and 2014 farm bills that is not included in reported CCC outlays. Fiscal years begin on Oct.1 of the previous calendar year (FY 2014: Oct. 1, 2013-Sep. 30, 2014).All projections are averages across 500 outcomes.

Payments and crop insurance
With the new farm bill in place, no DCP or ACRE payments will be made after final ACRE and countercyclical payments are paid on the 2013/14 crop. Projected ARC and PLC payments under the new farm bill average about $5 billion per year. Marketing loan benefits may occur when prices are especially low. Unlike past direct payments, future ARC and PLC payments may vary greatly from one year to the next.
Crop insurance indemnities spiked because of the 2012 drought. The projections include the new STAX policy for cotton and SCO for program crops. While these new programs increase crop insurance premiums and indemnities, lower projected average crop prices have the opposite effect. The average annual loss ratio (total indemnities divided by total premiums) over the next 10 years is 0.90.
The crop insurance program has grown in importance relative to other farm programs. Projected net indemnities (indemnities minus producer-paid premiums) exceed the projected value of crop payments under Title I (PLC, ARC and marketing loans) of the new farm bill. Projected net USDA expenditures on the crop insurance program total $83 billion over the FY 2014-FY 2023 period.
PLC and ARC replace DCP and ACRE
0
2
4
6
8
07/08 09/10 11/12 13/14 15/16 17/18 19/20 21/22 23/24
Marketing yearBi
llion
dolla
rs
DCP, ACRE PLC ARC Marketing loans
Crop insurance indemnities set record in 2012/13
0
5
10
15
20
07/08 09/10 11/12 13/14 15/16 17/18 19/20 21/22 23/24
Marketing year
Billio
n do
llars
Indemnities Total premiums Producer-paid premiums
Net indemnities exceed Title I payments
0
2
4
6
8
10
12
14
07/08 09/10 11/12 13/14 15/16 17/18 19/20 21/22 23/24
Marketing year
Billio
n do
llars
Title I crop payments Net indemnities
FAPRI-MU Report #02-14 - 2014 U.S. Baseline Briefing Book - Page 49

FAPRI-MU Report #02-14 - 2014 U.S. Baseline Briefing Book - Page 50
Selected direct government payments
Marketing year 13/14 14/15 15/16 16/17 17/18 18/19 19/20 20/21 21/22 22/23 23/24
(Million dollars)Direct payments 4,489 n.a. n.a. n.a. n.a. n.a. n.a. n.a. n.a. n.a. n.a.Cotton transition payments n.a. 470 n.a. n.a. n.a. n.a. n.a. n.a. n.a. n.a. n.a.Marketing loans 0 247 334 412 398 474 392 482 337 404 478Countercyclical payments 0 n.a. n.a. n.a. n.a. n.a. n.a. n.a. n.a. n.a. n.a.ACRE payments 256 n.a. n.a. n.a. n.a. n.a. n.a. n.a. n.a. n.a. n.a.PLC payments n.a. 2,081 3,048 3,303 3,410 3,437 3,600 3,704 3,749 3,998 4,019ARC payments n.a. 1,914 2,100 1,944 1,416 1,124 1,055 1,074 1,111 1,162 1,171 Total 4,745 4,712 5,483 5,659 5,225 5,034 5,047 5,261 5,196 5,563 5,667
Note: Includes selected payments for feed grains, food grains, oilseeds, and upland cotton.All projections are averages across 500 outcomes.
Crop insurance
Year 2013 2014 2015 2016 2017 2018 2019 2020 2021 2022 2023
(Million dollars, crop year)Total premiums 11,773 10,449 10,727 10,859 10,979 11,145 11,253 11,239 11,263 11,339 11,474 Producer-paid premiums 4,498 3,991 4,016 4,072 4,120 4,185 4,225 4,219 4,226 4,251 4,299 Premium subsidies 7,275 6,458 6,710 6,788 6,859 6,960 7,028 7,021 7,037 7,088 7,175Total indemnities 11,850 9,430 9,669 9,780 9,848 9,988 10,084 10,089 10,132 10,235 10,398
Loss ratio 1.01 0.90 0.90 0.90 0.90 0.90 0.90 0.90 0.90 0.90 0.91(Million dollars, crop year)
Net indemnities 7,352 5,439 5,652 5,708 5,728 5,803 5,859 5,870 5,906 5,984 6,099 Corn 4,024 2,047 2,107 2,128 2,131 2,184 2,176 2,163 2,161 2,166 2,203 Soybeans 416 1,238 1,116 1,160 1,176 1,187 1,233 1,256 1,280 1,316 1,342 Wheat 1,499 815 816 808 812 818 818 817 825 834 850 Upland cotton 629 347 566 554 542 539 547 548 547 560 566 All other 784 992 1,048 1,059 1,067 1,075 1,085 1,085 1,093 1,107 1,138
(Million dollars, fiscal year)Net outlays 13,806 9,715 7,751 8,003 8,082 8,131 8,238 8,311 8,321 8,366 8,463

Farm receipts and expenses
Cash receipts from sales of program crops (grains, oilseeds, cotton and sugar) increased by $64 billion between 2007 and 2012. Lower prices result in a $39 billion drop in program crop receipts between 2012 and 2015. Receipts for other crops (including vegetables, fruits, nursery crops, hay and biomass crops) may dip slightly in 2014. The California drought adds much uncertainty to the 2014 projections.
Higher prices result in a further increase in cattle and dairy receipts in 2014. Hog and poultry receipts may not increase in 2014, but lower feed costs should help producer profit margins. Total livestock receipts decline slightly in 2015 and 2016. Milk, hog and poultry prices all decline in 2015, and cattle prices fall back from record levels beginning in 2016.
The pace of increase in farm production expenses slowed in 2013, and a decline is projected for 2014 and 2015. Feed costs more than doubled between 2005 and 2012, but are projected to decline by $13 billion between 2013 and 2015. Fertilizer and chemical costs also nearly doubled between 2005 and 2012. Lower fertilizer prices contribute to lower costs in 2013 and 2014.
Program crop receipts decline from 2012 record
020406080
100120140160
2007 2009 2011 2013 2015 2017 2019 2021 2023
Calendar year Bi
llion
dolla
rs
Program crops Other crops
Cattle and dairy receipts rise again in 2014
0
50
100
150
200
250
2007 2009 2011 2013 2015 2017 2019 2021 2023
Calendar year
Billio
n do
llars
Cattle Poultry & eggs Dairy Hogs & other
FAPRI-MU Report #02-14 - 2014 U.S. Baseline Briefing Book - Page 51
Feed and fertilizer expenses decline
0
10
20
30
40
50
60
70
2007 2009 2011 2013 2015 2017 2019 2021 2023
Calendar year
Billio
n do
llars
Feed Fertilizer & chemicals Fuel & electricity

FAPRI-MU Report #02-14 - 2014 U.S. Baseline Briefing Book - Page 52
Farm cash receipts
Calendar year 2013 2014 2015 2016 2017 2018 2019 2020 2021 2022 2023
(Billion dollars)Feed grains 71.28 62.16 59.12 59.05 59.89 60.82 61.66 62.09 62.17 62.36 62.50Food grains 17.68 15.14 14.13 13.88 13.93 13.93 13.90 13.93 13.98 14.04 14.08Oilseeds 43.60 37.40 33.42 33.13 33.43 33.91 34.51 35.10 35.64 36.01 36.29Cotton 5.32 5.53 5.62 5.66 5.64 5.71 5.77 5.78 5.81 5.87 5.88Sugar 2.88 2.53 2.69 2.75 2.79 2.80 2.80 2.80 2.80 2.80 2.79Other crops 75.37 72.09 73.95 76.15 78.46 80.73 82.86 85.07 87.41 89.67 92.02
Cattle 68.85 73.10 73.99 71.46 69.97 68.67 67.64 67.44 68.73 69.84 71.09Hogs 23.17 23.19 22.60 21.67 21.35 21.62 22.09 22.80 23.36 23.35 23.23Dairy products 40.23 42.38 40.14 39.47 39.42 39.65 39.78 40.05 40.27 40.77 41.13Poultry, eggs 44.47 43.13 42.45 42.89 43.73 44.72 45.63 46.61 47.56 48.50 49.43Other livestock 5.47 5.58 5.60 5.60 5.63 5.70 5.76 5.86 5.97 6.07 6.17
Total cash receipts 398.30 382.24 373.72 371.70 374.26 378.27 382.41 387.52 393.70 399.30 404.61
Farm production expenses
Calendar year 2013 2014 2015 2016 2017 2018 2019 2020 2021 2022 2023
(Billion dollars)Feed 58.68 50.47 45.68 45.76 46.26 46.82 47.36 47.74 47.81 47.94 47.94Purchased livestock 23.81 27.07 27.50 25.87 25.03 24.07 23.36 23.13 23.64 24.04 24.57Seed 21.27 21.59 21.35 21.42 21.61 21.97 22.43 22.92 23.49 23.95 24.28Fertilizer and chemicals 40.25 36.88 36.05 36.35 36.69 37.05 37.23 37.75 38.60 38.98 39.31Fuels and electricity 21.16 21.23 20.75 20.86 21.21 21.77 22.24 22.76 23.33 23.65 23.99
Interest 16.61 17.43 18.16 19.50 20.96 21.77 22.36 22.93 23.50 23.97 24.45Contract and hired labor 34.00 35.06 35.99 37.07 38.18 39.31 40.47 41.64 42.81 44.03 45.28Capital consumption 35.01 35.72 36.19 36.57 36.87 37.15 37.44 37.81 38.28 38.78 39.34Rent to non-operators 17.23 17.07 16.68 16.44 16.35 16.38 16.40 16.43 16.45 16.46 16.48All other 84.16 84.55 85.34 86.87 88.47 90.20 91.84 93.68 95.77 97.66 99.62
Total production expenses 352.17 347.08 343.70 346.71 351.62 356.49 361.13 366.77 373.68 379.46 385.26

Farm income Cash income and expenses decline in 2014
100150200250300350400450500
2007 2009 2011 2013 2015 2017 2019 2021 2023
Calendar year Bi
llion
dolla
rs
Gross cash income Cash expenses
Gross cash income (sales receipts and government payments) edged up in 2013 after three years of rapid growth. A larger increase in cash expenses in 2013 left net cash income slightly down from the 2012 record level. In 2014, the expected decline in gross farm income is much greater than the slight decline in cash expenses. Net cash income averages about $105 billion per year for 2014-2023.
After years of rapid growth, crop receipts fell slightly in 2013. Crop receipts drop far more sharply in 2014 and then slightly in 2015. Livestock receipts increase slightly in 2014 to a new record, but then fall back. Government payments decline temporarily in 2014. Direct payments have ceased, and any PLC and ARC benefits for the 2014 crop will not be paid until 2015.
Net farm income reached record levels in 2013 in nominal dollars, and was at the highest level since the 1970s in inflation-corrected real dollars. In 2014, sharply lower crop receipts, lower government payments and smaller additions to inventories all contribute to a large decline in net farm income. Nominal net farm income levels out after 2017 at about $90 billion per year. Real net farm income continues to decline, falling back to the 2007 level by 2023.
Net farm income declines sharply in 2014
0
20
40
60
80
100
120
140
2007 2009 2011 2013 2015 2017 2019 2021 2023
Calendar year
Billio
n do
llars
Nominal net farm income Real (2013 dollars)
Crop receipts fall in 2014, livestock rise
050
100150200250300350400450
2007 2009 2011 2013 2015 2017 2019 2021 2023
Calendar year
Billio
n do
llars
Crop receipts Livestock receipts Government payments
FAPRI-MU Report #02-14 - 2014 U.S. Baseline Briefing Book - Page 53

FAPRI-MU Report #02-14 - 2014 U.S. Baseline Briefing Book - Page 54
Farm income statistics
Calendar year 2013 2014 2015 2016 2017 2018 2019 2020 2021 2022 2023
(Billion dollars)1. Farm receipts 434.04 412.74 404.01 402.43 405.33 409.74 414.25 419.74 426.35 432.32 438.10 Crops 216.12 194.86 188.93 190.62 194.15 197.90 201.50 204.77 207.80 210.76 213.57 Livestock 182.19 187.38 184.78 181.08 180.11 180.37 180.91 182.76 185.89 188.54 191.05 Farm-related 35.73 30.50 30.29 30.72 31.07 31.47 31.84 32.22 32.65 33.03 33.49
2. Government payments 11.20 6.01 8.50 9.70 10.02 9.75 9.57 9.83 9.78 9.89 10.13
3. Gross cash income 445.24 418.75 412.51 412.13 415.34 419.48 423.82 429.57 436.13 442.21 448.23 (1 + 2)
4. Nonmoney income 24.98 26.22 26.77 26.92 26.99 27.01 27.11 27.40 27.91 28.44 29.02
5. Value of inventory Change 12.46 1.49 0.69 1.05 0.66 0.18 -0.24 -0.79 -0.68 -0.86 -0.54
6. Gross farm income 482.67 446.46 439.97 440.10 443.00 446.67 450.69 456.17 463.37 469.79 476.71 (3 + 4 + 5)
7. Cash expenses 315.13 309.14 305.18 307.75 312.31 316.85 321.14 326.33 332.66 337.83 342.95
8. Total expenses 352.17 347.08 343.70 346.71 351.62 356.49 361.13 366.77 373.68 379.46 385.26
9. Net cash income 130.11 109.61 107.33 104.37 103.04 102.64 102.68 103.24 103.47 104.38 105.28 (3 - 7)
10. Realized net farm inc 118.04 97.89 95.59 92.34 90.71 90.00 89.79 90.20 90.37 91.20 91.99 (3 + 4 - 8)
11. Net farm income 130.50 99.38 96.27 93.39 91.38 90.18 89.56 89.40 89.69 90.34 91.45 (6 - 8) Deflated (2013 $) 130.50 97.80 93.20 88.92 85.58 83.04 81.15 79.65 78.53 77.77 77.39

Corn prices depend on weather, energy prices, income growth and much more. To examine alternative futures for agricultural markets, we considered 500 different combinations of assumptions about factors driving commodity prices. Although corn prices average about $4 per bushel across the stochastic outcomes, there are some combinations of assumptions that lead to prices over $5 per bushel and some where prices drop below $3 per bushel in any given year.
PLC program costs are uncertain. If season-average market prices are above reference prices, no payments occur, but payments can be large if prices drop far below reference prices. Given all the assumptions of this analysis, average PLC costs increase from about $2 billion for the 2014/15 crop to about $4 billion for the 2023/24 crop. In some of the stochastic outcomes program spending is near zero. In others, it is more than twice the average level.
Given assumed participation rates and the projected paths of average market prices and yields, average ARC payments average about $2 billion per year in the first three years of the program but decline to just over $1 billion in later years. As with PLC, spending can be far above or below the average in any given year. The provision that limits ARC payments to 10 percent of the benchmark revenue per acre puts an upper cap on program payments.
Ranges from the 500 alternative futures
PLC program costs are uncertain
0
2
4
6
8
10
12
13/14 15/16 17/18 19/20 21/22 23/24
Marketing year
Billio
n do
llars
90th percentile Average of 500 outcomes 10th percentile
FAPRI-MU Report #02-14 - 2014 U.S. Baseline Briefing Book - Page 55
Corn prices depend on weather and much more
012345678
07/08 09/10 11/12 13/14 15/16 17/18 19/20 21/22 23/24
September-August yearDo
llars
per
bus
hel
90th percentile Average of 500 outcomes 10th percentile
ARC payments can also vary greatly
0.00.51.01.52.02.53.03.54.0
13/14 15/16 17/18 19/20 21/22 23/24
Marketing year
Billio
n do
llars
90th percentile Average of 500 outcomes 10th percentile

Given the uncertainty over spending on the new PLC and ARC programs, net CCC outlays can be far greater or less than the projected average. Average net CCC outlays are below the levels of recent years, and if prices and revenues are far above average, the conservation reserve program may be the only major CCC outlay. In contrast, low prices or per-acre revenues could trigger payments that exceed the levels of recent years.
Volatility in commodity yields and prices creates uncertain outlays for the crop insurance program. Higher crop prices, production and coverage levels increase crop insurance premiums and premium subsidies. In any given year, outlays will depend on yields, prices and resulting indemnities. In extreme weather years, indemnities and outlays can far exceed the average, as in FY 2013.
Net farm income depends on production levels and the prices of agricultural outputs and inputs, all of which are uncertain. As a result, future levels of net farm income are also quite uncertain. The sources of uncertainty considered in this analysis lead to a wide range of possible farm income levels for any given year. There are certain to be risks not captured in these 500 alternative futures.
Ranges from the 500 alternative futures
Crop insurance net outlays are also uncertain
02468
10121416
2007 2009 2011 2013 2015 2017 2019 2021 2023
Fiscal year
Billio
n do
llars
90th percentile Average of 500 outcomes 10th percentile
FAPRI-MU Report #02-14 - 2014 U.S. Baseline Briefing Book - Page 56
CCC net oulays could vary greatly from averages
02468
1012141618
2007 2009 2011 2013 2015 2017 2019 2021 2023
Fiscal yearBi
llion
dolla
rs90th percentile Average of 500 outcomes 10th percentile
Net farm income likely to remain below 2013 record
0
20
40
60
80
100
120
140
2007 2009 2011 2013 2015 2017 2019 2021 2023
Calendar year
Billio
n do
llars
90th percentile Average of 500 outcomes 10th percentile