us agricultural water conservation, emerging demands - schaible
TRANSCRIPT

The views expressed are those of the author(s) and should not be attributed to the Economic Research Service or USDA.
U.S. Agricultural Water Conservation, Emerging Demands, and the Challenge for a Sustainable Future
Glenn D. Schaible, Agricultural EconomistEconomic Research Service, USDA
A Presentation to the 2015 SWCS 70th Annual Conference, Greensboro, NC, July 26-29, 2015.

The views expressed are those of the author(s) and should not be attributed to the Economic Research Service or USDA.
Presentation Objectives ● Emerging water demands and changing water supply conditions facing U.S. irrigated agriculture. ● What these changing forces mean for agriculture: i) for agricultural water conservation, and ii) for a more sustainable irrigated agriculture sector.
Sources: (1)Schaible, G.D. and M.P. Aillery. Water Conservation in Irrigated Agriculture: Trends and Challenges in the Face of Emerging Demands, Economic Information Bulletin (EIB-99), Economic Research Service, U.S. Dept. of Agriculture, Washington, DC (September 2012), at: http://www.ers.usda.gov/media/884158/eib99.pdf .
(2) Updated information from USDA’s 2012 Census of Agriculture; its 2013 Farm and Ranch Irrigation Survey; and the latest USGS Water Use Estimates report for 2010.

The views expressed are those of the author(s) and should not be attributed to the Economic Research Service or USDA.
How Important is Irrigation to U.S. Agriculture?
● Irrigated farms accounted for $152.4 billion in sales, or 39% of the market value of agricultural products sold in 2012.
● Average per-farm value of market sales (2012): ▬ All farms . . . . . . . . . . . . . . . . . . . . . . . . . $ 187,097 ▬ Non-irrigated (dryland) farms . . . . . . $ 133,603 ▬ Irrigated farms . . . . . . . . . . . . . . . . . . . $ 514,412
● Irrigation also contributes to the value of livestock and poultry production through irrigated crop products used as animal forage and feed. Source: 2012 Census of Agriculture, National Agricultural Statistics Service (USDA, 2014)
The views expressed are those of the author(s) and should not be attributed to the Economic Research Service or USDA.
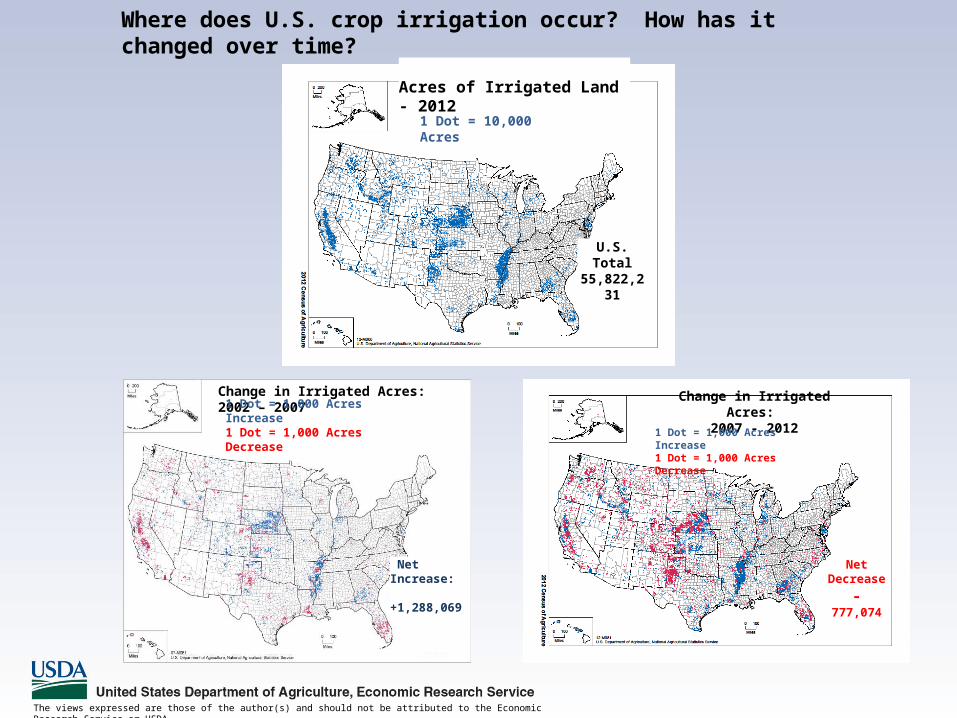
Acres of Irrigated Land - 2012
U.S. Total55,822,231
1 Dot = 10,000 Acres
Change in Irrigated Acres: 2007 - 2012
1 Dot = 1,000 Acres Increase1 Dot = 1,000 Acres Decrease
Net Increase: +1,288,069
NetDecrease
- 777,074
Change in Irrigated Acres: 2002 – 2007
1 Dot = 1,000 Acres Increase1 Dot = 1,000 Acres Decrease
Where does U.S. crop irrigation occur? How has it changed over time?

The views expressed are those of the author(s) and should not be attributed to the Economic Research Service or USDA.
Source: 2012 Census of Agriculture, National Agricultural Statistics Service (USDA, 2014)
State Shares of Total U.S. Irrigated Acres for 2012

The views expressed are those of the author(s) and should not be attributed to the Economic Research Service or USDA.
17 Western States *
Corn (for grain)
Sorghum (for grain)
1.5 %7.1 %Soybeans
8.4 %Wheat (All)
Rice 1.9 %
Oats 0.1 %
6.3%
Cotton (All)
Peanuts
0.4 %
Sugarbeets (for sugar) 1.1 %
24.5 %
Forage (all hay, haylage, grass silage, & greenchop)
7.0 %Vegetables
9.8 %
Orchards 5.3%
All Other Crops
24.5 %
31 Eastern States
Corn (for grain)24.3 %
Sorghum (for grain)0.5 %
Soybeans
29.6 %
Wheat (All)1.8 %
Rice
13.1 %
9.8 %Cotton (All)
Peanuts 2.5 %
Forage (all hay,haylage, grass silage,& greenchop) 1.6 %
Vegetables
12.5%
Orchards 4.1 %
What Does Irrigation Help Produce ?
Distribution of Harvested Irrigated Acres by Major Crop Category, 2012
* Excludes Alaska and Hawaii.
Source: 2012 Census of Agriculture, National Agricultural Statistics Service (USDA, 2014)

The views expressed are those of the author(s) and should not be attributed to the Economic Research Service or USDA.
Emerging Water Demand/Supply Conditions: Present Challenges for Irrigated Agriculture
Four primary sources for growing competing water demands / increased scarcity
1. Native American water-right claims─ Estimated at: 46 million ac.ft. annually (Western States Water Council, 1984)
2. Instream (environmental) flows ─ Shifting concept of beneficial use of surface waters: “out-of-stream development” ► “minimum instream flow” ► “environmental/ecosystem flow” 3. Water for energy expansion ─ biofuels sector; evaporative cooling technology (thermo-electric power sector); utility-scale solar power development; oil-shale development; and hydraulic fracking in deep-shale natural gas development. 4. Climate change (supply/demand) impacts ─ For the West, forecasts involve a gradual warming of temperatures ─ Shifting traditional source of freshwater supplies from stored winter snowpack to more frequent and intensive early spring rainfall. ─ reducing irrigation water supplies by reducing the quantity and timing of streamflows, reducing aquifer recharge rates, and increasing crop evapotranspiration requirements.

The views expressed are those of the author(s) and should not be attributed to the Economic Research Service or USDA.
The Challenge for Agricultural Water Conservation ─ Part 1
Continue to enhance onfarm irrigation efficiency, but from a broader “efficiency/conservation” perspective. ● With rising temperatures, existing irrigation systems become even less efficient. ● Increased competition and climate change impacts underscore the importance of the “timing and quantity (or infield mgmt.) of irrigation applications.” ● Adaptability and sustainability of irrigated agriculture will depend on more extensive adoption of higher-efficient irrigation production systems
▬ Combining efficient irrigation application systems with more intensive infield water-management practices. ● Efficient irrigation ‘production systems’ improve the ability of producers to decide when to irrigate and how much water to apply by crop growth stage ▬ applying a crop’s consumptive-use requirement, or “deficit irrigating”, while maximizing overall farm economic returns.

The views expressed are those of the author(s) and should not be attributed to the Economic Research Service or USDA.
1994 1998 2003 20080%
10%20%30%40%50%60%70%80%90%
100%
Traditional Irrigated Acres
Efficient Sprinkler & Drip/Trickle Irrigated Acres
Efficient Gravity Irrigated Acres
More efficient irrigation (as a Percent of Total Irrigated Acres),By System Type, for the 17 Western States, 1994-2008
How Efficient is Irrigated Agriculture?
Source: Schaible, Glenn D. and Marcel P. Aillery. 2015. Irrigation and Water Use. Webpage for the Economic Research Service, U.S. Department of Agriculture, at: http://www.ers.usda.gov/topics/farm-practices-management/irrigation-water-use.aspx .
More efficient gravity irrigation includes furrow irrigated acres using above- or below-ground pipe or a lined open-ditchfield water-delivery system, plus acres in flood irrigation (between borders or within basins) on farms using laser-leveling and pipe or lined open-ditch field water-delivery systems. More efficient pressure-sprinkler irrigation includes acres using either drip/trickle and low-flow micro systems or lower pressure-sprinkler systems [pressure per square-inch (PSI) < 30]. Traditional irrigation included all remaining irrigated acres with traditional irrigation systems.

The views expressed are those of the author(s) and should not be attributed to the Economic Research Service or USDA.
The Challenge for Agricultural Water Conservation (Part 2)
Better integrate improved onfarm water conservation programs with institutional (watershed-level) water-management mechanisms.
● Agricultural water conservation is both a farm and a basin-level resource conservation issue.
● Integrate improved onfarm irrigation efficiency with State and Federal landscape (watershed)/institutional water-management tools: ─ e.g., conserved water rights, drought water banks, option water markets, reservoir management, irrigated acreage and groundwater pumping restrictions, and irrigated acreage retirement.

The views expressed are those of the author(s) and should not be attributed to the Economic Research Service or USDA.
The Challenge for Agricultural Water Conservation(Part 2) ─ Continued
● “Sustainable agriculture” as it applies to irrigated agriculture was first initiated as a USDA goal with the Food, Agriculture, Conservation, and Trade Act of 1990. ● USDA’s Strategic Plan for FY’s 2010-15 supports sustainable irrigated agriculture. ― highlights the importance of using farm-level, watershed, and institutional measures as strategic means to meet this goal (USDA, 2012). ● Current Status: USDA participates in watershed-scale agricultural water conservation through Federal, State, and local stakeholder-based partnership agreements: ─ From 2009-12, under the Agricultural Water Enhancement Program (AWEP). ─ The 2014 Farm Bill initiated the broader land- and water-based Regional Conservation Partnership Program (RCPP). ─ emboding a landscape/institutional-scale resource conservation perspective for both land and water. At: http://www.nrcs.usda.gov/wps/portal/nrcs/main/national/programs/farmbill/rcpp/

The views expressed are those of the author(s) and should not be attributed to the Economic Research Service or USDA.
Contact: Glenn D. Schaible, [email protected] Ph: (202) 694-5549 Fax: (202) 694-5775
Supporting Sources: (1) Schaible & Aillery. (2012). Water Conservation in Irrigated Agriculture: Trends and Challenges in the Face of Emerging Demands, Economic Information Bulletin #99, ERS-USDA, at: http://www.ers.usda.gov/media/884158/eib99.pdf
(2) Walthall, C. L., et al. (2013). Climate Change and Agriculture in the United States: Effects and Adaptation, USDA Technical Bulletin 1935, Washington, DC, at: http://www.usda.gov/oce/climate_change/effects.htm (3) Water-Energy Technology Team, (DOE). 2014. The Water-Energy Nexus: Challenges and Opportunities. U.S. Department of Energy, Washington, DC, 240p. At: http://www.energy.gov/downloads/water-energy-nexus-challenges-and-opportunities
(4) Melillo, Jerry M., et al. (2014). Climate Change Impacts in the U.S.: The Third National Climate Assessment, U.S. Global Change Research Program. At: www.nca2014.globalchange.gov/downloads
(5) Brown, Foti, and Ramirez. 2013. Projected Freshwater Withdrawals in the United States under a Changing Climate, Water Resources Research, Vol. 49, pp. 1259 – 1276. At: www.engr.colostate.edu/~ramirez/ce_old/projects/Brown_demand.pdf

The views expressed are those of the author(s) and should not be attributed to the Economic Research Service or USDA.