uruguay an inquiry into social security: 'its evolution
TRANSCRIPT

Report No. 707-UR
UruguayAn Inquiry into Social Security: 'its Evolution,Current Problems and ProspectsJune 1968
FOR OFFICIAL USE ONLY
Document of the World Bank
This document has a restricted distribution and may be used by recipientsonly in the performance of their official duties. Its contents may not otherwisebe disclosed without World Bank authorization.
Pub
lic D
iscl
osur
e A
utho
rized
Pub
lic D
iscl
osur
e A
utho
rized
Pub
lic D
iscl
osur
e A
utho
rized
Pub
lic D
iscl
osur
e A
utho
rized
Pub
lic D
iscl
osur
e A
utho
rized
Pub
lic D
iscl
osur
e A
utho
rized
Pub
lic D
iscl
osur
e A
utho
rized
Pub
lic D
iscl
osur
e A
utho
rized

c !m!LcA EQUIVAL3S(May 10, 1988)
US$1.00 - NUR$333NUR$1.00 - US$0.003
VEIGDTS AND NKASURUS
1 hectare (ha) - 10,0C3 m2 * 2.47 acres1 kilometer (km) - 0.62 milesI square kilometer (km2) - 100 ha1 metric ton - 1,000 kg1 kilogram (kg) - 2.2 pounds
GLOSSARY OF ABBREVIATIONS
BPS Social Security Bank
DAFA Family Allowance Program
DGSS General Directorate for Social Security
DIPACE Public Employees and Teachers Retirement Fund
DIPAICO Industry and Commerce Employees Retirement Fund
DIPRUSEDO Rural and Domestic Workers Retirement Fund
DISEDE Unamployment Program
DISSE Health Insurance Program
OGEC National Statistical Office

FOR OFFICIAL USE ONLY
SYNOPSIS
The zeport briefly reviews the evolution of the social security
system, and the special problems created by Uruguay's demographic characteris-
tics (aging population, slow workforce growth, and low ratio of contributing
workers to beneficiaries). The report also analyzes the reforms undertaken in
1979, both of retirement benefits and payroll contributions, and the current
situation of social security finances, with particular emphasis on the retire-
ment and survivors program. The report assesses the characteristics of the
pool of retirees and survivors, expected population growth, and the long-term
prospects of the retirement and survivors program, concluding with prescript-
ions for action. The proposals for policy action center on three areas:
long-term reform of the structural parameters of the program, short-termactions to improve the retirement and survivor program's finances, and
administrative actions to control evasion and improve record-keeping forfuture beneficiaries.
This document has aestricteddistributiontand may be used by recipientsonly in the performatice |of their official duties. Its contents may not otherwise be disclosed without World Bank authorization.|

This report is based on the findings of a mission to Uruguay in February-March
1987. The mission was composed of:
Mr. Juan Giral-Bosca - ChiefMr. Rector Dieguez - Social Security Specialist
Mr. Dieguez provided technical assistance to the Social Security Bank (BPS)
and the Ministry of Labor and Social Security in the preparation of
information and projections. These materials were used in the preparation of
this report. A draft report was discussed with the authorities in March
1988. The text has been updated to reflect these discussions.

-cL
AN INQUIU INTO SOCIAL SscURIT: ITS IVOLUTION,cm n mmD mncnvus
Table of Conteats
SUMMARY ......... .............................................. 1-111
A. BACKGROUND ........................................ seeso 1
B. DEMOGRAPHIC CHARACTERISTICS . ............................... 3
C. THE 1979 REFORM ........ ***e********************............ 6
D. SOCIAL SECURITY FINANCES ......... .......................... 11
E. RETIREES AND SURVIVORS: CHARACTERISTICS .................... 16
F. SOCIAL SECURITY BANK: BENEFIT LEVELS BY FUND .............. 17
G. FUTURE PROSPECTS OF RETIREMENT PROGRAMS ............... . ..... 19
H. REFORM PROGRAM TO ENSURE BPS' VIABILITY .................... 20
I. RECENT REFORM EFFORTS ............ ................ ... * 26
ANNEX I ............ ...... * ******** ****...*...*... *..... .......... 29
STATISTICAL APPENDIX TABLES ........ * ......... .................. 30

i. The purpose of this report is to review Uruguay's social security
system and evaluate its future prospects as well, as the need for timely
action to ensure its long-term viability. Social security reform is one of
the most important political issues in Uruguay.
ii. Uruguay's social security system began with the establishment of
several retirement funds, which provided limited coverage for the military,
public employees, teachers, and some stronig labor groups. Gradually, the
system expanded to cover most of the population and social risks. Currently,
the social security system provides a wide, complex array of programs and
benefits, which places Uruguay at the head of Latin America. It covers all
social risks (retiremex.t and survivors pensions, old-age benefits, health
insurance, matarnity allowances, unemployment compensation); has easy-to-meet
eligibility criteria; provides universal coverage of pensions and health
insurance; has special privileged regimes and generous benefits for high-level
judicial, pclitical and school jobs, and special time bonuses for teachers.
iii. Uruguay's social security administrative has the following
institutional arrangement: (i) the Social Security Bank (BPS) covers public
employees and teachers -and private employees in industry, commerce,
agriculture, and domestic services; (ii) the army and police funds; (iii) the
state-regulated parastatal pension funds: professionals, banking employees,
and notaries; and (iv) complementary systems for higher income groups.
iv. The system's problems stem from society's promises to earlier
generations of workers of a tright retirement, based on the future prod'^Ction
of workers who were not even born at the time. This igno.ed the premise that
promises regarding future consumption would be constrained by demographic
trends and the growth rate of future production. Both factors worked against
the promises made to workers. First, demographic changes in birth and death
rates led to an aging population, as medical advances increased the life
expectation tremendously. New generations cf workers were faced with an
increasing burden to maintain the standard of living promised to retirees and
their survivors; this required them to either work longer hours or reduce
their standard of living. Second, comprehensive welfare benefits required
sustained transfers from producers and especially exporters, particularly when
they faced adverse market conditions; this discouraged growth and stifled
export-oriented production. Since no action was taken, Uruguay's economy
stagnated and, as a result, social welfare benefits became more burdensome.

- li -
v. The deteriorating economic situation forced a fundamental reapprai-sal of Uruguay's development strategy in 1973. Significant structural reformswere un.,ertaken in the following years to return the economy to a growth path,with some success. A reform of the social security system was part if thepackage of reforms (Gncreasing retirement ages and eliminating some specialprivileges) but it was insufficient to provide a long-term solution to thedile-a created by an aging population. Furthermore, two actions taken in1979 placed the system on a less stable footing: (i) payroll contributionswere reduced with the gap to be covered by transfers from general tax revenues(which led to a large Central Government deficit since no new taxes wereiatroduced to cover the revenue losses and, in the absence of a revenueconstraint, weakened spending discipline in the social securtty administra-tion) and (ii) earlier retirements under the old system were encouraged with agenerous transition period; the number of retirees increased sharply in1980-81. The deficit of the Social Security Bank reached an all-time high(5.8 percent of GDP) in 1982. Central Government transfere to cover the BPSdeficit explain about two-thirds of the 1982 fiscal deficit and, most likely,were one important factor of the breakdown of the pre-announced exchange ratepolicy (tablita) and the subsequent economic crisis, which bottomed in 1985.A detailed description of these events is presented in Report No. 6054-UR,Country Economic Memorandum on Uruguay.
vi. The major issues faced by the retirement and survivor programs ofthe social security system in Uruguay are: (i) reducing retirement and otherbenefits to a level that Uruguay can afford in the long-term; (ii) financingthese benefits while reducing the fiscal deficit; and (iii) improving thesystem's administration. This report contains specific suggestions forreform, which are outlined in Section G. The main recommendations are: (i)increasing normal retirement ages to 65 for men and 60 for women; (ii) conso-lidating retirement benefits and capping them; (iii) eliminating privilegedregimes based on quality or type of services rendered; (iv) limiting access topensions fo- working-age survivors or those with adequate means; and (v)introducing social security numbers and retrievable and computerized recordsfor contributing workers. Other social security programs (health insurance,maternity and family allowances, unemployment insurance) together withadministrative expenses also should be scrutinized for future action.Expenditures on these items generated about half of the 1986 deficit of BPS.
vii. The Government of Uruguay has embarked on a medium-term developmentprogram to create the basis for sustained long-term growth of the economy.This peogram includes, among other reform proposals, the reform of the socialsecurity system. The aim is to have a more affordable system with adequateprotection of the rights of the beneficiaries. Draft legislation was present-ed to Parliament on April 3, 1987. The Uruguayan Parliament approved a law inOctober 1987 with the following main elements:
(a) eliminating privileged regimes benefiting politi-cians, high Government officials and members of thejudiciary;

- {ii -
(b) establishing that annual cost of living adjustmentswill be calculated using the increase in the averagewage index during the previous calendar year and willbe effective April 1.
(c) capping all consolidatea pensions at 15 uiniu"u'wages; and
(d) establishing a minimum pension level for BPS retireesequivalent to one minimum wage (after taxes) effect-ive in 1990, rrovided the beneficiary meets normalretirement age requirements.
viii. The Parliament did not apprnve the five-year increase in normalretirement ages to 65 for men and 60 for women, which was included in theGovernment proposal. (Currently, most male workers retire on the average at63 and female workers at 58.) In addition, Parliament approved tax increaseseffective at end-1987 to reduce the social security deficit, which are: onepercentage point increase in the value-added tax rate to 21% and a 20Zsurcharge on domestic consumption taxes (IMESI) on new vehicles. The changesrepresent a step in the direction of strerngthening the financial viability ofthe social security system. However, more remains to be done to achieve thislong-term objective. The main remaining action is increasing normal retire-ment ages by five years. Further effort&' in this direction are necessary.
ix. Apart from the above-noted tax increase, the Government has takensome short-term actions to reduce the social security deficit. These includerevisions in the system of rural contributions to tighten collection mecha-nisms for agricultural workers and administrative actions to reduce evasionand control more effectively social security contributions. Recent increasesin the number of contributing workers and firms are a direct result of tightercontrols. More actions, however, are underway, including eetablishing asingle identification number for social security contributions and tax payer'sobligations, stiffer penalties, improved reporting requirements and strictercontrol of payments from public enterprises and municipalities. These effortsare expected to have a significant impact on strengthening social securityfinances.
x. The Government is also working on completing the regulationsconcerning optional complementary systems, which will provide for benefits(above a certain minimum provided to all retirees under the regular socialsecurity system) for higher-paid workers who contribute to these complementarysystems.

URUGUAY
AN INQUIRY INTO SOCIAL S8CCURITY: ITS EVOLUTION,CURiur MROILEKM AND PERSPECTIVES
A. Dackground
1. Social security has a long tradition in Uruguay. It can be tracedback to the immediate period after independence, when retirement and survivorrights were established for the armed forces (1830) which was financed out ofgeneral tax revenues. This was followed by the public employees fund (1838),wjhich was the first to introduce a payroll contribution (Montepio). Thiscontribution system was extended to the armed forces in 1884. Teachers inpublic schools were included in the sysi.em in 1896, when the first fund (caia)was created in Uruguay. Employees of public services followed in 1919; theircaja later expanded to cover industry and comerce employees. Most privateemployees, however, had no retirement funds until the 1920s; at that time,some groups of workers (Jockey Club, banks, meat-packing, wool and leatherindustries) pressured for and obtained legislation supporting their retirementand survivors' benefits. Further progress was made in the early 1930s and, bythe end of the decade, most private workers were covered, with the exceptionof rural workers and domestics, who joined the system in 1942-43.
2. Social security expanded gradually to cover most of the populationand all social risks, such as health insurance (1960-66, 1971-72), work-related injuries (1934, 1941), family allowances (1934, 1950, 1960), maternity(1948, 1958), and unemployment (1958, 1965-66). Legislation was enactedproviding special benefits to any group with significant political or laborunion weight. Uruguay's retirement and survivors programs copied Europeanschemes (with a much more limited economic base to fund the benefits) and insome cases, moved further ahead in providing generous benefits, e.g., allowingworkers with 10 years of service to retire under special conditions (child-birth or loss of employment) and institutionalizing all kinds of exemptions tothe low normal retirement ages (50 for men and 45 for women), encouragingpeople to retire in their prime.
3. The administrative structure for these programs mushroomed. It
consisted of 10 retirement and pension funds, 16 family allowance funds, 16health insurance institutions, 6 unemployment programs, and 1 professionalrisk institution (Janco de Seguros del Estado).
4. This situation could not continue indefinitely. Society hadpromised to the old (and not so old) comfortable retirement benefits comingout of accumulated reserves of the funds (cajas). These reserves were beingdepleted by: (i) the multiplication of generous benefits arnd special privi-leges, particularly low retirement ages and incentives for earlier retirement(mothers and terminated workers), and the extension into other new areas, suchas health, maternity and infant care; (ii) the financing of benefits for theinitial generation of retirees with contributions which should have been set

-2-
aside as capitalization reserves; and (iii) poor investment practicesincluding buying public bonds with a 5 percent nominal rate of itAerest andproviding housing loans also at low nominal rates of interest--while inflationwas at the two-digit level. As a result, the finances of the retirement andsurvivor funds weakened and progressively meved towards a pay-as-you-go systemand payroll contributions reached very high levels in 1969, such as 65 percentfor industry and comerce workers with the following breakdown: old age andsurvivord, 37 percent; health insurance, 8 percent; family allowances, 15percent; and professional risks, 5 percent.
5. The reluctance of the population to accept needed reductions inbenefits of social security and other welfare programs combined with otherfactors, such as wage increases in excess of productivity gains, and theimport substitution, inward-looking strategy, led to an environment thatdiscouraged produc_ion and stifled export growth. The economy stagnated fromthe mid-1950s to the mid-1970s, and the financial situation of the socialsecurity funds deteriorated further for two reasons: (i) real wages declined;,nd (ii) the population was becoming progressively older, a process that wascelerated by emigration. Inflation scaled-down benefits promised to older
g. nerations.
t, The late 1960s marked a turning point. Initial efforts were made toreform the system. The three main pension funds (civil servants and teacners,commerce and manufacturing workers, and rural and domestic workers) wereconsolidated under a Social Security Bank (BPS). Nonetheless, significantsteps to address the mounting problems were not taten until the 1970s. In1975, unemployment funds were consolidated, as well as health insuranceprograms, for the private sector. In 1978, the family allowance funds werereduced to 5 from the original 16. The year 1979 was an important benchmarkfor social security programs. The Government approved the Institutional ActNo. 9. As a result, BPS was transformed into a General Directorate for SocialSecurity (DGSS) in the Labor Ministry. (This was reversed in 1986 when DGSSbecame BPS again.) DGSS was entrusted with: (i) the retirement funds forcivil servants and teachers (DIPACE), industry and commerce workers (DIPAICO),and rural workers and domestics (DIPRUSEDO" (ii) the family allowanceprograms (DAFA), including maternity benefits; (iii) the health insuranceprogram (DISSE); and (iv) the unemployment program (DISEDE). Several pensionfunds rema ned outside DGSS: bank employees, notaries, and professionals; theJockey Club employees; and army and police, which are administered by theMinistries of Defense and Interior. Apart from centralizing the Administra-tion of the system, Act No. 9 had the following main purpoaes: (i) raisingnormal retirement ages to 60 for male workers and 55 for female workers, andreducing some exemptions and privileges, such as early retirement for mothersat child-birth; (ii) moving towards centralization and uniformity of benefits;(iii) reducing the burden on the economy resulting from excessively generousbenefits; and (iv) shifting the sources of financing of the social securityprograms to reduce the importance of payroll contributions. The main charac-teristics of the 1979 reform will be analyzed in following sections.

- 3 -
7. In spite of the 1979 refors, social security program stillrepresent a considerable burden on the economy. This stems frou: (1)
generous and complex benefit programs beyond Uruguay's capacity to finance
them; (ii) poorly conceived financial changes introduced in 1979 (which
substantially reduced payroll contributions (to change the relative prices of
labor and capital) In favor of Central Government transfers out of general
revenues from the value-added tax, but did not provide new revenue sources to
the Treasury to finance this transfer; and (iii) the combination of low normal
retirement ages (currently, 60 for men; 55 for women) and high life expectancy
at retirement with an aging population, slow workforce growth, and low ralio
of contributing workers to beneficiaries
b. DEOgrDahic Cbarecteristics
Pol jt1oa Growth
8. Uruguay's population tripled in the past 80 years to 2,983,000 in1985. However, the rate of population growth has been steadily decreasing(Table 1). Improvements in health and disease control have reduced mortality
rates to a low 9.2 per thousand, but this has been accompanied by parallel
reductions in fertility. The fertility rate was 2.7 per thousand in 1985, and
the crude birth rate has dropped to a low 18.1 per thousand in the early
1980s.
Table 1: URUGUAY: POPULATION GROWTH, 1908-2020(in thousands)
Total AnnualPopulation Growth Rate (X)
1908 1,077 -1916 1,294 2.31930 1,699 2.01937 1,876 1.41950 2,193 1.21960 2,538 1.51975 2,828 0.71985 2,940 0.51995 3,152 0.72000 3,264 0.72020 3,679 n.6
Source: Direccion General de Estadistica y Censos.

- 4 -
9. The low population natural growth rate is reduced further bymigration flows. Uruguay attracted large numbers of migrants in the late1800. and early 1900., mainly from Europe. Thic inflow practically stopped Inthe 1950a. Of the 102,300 i-migrants identified in the 1985 census, 68percent arrived before 1960, 9 percent between 1960 and 1975, and 23 percentduring 1976-85. In this last period, i_migration showed some recovery with aprevalence of age groups below 20 (about 55 percent). A significant exodus ofUruguayans began in the 1960a, mostly in the 15-24, 35-44, and 45-54 agegroups. About 200,000 people (7 percent of che population) emigrated fromUruguay in a 12-year period. A research study1 / examined this issue andconcluded that the main factors explaining this phenomenon were the depressedconditions in the number of new jobs (mostly urban), and the relatively lowsalary levels vis-a-vis Argentina and Brazil.
10. Age Structure and Dependency Burden. Uruguay's demographic charac-teristics of low birth rates, coupled with low death rates and high lifeexpectancy at birth (73 years), determine a long-term aging trend similar tothose of developed countries. Furthermore, life expectancy is alro high atretirement (e.g., for the 60-64 year-age bracket is 16 years for men and 20years for women). The age-dependency ratio and the old-age dependency ratioare gradually increasing. These parameters are very significant for analyzingthe future of social security programs, although their Impact can be modifiedby changes in the normal retirement ages. For example, as illustrated inTable 2, if the normal retirement age is increased to 65 years, there is avery sharp drop in the old-age dependency ratio, i.e., more people remain inthe labor force to take care of a smaller group of retirees. An analysis ofthis issue is presented in paras. 51-59.
Table 2: URUGUAY: POPULATION AGE STRUCTURE, 1963-85(percentages)
Age Groups 1963 1975 1985
0-14 28.2 27.7 26.815-24 15.5 16.6 16.125-44 28.9 25.9 25. 245-59 15.8 16.7 16.460-64 3.9 4.5 4.665 and over 7.7 9.6 10.7Total active-age population (15-59) 60.2 58.2 57.8Total active-age population (15-65) 54.1 62.7 62.3Age dependency ratio a/ 66.1 71.8 72.8Age dependency ratio b/ 56.0 59.5 60.1Old-age to working-age Population dependency ratio c/ 19.3 24.2 27.2Old-age to working-age population dependency ratio d/ 12.0 15.3 17.4Social security beneficiaries (all funds) toeconomically active population ratio 36X0 45.1 60.2
a/ Ratio of population groups under 15 and over 60 to population groups ages15 through 59.
b/ Ratio of population groups under 15 and over 65 to population ages groups15 through 64.
c/ Ratio of population 60 and over to population ages 15 through 59.d/ Ratio of population 65 and over to population ages 15 through 64.
Source: Direccion General de Estadistica y Censos.
1/ CIESU, J.L. Petrucelly and J.C. Fortuna, La Dinamica Migratoria en elUruguay del Ultimo Siglo, 1875-1975; Montevideo, 1983.

11. Uruguay's low ratio (2.3 in 1986, Table 3) between active workers
contributing to the system and retirees of social security programs is mostly
a consequence of the aging populatiok. and slow growth of the working force.
This is aggravated by tne rather high evasion rate (about 27 percent); a
significant number of active workers and employers in informal sectors do not
contribute to a retirement fund. If all survivors are taken into account, the
ratio is much lower (1.2). However, every deceased retiree generates
benefits, on the average, focr three survivors who together are entitled to one
equivalent pension right; thus, per pension equivalent the ratio is 1.6.
Table 3: URDGUY: WORKING PFOU AND SOCIAL SECURITY(in tbousands)
Economically Employed Contributing
Active Labor Workers: Ratio Retirees Ueneficiaries Ratio Ratio
Year Population Force All Fund. (3)/(2) ll f-und all funds (3)/(5) (3)/(6)
(1) (2) (3) (4) (5) (6) (7) (8)
1963 992 923 E 830 E .90 190 E 358 4.4 2.3
1975 1,095 1,020 906 .89 263 494 3.4 1.8
1980 1,123 1,056 912 .86 337 618 2.7 1.4
1985 1,172 1,020 795 .78 384 706 a/ 2.1 1.2
1986 1,180 1,074 862 .80 381 710 2.3 1.2
E: Estimate
a/ By fund (in thousands): DGSS 631, professionals 7, banking 10, notaries 1, army 29, and
police 28.b/ By fund (in thousands): DGSS 634, professionals 7, banking 10, notaries 1, army
30, and
police 28.
DGSS
Ratio
Contributing Ratio Ratio Per Pension
Year Workers a/ Retirees Old Age Survivors (1)/(2)+(3) (1)/(2)+(3)t(4) Equivalent c/
(1) (2) (3) (4) (5) (6) (7)
1975 805 240 26 207 3.0 1.7 2.4
1980 810 303 27 275 2.4 1.3 1.9
1985 686 345 21 265 1.9 1.1 b/ 1.5
1986 752 342 25 267 2.0 1.2 c/ 1.6
a/ IVS.b/ Taking into account persons receiving multiple pensions, the ratio becomes 1.35.
c/ Each survivor's pension is equivalent, on the average, to one-third of a unit of retirement
earnings. Thus, the number of survivor's pensions are approximately one Lhird of the
number of recipients.
Source: DGSS and Direccion General de Estadistica.

12. Each active worker in good standing now provides approximately for aretiree or a survivor drawing benefits out of the system. Most of Lhe retire-ment funds show similar ratios (Table 4).
Table 4: URUGUAY: RATIO OF CONTIIBUTING VORURS TOTOTAL BENEFICIARIES bY FUND
Fund Ratio(early 1986 or late 1985)
Public employees and teachers 1.25Industry and commerce employees 1.53Rural workers and domestics 0.73Average DGSS 1.24Professionals 3.43Banking employees 1.36Army 1.37Police 0.91
Average: Total (including DGSS) 1.16
Source: DGSS and Direccion General de Estadisticas.
C. The 1979 Refors
13. The 1979 reform made important changes in several areas: adminis-tration, benefits, ainnual revaluation of benefits, and financing. These areexamined below.
Administration Reform
14. Act. No. 9 of 1979 organized the General Directorate of the SocialSecurity (DGSS) around four benefit programs: (i) disability, old-age, andsurvivors; (ii) family allowances and maternity services; (iii) healthinsurance; and (iv) unemployment insurance. For admilaistrative purposes, eachprogram is managed by an office with the exception of the disability, old-ageand survivors program, which is organized around three offices, one for eachmajor retirement group: public employees and teachers, industry and commerceworkers, and rural workers and domestics. Several other retirement andsurvivors programs (professionals, bank employees, and notaries) were notincorporated in the DGSS, but are subject to some degree of supervision byDGSS. Two other funds were left totally independent: the army and policefunds.
Benefit Reform
15. Act No. 9 increased normal retirement ages to 60 for men and 55 forwomen from 50 and 45, respectively; eliminated the right to retirement after10 years of service both for female workers at childbirth and for laid-offworkers after termination of employment; eliminated the computation of yearsof service and age to determine the level of retirement benefit; and

eliminated the Christmas bonus for retirees and their survivors. These
reforms are having a beneficial long-term impact, although they are insuffi-
cient to fully tackle the deep-rooted problems of the social security system.
16. Act No. 9 provided a uniform regime for the three main retirement
funds, covering four areas: (i) retirement (jubilacion); (ii) survivor's
rights (pension); (iii) old-age pensions (pension a la vejez); and (iv) burial
expenditures. Affiliation is mandatory and non-remunerated activities are not
subject to retirement benefits.
17. Act No. 9 based retirement and survivor benefits on the average
salary (adjusted by the average wage index) over the last six years of employ-
ment. (This was later shortened to the average salary of the last three
years.) The scale for normal retirement is as follows:
(a) minimum age: men, 60 years; women, 55 years; and
(b) percentage of the basic salary: 70 percent for a
minimum service of 35 years for women and 40 yearsfor men; 65 percent for a minimum service of 30years for women and 35 years for men; and 60percent for a service-length of less than 30 yearsfor women and 35 for men. Years of service andage are not added to compute retirement benefits.
Survivors are entitled to a pension per family unit (to be distributed among
all qualifying survivors) calculated as follows:
(a) widows or divorcees or daughters over 45 yearstogether with children under 21, a pension equiva-lent to 75 percent of the deceased retiree'searnings;
(b) widows or divorcees or daughters over 45 years orchildren under 21, a pension equivalent to 66percent of the deceased retiree's earnings;
(c) children under 21 together with the parents of thedeceased, a pension equivalent to 66 percent ofretirement earnings; and
(d) divorcees ani the parents of the deceased, apension equivalent to 50 percent of retirementearnings.
18. Act No. 9 maintained special privileged regimes: earlier retirement
for political, judicial and teaching jobs, combined with access to high levels
of benefits (over five times the general average). Under these regimes,
retirement benefits were for political and judicial posts, 40 percent of the
basic salary plus 1 percent for each year of service, with a 70 percent

- 8 -
ceiling; and for teachers and related activities, 50 percent of the basicsalary plus 2 percent for each year of service over 20 years, with a ceilingof 70 percent. Act No. 9 established explicit exemptions from minimum-agerequirements for Presidents of the Republic; high-level judicial and politicaljobs; and all confidential jobs established by law. In addition, teachers inpublic or private institutions with 25 years of service, or 50 years of age,with 20 years of actual school service were included.
19. Act No. 9 maintained special rules for certain activities (serviciosbonificados) for which a time-bonus is added to compute age and length ofservice requirements. In practice, only teachers have been covered by thisprovision, and the time bonus is established by the executive. A minimumservice of 10 years is required.
20. Act. No. 9 continued to provide old-age pensions to all workers witha minimum effective service length of 10 years and 70 years of age. Theretirement benefit is equivalent to 85 percent of the minimum wage. This agerequirement was reduced to 65 years in 1986.
Reveluation of Benefits
21. Act No. 9 substituted the average wage index for the cost of livingindex in calculating the annual adjustments for inflation. The impact of thischange on the system's long-term finances depends on the trend of real wages.It, nevertheless, introduced an element which may weaken the long-termposition of the system. The average wage index reflects salary increases tocompensate for inflation, but may also reflect increases in productivity.With an aging population, productivity must rise significantly to provide thesame level of benefits; otherwise, retirees and survivors benefits must bescaled down. If productivity gains are passed on to retirees, the time whenpromises made to them must be modified arrives earlier. On the other hand,real wages have declined in Uruguay over long periods of time. If this trendwould continue, using the wage index will result in a decrease in realpensions.
The Transition
22. One of the most problematic elements of the 1979 reform was theprovision that a large number of new beneficiaries were permitted to retireunder the old system, which put additional pressures on the financial situa-tion of DGSS. This, together with the existing backlog of retirement applica-tions, led to a dramatic increase in the number of retirees during 1980-84.About 22 percent of the December 1984 pool of retirees retired during thoseyears; the annual growth rate was 4 percent during 1980-84 compared to 2.7percent a year during 1969-79. In contrast, the rate of growth of the pool ofsurvivors decreased from 4.1 percent during 1969-79 to 1.9 percent during1980-84 (Table 5).

Table 5: URUGUAY: DGSS - NUMBER OF BENEFICIARIES, DECEMBER 1969-86
Annual Growth lateRetirees Survivors Total(Ju dilados) (Peunionados) Old Axe Beneficiaries Retirees Survivors Total
(-)
1969 216,263 160,050 46,119 422,432
1979 283,460 239,511 27,510 550,481 2.7 a/ 4.1 a/ 2.7 a/
1980 303,278 248,418 26,819 578,515 7.0 3.7 5.1
1981 318,159 254,461 25,391 598,011 4.9 2.3 3.4
1982 333,307 258,526 24,469 616,302 4.8 1.6 3.1
1983 340,462 261,253 23,553 625,268 2.1 1.1 1.5
1984 345,551 262,817 22,063 630,431 1.5 0.6 0.8
1985 344,972 264,874 21,377 631,223 -0.2 0.8 0.1
1986 341,987 266,612 25,471 634,070 -0.9 0.7 0.5
a/ Ten years annual average rate.
Source: DGSS
23. Over half of the retirements that took place in 1980-81 were below
the new normal retirement ages established by Act No. 9 (60 years for men; 55
years for women) on account of the generous transition rules. During 1980-81,
retirements increased sharply (7 percent in 1980 and 4.9 percent in 1981),
representing 56 percent of all retirements that took place in 1980-84. Table
6 shows the age breakdown.
Table 6: URUGUAY: RETIREMENTS DURING TH2l TRANSITION PERIOD, 1980-81
Age Brackets Number Percentage
Men: below 44 178 1.2
45-49 734 4.9
50-54 2,130 14.'
55-60 5,081 34.2
over 60 6,720 45.3
Total Men: 14,843 100.0
Women: below 39 80 0.9
40-44 197 2.3
45-49 1,787 21.0
50-54 2,299 27.0
over , 4,162 48.8
Total Women: 3,525 100.0
Source: DGSS

- 10 -
Sources of Financlug the Reform
24. The three retirement funds incorporated into DGSS experienced threemain financial changes: (i) greater uniformity of payroll contributions, as aresult of the 1979 tax reform which reduced payroll contributions of industryand commerce while increasing those of rural workers and domestics, the lowestincome groups, who also receive the lowest benefits; (ii) a reduction ofpayroll contributions compensated with transfers from Central Government taxrevenues, specifically value-added tax reveaues; and (iii) elimination ofspecial contributions earmarked to rover specific programs, such as thepayroll contribution to pay for family allowances and unemployment, as well astaxes on agricultural production earmarked for the rural workers' retirementfund. Table 7 compares payroll contributions in 1969 and 1985.
Table 7: UUGAY: SOCIAL SEClU! IITV9n IT5, 1969-65(percentap of peyroll)
Payroll1969 1945 Percentage Fbints
nsured Eaployer Total Insured Kq loyer Total Decrease (-)
IVS PublicEmployees,Teachers 15 15-20 30-35 13 15-20 28-33 - to -2
IVS Industry-commerce 17-18 19 36-37 13 12 25 -11 to -12
IVS Rural-domestic 5 5 10 13 12 25 +15
Health Insurance 3 5 8 3 4 7 -
Family allowance 0.5 14.5 15 a/ - - - -15
Total (Range) 5-21.5 10-43.5 15-65 16 16-24 32-40 -
a/ Eight percent in 1974.
Surce: C. Mesa Lago, El desarrollo de la seguridad social en America Latina, ECLA,Estudios e informes, No. 43; Santiago de Chile; 1985.DGSS.

- 11 -
25. To compensate for the reduction in payroll contributions,
introduced by the 1979 tax reform, the VAT rate taxing many products war
increased from the minimum to the basic rate; at the same time, the minimum
rate increased from 7 to 8 percent, and the basic rate temporarily decreased
from 18 to 14 percent on the expectation that collections would increase
significantly with continued economic prosperity. iactual results, however,
were disappointing.
26. Since DGSS was no longer self-financing, expenditure discipline
weakened which, together with the generous provisions for the transition
period from the old to the rew system, led to a substantial increase in the
DGSS deficit requiring the corresponding increase of the Central Government
transfers. The Government raised the minimum VAT rate to 12 percent in 1982
and basic rate to 20 percent in 1984. Value-added tax revenues did not
increase, as expected, for several reasons: (i) the elasticity of substitu-
tion between capital and labor is low and takes a long time to produce
results; (ii) domestic consumption fluctuates more than employment (greater
income elasticity) so that value-added tax revenues were more susceptible to
the vagaries of the economic cycle; (iii) activities exempted from the value-
added tax represented a sizeable share of GDP; and (iv) evasion on the taxable
base was higher for the value-added tax than for payroll taxes.
27. The most noticeable short-term effect of the rate reduction was in
the profitability of exports, which enjoyed a significant cost reduction on
account of the lower social security contributions; as a result, the social
security burden shifted to nonagricultural domestic activities because exports
and agricultural production, in general, were exempted from the value-added
tax. The shift happened either directly through increases in other taxes or
lower real wages for public servants or indirectly through deficit financing,
which fueled inflation and triggered a reduction in real wages across the
board.
D. Social Security Finances
Share of GDP
28. Total social security expenditures represented about 11.2 percent of
GDP in 1986 (Table 8), exceeding revenues by 3.1 percent of GDP. About 2.3
percentage points of this deficit corresponded to DGSS (now BPS) and the
remainder to the army and police retirement funds. These deficits were
financed by the Central Government. The statc-regulated private funds
(banking employees, professionals, and retirees) and the small Jockey Club
funds bad small surpluses. DGSS (BPS) expenditures increased rapidly as a
percentage of GDP, after the 1979 reform, owing to the generous provisions of
the transition period (para. 22). The peak expenditure year was 1982 at 12
percent of GDP. Since then, BPS expenditures have declined by about 3 percen-
tage points of GDP. Total Central Government expenditures for social
security, to cover boEh its obligations as an employer as well as for
financing the deficit of the programs, are shown in Table 9.

- 12 -
Table 8: URUGUAY: SOCIAL SECURITY IXPENDITURES(percentage of GDP)
1979 1980 1981 1982 1983 1984 1985 1986 (P)
DGSS (BPS) 7.1 7.6 9.9 12.0 10.0 8.6 8.4 9.1Police Retirement Fund n.a. n.a. 0.8 1.0 0.7 0.6 0.5 0.7Army Retirement Fund n.a. n.a. 1.0 1.3 1.0 1.1 0.9 0.7Bank EmployeesRetirement Fund n.a. 0.4 0.6 0.6 0.5 0.5 0.4 0.4
Professionals n.a. 0.2 0.2 0.3 0.3 0.3 0.2 0.2Notaries n.a. 0.1 0.1 0.2 0.2 0.1 0.1 0.1
Total n.a. n.a. 12.6 15.4 12.7 11.2 10.5 11.2
(p) preliminary.
Source: DGSS (BPS), DGEC, Ministry of Economy and Finance, and Central Bank.
Table 9: URUGUAY: CENTRAL GOVERNMENT EXPENDITURES ON SOCIAL SECURITY(as Z of GDP)
1979 1980 1981 1982 1983 1984 1985 1986
DGSS (BPS) 1.0 2.4 4.7 6.9 5.3 4.1 3.7 3.2Public Employees PayrollContributions 1.0 1.0 1.0 1.1 1.0 0.9 0.9 0.9
Transfer to Cover Deficit - 1.4 3.7 5.8 4.3 3.2 2.8 2.3
ARMY AND POLICE FUNDS 1.0 1.6 1.9 2.5 1.9 1.5 1.4 1.4Payroll Contributions - - - - - 0.6 0.4 0.6Transfer to Cover Deficit - - - - - 0.9 1.0 0.8
Total 2.0 4.0 6.6 9.4 7.2 5.6 5.1 4.5
As percentage of Social Securityexpenditures (%) n.a. n.a. 52.4 61.0 56.7 50.0 48.6 40.2
Source: DGSS (BPS) and Ministry of Economy.
- 13 -
Social Security and Central Governnt Finance.
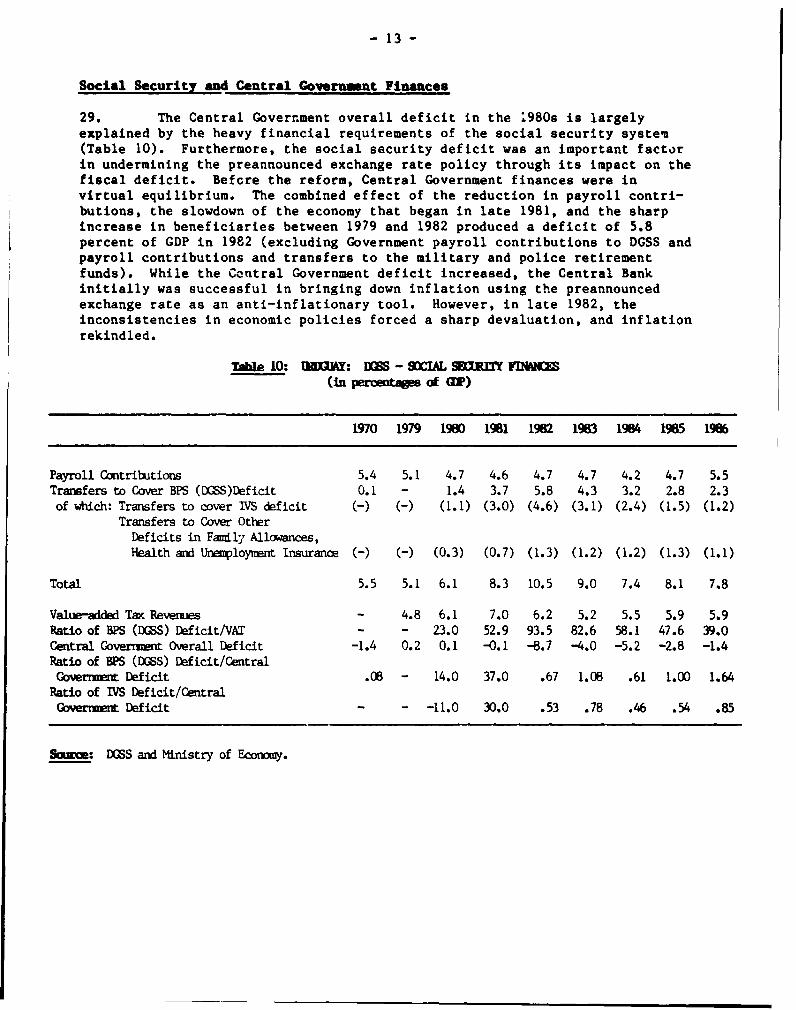
29. The Central Government overall deficit in the ;980s is largely
explained by the heavy financial requirements of the social security system
(Table 10). Furthermore, the social security deficit was an important factor
in undermining the preannounced exchange rate policy through its impact on the
fiscal deficit. Befcre the reform, Central Government finances were in
virtual equilibrium. The combined effect of the reduction in payroll contri-
butions, the slowdown of the economy that began in late 1981, and the sharp
increase in beneficiaries between 1979 and 1982 produced a deficit of 5.8
percent of GDP in 1982 (excluding Government payroll contributions to DGSS and
payroll contributions and transfers to the military and police retirement
funds). While the Central Government deficit increased, the Central Bank
initially was successful in bringing down inflation using the preannounced
exchange rate as an anti-inflationary tool. However, in late 1982, the
inconsistencies in economic policies forced a sharp devaluation, and inflation
rekindled.
Tab]e 10: UJY: DGES - SOCAL& SCRf FDr, (in pednaso GM)
1970 1979 1980 1981 1982 1983 1984 1985 1986
Payroll Contributions 5.4 5.1 4.7 4.6 4.7 4.7 4.2 4.7 5.5
Transfers to Cover BPS (DGSS)Deficit 0.1 - 1.4 3.7 5.8 4.3 3.2 2.8 2.3
of which: Transfers to cover IVS deficit (-) (-) (1.1) (3.0) (4.6) (3.1) (2.4) (1.5) (1.2)
Transfers to Cover OtherDeficits in Famil; Allowances,Health and Unemployment Insurance (-) -) (0.3) (0.7) (1.3) (1.2) (1.2) (1.3) (1.1)
Total 5.5 5.1 6.1 8.3 10.5 9.0 7.4 8.1 7.8
Value-added Tax Revenu.es - 4.8 6.1 7.0 6.2 5.2 5.5 5.9 5.9
Ratio of BPS (DGES) Deficit/VAT - - 23.0 52.9 93.5 82.6 58.1 47.6 39.0
Central Governvrit Overall Deficit -1.4 0.2 0.1 -0.1 -8.7 -4.0 -5.2 -2.8 -1.4
Ratio of BPS (DGSS) Deficit/CentralGovrre nt Deficit .08 - 14.0 37.0 .67 1.08 .61 1.00 1.64
Ratio of IVS Deficit/CentralGDVenmt Deficit - - -11.0 30.0 .53 .78 .46 .54 .85
Sm: DSS and Ministry of Economy.

- 14 -
Co:rfAs of Retiremut Yiaad30. Most workers are covered by BPS and, thus, about 90 percent of theretirees and survivors are under this system (Table 1, Statistical Appendix).For this reason, the following analysis concentrates on the BPS system.
IN (DOSS): Deflclt
31. The DGSS deficit declined from a peak of 5.8 percent of GDP in 1982to 2.8 percent in 1985 and 2.3 percent in 1986. This deficit is the result ofseveral programs. Of the 1986 deficit, about half originated in the retire-ment, survivors, and disability program (IVS); 20 percent in the family allow-ance program; 8 percent in the health insurance program; 5 percent is account-ed for by unemployment insurance; and 17 percent by other programs andadministrative expenditures (Table 2, Statistical Appendix).
32. Not all IVS programs in BPS are in deficit. The fund for commerceand industry workers generates a surplus (about 0.3 percent of GDP), whichpartially compensates for the deficits of the civil servants and teachers fundand the rural and domestic workers fund. The deficits of these two funds are0.7 and 1 percent of GDP, respectively.
33. BPS (DGSS) expenditures have exceeded revenues since 1981, as thesystem was restructured from self-financed separate funds into a centralizedoperation supported, in part, by Government tax revenues. Although with the1979 reform, BPS (DGSS) was expected to need about 20 percent of the value-added tax revenues, the transfers to BPS absorbed up to 94 percent of theserevenues in 1982; 83 percent in 1983; 58 percent in 1984; 48 percent in 1985;39 percent in 1986 (Table 8). As noted earlier, reducing payroll contribut-ions had a favorable impact on labor costs (particularly for exporters), butsignificantly eroded the financial discipline imposed on the system by theneed to be self-financing.
BPS (DGSS): Retirement and Survivors Progran (IVS)
34. Expenditures in the IVS program have exceeded by a substantialmargin revenues from payroll contributions since 1981; this is a result ofsome changes introduced by Act No. 9 (reduction in payroll contributions,generous transition period between the old and the new regime, and the delink-ing cf contributions and benefits). The public employees and teachers' fund(DIPACE) has been the main source of the IVS deficit (54 percent in 1985), butthe rural workers and domestics fund (DIPRUSEDO) is also rapidly becoming amajor scurce (52 percent in 1985). The industry and commerce fund (DIPAICO),however, gradually reduced its deficit and showed a surplus in 1985 (Table 3,Statistical Appendix).

- 15 -
3P$ (DOSS): Health ProgrEm (DISS1)
35. The health program's finances are deteriorating with the deficitincreasing (0.1 percent of GDP in 1984; 0.18 percent in 1985; and 0.21 percentin 1986). These deficits do not include administrative expenditures estimatedat NUS476 million (.05 percent of GDP) in 1986. This program covers exclu-sively private sector workers and is financed by a 7 percent payroll tax (4percent employer and 3 percent worker). Revenues represented 0.7 percent ofGDP in 1986 and expenditures about 1 percent of GDP. About 378,000 workerswere covered by this program at the end of 1985.
36. DISSE provides for public medical assistance through quota paymentsto medical health organizations selected by each worker. The system origina-ted in mutual-aid societies created by immigrants several decades ago, whichevolved into a non-profit system, the basic elements of medical services inUruguay. Thus, Uruguay avoided the creation of a large system of Government-owned hospitals with the parallel impact on social security finances, which iscommoa in other countries. In parallel, medical groups have organized profit-making associations. The system works to make the profit-making associationsprovide services at quotas not much above those of mutual-aid societies, andforces the non-profit groups to maintain reasonable quality levels.
BPS (DGSS): Family and Maternity Allowance (DAFA)
37. The family allowance program has no revenues to finance its expendi-tures since the 1979 reform abolished the 15 percent payroll contribution.The program's expenditures were about 0.7 percent of GDP in 1986. DAFAsubsidizes every pregnant woman employed in the private sector.Unemployed women drawing unemployment benefits, and survivors of privatesectors retirees also qualify for the allowances. During the inactivityperiod (six weeks before and after the date of birth), they are paid theequivalent wage plus supplements and vacation allowances. Minimum benefitsare equivalent to the national minimum wage. Private sector beneficiaries ofthis program totalled about 470,000, or 16 percent, of the Country's popula-tion at the end of 1985.
38. The DAFA prcgram also includes a special program for payingvacations and supplements to construction workers and piece-workers at home.There is an employer contribution; the total contribution rate in constructionis 73 percent. The sub-program generates a small surplus, which reduces thedeficit originating in family allowances.
BPS (DGSS): Unemploymnt Insurance (DISEDE)
39. This program has no specific funding to cover its expenditures. Itgenerated a deficit of 0.1 percent of GDP in 1986. DISEDE takes care of theunemployed for about six months. To qualify, a full-time worker needs to beemployed during the six-month period preceeding his lay-off and a temporaryworker for 150 wage-days. The compensation is equal to 50 percent of themonthly average wage of the semester, or alternatively half the monthlyminimum wage. Average payments under this program remain at reasonablelevels. The number of applications totalled about 34,000 in 1985 down from67,000 in 1982, when unemployment was at a high level.

- 16 -
S. Utire*e and Survivors: Characteristics
40. The current stock of BPS (DGSS) retirees averages 69 years of age;male retirees are slightly older (70 years) than women (68 years). About 9percent of the retirees are in the 55-59 age bracket with a life expectancy of21.7 years, and 17 percent in the 60-64 years bracket with a life expectancyof 18 years. Most of them, however, are in the 65-74 age bracket (40percent), and in the over-75 age bracket (28 percent). Surviving relatives,however, are much younger, with an average age of 58 years. Men are mostlyyoung dependents with an average age of 29; women average 59 years (Table 4,Statistical Appendix).
41. Average payments to retirees averaged NUS 330 in March 1987, or119 percent of the net minimum wage. The average pay ent to retirees wasincreased in April 1987 to take into account the yearly increase in theaverage wage index. Thus, these ratios increased accordingly. Those made tosurviving relatives averaged NUS6,909, or 48 percent of the net minimum wage.About 57 percent of the retirees and 93 percent of the survivors receivedbenefits below the net minimum wage (Table 4, Statistical Appendix). Thesurvivors' percentage, however, is influenced by the number of survivorscovered by each pension unit originating from a deceased retiree. About 34percent of the retirees received benefits between one and two net minimumwages and about 9 percent received benefits over two net minimum wages.
42. The average value of retirement pension benefits in real termsdeclined over a long period of time as Uruguay's economy stagnated. Itrecovered in 1986. Table 11 shows the situation in recent years.
Table 11: URUGUAY: EVOLUTION OF THE AVERAGE RETIREMENT-EARNINGS
December1982 1983 1984 1985 1986
(1) BPS (DGSS) averageretirement-earnings (NU$) 2,456 2,871 4,527 7,125 15,624
(2) Index of (1) 100.0 116.9 184.4 290.1 636.2(3) Cost of living 100.0 151.5 251.6 460.7 815.3(4) Index of the real average
value of the retirement-pensions (2)/(3) 100.0 77.2 73.3 63.0 78.0
(5) Index of average wages 100.0 135.2 224.5 466.3 870.4(6) Real index of average wages
(5)/(3) 100.0 89.2 89.2 101.2 106.8(7) Ratio average retirement to
minimum wage 135.3 103.0 90.5 84.8 111.6
Source: DGSS and DGEC.

- 17 -
43. The breakdown of the current stock of retirees classified by retire-ment grounds is shown in Table 5, Statistical Appendix. About 66 percent ofthe retirements are explained by old age, or a combination of old age andyears of service, and 12 percent by disability. About 90 percent of thesurvivor's pensions are paid to widows and legitimate children (Table 6,Statistical Appendix).
P. Social Security Bank: Benefit Levele by Fund
44. Benefits in the three BPS (DGSS) funds are significantly different(Table 12). Among civilian retirement benefits, teachers and public employeeshave the highest average benefits, followed by industrial and commerceemployees. Rural workers and domestics have the lowest level of benefits.
Table 12: URUGUAY: STRUCTURE OF AVERAGE URTILREeNE EARNINGSAND SURVIVOR PENSIONS IN bPS (DGSS)
(in percentages of average BPS benefits)
December October1984 1986
DIPACEPublic employeesRetirement-earnings 157.9 156.7Survivor-pension 132.1 128.4
TeachersRetirement-earnings 241.3 236.4Survivor-pension 236.8 216.1
DIPAICOCommerce and Industry WorkersRetirement-earnings 81.6 84.1Survivor-pension 89.9 93.0
DIPRUSEDORural workersRetirement-earnings 65.5 64.9Survivor pension 70.4 68.9
DomesticsRetirement-earnings 58.8 62.9Survivor-pension 40.2 45.3
Source: DGSS.

- 18 -
45. Government transfers provide different subsidies to each group ofworkers (Table 13). The retirement fund for industry and commerce workers(DIPAICO) received no Government subsidy in 1986, while the public employeesand teachers retirement fund (DIPACE), which has the highest employer contri-bution (Table 7), received a large subsidy owing to the relatively generousbenefits. On the other hand, the large Government subsidy per beneficiary inthe fund for rural workers and domestics (DIPRUSEDO) is explained by lowrevenues; this is the sector with the smallest number of contributors, butwith a significant number of beneticiaries. In addition, DIPRUSEDO is payingthe old-age pension, which is a program with no funding.
Table 13: URUGUAY: DEFICIT AND NUMBER OF BENEFICIARIES(December 1986)
RatioDeficit (-) Number of (in N$ per
(Millions of N$) Beneficiaries Beneficiary)
Teachers andPublic Employees -6,672 158,777 -42,02;
Industry andCommerce +3,185 307,942 +10,342
Rural andDomestics -9,087 142,935 -63,574
TOTAL 12,574 634,070 19,830
Source: DGSS.
46. A comparison of benefit levels in 1986 under the BPS (DGSS) programwith those of the three state-regulated private funds shows that the latterare significantly above BPS (DGSS) average retirement earnings (bankingemployees fund 2.25 ratio in 1986; professionals fund 2.08; and notaries fund3.37). With respect to the armed forces fund, retirement earnings were about20 percent above those of the banking fund employees in 1986. There areimportant inequalities within each fund so that the averages do not reflectall the differences in benefit levels. For instance, in the notaries fund,notaries represent more than two-thirds of the fund's beneficiaries, withaverage benefits in 1984, at about 2.3 times those of the retired employees.
47. The BPS (DGSS) maximum benefit ceiling is 7 times the averageminimum salary and 15 times the national minimum salary for advance retirementfrom political and other confidential jobs. Significant differences inretirement and pension benefits, however, are not justified when thesebenefits are partially financed with general tax revenues (the situation afterthe 1979 reform). Since benefits are no longer fully tied to individualcontributions, uniforming benefits and reducing their dispersion is justified.

- 19 -
Multiple Benefits
48. The multiple job practice, specially in the public sector, resultsin a considerable number of multiple benefits under separate activities. Inthe BPS (DGSS) system, about 69,352 beneficiaries received 145,696 payments inSeptember 1985, which represented about 18 percent of total payments. Thedistribution by fund is: industry and commerce, 55 percent; civil servantsand teachers, 29 percent; and rural and domestic workers, 16 percent. Byamounts, the distribution is: civil servants and teachers, 48 percent;industry and commerce, 41 percent; and rural domestic workers, 11 percent.
G. Future Prosp cts of Retiremut Program_
49. Long-term demographic projections show that the retirement andsurvivors' funds will be subject to additional pressures as the old-agedependency ratio increases slightly (Table 14). Adverse demographic trendscombined with low retirement ages, bring abot.L r ispects of continuedfinancial pressures on the retirement and s.} .v' s' funds. This leads to theconclusion that there is a need for increasln>, '-enues or decreasing expendi-tures, or a combination of both. Given the h- ,J level of current socialsecurity contributions and Government transfers, the main avenue for asolution is the reduction of benefits.
Table 14: URUGUAY: POPULATION TRENDS, 1985-2000(in thousands)
Age Group 1985 1990 2000 2020
0-14 795 805 825 84115-59 1,710 1,774 1,937 2,26460-64 137 149 142 17765 and over 318 346 402 434
Total 2,960 a/ 3,074 3,306 3,716
Ratios:Old-age to working-age
population dependency(60 and over) .27 .28 .28 .27
Old-age to working-agedependency(55 and over) .17 .18 .19 .18
a/ Most recent estimate 2,940 (from 1985 census sample).
Source: DGEC

- 20 -
50. The 1979 reform represented a step in this direction. As a resultof the changes introduced (para. 15), long-term projections of the burden onthe present retirement and survivors' systems (normal retirement ages: 60 formen and 55 for women) show a significant improvement in the ratio betweencontibuting workers and beneficiaries (Table 15). This progress, however, isinsufficient to place the retirement and survivors' funds on a solid footing.
Table 15: URUGUAY: RITIRENENT AND PENSION RATIOSUNDER THE 1979 REGIME a/
(in thousands)
1986 1990 2000 2020
1. Contributing Workers 716 755 826 9662. Retirees - equivalent earning units
(including disability) b/ 301 287 241 2303. Survivors number c/ 234 280 333 3474. Survivors-equivalent earning units c/ 73 87 103 1085. Old Age 25 37 39 456. Old Age - equivalent earning units c/ 10 14 14 17
Ratios:(1)/(2) = ri 2.37 2.58 3.43 3.74(1)/(2)+(3)+(5) - r2 1.28 1.25 1.35 1.55(1)/(2)+(4) = r3 1.86 1.95 2.31 2.72
a/ All funds.b/ Adjusted for multiple retirement payments. Total number of rayments
is 635,000.c/ An earnings equivalent unit is used because the family of a deceased
retiree has the righ~t to one pension unit, which is distributed among nsurvivors. Counting the survivors receiving benefits tends to exaggeratethe burden on the system.
Source: DGSS
H. Refors Program to Ensure BPS' Viability
51. Retirement and survivors' funds still need far-ranging reforms.As noted earlier, the present system cannot be maintained without changes;its expenditures absorb a large share of GDP and require significant Govern-ment transfers. Benefits have to be at a level compatible with the Country'slong-term capacity to finance these benefits and with society's willingness topay for them. An action program to improve the situation must includemeasures on three different levels:
- 21 -
(a) long-term structural reforms;
(b) short-term measures to strengthen the financialposition of the system; and
(c) actions to improve administration procedures andregulations to control evasion.
Loag-Ter. Reform
52. Structural reforms will help to ensure the long-term viability ofthe retirement funds in the coming decades; in this respect, taxes must beincreased or benefits reduced. Tax monies used to finance social securityare already high. Any increase in payroll contributions, or other taxesearmarked for social security, should be small. As noted earlier, workershave low real wages and, therefore, should not face a much stiffer tax burdento pay for benefits to the elderly and their dependents. Financing out ofgeneral tax revenues is no substitute either. The burden on the economyremains the same, and workers pay indirectly for them through other taxes orthrough deficit financing with their inflationary consequences. The mostviable alternative is to scale-down benefits. The elements for a structuralreform are: (i) increasing normal retirement ages to 65 for men and 60 forwomen, in view of the high life expectancy at retirement; (ii) reducing thepercentage of the basic salary paid to future retirees; (iii) eliminatingprivileged situations; (iv) consolidating retirement benefits and cappingthem; and (v) limiting the rights to pensions of working-age dependents.
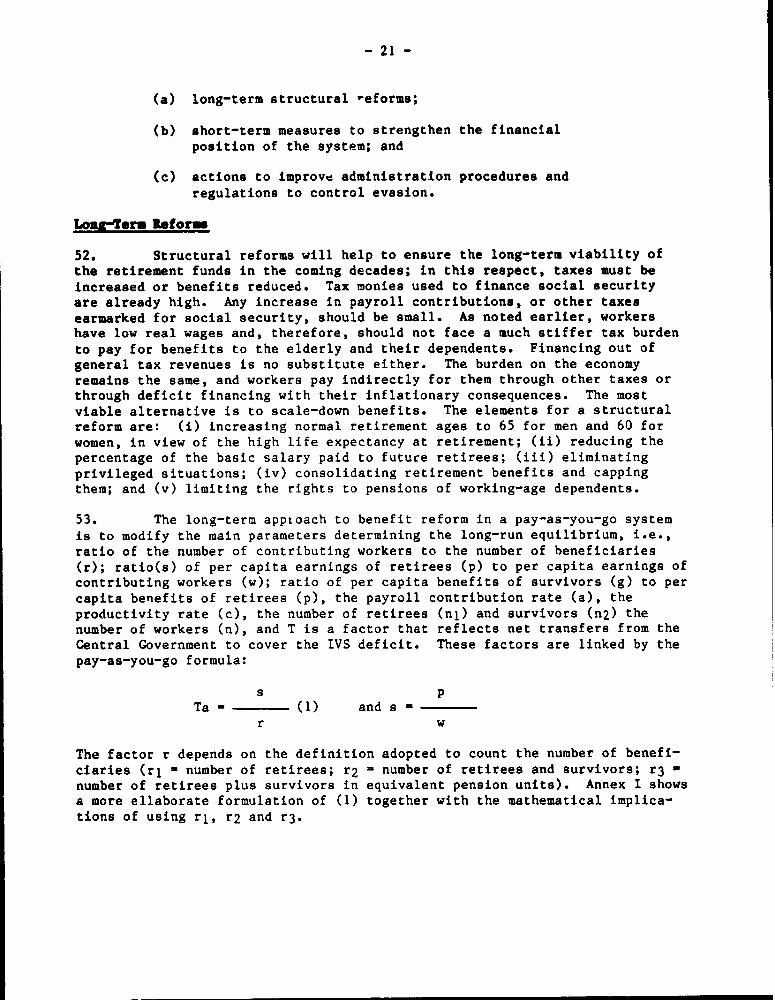
53. The long-term apptoach to benefit reform in a pay-as-you-go systemis to modify the main parameters determining the long-run equilibrium, i.e.,ratio of the number of contributing workers to the number of beneficiaries(r); ratio(s) of per capita earnings of retirees (p) to per capita earnings ofcontributing workers (w); ratio of per capita benefits of survivors (g) to percapita benefits of retirees (p), the payroll contribution rate (a), theproductivity rate (c), the number of retirees (nl) and survivors (n2) thenumber of workers (n), and T is a factor that reflects net transfers from theCentral Government to cover the IVS deficit. These factors are linked by thepay-as-you-go formula:
s pTa- (1) and s -
r w
The factor r depends on the definition adopted to count the number of benefi-ciaries (rl - number of retirees; r2 - number of retirees and survivors; r3 -number of retirees plus survivors in equivalent pension units). Annex I showsa more ellaborate formulation of (1) together with the mathematical implica-tions of using rl, r2 and r3.

- 22 -
54. The estimated ratios (rl, r2, r3) for the 1979 social securityregime are shown in Table 15. With a - 0.268 and T - 1.24 in 1986, Ta - 0.332(the equivalent payroll contribution rate, which is higher than the one ineffect by 0.062). The values of & in equations (3), (4) and (5)
of ANNEX I for 1986 (excluding administrative expenses and funeral allowances)are as follows:
(a) - 0.788 in equation (1).
This value is above the initial retirement benefit to wage percentage becauseit reflects the additional burden of the survivors' benefits;
(b) - 0.425 in equation (2).
The ratio is low for the opposite reason; each survivor is counted as a fullpension unit, although the payment is a percentage (which depends on thenumber of qualifying survivors) of another percentage (which depends on thecloseness of the blood relationship to the deceased retiree); and
(c) p - 0.618 in equation (3).
This ratio weighs the retirees and survivors by counting them in pensionunits.
55. The mathematical relations between rl, r2, and r3 are not constantthrough time. While Uruguay's 1986 ratios (para. 54) are interchangeable forcomputational purposes because they reflect actual data and a given composi-tion of the population of beneficiaries and pension units, projected ratiosfor the year 2000 and beyond are not because the number of retirees is decrea-sing and the number of survivors is increasing. The total number of retireesdecreases with: (i) a return to more normal levels of the annual incrementsof new retirees on the basis of population trencs; and (ii) the death of thebulk of the retirees that took advantage of the ?,re-1979 regime during thetransition to the new regime in the early 1980s. The number of survivors, onthe other hand, increases at rates above those of population trends on accountof (ii) above.
56. The ratio r3 and the corresponding S3 are the relevant indicatorsfor long-term projections in Uruguay because r3 measures future obligations inpension units, which is in line with the Country's social security legisla-tion. Using r2 will tend to exaggerate the burden on the system by countingeach beneficiary as a full pension. All ratios may require some adjustment inthe number of beneficiaries for multiole pensions and in the number of contri-buting workers for payments by the same worker to different retirement funds.However, this does not affect, in a significant way, the computations or theconclusions.

- 23 -
57. For transfers from the Central Government to be 0 (T-1), the equili-brium equation of the IVS program of BPS in the year 2000 under the current
system (after the approval of the 1987 tax increase) will show the following
ratios:
(a) a - 0.287, rl - 3.43 and sl - .98;
(b) a - 0.287, r2 - 1.35 and S2 - .39; and
(c) a - 0.287, r3 - 2.13 and 83 - .66.
The value of r3 and 53 in the year 2000 shows an improvement of about 7
percent over the 1986 values, as the existing stocks of retirees and survivors
gradually dwindle and new retirees and survivors join the system. Theparticipation rate of new retirees will be about 26 percent in 1990, 70
percent in 2000, and 99 percent in 2020, and the participation of their
survivors will be 8 percent in 1990, 54 percent in 2000, and 93 percent in
2020.
58. The situation noted in para. 57 is modified by changes in the
relative values of pensions and wages. Aside from the usual adjustment of
social security benefits for changes in money wages, if the new retirees and
their future survivors fare better than their predecessors in maintaining thereplacement rate (the ratio of the workers' initial retirement benefits to
earnings in the three years prior to retirement), i.e., the real value of
their pensions (an important factor in maintaining the credibility of the
system), a gradual increase in the ratio s - p will take place over time, asw
the existing stock of beneficiaries with depreciated pension benefitsdisappears in favor of the new stock. This gradual increase will not bepossible unless the system's financial capacity improves. For example,
assuming a 25 percent increase in the average payment to new retirees and
survivors, and the participation rates of para. 57, the average payment to all
retirees increases by 16.2 percent between 1986 and 2000, and the ratio s
(0.618 in 1986) becomes 0.718 in 2000. Our previous calculations in para. 57
shows that the system cannot afford an increase of the ratio above 0.66 (a 6.8
percent increase in the average payment over the percentage increase inwages). The conclusion is obvious. A system that maintains the real value of
the initial pensions will require further structural changes.
59. Hlgber Letirament Age.. The most important structural change in the
social security system is raising normal retirement ages to 65 for men and 60
for women, which increases the ratio of contributing workers to beneficiaries(in current earnings equivalent units) to 2.43 in the year 2000 and 3.32 in
2020 (Table 16). This compares with 2.31 and 2.72, respectively (Table 15),
under the present regime. The ratio r3 becomes 0.70 in 2000, permitting 13.2percent increase in the average payment. Obviously, the change would
strengthen social security finances. However, the gains from this change
would be less than the calculations indicate because currently both men and
women, on the average, are retiring at 62 and 58, respectively.

- 24 -
Table 16s URUGUAY: URTIR3IENT AND PENSION FUNDS */UNDER THE PROPOSED REfYOR PROGRAM
(in thousands)
1986 1990 200W 2020
1. Contributing Workers 716 765 836 9802. Retirees - number 301 280 214 1583. Survivors - number 234 282 339 3514. Survivors - in earnings
equivalent units 73 90 113 1205. Old Age - member 25 37 41 466. Survivors - in earnings
equivalent units 10 14 16 17
Ratios:(1)/(2) 2.37 2.73 3.90 6.21(1)/(2)+(3)+(5) 1.28 1.28 1.41 1.77(1)/(2)+(4)+(6) 1.86 2.00 2.43 3.32
a/ Includes all funds.
Source: BPS
60. Lower Replacement Rate. The second long-term structural adjustmentis the reduction of the percentage (or replacement rate) of the basic salaryused to compute the initial retirement earnings. It seems extremely difficultto finance both: (i) a 70 percent ratio between the initial pension and theaverage wage of the last three years; and (ii) maintenance of the real valueof this initial pension through indexation without recourse to significantCer.tral Government transfers, which Uruguay's economy cannot afford. Althougha lower percentage may look as a significant reduction in benefits, it shouldbe weighed against the erosion of purchasing power that usually takes placeover the years to adjust benefit payments to the financial situation. Thisprocess places retirees with many years in the system at a disadvantage withnew retirees. A gradual reduction to a lower percentage, such as 60 percent,will become necessary if the real value of retirement benefits are to bemaintained in the long run.
61. Elimination of Privileged Red ies. The third structural adjustmentis to reduce, or eliminate, some privileged regimes (para. 18) for futureretirees. Table 6, Statistical Appendix, shows the relative importance ofthese regimes--both in number of beneficiaries and costs to BPS. This reformis more a problem of equity than of large savings to the system.

- 25 -
62. Consolidating and Capping of Ueuf its. The fourth adjustmentconsists of consolidating retirement benefits and capping them. With an agingpopulation, the disparity in benefits cannot be maintained particularly ifthese benefits are partially financed by general tax revenues. The long-termviability of retirement funds depends on a uniform pension system based on theminimum national wage. For these purposes, on equity grounds, it is importantto reduce the cumulative benefit ceiling arising from one or multiplepensions, introduce earnings test for working-age survivors and, when warrant-ed, subject existing pensions to smaller revaluations for inflation over along period of time.
63. Couplementary retiremnt system. These voluntary systems, based onrigorous actual calculations, may be established for higher income groups. A1984 law already permits the creation of these special complementary systems.The most important action is regulating the procedures for these complementaryfunds in order to avoid past mistakes. The Government will enact soon thecorresponding regulations.
Short-Term Actions
64. Central Government transfers to social security programs should bereduced so that, in the long-run, the system is self-financing on the basis ofpayroll contributions from employees and employers. In the short run, thereare two possible avenues: (i) to increase taxes (payroll and others) earmark-ed for social security; and (ii) to reduce the real value of annual cost-of-living increases.
65. The recently approved legislation increased by one percentage pointthe value-added tax rate and introduced a 20 percent surcharge on domesticconsumption taxes on new vehicles. Collections are expected to be about 0.4percent of GDP. These tax measures are earmarked for social security. Thepurpose is to reduce the social security deficit to less than 2 percent ofGDP.
66. The second action is to have a system for annual cost of livingadjustments, which avoids passing on productivity increases to retirees andsurvivors. As a result, gradually the ratios between retirees' earnings andwages will decrease. This is particularly important in order to maintain theoriginal real values of retirement earnings. With an aging population, asworkers real earnings increase on account of productivity increases, thesystem becomes more affordable. Otherwise, the system becomes less viable,placing retirement earnings and survivor pensions, in real terms, increasinglyin jeopardy, forcing an increase in the contribution rate to maintain benefitlevels or a reduction in real benefits. The recent revision of the revalua-tion mechanism, which consolidated the average real wage index as themechanism for cost of living increases, will only be effective as long as realwages remain stable or decline. If productivity increases are incorporated inthe index, the formula would not bring about a reduction of the ratio realpension/real wage.

- 26 -
Evasion
67. Admdnistrative Iprove-nts. Evasion is high in the private sectorun account of nonpayment of contributions and under-declaration of wages. Themost important leaks have been detected in industrial and commercial activi-ties. About 27 percent of the workers in these sectors do not report, andactual payroll contributions represent 52 percent of the estimated totalobligations. Of the estimated level of evasion in industry and commerce (48percent), 38 percent is accounted for by nonpayment of contributions and 46percent by underreporting of wages; however, many workers are in the informalsector and it is estimated that 30 to 50 percent of these workers haveearn.ngs below 1.5 the national minimum wage, and these earnings represent upto 70 percent of the personal income of the family unit.2 /
68. Reducing evasion provides an excellent opportunity to improve theshort- and the long-term finances of the retirement program. This entailsadministrative improvements and the development of control mechanismsincluding the introduction of social security or similar control numbers,individual accounts covering the lifetime contributions of each worker, andretrievable and computerized records, which could be cross-checked with othertax records now being developed in the Ministry of Economy and Finance; sub-stantial penalties (indexed for inflation) for nonpayment, or late payments,of contributions; quarterly payroll reporting for small businesses; and tight-er enforcement of public sector obligations, including the municipalities.
I. Recent Reform Efforts
69. The Government presented draft legislation to Parliament on April 3,1987, to reform the social security system. The main elements of the proposedreform were: (i) raising normal retirement ages to 65 for men and 60 forwomen for all retirement funds (including the army and police funds); (ii)establishing a new system for annual cost of living increases, based on theaverage of the cost of living index and the average wage index, or the lowerof these two indices, if fiscal conditions so dictate; (iii) capping theannual revaluation of benefits at seven minimum wages, and limiting the accessto annual benefit adjustments to groups below the normal retirement ages; (iv)eliminating the special privileged regimes; and (v) a one-percent increase inpayroll contribution to reduce the social security deficit in the short termto two percent of GDP.
70. The Uruguayan Parliament considered the above-noted draft legisla-tion and approved some changes to the social security system, which are asfollows:
(a) modifying privileged retirement regimes for highGovernment officials, politicians, high courtjudges, etc, who were eligible without a signifi-cant length of service or age requirement. Thenew law requires a coefficient of 80 between age
2/ Comision de Seguridad Social, Informe sobre Evasion del Sistema Privado;April 7, 1987.

- 27 -
and length of service in all these occupations,and a three-year minimum on the job to be eligiblefor retirement benefits. The reform is expectedto reduce expenditures by 0.018 percent of GDP;
(b) determining that the annual cost of living adjust-ment will be calculated on the basis of the rateof increase of the average wage index. A compli-cated formula is used for calculating partialperiodic adjustments with the full adjustmenttaking place in March of each year;
(c) establishing a minimum pension level for retireesin 1990 (equivalent to one minimum wage aftertaxes) who meet normal retirement age require-ments. Male retirees below 60 and women retireesbelow 55 will not have this right, with the excep-tion of handicapped people and teachers;
(d) declaring compatible an old-age pension with asingle pension under other retirement system. Theadministration of this should be very tight tokeep the number of new pensions to a minimum;
(e) capping the total of all pensions perceived by aretiree from all retirement funds at 15 minimumwages. This affects future revaluations ofbenefits. About 15,000 people (5,300 are abovethe ceiling, and about 9,000 are expected toexceed the ceiling soon) will not receive aninflation adjustment. Expected savings equal0.01 percent of GDP;
(f) increasing by one percentage point tne value-addedtax rate to 21 percent and introducing a 20percent surcharge on domestic consumption taxes(IMESI) on new vehi.cles. The new taxes areexpected to yield about 0.04 percent of GDP. Theapproved legislation represents a step towardsstrengthening the long-term financial position ofthe social security system. However, furtherstructural actions are required as previouslyanalyzed in paras. 59-63; and
(g) eliminating the ceiling on the number of wag's(eight) subject to social security taxes.

- 28 -
71. In addition, the program to strengthen social security financesincluded: (i) revisions of the system of rural contributions (previouslyapproved by Parliament) to tighten collection mechanisms for rural workers;and (ii) administrative actions to reduce evasion, monitor more effectivelysocial security contributions, improve administration and provide statisticalinformation. These actions include: establishing a single identificationnumber for social security contributions and taxpayers' obligations, stifferpenalties, new reporting requirements for small enterprises, and reduction oflate payments by public enterprises and municipalities. External technicalassistance is provided in support of these actions. Efforts to improvecollections have yielded results. From February 1985 to June 1987, the numberof firms contributing to the system has increased by 38 percent and the numberof contributing workers by 16 percent, mostly from industrial and conmercialactivities.
72. The Government is also finalizing the regulations covering comple-mentary optional systems. The aim is to strengthen these systems enacted in1984 to allow higher benefits to top salaried workers (on a purely privatebasis) above a certain minimum provided to all retirees covered by the socialsecurity system.

- 29- Aez I1
Tb. Pay-Ae-You-Go Squation In Uruguay
1. The main parameters determining the long-run equilibrium of the pay-
as-you-go system are the ratio of the number of contributing workers to the
number of beneficiaries (r); ratio (s) of per capita earnings of retirees (p)
to per capita earnings of contributing workers (w); ratio of per capita
benefits of survivors (g) to per capita benefits of retirees (p), the payroll
contribution rate (a), the productivity rate (c), the number of retirees (nl)
and survivors (n2) the number of workers (n), and T is a factor that reflects
net transfers from the Central Government to cover the IVS deficit. These
factors are linked by the formula shown in paragraph 53 of this report.
5
Ta - (1)r
This formula is equal to:
p (nl + gn2)Ta - (2)
nw (1 + c)t
2. Depending on the definition adopted for the variables r, &, and c,
formula (2) is modified as follows:
(a) if r is defined as the ratio of contributing workers to
retirees and . as o, the I formula is:
Ta = p 1 (3) rl - n g - 0 c - 0w rl ni
(b) if r is defined as the ratio of contributing wo'kers to
retirees plus survivors and . as 1 (survivor's pensions have
the same weight as retiree's earnings), the formula is:
Ta 1 (4) r2 - n g 1 c - 0w r2 nl+n2
if r is defined as the ratio of contributing workers to retirees plus survi-
vors both expressed in numbers of equivalent retirement earning units (an
average survivor's pension equivalent to 0.33 retirement earnings units), the
formula is:
Ta - p 1 (5) r3 n g - .33 c - 0w r3 nl+.33n2
3. Equations (1) and (2) above do not make provisions for administrative
expenditures and funeral expenses to be paid by BPS. The adjustment coeffi-
cient to take these costs into account is 1.08.
s
Ta - 1.08 (6)r

- 30 -
STATISTICAL APPENDIX

- 31 -
STATITCAL APPDMIX
Table of Contnts
Pag no.
1. COVERAGE OF RETIREMENT FUNDS ............ ................ 32
2. FINANCIAL SITUATION OF SOCIAL SECURITY FUNDS ............ 33
3. FINANCIAL POSITION OF BPS (DGSS) ........................ 34
4. BPS (DGSS) - RETIREES AND SURVIVORS BY AGE ..............BRACKETS AND BENEFITS ............... ................. 35
5. BPS (DGSS) - RETIRE?5NT BY MOTIVE ....................... 36
6. SPECIAL RETIREMENT REGIMES: NUMBER OF BENEFICIARIES ....AND COSTS BY AGE GROUP ...... ......................... 37
7. PENSIONS BY SEX AND CATEGORY ......... ...................... 38

- 32 -
Ahdf Toe 1: :MU WEaC (F NMO A
1979 1960 1981 1982 1963 1984 1985 1986
RsRetirees 283.5 303.3 318.2 333.3 340.5 345.6 345.0 342.0Survivors 239.5 248.4 254.5 258.5 261.3 262.8 264.9 266.6Old Age 28.5 26.8 25.4 24.5 23.6 22.0 21.4 25.5Sub-total 530.5 578.5 598.0 616.3 625.3 630.4 631.2 634.1
Retirees 9.2 9.4 9.5 9.7 9.8 9.9 9.7Survivors 6.5 6.7 7.1 7.3 9.5 9.9 10.4Sub-total 15.7 16.1 16.6 17.0 19.3 19.8 20.1
Retirees n/a n/a 15.0 16.1 16.1 16.1 16.4 17.1Survivors n/a n/a 11.4 11.8 12.2 12.5 11.9 12.0Sub-total n/a n/a 26.4 27.9 28.3 28.6 28.3 29.1
Retirees n/a n/a n/a 11.4 11.4 11.6 12.4Survivors n/a n/a n/a 13.8 14.2 14.8 15.2Sub-total n/a n/a n/a 25.2 25.6 26.4 27.6
*dy MuRetirees 0.5 0.5 0.5 0.6 0.6 0.5 - c/ -c
Survivors 0.5 0.5 0.5 0.5 0.5 0.4 - / - /Sub-total 1.0 1.0 1.0 1.1 1.1 0.9 c/ - /
7thalRetirees 293.2 a/ 313.2 a/ 343.2 b/ 371.1 378.4 383.7 383.5Survivors 246.5 a/ 255.6 a/ 273.5 b/ 291.9 297.7 300.8 302.4Old-Age 28.5 26.8 25.4 24.5 23.6 22.0 21.4 25.5
568.2 a/ 595.6 a/ 642.1 b/ 687.5 699.7 7o6.5 707.3
a/ Excludes army and police.b/ Excludes police.c/ Since 1985 included in BPS.

- 33 -
Ab 2z Td1* 2: lMW: VAIML SM!IG W S)CJL OCR1' MM(J11J. f 3$)
190 1 1981 I 1 19894 165 1986
1. BPS (D(SS) 5,533 7,600 7,868 10,571 14,736 29,348 61,7682. Ary n/a 249 323 561 737 1,3503. Police n/a 602 480 690 1,777 2,7834. State-regulated Private 746 1,114 1,398 1,795 2,475 4,847
B1ak Furi 465 679 824 1,048 1,454 3,259Professional Fund 175 276 376 473 645 1,028Notary Fund 106 159 198 274 376 560
5. Jockey Club Fuds 11 17 18 21 31 39 b/Total 90a/ 9,582 10,097 13,638 19,756 38,637
IL s1. BPS (DCSS) 6,797 12,191 15,431 18,634 25,288 43,692 85,9882. Arny n/a 1,227 1,666 1,900 3,206 4,8073. Police n/a 997 1,246 1,309 1,850 2,7184. State-regul'red Private 637 1,109 1,353 1,771 2,148 3,354
Beraing urid 382 725 796 1,026 1,358 2,007Professional Fund 150 247 342 464 568 866Notary Fund 105 137 215 281 223 482
. Jockey Club Furs 11 16 19 24 28 37 b/Total 7,445 15,944 19,743 23,638 32,520 54,608
C. S&xphuo (+) or Deficit (-)1. DGSS -1,264 -4,591 -7,563 -8,063 -10,552 -14,344 -24,2202. Army -498 -978 -1,343 -1,339 -2,468 -3,4573. Police -209 -395 -766 -619 -73 654. State-regulated Private 109 5 45 24 325 1,493Banking Fnrd 83 -46 28 22 96 1,252Professiaal Fund 25 29 34 9 77 162Notary Fund 1 22 -17 -7 153 78
5. Jockey Club Funds 0 1 -1 -3 3 2 b/Total -155 a/ -6,362 -9,646 -10,000 -12,764 -16,241
6. Total (1980 pesos) -1,155 -4,745 -6,048 -4,206 -3,453 -2,554
a/ Excluding army and police.b/ Since 1986 included in BPS.
Sam: DGS

- 34 -
A4z"|d1z ST* 3: IU ^W: VDWNCIAL PO6rr10 OF BPS (DMKS)(MHLliao of currest NS)
1900 1961 1962 1963 1964 1965 1986
Ae RevnuDIPACE 1,855 2,159 2,497 3,518 4,373 8,377 17,258
DIPAICO 2,305 3,191 3,326 4,615 6,895 14,139 30,577
DIPRUSEDO 161 244 186 581 1,003 1,806 3,682
DAFA 506 916 691 595 742 1,233 2,346
DISSE 594 689 784 852 1,214 3,057 6,640DISEDE 112 18 5 - - - -
OTHER - 383 379 410 509 736 1,264
Total 5,533 7,600 7,868 10,571 14,736 29,348 61,768
B. xDIPACE 2,070 3,961 5,158 6,234 8,061 12,837 23,930
DIPAICO 2,306 3,726 4,742 5,883 8,100 13,564 27,392
DIPRUSEDO 980 1,601 2,068 2,311 3,319 5,912 12,769
DISEDE 196 559 560 478 669 1,247
DAFA 908 1,349 1,302 1,479 2,223 3,842 6,576
DISSE 404 579 708 889 1,426 4,005 8,588
OTHER - 780 894 1,278 1,680 2,863 5,386
Total 6,797 12,192 15,431 18,634 25,288 43,692 85,988
C. Surplus ( ) or Deficit (-)
DIPACE -215 -1,802 -2,661 -2,716 -3,688 -4,460 -6,672
DIPAICO -1 -535 -1.416 -1.268 -1,205 575 3,185
DIPRUSEDO -819 -1.357 -1.882 -1.730 -2,316 -4,106 -9,087
DISEDE -178 -554 -560 -478 -669 -1,247
WFA -402 -433 -611 -884 -1,481 -2,609 -4,330
DISSE 190 110 76 -37 -212 -948 -1,848
OTHER - -397 -515 -868 -1,171 -2,127 -4,122
Total -1,264 -4,592 -7,563 -8,063 -10,552 -14,344 -24,220
TOTAL (1980 prices) -1264 -3,425 -4,741 -3,387 -2,855 -2,253 -2,157
Source: DGSS.

- 35 -
IL~~~ d
_hek~~~~~~~~~~ob et: - -_0 _=
B1d 25 18 13,857 13,M5 7,30 21,125 - 25 67 8,313 8,3D 1,3)7 9,673D - 39 679 22,454 23, 13 2,698 25,8340 - 49 5,43 2B,1£5 33,38 2395 35,993350- 9 41,912 35,98 77, 2,329 8D,360 - 64 56,A8 18,254 75,122 1,3)7 76,42965 - 74 132,911 Y4,051 166,952 5,532 172,49475 - 79 49,279 14,9X6 64,225 3,378 67,603
Oyw 79 46,485 18,40) 64,885 4,315 69,20Dthrassified 116 34 462 837 1,299
MJNM4 333,818 194,728 528,546 31,403 559,949
(As of Nbrkber 1986)&emp in^9B.A9w 69 58 64
KMxn 70 29 68itIn3n 68 59 63
Y. A t mu. AmM Its. Amn au. Amse Mu.6 how00O 00) 00 0M 00)
O - 14,000 M3, 198 2,162,400 180,948 1,C4w4,281 371,146 3,206,6831 31,403 278,008 402,549 3,484,68914,0)1 - 30,003 113,VO4 2,230,392 12,080 225,276 125,124 2,455,668 - - 125,124 2,455,66830,001 - 5i,003 23,786 873,877 1,260 47,5S6 25,046 921,443 - - 25,(b6 921,44353,001- 70,000 4,329 251,850 3,334 19,197 4,663 271,057 - - 4,663 271,C5770,001 - 8,000 83 66,62) 54 4,0O0 947 70,63D - - 47 70,62)83,001 - 160,000 1,531 154,593 51 4,976 1,552 159,5S9 - - 1,552 159,569
160,001- 250,000 67 12,031 1 186 68 12,217 - - 68 12,217Cbe 250,000 - - - - - - - -
ML 333,818 5,751,773 194,728 1,345,482 S28,546 7,097,255 31,403 278,008 559,949 7,375,2Z3hvra bmefit
M) 17,23D 6,909 13,428 8,853 13,171D1Jar et1al
(Ls$) 87 35 68 45 67Aie 1mfit/
E Mixmdn we(M.514,450; 85% ofNU$17,000) 1.19 0.48 0.93 0.61 0.91
se BPS.

- 36 -
Amnd^ix Tkl 5: tMUP : 3Mg (DOS) - lritiNin BY DTIYK(sum 1986)
Jdeor Act No. 9 Act. Nb. 9 Act No. 13 Totalmbtive oer ' br X Nbber X Nb er X
Lay-off 11,811 3.9 - - - - 11,811 3.4Age-service 179,575 58.6 14,633 72.9 11,781 69.8 205,989 60.0Old Age 19,408 6.3 1,179 5.9 818 4.8 21,405 6.2Disability 32,875 10.7 4,226 21.7 4,173 24.7 41,274 12.0Maternity 26,601 8.7 - - - - 26,601 7.7Special services 15,694 5.1 - - - - 15,694 4.6Advanced retirement 47 - 17 - 76 0.5 140 -Teachers (20 years service) n/a n.a - - 2 - 2 -Teachers (25 years service) n/a n.a 3 - 17 0.1 20 -Bonificada n/a n.a I - 7 - 8 -Employers 9,768 3.2 - - - - 9,768 2.8Unclassified 10,862 3.5 - - - - 10,862 3.3
TOTAL 306,641 100.0 20,059 100.0 16,874 100.0 343,574 100.0

- 37 -
Appendiz Table 6: URUGUAY: SPECIAL RUTIRE3KIT REGIMES:MUMWER OF BEIMFICIARIES AND COSTS BY AGE GROUP
Ase Groups (persons)Retirement Regime Less than
45 45-55 55-60 Over 60 Total
Teachers (Servicios benificados) 66 2,203 7,326 4,495 14,090Disability 1,164 5,166 17,725 16,654 40,709Lay-off (after 10 years ofservice) a/ 74 835 5,043 4,533 10,485
Mothers (after 10 years ofservice) a/ 912 5,128 10,OOOE 10,364E 26,404
Politicians, Political appointeesand courts 55 161 185 487 888
TOTAL 2,271 13,493 40,279 36,533 92,576
Total Costs by Aga Group (thousand pesos)Less than
Retirement Regime 45 45-55 55-60 Over 60 Total
Teachers (Servicios bonificados) 1,206 51,759 123,729 82,198 258,882Disability 10,823 54,257 184,994 195,217 445,291Lay-off (after 10 years of
service a/ 599 6,817 40,898 39,047 87,362Mothers (after 10 years of
service) a/ 4,220 14,367 69,034E 70,OOOE 157,620Politicians, Political appointees
and courts 3,526 11,715 13,486 36,184 64,910
Total 20,374 138,915 432,141 422,637 1,014,065
Estimate.
a/ This category will disappear at the end of the life cycle of current beneficiarieavailable to current workers after the 1979 reform.
Source: BPS

- 38 -
ADDndix Table 7: URUGUAY: PENSIOUS ST SKX AND CAZIOOtY
AmountNo. of No. of Total (Thousand
Cause males females number peso)
Widowers, widows 54 150,436 i5O,489 7,990Legitimate children 3,840 87,307 91,147 2,002Disabled legitimate children 2,103 4,752 4,855 253Married legitimate children 0 9,252 9,252 127Adopted children 157 23 180 8Disabled adopted children 8 45 73 5Married adopted children 0 6 6 -Illegitimate children 218 2,198 2,416 80Disabled illegitimate children 26 76 102 5Married illegitimate children 2 108 110 2Parents 24 2,922 2,944 96Divorced 0 205 205 11Divorced remarried 0 10 10 1Independent children 0 82 82 2Daughters 3 2,233 2,236 67
TOTAL 6,434 259,673 266,107 10,650

J' *-%~~~~~~~~~~* A.54-
31-~~~~~~~~~~~~~~~~~~~~~~~~~~~~~~~~~~~~~~~~~~~~~~~~~~
Ays_F, -~ -_ -S
I~~~~~~~~~~~~~~~~~~~~~~~~~A I f r ,k- /
42XANG~ ,, '- N1"1k z /A r.N
j R + X p hede.c \ ~~~~~~~~~~~B R A Z I L
- .1~~~~~~~~~~~~~R4- ~~~~~~~~~~---.. i~~~~~~~~~~~~~c.
f gl - q'oxb lrs / A > s \~~~~~~~~~C.o Ioo -
, Pedro f yJ t \ 11 17t~~~~~~~~~~~~~~~~~~~~~~~~~~~\,~
r-I
fAYSANDU~ ~ ~ ~ ~ ~ ~ ~ ~ ~ ~ ~ ~~~~~~~~V,I qu,.k Xf l{ d
14 -L L O 4
AM -\-/)lL N 9S_ 1- tOSE- - . ,
y
d.1 tD~~~~~~F,,.C.p..l. ~~ -1 . g -~o fd*
2 4 a ftd ... B~..&
AC I IA 3 i-a iqo-
's.~ ~~~~~~~~~~~~~~~~~~~ wwi
~~~~~~~~~~~~~~~~~ biom _ d ,, d.n..
El _______________________ - 3_ lb
K-LCAtTEIIS
57r 56' Ssf,
_~~~~~~~~~~~~~~~~5