ursula sánchez instituto nacional de estadística e informática
TRANSCRIPT

Ursula Sánchez
Instituto Nacional de Estadística e Informática
Instituto Nacional de Estadística e Informática

Introduction
The National Households Survey
Closing the gap:Rural poverty and Hunger
Poverty expressions in the rural areas
Final remarks
StructureStructure

IntroductionIntroduction
Rural poverty Rural poverty numbersnumbers
Represents 63% of the world poverty
30% of the Peruvian population is rural, of those 74% are poor
Extreme cases: Huancavelica were 9 of every 10 households live in poverty conditions

The National Households SurveyThe National Households Survey
Sample – 20,000 households0
4,000
8,000
12,000
16,000
20,000
1997 1998 1999 2000 2001 2002 2003
Urban Rural
1995
First survey
1997
MECOVI Improved version
2003
Change in periodicity Monthly operation
Interview average time : 3.5 hours
Subjects Subjects coveredcovered
Subjects Subjects coveredcovered
Education, health, employment, income and expenditure, access to social programs, etc.

0 10 20 30 40 50 60 70 80
% %
0 10 20 30 40 50
Total
Rural
Urban2001 2001
2002 2002
2003 2003
Closing the gap…Closing the gap…
Poverty indicators: important differences between urban and rural areas
Rural area: most vulnerable in Peru
55 24
54 24
52 21
77
51
50
74 43
7842 10
42 10
409
PovertyPoverty Severe PovertySevere Poverty
Poverty incidencePoverty incidencePoverty incidencePoverty incidence

20
25
30
35
40
45
50
2001 2002 2003
%
Rural caloric deficit Urban caloric deficit
Closing the gap…Closing the gap…
Hunger levels are still high
Important reduction over the last year for the rural areas
HungerHungerHungerHunger
Closing the gap…Closing the gap…
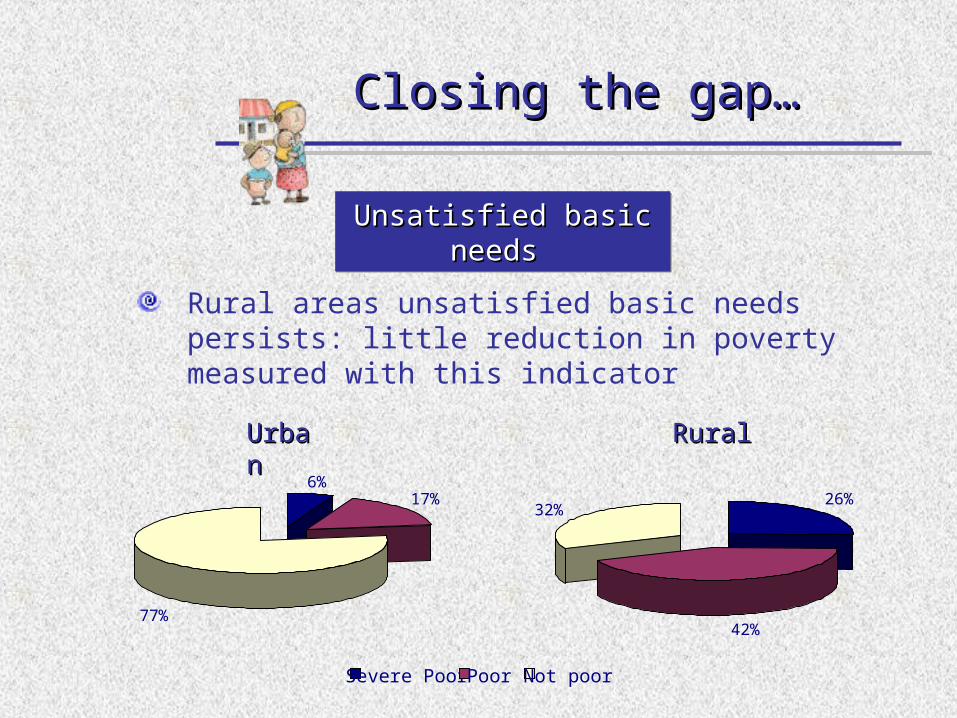
Unsatisfied basic needs Unsatisfied basic needs Unsatisfied basic needs Unsatisfied basic needs
32%26%
42%
6%17%
77%
RuralRuralUrbanUrban
Severe Poor Poor Not poor
Rural areas unsatisfied basic needs persists: little reduction in poverty measured with this indicator

0
10
20
30
40
50
Urban RuralHouseholds....
Closing the gap…Closing the gap…
Unsatisfied basic needs Unsatisfied basic needs Unsatisfied basic needs Unsatisfied basic needs
…with inadequateconditions
…withovercrowded
conditions
….without drainage
..with kids whodon´t attend
school
Important deficiencies persists in the rural areas…

Closing the gap…Closing the gap…
Poverty by altitudePoverty by altitudePoverty by altitudePoverty by altitude
The Peruvian territory is divided by three natural regions, that form eight steps from the bases to the summits

Closing the gap…Closing the gap…
Poverty by altitudePoverty by altitudePoverty by altitudePoverty by altitude
Estimates demonstrated a positive correlation between altitude and poverty levels
Altitude Population Poverty incidence
2001 2002
Chala 0 - 500 mts 23% 47.3% 48.0%
Yunga 501 - 2300 mts 13% 59.6% 59.2%
Quechua 2301 - 3500 mts 15% 72.4% 67.9%
Suni, Puna, Janca 3501 - >4800 mts 12% 79.8% 78.0%
Rupa Rupa 400 - 1000 mts 4% 71.8% 69.5%
Omagua 80 - 400 mts 7% 68.5% 65.8%
Metropolitan Lima 26% 31.9% 34.7%

Poverty expressions….Poverty expressions….
Some indicators give us an idea of the precarious conditions of the rural areas:
Most vulnerables:
Children
12% of the children under 5 had inadequate weight
60 of every 1000 children born alive die before reaching 1 year
Only 20% of the children finish primary school on time

Final remarksFinal remarks
High poverty rates persists in rural areas
Over the last decades: socioeconomic policies increased the differences
Last few years: Last few years: Poverty focalization Poverty focalization
2001 2003
Poverty Poverty ratesrates
Economic growth: 8.8%Economic growth: 8.8%
78.4%
42.0%
73.6%
40.3%
Rural
Urban
- 4.8
- 1.7
64.0%
31.9%
58.9%
34.7%
Provinces
Lima
- 5.1
+2.8

Instituto Nacional de Estadística e Informática
Ursula Sánchez
Instituto Nacional de Estadística e Informática