urmap, an ultra-fast read mapperon the more challenging, and often more biologically interesting,...
TRANSCRIPT

Submitted 26 February 2020Accepted 20 May 2020Published 24 June 2020
Corresponding authorRobert Edgar, [email protected]
Academic editorElliot Lefkowitz
Additional Information andDeclarations can be found onpage 18
DOI 10.7717/peerj.9338
Copyright2020 Edgar
Distributed underCreative Commons CC-BY 4.0
OPEN ACCESS
URMAP, an ultra-fast read mapperRobert EdgarUnaffiliated, Corte Madera, CA, United States of America
ABSTRACTMapping of reads to reference sequences is an essential step in a wide range ofbiological studies. The large size of datasets generated with next-generation sequencingtechnologies motivates the development of fast mapping software. Here, I describeURMAP, a new read mapping algorithm. URMAP is an order of magnitude faster thanBWA with comparable accuracy on several validation tests. On a Genome in a Bottle(GIAB) variant calling test with 30× coverage 2×150 reads, URMAP achieves highaccuracy (precision 0.998, sensitivity 0.982 and F-measure 0.990) with the strelka2caller. However, GIAB reference variants are shown to be biased against repetitiveregions which are difficult to map and may therefore pose an unrealistically easychallenge to read mappers and variant callers.
Subjects Bioinformatics, Computational Biology, Molecular BiologyKeywords Next generation sequencing, Read mapping
INTRODUCTIONBackgroundNext-generation sequencing has enabled dramatic advances in fields ranging from humanfunctional genomics (Morozova & Marra, 2008) to microbial metagenomics (Gilbert &Dupont, 2011). Data analysis in next-generation studies often requires mapping of reads toa reference database such as a human genome, human exome, or a collection of full-lengthmicrobial genomes. Mapping is a special case of sequence database search where the querysequence is short, database sequences are long, and sequence similarity is high. For a givenquery sequence (read), the primary goal of mapping is to report the best match if possible,otherwise to report that the best two or more alignments are sufficiently similar to eachother that the best match is ambiguous.
Prior workMany mapping algorithms have been proposed. Representative examples include BWA (Li& Durbin, 2009), Bowtie (Langmead et al., 2009), Bowtie2 (Langmead & Salzberg, 2012),SOAP (Li et al., 2008), SOAP2 (Li et al., 2009b), Minimap2 (Li, 2018), FSVA (Liu, Wang& Wang, 2016), SSAHA (Ning, Cox & Mullikin, 2001), Hisat2 (Kim et al., 2019) and SNAP(Zaharia et al., 2011). Mappers utilizing the Burrows-Wheeler Transform (BWT) (Burrows& Wheeler, 1994) are the current de facto standard, with BWA and Bowtie2 in particularhaving more than 39,000 citations combined at the time of writing (Google Scholaraccessed 31st Dec 2019). When first utilized in read mapping, BWT had the importantadvantage that it creates a compact index with size comparable to the reference database.For the human genome, this is ∼3 GB, which is small enough to be stored in RAM with
How to cite this article Edgar R. 2020. URMAP, an ultra-fast read mapper. PeerJ 8:e9338 http://doi.org/10.7717/peerj.9338

the commodity computers of that time. Currently, computers with 32 GB or more RAMare readily available, which has raised the question of whether additional memory couldenable better mapping performance. In particular, the authors of SNAP claim (Zaharia etal., 2011) that its use of a∼27 GB hash table index for the human genome gives both fasterspeed and higher accuracy than BWA. FSVA also uses a hash table, reportedly (Liu, Wang& Wang, 2016) achieving faster speed than BWT though with somewhat lower accuracy.
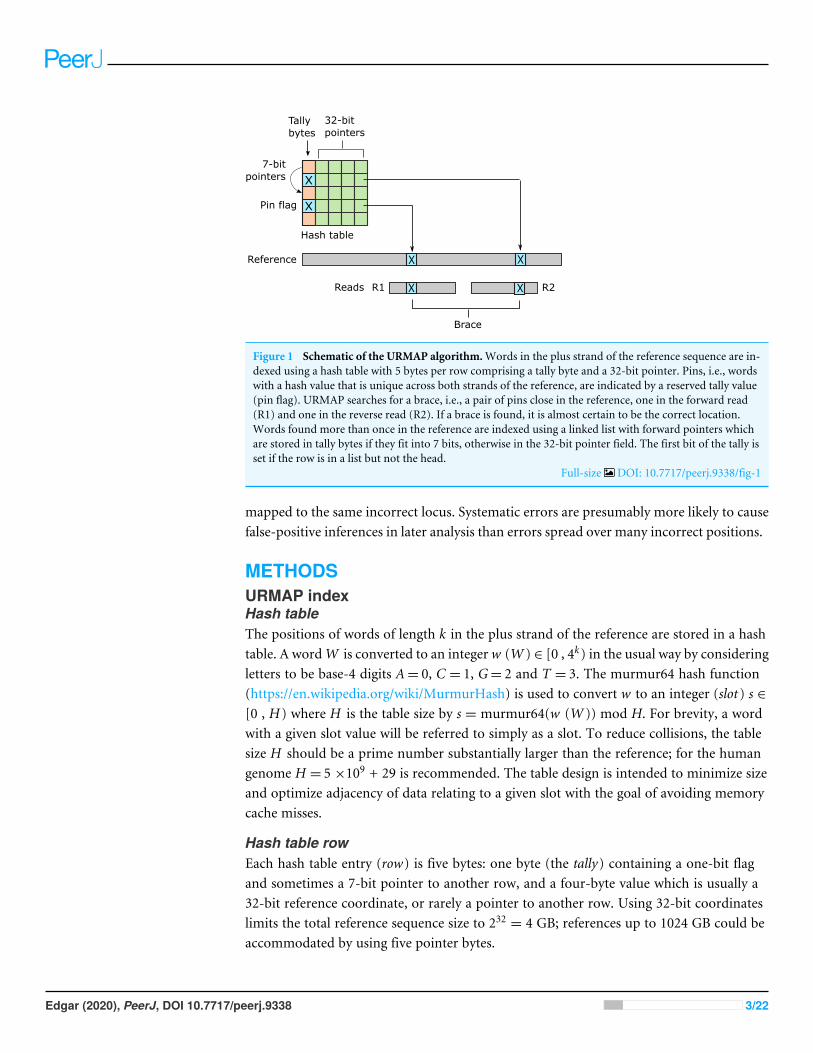
URMAP algorithmURMAP uses a hash table index on k-mers, i.e., fixed-length words of length k, where k= 24 is recommended for the human genome. The index is designed to keep informationrelating to a given hashed word (slot ) close together in RAM to minimize memory cachemisses. Slots found exactly once in the reference (pins) are flagged. For a given query,URMAP first searches for a pair of non-overlapping pins which are close together in thereference (a brace, see Fig. 1). If a brace is found, an alignment is attempted and the searchterminates immediately if successful. Otherwise, a seed-and-extend strategy (Altschul et al.,1990) is followed which prioritizes low-abundance slots.
Performance testingRecent assessments of mapping accuracy, in particular those of SNAP and FSVA, have usedthe wgsim program in the SAMtools package (Li et al., 2009a) to simulate reads of a humangenome. Mutation rates (more correctly, variation rates) of 0.1% were used in both cases,with 0.09% single-nucleotide polymorphisms (SNPs) and 0.01% indels. The base call errorrate was set to 0.4% for testing FSVA and to various different values for testing SNAP.Differences, i.e., base call errors, SNPs and indels, are introduced by wgsim with equalprobability for each type at each position, giving a Poisson distribution for inter-differencespacing where closely-spaced SNPs and base call errors are rare. With a mutation rate of0.1%, most reads of length 150nt simulated by wgsim have no mutation, and most readswith mutations have exactly one single-base variant. In real human genomes, variants tendto cluster, e.g., in non-coding regions (Altshuler et al., 2010;Montgomery et al., 2013). Thus,average accuracy over all reads on a wgsim test gives little insight into mapper performanceon the more challenging, and often more biologically interesting, reads with multipledifferences compared to the reference. Ilumina base call errors also tend to cluster, forexample towards the end of a read (Minoche, Dohm & Himmelbauer, 2011), and in practicethere are therefore manymore reads withmultiple errors than a Poisson distribution wouldpredict.
Urbench performance testIn this work, I introduce Urbench, a new benchmark test using experimentally determinedvariation from a well-characterized human genome. Simulated read sequences arecombinedwith quality scores from a recent 2×150 Illumina run. At each base, a substitutionerror is introduced with the probability implied by its quality score, with the goal ofgenerating a more realistic distribution of base call errors compared to earlier benchmarks.Mapping sensitivity and error rates are measured separately on reads which do, or do not,contain variants. Systematic errors are identified where most reads of a given locus are
Edgar (2020), PeerJ, DOI 10.7717/peerj.9338 2/22
Tallybytes
32-bitpointers
7-bitpointers
Hash table
Pin flag
R1 R2
Brace
XReference
X
X
X
X XReads
X
Figure 1 Schematic of the URMAP algorithm.Words in the plus strand of the reference sequence are in-dexed using a hash table with 5 bytes per row comprising a tally byte and a 32-bit pointer. Pins, i.e., wordswith a hash value that is unique across both strands of the reference, are indicated by a reserved tally value(pin flag). URMAP searches for a brace, i.e., a pair of pins close in the reference, one in the forward read(R1) and one in the reverse read (R2). If a brace is found, it is almost certain to be the correct location.Words found more than once in the reference are indexed using a linked list with forward pointers whichare stored in tally bytes if they fit into 7 bits, otherwise in the 32-bit pointer field. The first bit of the tally isset if the row is in a list but not the head.
Full-size DOI: 10.7717/peerj.9338/fig-1
mapped to the same incorrect locus. Systematic errors are presumably more likely to causefalse-positive inferences in later analysis than errors spread over many incorrect positions.
METHODSURMAP indexHash tableThe positions of words of length k in the plus strand of the reference are stored in a hashtable. A wordW is converted to an integer w (W ) ∈ [0 , 4k) in the usual way by consideringletters to be base-4 digits A= 0, C = 1, G= 2 and T = 3. The murmur64 hash function(https://en.wikipedia.org/wiki/MurmurHash) is used to convert w to an integer (slot ) s ∈[0 , H ) where H is the table size by s = murmur64(w (W )) mod H. For brevity, a wordwith a given slot value will be referred to simply as a slot. To reduce collisions, the tablesize H should be a prime number substantially larger than the reference; for the humangenome H = 5 ×10⁹ + 29 is recommended. The table design is intended to minimize sizeand optimize adjacency of data relating to a given slot with the goal of avoiding memorycache misses.
Hash table rowEach hash table entry (row) is five bytes: one byte (the tally) containing a one-bit flagand sometimes a 7-bit pointer to another row, and a four-byte value which is usually a32-bit reference coordinate, or rarely a pointer to another row. Using 32-bit coordinateslimits the total reference sequence size to 232 = 4 GB; references up to 1024 GB could beaccommodated by using five pointer bytes.
Edgar (2020), PeerJ, DOI 10.7717/peerj.9338 3/22

PinsA pin is a slot found exactly once in the reference, considering both plus and minus strands.This is an important special case because if a pin is found in a read it probably mapscorrectly to the same pin in the reference, though it may also be a false positive due tosequencing error or a genome variant. A pin is indicated by a reserved tally value. The term’’pin’’ was chosen by analogy with a metal (or virtual) pin used to mark a location on apaper (or online) geographical map.
SingletonsA singleton is a slot that is found exactly once in the plus strand of the reference and one ormore times in the minus strand. A singleton is also indicated by a reserved tally value. Notethat while the minus strand is not indexed, there is nevertheless an important distinctionbetween pins and singletons because the reverse-complement of a singleton occurs at leastonce in the plus strand of the reference, while the reverse-complement of a pin does notoccur. Thus, while a pin found in a read implies only one candidate alignment to the plusstrand of the reference considering both strands of the query, a singleton implies at leasttwo candidates.
Linked listsTo store positions of a slot occurring more than once in the plus strand of the reference, alinked list is stored in nearby empty rows. Where possible, 7 bits of the tally are a pointerto the next row in the list, represented as the number of rows to skip. Overflows wherethis number does not fit into 7 bits are handled by storing a pointer to the next row inthe 32-bit value instead of a reference coordinate. Overflows and list ends are indicated byreserved tally values.
Over-abundant slotsSlots exceeding an abundance threshold are excluded from the index. This is a speedoptimization to avoid constructing a large number of candidate alignments. The loss insensitivity is small because abundant slots are usually found in repetitive sequence whichmaps ambiguously unless there is distinctive sequence elsewhere in the read, and uniquereference sequence of length ≥k necessarily contains a pin. By default, the abundancethreshold t is set to 32. A slot that occurs more than t times on either reference strandis excluded. The minus strand is also considered in order to exclude cases where a repeatoccurs with high abundance on the minus strand but low abundance (in particular, onlyonce) on the plus strand. If a slot in such a repeat were indexed, this would tend to lead toan over-estimate of the probability that one of its plus strand alignments is correct becausehigh-scoring secondary alignments to the minus strand would not be discovered.
Absent slotsA slot that does not occur in the reference, or is not indexed because it is over-abundant,is absent, as opposed to a slot which is present in the index. An absent slot may appear in aread, and the index must therefore indicate that the corresponding row does not containa reference coordinate for that slot. This is accomplished by the first bit of the tally, which
Edgar (2020), PeerJ, DOI 10.7717/peerj.9338 4/22

is set to one for present slots and zero for absent slots. The reserved tally values for pinsand singletons have the first bit set to one to indicate that these slots are present, and thereserved values for 7-bit pointer overflows and the end of a linked list start with a zero bitbecause these slots were found to be absent and the corresponding rows were thereforeavailable for use in a list. Linked list pointers in tally bytes are limited to 7 bits to ensurethat the first bit is zero.
CollisionsA hash table collision occurs when two different reference words have the same slot value.A collision between the query and index occurs when a word in the read is different from aword in the index and has the same slot value. Collisions are not represented in the indexor explicitly checked during search. This strategy saves index space without compromisingsearch time because in the rare cases where a collided slot is aligned, the alignment will beabandoned quickly due to excessive mismatches in the flanking reference sequence. Whenaligning, it is faster to check the flanking sequence first than to verify that the seed matchesbecause in the typical (non-collision) case the seed always matches while flanking sequenceoften does not.
Word lengthIncreasing k increases the frequency of pins in the reference and also increases the numberof words per query that are changed by a difference and hence the probability that a readdoes not contain a pin, or any indexed slot, due to read errors and variants. The choiceof k is thus a compromise between speed and sensitivity. With the human genome, k= 24 is recommended because of the ∼3G 24-mer slots, ∼0.9G (30%) are pins, and onaverage a reference segment of length 150nt contains 38 pins. A query sequence with <7single-base differences is guaranteed to have at least one 24-mer match, noting that 7differences eliminate all 24-mer matches only in the tiny fraction of possible distributionswhere they are maximally disruptive, and reads with ≥7 differences will often have at leastone preserved 24-mer.
URMAP search algorithmQuery word search orderWith 24-mers, query words in a read of length 150 are processed at intervals (strides)of length 29 using modulo 127 to keep the position within the read (because there are127 24-mers in a read of length 150). For example, the first three words processed are atpositions 0, 29 and 58. At a given position, both strands are considered, so for example thewords at the first position (zero) in both plus and minus strands are both processed beforemoving on to the plus and minus words at position 29. The stride value 29 is chosen to berelatively prime with 24, which ensures that the following loop will visit each query wordexactly once:
for (int j = 0; j <127; ++j) { QueryWordPosition = (29*j)%127; /* ... */ }.The simple form of this loop without conditional branches may enable loop unrolling or
vector parallelization by the compiler, and regardless is designed to be efficiently executedon modern processors. In general, given the word length k, the stride is identified as the
Edgar (2020), PeerJ, DOI 10.7717/peerj.9338 5/22

smallest prime number with value ≥k +5. The use of a stride >k is motivated by theobservation that neighboring words are not independent. If a query word is not a pin, failsto align, or is not indexed, this is likely to be because the word is in a repetitive regionor variant, or contains a sequencing error. The immediately following words are likely tohave the same problem, and the chances of finding good alignments early in the search areimproved by skipping ahead.
First pass: brace searchIn its first pass through the query words, URMAP seeks a pair of pins that are close togetherin the reference. As noted in the Introduction, such a pair is called a brace (Fig. 1). Thisterm was chosen because the noun ’’brace’’ has two relevant meanings: two of a kind,and a device that connects, fastens or stabilizes. With paired reads, one pin is soughtin the forward read (R1) and the other in the reverse read (R2). While a pin may be afalse positive due to sequencing error or a variant, a brace is almost certain to be a truepositive match. If a brace is found and is aligned successfully (is a good brace), the searchterminates immediately. Previous readmapping algorithms do not terminate when the firsthigh-scoring alignment is found, even if it has nomismatches, because equally high-scoringalignments may exist elsewhere in the reference. By contrast, when a good brace is foundthe likelihood that a different position is correct is vanishingly small. Noting that a typicalread contains several pins, and most pins are true positives, the search for a good bracein a read pair proceeds as follows, with the goal of minimizing the number of hash tableaccesses and attempted alignments in typical cases. The first pins in both reads (the forwardand reverse read, known as R1 and R2 respectively) are identified. If this pair is not a goodbrace, the next pin is identified in R1, giving a new potential brace, then the next pin in R2,and so on. This process continues until a good brace is found or all words in both readshave been processed. Almost all pin pairs which are not braces can be
Identified as such because they are too far apart in the reference, which requires onlythe coordinates in their hash table rows. It is very rare for non-overlapping false positivepins to appear close in the reference, and therefore brace tests almost never fail in themore expensive alignment stage. Since most human 2×150 read pairs contain a correctbrace, the brace search pass identifies the correct reference coordinate for most reads withremarkable efficiency.
Second pass: low-abundance slot searchIf no brace is found, the hash table row for each query word has been accessed exactlyonce. Each row access almost certainly triggers a memory cache miss because of the largesize of the hash table (∼25 GB for the human genome). To accelerate access to theserows in subsequent passes, the first pass copies them to a small (few kB) per-threadbuffer (PTB). Other data which may be used repeatedly, such as query slot values and thereverse-complemented query sequence, is also stored in the PTB, which is designed to becompact and contiguous to maximize the chance that it will be available in a fast memorycache. The second pass attempts to align all non-pin slots with abundance ≤2. Most of theindex data needed for this task is already present in the PTB, though some additional rows
Edgar (2020), PeerJ, DOI 10.7717/peerj.9338 6/22

may be required for slots with abundance two. If a high-scoring alignment is found in thesecond pass, the search terminates.
Third pass: high-abundance slot searchIn the rare case that no high scoring alignment is found in the first two passes, alignmentsare attempted for the remaining slots.
HSP constructionFollowing BLAST (Altschul et al., 1990) and many subsequent algorithms, URMAPconstructs ungapped alignments using a seed-and-extend strategy. The seed is an indexedslot found in the query, which implies an alignment of length k. The seed is extended intoflanking sequence using gapless x-drop alignment which stops if the score falls more thanx below the maximum so far observed (x is a heuristic parameter). If the score exceedsa threshold, the alignment is designated a high-scoring segment pair (HSP) and stored,otherwise the reference location is added to a list of failed extensions. The lists of HSPs andfailed locations are consulted before extending to prevent redundant attempts to align thesame reference location. If the HSP covers the entire query sequence, then the alignmentis considered successful.
Gapped alignmentsIn the human genome, indel variants are rare (Altshuler et al., 2010), and Illumina indelerrors are very rare (Schirmer et al., 2015), and therefore a large majority of correctalignments of human reads are expected to be gapless. Computing an ungapped alignment ismuch faster than a gapped alignment, and URMAP therefore constructs gapped alignmentsonly if no HSP covers the query. Gapped alignments are constructed by extending the topfew HSPs into semi-global alignments using a variant of the Viterbi algorithm (Viterbi,2006) where the alignment is constrained to include the HSP and the terminal regions arebanded, greatly reducing the number of dynamic programming matrix cells which mustbe computed. Here, semi-global means that the entire query sequence must be includedbut not the entire reference.
MAPQ calculationMAPQ is an integer value representing the estimated probability Perror that the referencecoordinate of the top-scoring alignment is wrong,
Perror = 10−MAPQ/10.Let T be the score of the first alignment in order of decreasing score, and S ≤ T be the
score of the second alignment. If only one alignment is found, S is set to T /2 as a priorestimate of the second-best score rather than zero because the URMAP search algorithmmay terminate early if a high-scoring alignment is found. The first alignment is likely tobe correct (Perror is small) if T �S, and conversely Perror is at least ∼0.5 if T ≈S (becauseif exactly two alignments X and Y have equal scores, there is a 1/2 chance that X is wrong;2/3 chance if there are three, and so on). Thus MAPQ should increase monotonically withT - S. Also, MAPQ should decrease monotonically with decreasing T because alignmentswith more differences are less likely to be correct. The best possible alignment score is the
Edgar (2020), PeerJ, DOI 10.7717/peerj.9338 7/22

query sequence length |Q| because identities contribute 1 to the score, and the ratio T /|Q|therefore ranges from one to zero as the top alignment score ranges from best possible toworst possible. This ratio is a natural choice to down-weight T - S, and a simple formulawith the desired properties is MAPQ = (T- S) T /|Q|. Empirically, using (T /|Q|)2 ratherthan T /|Q| was found to give a more accurate estimate, and URMAP therefore uses
MAPQ = (T - S) (T /|Q|)2.I am aware of no justification for this formula beyond its empirical success and the
intuitive considerations above. However, the simplicity of this formula and its lack oftuned parameters (except perhaps the power of T/ |Q|) suggest that this or a similar resultmay be derivable from more rigorous theoretical considerations.
URMAPv algorithmSome applications are more tolerant of mapping errors than variant calling, for examplenucleosome position inference in cell-free DNA (Snyder et al., 2016). With this in mind,I sought a set of parameters for URMAP giving faster execution time while maintaininguseful accuracy. Themost important speed optimization is reducing themaximum indexedslot abundance t from 32 to 3. Other optimizations include tweaks to heuristic parameterswhich trigger early termination of various search stages, such as the x in x-drop. Herethis algorithm is called URMAPv; it is invoked by the -veryfast command-line option. Inpractice, the execution time of URMAPv is often dominated by file i/o, and thus representsa point of diminishing returns in speed optimization for mapping.
Tested methodsThe following methods were tested: BWA v0.7.17-r1188, Bowtie2 v2.3.4.1, SNAPv1.0beta.24, FSVA GitHub commit 8cec132 (dated Jul 29, 2016), Minimap2 v2.17-r94,Hisat2 2.1.0 and URMAP v1.0.1300. This is a somewhat arbitrary selection from the manypublished methods designed include the most popular software (BWA and Bowtie2)together with potentially competitive recently-published methods. The beta version ofSNAP was used because the release binaries failed on some tests.
Urbench benchmarkI implemented a benchmark, Urbench, which models mapping of shotgun 2×150 Illuminareads, i.e., the current de facto standard, to the human reference genome. Variants andsequencing error were introduced based on experimental results rather than by simulatingPoisson distributions as in previous benchmarks.
Reference sequenceGenome Reference Consortium Human genome build 38 (GRCh38) (Church et al., 2011)was used as the reference sequence.
Variant genomeI chose to use NA12878, a well-studied human genome from the PlatinumGenomes project(Eberle et al., 2017). Simulated variants were selected from variants in NA12878 identifiedby barcoded long-molecule sequencing (Zhang et al., 2019). Many of these variants arephased, i.e., assigned to a parental chromosome, over regions of tens to hundreds of kb.
Edgar (2020), PeerJ, DOI 10.7717/peerj.9338 8/22

Unphased variants were randomly assigned to a parental chromosome.While these variantsmay be less reliable than consensus predictions derived from a range of methods, I believethat their distribution in the diploid genome is more realistic than a consensus becauselong-molecule sequencing enables phasing and alsomapping to repetitive sequence which isinaccessible to conventional short-read methods (see Unmappable Regions below). For theUrbench test, false positives and incorrectly phased variants in NA12878 are unimportantbecause a reference variant is present in the simulated genome regardless of whether it istruly present in NA12878, while failing to introduce variants in repetitive regions wouldresult in an unrealistically easy test.
Simulated read pairsTwo source genome sequences were used to simulate reads: the reference genome GRCh38and variant genome NA12878. Using the reference models a situation where the correctsequence for each read is identical to the reference (i.e., does not contain a variant), whichis probably the case for most reads in practice. For each genome, 1M loci were selected.For each locus, ten read pairs were simulated at random positions such that R1 or R2contained the locus (Fig. 2). This enables systematic errors to be identified, i.e., cases wherethe majority of reads for a given locus are assigned to the same incorrect reference segment.With NA12878, each locus was the position of a variant so that all simulated read pairscontains at least one variant. With GRCh38, loci were randomly selected positions.
Sequencing errorSimulated read sequences were combined with quality scores from run SRR9091899 inthe Sequence Read Archive (Leinonen, Sugawara & Shumway, 2011), which is a recent(submitted 2019) 2×150 Illumina shotgun dataset. At each base, a substitution error wasintroduced into the nucleotide sequence with the probability implied by its quality score.
Accuracy metricsPer-read sensitivity Sr is defined as the fraction of reads which are mapped to the correctcoordinate with high confidence as reported by the mapper. Following the BWA paper,high confidence was determined as MAPQ ≥10, corresponding to Perror ≤0.1. Per-readerror Er is defined as the fraction of reads with MAPQ ≥10 which are mapped to anincorrect position. Per-locus sensitivity Sl is defined as the fraction of loci where at leastthree reads have MAPQ ≥10 and the majority of these are mapped to the correct position.Per-locus error rate El is defined as the fraction of loci with at least three reads havingMAPQ ≥10 where the majority of these are mapped to the same incorrect position. El isinterpreted as assessing systematic errors that are more likely to be harmful to downstreamanalysis than randomly-distributed errors. These metrics are measured separately for readsof the reference (ref ) and of the variant genome (var) giving a total of eight accuracymetrics Srefr , Eref
r , Srefl , Erefl , Svarr , Evar
r Svarl and Evarl which are expressed as percentages.
Pairwise method comparisonTo enable a compact summary comparison of the eight accuracy metrics for a pair ofmethods X and Y, I defined the mean improvement of X over Y (MIXY ) as the mean of
Edgar (2020), PeerJ, DOI 10.7717/peerj.9338 9/22

Genome L
Reads L
L
L
L
Locus
L
Figure 2 Design of the Urbench benchmark. For each locus L in a source genome (NA12878 orGRCh38), ten simulated reads pairs are generated (five shown in figure) such that either R1 or R2 containsthe locus. This enables systematic errors to be identified where a majority of reads of a given locus aremapped to the same incorrect location. With NA12878 a locus is the position of an experimentallydetermined variant (SNP or indel) in one of the parental chromosomes, with GRCh38 a locus is arandomly-chosen position. Base call substitution errors are introduced with probabilities given by qualityscores in sequencing run SRR9091899.
Full-size DOI: 10.7717/peerj.9338/fig-2
SX - SY - EX + EY over the four combinations of genome (ref or var) and read or locus(r, l) and the improved metric count (IMXY ) of X vs. Y as the number out of the eightmetrics where X has a better value than Y (higher if sensitivity, lower if error rate). IfIMXY is 8, then all the metrics for X are better than Y, and X is unambiguously better thanY by the Urbench test, denoted X>>Y. Conversely if IMXY is zero then all metrics for Xare worse, MIXY is negative, and X is worse than Y, denoted X<<Y. If six out of eight Xmetrics are better; this is denoted by X>6Y, if five out of eight X metrics are worse, thisis written X<5Y. The magnitude of the improvement is indicated by MI and written inparentheses, e.g., X<<(-1.2)Y or X>6(4.0)Y. The total improvement (TIX ) of method Xover the other tested methods is calculated as the total of MI over pairwise comparisonswith other methods.
SpeedThe time required to map a given set of reads depends on the computer architecture (e.g.,the processor type, number of cores, and sizes and speeds of L1 and L2 memory caches)and overhead due to file input/output (i/o). Reads are typically provided in compressedFASTQ format (fastq.gz extension), which requires potentially expensive decompression,and output is typically written to large SAM (uncompressed) or BAM (compressed) files.The overhead of file i/o (including decompression and/or compression, if applicable) canbe substantial for the faster mappers and varies widely with the computing environment.With this in mind, I chose to measure speed using a method designed to isolate mappingby reducing i/o overhead as much as possible, as follows. 10M reads were selected atrandom from SRR9091899, giving a total of ∼2.4 GB compressed (∼6GB uncompressed)FASTQ data (∼1.2 GB 3Gb each for R1 and R2). These files are small enough to becached in memory by the operating system, which minimizes i/o time on a computer withsufficiently large RAM. Using a PC with a 16-core Intel i7-7820X CPU and 64 GB RAM(more than twice the size of the largest genome index), I ran each mapper three times insuccession using from 12 to 20 threads, first with uncompressed then compressed reads,
Edgar (2020), PeerJ, DOI 10.7717/peerj.9338 10/22

and selected the shortest time after subtracting the time required to load the genome index.Speed is expressed as a multiple of the shortest time for BWA, i.e., the speed of BWA is1.0 by definition. With this method, the measured relative speed of two mappers can beinterpreted as a limit on the ratio in practice which would be approached by the fastestpossible i/o.
Accuracy of MAPQThe accuracy of MAPQ was assessed as follows. For each integer value (q) of MAPQreported by a mapper, the total number of reads nq and number of incorrectly mappedreads nqerror were calculated, giving the measured error frequency f qerror = nqerror/nq and themeasured mapping quality at the reported quality q is then
qmeasured = −10 log10 (fqerror ).
If the MAPQ values are accurate, then qmeasured should be ∼q for all reported values ofq, which was assessed by constructing a scatterplot of qmeasured against q.
Wgsim validationFor comparison with previous work, I implemented a simulated dataset using wgsim v1.7with three reference genomes: Homo sapiens, Drosophila melanogaster and Arabidopsisthaliana using GenBank (Benson et al., 2013) assemblies GRCh38, GCA_004798075.2 andGCA_000835945.1 respectively. For each genome, 1M paired reads were simulated at eachof three different lengths: 150, 250 and 300 nt. Default parameters were used for wgsim: basecall error rate 0.02, mutation rate 0.001, indel fraction 0.15 and indel extension probability0.3. The random number seed was fixed using the -S 1 option to enable reproduction ofthe dataset. Accuracy was measured using the Sr and Er metrics as defined for Urbench.
Variant calling testTo validate that URMAP is compatible with variant calling, I implemented a test basedon Genome in a Bottle (GIAB) reference data (Krusche et al., 2019; Zook et al., 2014).I used 30× coverage 2×150 HiSeq reads of sample HG002 (Ashkenazim son, readsat ftp://ftp-trace.ncbi.nlm.nih.gov/giab/ftp/data/AshkenazimTrio/HG002_NA24385_son/NIST_HiSeq_HG002_Homogeneity-10953946/HG002_HiSeq300x_fastq/140528_D00360_0018_AH8VC6ADXX/Project_RM8391_RM8392 via Zook et al., 2016). Tocall variants, I used bcftools in samtools v1.7 and strelka2 v2.9.10 (Kim et al., 2018).Accuracy of variant calls was measured using the vcfeval command in rtg-tools v3.11(Cleary et al., 2015), which reports the following metrics: number of true positives (TPs),number of false positives (FPs), number of false negatives (FNs), precision, sensitivityand F-measure. Evaluation was restricted to the high-confidence regions defined inhttps://ftp-trace.ncbi.nlm.nih.gov/giab/ftp/release/AshkenazimTrio/HG002_NA24385_son/latest/GRCh38/HG002_GRCh38_GIAB_highconf_CG-Illfb-IllsentieonHC-Ion-10XsentieonHC-SOLIDgatkHC_CHROM1-22_v.3.3.2_highconf_noinconsistent.bed viaZook et al. (2016).
Unmappable regionsI used the following procedure to identify and characterize regions in GRCh38 whichcannot be mapped by conventional paired-read sequencing. Paired reads of GRCh38 were
Edgar (2020), PeerJ, DOI 10.7717/peerj.9338 11/22

simulated at 10× coverage with no variants or sequencing error, representing a best-casescenario for mapping. For a given mapper, read length L and MAPQ threshold Q, a base inGRCh38 was considered mappable if at least one read with MAPQ ≥Q covered the base,otherwise the base was designated unmappable. Unmappable regions were identified ascontiguous segments of unmappable bases of length≥L containing <10 uncalled bases (i.e.,Ns or other wildcard letters) per window of length L. The consensus of two ormoremapperswas obtained by intersecting their unmappable regions using bedtools v2.26 (Quinlan &Hall, 2010). Unmappable regions were intersected with the GIAB high-confidence regionsin HG002 and the following repeat annotation tracks in the UCSC human genome browser(Kent et al., 2002): genomicSuperDups, repeatMasker and simpleRepeats.
RESULTSSpeed and mapping accuracy on UrbenchSpeed and accuracy onUrbench are shown in Figs. 3, 4 and 5 (underlying values reported inSupplementary Tables 1 and 2). As with most benchmarks in biological sequence analysis,results should be interpreted with caution because of the limitations of simulated data andthe many somewhat arbitrary decisions that must be made in designing the benchmark andits performance metrics; other defensible designs would no doubt give somewhat differentmethod rankings and numerical values for sensitivity and error rates. With these caveatsin mind, some general trends can be observed. URMAP and URMAPv are the fastestmethods, with URMAP ∼10× faster than BWA and Bowtie and URMAPv ∼28× faster,noting that in practice the speed improvement may be less due to file i/o overhead. Hisat2(∼9×) and SNAP (∼8×) have similar speed to URMAP. All methods were faster withuncompressed FASTQ, showing that the added time for decompression exceeds the timesaved by reading smaller files. Four methods, BWA, URMAP, SNAP and Bowtie2, standout as more accurate than the others (Minimap2, Hisat2, URMAPv and FSVA) because allmethods from the first group have at least 6 better metrics (shown as >6, >7 or >>in Fig. 5)with a positive mean improvement compared to all methods in the second group with theexception of SNAP >5(3.4) URMAPv. The four top methods (BWA, URMAP, SNAP andBowtie2) have similar accuracy, with no method having more than 6 out of 8 better (hence3 or 4 worse) accuracy metrics than another, and all pairwise comparisons exhibit onlysmall mean improvements ranging from BWA >5(0.5) URMAP to BWA >5(2.0) Bowtie2.Thus, the accuracy differences between BWA, URMAP, SNAP and Bowtie2 are small andambiguous, and I believe these differences are unlikely to be consequential in practice formost applications.
MAPQ accuracy on UrbenchFigure 6 is a scatterplot of reported vs. measured MAPQ on Urbench. Hisat2 is not shownbecause it generated only three distinct MAPQ values: MAPQ = 0 (measured MAPQ =1.8), MAPQ = 1 (measured 2.0) and MAPQ = 60 (measured 18). Bowtie2 and URMAPare close to the diagonal, showing reasonably good estimates of MAPQ though Bowtie2tends to underestimate and URMAP tends to overestimate. The other tested methods have
Edgar (2020), PeerJ, DOI 10.7717/peerj.9338 12/22

0
5
10
15
20
25
30
Figure 3 Speed on Urbench. Speed is measured relative to BWA with file i/o overhead minimized.Full-size DOI: 10.7717/peerj.9338/fig-3
Bowtie2 BWA FSVA Hisat2
Minimap2 SNAP URMAP URMAPv
80%Sen
sitiv
ity
90%
100%
0%
Error rate
2%
4%
80%Sen
sitiv
ity
90%
100%
0%
Error rate
2%
4%
Variants per read
Variants per locus
Reference per read
Reference per locus
Figure 4 Mapping accuracy on Urbench. Accuracy metrics are sensitivity and error rate with MAPQ≥10, expressed as percentages.
Full-size DOI: 10.7717/peerj.9338/fig-4
much stronger tendencies to overestimate. For example, with MAPQ = 50, the measuredMAPQ for BWA is 15.7 and the measured MAPQ for SNAP is 5.6.
Edgar (2020), PeerJ, DOI 10.7717/peerj.9338 13/22

TI BWA URMAP SNAP Bowtie2 Minimap2 Hisat2 URMAPv FSVA
BWA 18.9 >5(0.5) >6(0.6) >5(2.0) >6(3.4) >>(3.5) >6(4.0) >>(5.0)
URMAP 14.9 <5(-0.5) >4(0.1) >4(1.5) >6(2.9) >7(3.0) >>(3.5) >>(4.4)
SNAP 14.3 <6(-0.6) <4(-0.1) =4(1.4) >5(2.8) >>(3.0) >5(3.4) >>(4.4)
Bowtie2 3.0 <5(-2.0) <4(-1.5) =4(-1.4) >7(1.4) >6(1.5) >>(2.0) >7(3.0)
Minimap2 -8.1 <6(-3.4) <6(-2.9) <5(-2.8) <7(-1.4) >6(0.2) >6(0.6) >5(1.6)
Hisat2 -9.3 <<(-3.5) <7(-3.0) <<(-3.0) <6(-1.5) <6(-0.2) <5(0.5) >6(1.4)
URMAPv -13.2 <6(-4.0) <<(-3.5) <5(-3.4) <<(-2.0) <6(-0.6) >5(-0.5) >5(0.9)
FSVA -20.7 <<(-5.0) <<(-4.4) <<(-4.4) <7(-3.0) <5(-1.6) <6(-1.4) <5(-0.9)
Figure 5 Pair-wise method comparisons on Urbench.Methods are sorted by decreasing total improve-ment (TI) (see Methods). Cells are colored according to mean improvement. A pairwise comparison ofthe method in row X vs. the method in column Y is given using the notation described in Methods; e.g.,BWA >5(2.0) Bowtie2 means that BWA has five of eight metrics that are better than Bowtie2 with a meanimprovement of 2.0. The symbols >> and << indicate that all metrics are better or worse, respectively,e.g., URMAP >>(4.4) FSVA means that URMAP is better than FSVA by all metrics with a mean improve-ment of 4.4.
Full-size DOI: 10.7717/peerj.9338/fig-5
Table 1 Accuracy on GIAB variant calling test. Accuracy metrics according to the rtg vcfeval commandwhen variants are called by strelka2 (top) and bcfeval (bottom). Bowtie2 + strelka2 exhibits anomalouslypoor performance. FSVA failed with a segfault on this test.
+Strelka2 TP FP FN Precision Sensitivity F-measure
Bowtie2 2.081M 0.052M 1.425M 0.975 0.594 0.738BWA 3.475M 0.012M 0.031M 0.997 0.991 0.994Hisat2 3.421M 0.017M 0.084M 0.995 0.976 0.985Minimap2 3.454M 0.011M 0.052M 0.997 0.985 0.991SNAP 3.466M 0.012M 0.040M 0.997 0.989 0.993URMAP 3.442M 0.008M 0.064M 0.998 0.982 0.990URMAPv 3.339M 0.001M 0.167M 0.997 0.953 0.974
+Bcftools TP FP FN Precision Sensitivity F-measure
Bowtie2 2.840M 0.191M 0.665M 0.937 0.810 0.869BWA 3.306M 0.103M 0.199M 0.970 0.943 0.956Hisat2 3.229M 0.084M 0.277M 0.975 0.921 0.947Minimap2 3.286M 0.076M 0.219M 0.977 0.938 0.957SNAP 3.271M 0.098M 0.234M 0.971 0.933 0.952URMAP 3.334M 0.098M 0.172M 0.972 0.951 0.961URMAPv 3.21M 0.080M 0.381M 0.800 0.894 0.844
Mapping accuracy on wgsim testFigure 7 shows accuracy results on the wgsim test (underlying values in Table S1). Mostmethods exhibit similar or improved accuracy as read length (L) increases, with theexception of Hisat2 which has substantially lower sensitivity at L= 250 and L= 300.
Edgar (2020), PeerJ, DOI 10.7717/peerj.9338 14/22
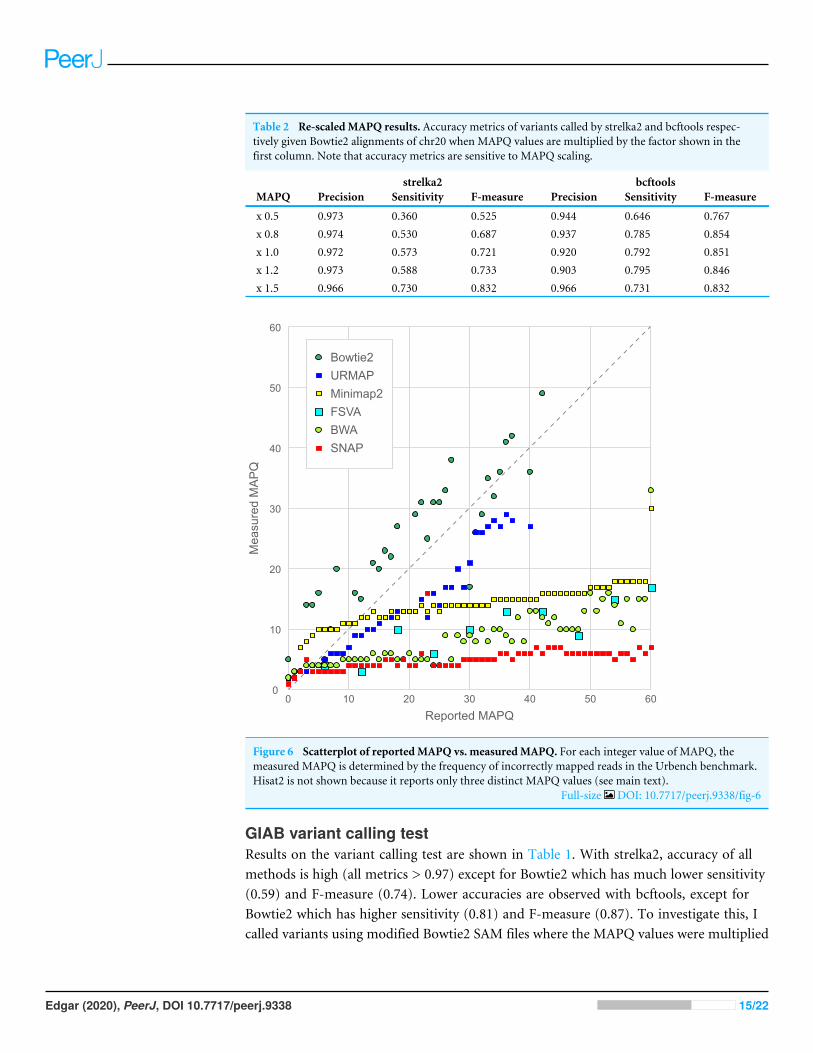
Table 2 Re-scaledMAPQ results. Accuracy metrics of variants called by strelka2 and bcftools respec-tively given Bowtie2 alignments of chr20 when MAPQ values are multiplied by the factor shown in thefirst column. Note that accuracy metrics are sensitive to MAPQ scaling.
strelka2 bcftoolsMAPQ Precision Sensitivity F-measure Precision Sensitivity F-measure
x 0.5 0.973 0.360 0.525 0.944 0.646 0.767x 0.8 0.974 0.530 0.687 0.937 0.785 0.854x 1.0 0.972 0.573 0.721 0.920 0.792 0.851x 1.2 0.973 0.588 0.733 0.903 0.795 0.846x 1.5 0.966 0.730 0.832 0.966 0.731 0.832
0 10 20 30 40 50 600
10
20
30
40
50
60
Reported MAPQ
Mea
sure
d M
AP
Q
Bowtie2
URMAP
Minimap2
FSVA
BWA
SNAP
Figure 6 Scatterplot of reportedMAPQ vs. measuredMAPQ. For each integer value of MAPQ, themeasured MAPQ is determined by the frequency of incorrectly mapped reads in the Urbench benchmark.Hisat2 is not shown because it reports only three distinct MAPQ values (see main text).
Full-size DOI: 10.7717/peerj.9338/fig-6
GIAB variant calling testResults on the variant calling test are shown in Table 1. With strelka2, accuracy of allmethods is high (all metrics > 0.97) except for Bowtie2 which has much lower sensitivity(0.59) and F-measure (0.74). Lower accuracies are observed with bcftools, except forBowtie2 which has higher sensitivity (0.81) and F-measure (0.87). To investigate this, Icalled variants using modified Bowtie2 SAM files where the MAPQ values were multiplied
Edgar (2020), PeerJ, DOI 10.7717/peerj.9338 15/22

(A) Length 150
80%Sen
sitiv
ity
90%
100%
0%E
rror rate
1%
2%
(B) Length 250
80%Sen
sitiv
ity
90%
100%
0%
Error rate
1%
2%
(C) Length 300
80%Sen
sitiv
ity
90%
100%
0%
Error rate
1%
2%
Bowtie2 BWA FSVA Hisat2 Minimap2 SNAP URMAP
Bowtie2 BWA FSVA Hisat2 Minimap2 SNAP URMAP
Bowtie2 BWA FSVA Hisat2 Minimap2 SNAP URMAP
Arabidopsis Drosophila Homo
Figure 7 Mapping accuracy on wgsim test. Accuracy metrics are sensitivity and error rate with MAPQ≥10, expressed as percentages. Tests were performed with three simulated read lengths: (A) 150, (B) 250and (C) 300, respectively.
Full-size DOI: 10.7717/peerj.9338/fig-7
by constant factors 0.5, 0.8, 1.0, 1.2 and 1.5, respectively. To reduce computational cost, Iused only SAM records for chr20. Results are shown in Table 2, which show strong variationwith the MAPQ scaling factor especially with strelka2. The number of reads mapped byeach method on the GIAB test is given in Table S4.
Unmappable regionsI measured unmappable regions with read length L= 150 to determine a consensus ofBWA, Bowtie2 and URMAP. The MAPQ threshold was set to 3 (error probability ≥0.5),which presumably would be considered not reliably mapped in a downstream analysis.As shown in Fig. 8, there is high agreement between the three mappers. A total of 51Mbases are not mappable by at least one mapper; 97% of which (49.6M bases, collectivelydesignated UnmapQ3) are not mappable by any of these mappers. With MAPQ ≤10,the consensus increases by only a small amount to 50.8M bases and with MAPQ ≤1(error probability ≥ 0.8) the consensus decreases marginally to 49.5M. These resultsshow that identification of unmappable regions is robust against choices of mapper andMAPQ threshold. Intersecting UnmapQ3 with UCSC browser tracks gave the followingnumbers of bases: genomicSuperDup (high-identity long segmental duplications) 20.M,repeatMasker 36.9M, simpleRepeats 25.8M and all three tracks combined 47.7M. Thus,
Edgar (2020), PeerJ, DOI 10.7717/peerj.9338 16/22

BWA URMAP
Bowtie2
49.6M
99.7k
865k388k
542k 541k
3.47M
Figure 8 Mapper agreement on unmappable regions in the human reference genome.Venn diagramshowing agreement of BWA, Bowtie2 and URMAP on unmappable regions with 2×150 reads of GRCh38with MAPQ ≤3. These mappers agree that 49.6M bases (intersection of the three regions) are not map-pable.
Full-size DOI: 10.7717/peerj.9338/fig-8
as might be expected, unmappable regions are mostly comprised of well-known repeats.There are 747 high-confidence GIAB HG002 variants in UnmapQ3, corresponding to afrequency of 1.5×10⁻⁵ variants per base, or equivalently one variant every 66kb on averagewhen the diploid genome is mapped onto the reference. By contrast, the frequency in therest of the genome (i.e., regions which are mappable by 2×150 reads) is 0.0015 or onevariant every 650 bases.
DISCUSSIONGIAB variant call accuracy as a benchmark of mapping accuracyTables 1 and 2 show that the accuracy of variant calls on a GIAB with a single variantcaller is not a robust test of mapping accuracy. The accuracy of a variant calling pipelinevaries with the choice of caller in addition to the mapper, as might be expected, andalso that there are dependencies between the variant caller and mapper such a givenpair may have low accuracy together (e.g., Bowtie2 + strelka2) while each has higheraccuracy in a different pipeline (e.g., Bowtie2 + bcftools and BWA + strelka2). With bothstrelka2 and bcftools, accuracy with Bowtie2 is substantially lower than the other testedmethods, which is inconsistent with the good performance of Bowtie2 on Urbench and thewgsim test. Bowtie2 differs from all other tested methods by over-estimating rather thanunderestimating MAPQ (Fig. 6), suggesting that variant callers, especially strelka2, may besensitive to MAPQ bias.
Edgar (2020), PeerJ, DOI 10.7717/peerj.9338 17/22

GIAB bias against regions which are challenging to mappersThe density of reference variants in unmappable regions is 100× lower than the genomeaverage, showing that the GIAB high-confidence variants are strongly biased againstrepetitive regions which have ambiguous alignments to conventional 2×150 reads. TheGIAB high-confidence regions for HG002 cover 2.5 Gb, i.e., exclude 27% of the genome,suggesting that theremay be extensive bias against repetitive regions which aremappable bythe conservative definition used here but nevertheless challenging for short-read mapping.
Number of aligned reads as a test of mapping accuracyIf mappers are compared by the number of aligner reads, a larger number does notnecessarily indicate better performance because there could be more errors. In practice,there is usually little difference between a read which is not mapped and a read which ismapped with very low MAPQ, e.g., MAPQ = 0 corresponds to Perror=1 and MAPQ = 1 toPerror = 0.8, so alignments withMAPQ≤1 should be ignored bymost downstream analysis.Alignments with higher MAPQ are more relevant, but mappers have widely varyingMAPQbiases (Fig. 6) such that MAPQ values and thresholds are not directly comparable betweendifferent mappers.
CONCLUSIONSURMAP is an order of magnitude faster than BWA while achieving comparable accuracy.A speed-optimized variant of the algorithm is >25× faster than BWA with accuracy thatis slightly lower but nevertheless likely to be useful in applications where the best possibleaccuracy is not required and/or computational cost is a limiting factor. On a GIAB variantcalling test with 30× coverage 2×150 reads, URMAP achieves high accuracy (precision0.998, sensitivity 0.982 and F-measure 0.990) with the strelka2 caller. However, GIABreference variants are shown to be biased against repetitive regions which are difficult tomap and may therefore pose an unrealistically easy challenge to read mappers and variantcallers.
ADDITIONAL INFORMATION AND DECLARATIONS
FundingThe author received no funding for this work.
Competing InterestsThe author declares that he receives income from the sale of scientific software through hispersonal web site at https://drive5.com.
Author Contributions• Robert Edgar conceived and designed the experiments, performed the experiments,analyzed the data, prepared figures and/or tables, authored or reviewed drafts of thepaper, and approved the final draft.
Edgar (2020), PeerJ, DOI 10.7717/peerj.9338 18/22

Data AvailabilityThe following information was supplied regarding data availability:
Source code is available at https://github.com/rcedgar/urmap/.Benchmark data are available at OSF: Edgar, R. (2020). ’’Urbench’’. OSF. Dataset.
https://osf.io/th4qv/.
Supplemental InformationSupplemental information for this article can be found online at http://dx.doi.org/10.7717/peerj.9338#supplemental-information.
REFERENCESAltschul SF, GishW,MillerW,Myers EW, Lipman DJ. 1990. Basic local alignment
search tool. Journal of Molecular Biology 215:403–410DOI 10.1016/S0022-2836(05)80360-2.
Altshuler DL, Durbin RM, Abecasis GR, Bentley DR, Chakravarti A, Clark AG, CollinsFS, De La Vega FM, Donnelly P, EgholmM, Flicek P, Gabriel SB, Gibbs RA,Knoppers BM, Lander ES, Lehrach H, Mardis ER, McVean GA, Nickerson DA,Peltonen L, Schafer AJ, Sherry ST,Wang J, Wilson RK, Deiros D, Metzker M,Muzny D, Reid J, Wheeler D,Wang SJ, Li J, JianM, Li G, Li R, Liang H, Tian G,Wang B,Wang J, WangW, Yang H, Zhang X, Zheng H, Ambrogio L, Bloom T,Cibulskis K, Fennell TJ, Jaffe DB, Shefler E, Sougnez CL, Bentley IDR, GormleyN, Humphray S, Kingsbury Z, Koko-Gonzales P, Stone J, McKernan KJ, Costa GL,Ichikawa JK, Lee CC, Sudbrak R, Borodina TA, Dahl A, Davydov AN, MarquardtP, Mertes F, NietfeldW, Rosenstiel P, Schreiber S, Soldatov AV, Timmermann B,TolzmannM, Affourtit J, Ashworth D, Attiya S, Bachorski M, Buglione E, BurkeA, Caprio A, Celone C, Clark S, Conners D, Desany B, Gu L, Guccione L, Kao K,Kebbel A, Knowlton J, LabrecqueM,McDade L, Mealmaker C, MindermanM,Nawrocki A, Niazi F, Pareja K, Ramenani R, Riches D, SongW, Turcotte C,WangS, Dooling D, Fulton L, Fulton R,Weinstock G, Burton J, Carter DM, Churcher C,Coffey A, Cox A, Palotie A, Quail M, Skelly T, Stalker J, SwerdlowHP, Turner D,DeWitte A, Giles S, Bainbridge M, Challis D, Sabo A, Yu F, Yu J, Fang X, Guo X, LiY, Luo R, Tai S, WuH, Zheng H, Zheng X, Zhou Y, Marth GT, Garrison EP, HuangW, Indap A, Kural D, LeeWP, LeongWF, Quinlan AR, Stewart C, StrombergMP,Ward AN,Wu J, Lee C, Mills RE, Shi X, Daly MJ, DePristo MA, Ball AD,Banks E, Browning BL, Garimella KV, Grossman SR, Handsaker RE, HannaM,Hartl C, Kernytsky AM, Korn JM, Li H, Maguire JR, McKenna A, Nemesh JC,Philippakis AA, Poplin RE, Price A, Rivas MA, Sabeti PC, Schaffner SF, ShlyakhterIA, Cooper DN, Ball EV, Mort M, Phillips AD, Stenson PD, Sebat J, Makarov V, YeK, Yoon SC, Bustamante CD, Boyko A, Degenhardt J, Gravel S, Gutenkunst RN,KaganovichM, Keinan A, Lacroute P, Ma X, Reynolds A, Clarke L, CunninghamF, Herrero J, Keenen S, Kulesha E, Leinonen R, McLarenWM, Radhakrishnan R,Smith RE, Zalunin V, Korbel JO, Stütz AM, Humphray IS , et al. 2010. A map of
Edgar (2020), PeerJ, DOI 10.7717/peerj.9338 19/22
human genome variation from population-scale sequencing. Nature 467:1061–1073DOI 10.1038/nature09534.
Benson DA, CavanaughM, Clark K, Karsch-Mizrachi I, Lipman DJ, Ostell J, SayersEW. 2013. GenBank. Nucleic Acids Research 41.
BurrowsM,Wheeler D. 1994. A block-sorting lossless data compression algorithm.Technical report 124, Palo Alto, CA, Digital Equipment Corporation.
Church DM, Schneider VA, Graves T, Auger K, Cunningham F, Bouk N, Chen HC,Agarwala R, McLarenWM, Ritchie GRS, Albracht D, Kremitzki M, Rock S,Kotkiewicz H, Kremitzki C,Wollam A, Trani L, Fulton L, Fulton R, MatthewsL,Whitehead S, ChowW, Torrance J, DunnM, Harden G, Threadgold G,WoodJ, Collins J, Heath P, Griffiths G, Pelan S, GrafhamD, Eichler EE,Weinstock G,Mardis ER,Wilson RK, Howe K, Flicek P, Hubbard T. 2011.Modernizing referencegenome assemblies. PLOS Biology 9:e1001091 DOI 10.1371/journal.pbio.1001091.
Cleary JG, Braithwaite R, Gaastra K, Hilbush BS, Inglis S, Irvine SA, Jackson A, LittinR, RathodM,Ware D, Zook JM, Trigg L, DeLaVega FMM. 2015. Comparing variantcall files for performance benchmarking of next-generation sequencing variantcalling pipelines.
Eberle MA, Fritzilas E, Krusche P, Källberg M, Moore BL, BekritskyMA, Iqbal Z,Chuang HY, Humphray SJ, Halpern AL, Kruglyak S, Margulies EH, McVeanG, Bentley DR. 2017. A reference data set of 5.4 million phased human variantsvalidated by genetic inheritance from sequencing a three-generation 17-memberpedigree. Genome Research 27:157–164 DOI 10.1101/gr.210500.116.
Gilbert JA, Dupont CL. 2011.Microbial metagenomics: beyond the genome. AnnualReview of Marine Science 3:347–371 DOI 10.1146/annurev-marine-120709-142811.
KentWJ, Sugnet CW, Furey TS, Roskin KM, Pringle TH, Zahler AM, Haussler a. D.2002. The human genome browser at UCSC. Genome Research 12:996–1006DOI 10.1101/gr.229102.
KimD, Paggi JM, Park C, Bennett C, Salzberg SL. 2019. Graph-based genome align-ment and genotyping with HISAT2 and HISAT-genotype. Nature Biotechnology37:907–915 DOI 10.1038/s41587-019-0201-4.
Kim S, Scheffler K, Halpern AL, BekritskyMA, Noh E, Källberg M, Chen X,Kim Y, Beyter D, Krusche P, Saunders CT. 2018. Strelka2: fast and accu-rate calling of germline and somatic variants. Nature Methods 15:591–594DOI 10.1038/s41592-018-0051-x.
Krusche P, Trigg L, Boutros PC, Mason CE, De La Vega FM,Moore BL, Gonzalez-Porta M, Eberle MA, Tezak Z, Lababidi S, Truty R, Asimenos G, Funke B, Fle-harty M, Chapman BA, Salit M, Zook JM. 2019. Best practices for benchmarkinggermline small-variant calls in human genomes. Nature Biotechnology 37:555–560DOI 10.1038/s41587-019-0054-x.
Langmead B, Salzberg SL. 2012. Fast gapped-read alignment with Bowtie 2. NatureMethods 9:357–359 DOI 10.1038/nmeth.1923.
Edgar (2020), PeerJ, DOI 10.7717/peerj.9338 20/22
Langmead B, Trapnell C, PopM, Salzberg SL. 2009. Ultrafast and memory-efficientalignment of short DNA sequences to the human genome. Genome Biology10:357–359.
Leinonen R, Sugawara H, ShumwayM. 2011. The sequence read archive. Nucleic AcidsResearch 39(suppl_1):D19–D21.
Li H. 2018.Minimap2: pairwise alignment for nucleotide sequences. Bioinformatics34:3094–3100 DOI 10.1093/bioinformatics/bty191.
Li H, Durbin R. 2009. Fast and accurate short read alignment with Burrows-Wheelertransform. Bioinformatics 25:1754–1760 DOI 10.1093/bioinformatics/btp324.
Li H, Handsaker B,Wysoker A, Fennell T, Ruan J, Homer N, Marth G, Abecasis G,Durbin R. 2009a. The sequence alignment/map format and SAMtools. Bioinformat-ics 25:2078–2079 DOI 10.1093/bioinformatics/btp352.
Li R, Li Y, Kristiansen K,Wang J. 2008. SOAP: short oligonucleotide alignmentprogram. Bioinformatics 24:713–714 DOI 10.1093/bioinformatics/btn025.
Li R, Yu C, Li Y, Lam TW, Yiu SM, Kristiansen K,Wang J. 2009b. SOAP2: an im-proved ultrafast tool for short read alignment. Bioinformatics 25:1966–1967DOI 10.1093/bioinformatics/btp336.
Liu S, Wang Y,Wang F. 2016. A fast read alignment method based on seed-and-vote for next generation sequencing. BMC Bioinformatics 17:Article 466DOI 10.1186/s12859-016-1329-6.
Minoche AE, Dohm JC, Himmelbauer H. 2011. Evaluation of genomic high-throughputsequencing data generated on Illumina HiSeq and genome analyzer systems. GenomeBiology 12:Article R112 DOI 10.1186/gb-2011-12-11-r112.
Montgomery SB, Goode DL, Kvikstad E, Albers CA, Zhang ZD, Mu XJ, Ananda G,Howie B, Karczewski KJ, Smith KS, Anaya V, Richardson R, Davis J, MacArthurDG, Sidow A, Duret L, Gerstein M,Makova KD, Marchini J, McVean G,Lunter G. 2013. The origin, evolution, and functional impact of short insertion-deletion variants identified in 179 human genomes. Genome Research 23:749–761DOI 10.1101/gr.148718.112.
Morozova O, Marra MA. 2008. Applications of next-generation sequencing technologiesin functional genomics. Genomics 92:255–264 DOI 10.1016/j.ygeno.2008.07.001.
Ning Z, Cox AJ, Mullikin JC. 2001. SSAHA: a fast search method for large DNAdatabases. Genome Research 11:1725–1729 DOI 10.1101/gr.194201.
Quinlan AR, Hall IM. 2010. BEDTools: a flexible suite of utilities for comparing genomicfeatures. Bioinformatics 26:841–842 DOI 10.1093/bioinformatics/btq033.
SchirmerM, Ijaz UZ, D’Amore R, Hall N, SloanWT, Quince C. 2015. Insight into biasesand sequencing errors for amplicon sequencing with the Illumina MiSeq platform.Nucleic Acids Research 43(6):e37-e37.
Snyder MW, Kircher M, Hill AJ, Daza RM, Shendure J. 2016. Cell-free DNA comprisesan in vivo nucleosome footprint that informs its tissues-of-origin. Cell 164:57–68DOI 10.1016/j.cell.2015.11.050.
Viterbi AJ. 2006. A personal history of the Viterbi algorithm. IEEE Signal ProcessingMagazine 23(4):120–142.
Edgar (2020), PeerJ, DOI 10.7717/peerj.9338 21/22

Zaharia M, BoloskyWJ, Curtis K, Fox A, Patterson D, Shenker S, Stoica I, Karp RM,Sittler T. 2011. Faster and more accurate sequence alignment with SNAP. ArXivpreprint. arXiv:1111.5572.
Zhang L, Zhou X,Weng Z, Sidow A. 2019. Assessment of human diploid genomeassembly with 10x Linked-Reads data. Gigascience 8:Article giz141DOI 10.1093/gigascience/giz141.
Zook JM, Chapman B,Wang J, Mittelman D, Hofmann O, HideW, Salit M. 2014.Integrating human sequence data sets provides a resource of benchmark SNP andindel genotype calls. Nature Biotechnology 32:246–251 DOI 10.1038/nbt.2835.
Zook JM, Catoe D, McDaniel J, Vang L, Spies N, Sidow A,Weng Z, Liu Y, MasonCE, Alexander N, Henaff E, McIntyre ABR, Chandramohan D, Chen F, JaegerE, Moshrefi A, Pham K, StedmanW, Liang T, Saghbini M, Dzakula Z, Hastie A,Cao H, Deikus G, Schadt E, Sebra R, Bashir A, Truty RM, Chang CC, GulbahceN, Zhao K, Ghosh S, Hyland F, Fu Y, ChaissonM, Xiao C, Trow J, Sherry ST,Zaranek AW, Ball M, Bobe J, Estep P, Church GM,Marks P, Kyriazopoulou-Panagiotopoulou S, Zheng GXY, Schnall-LevinM, Ordonez HS, Mudivarti PA,Giorda K, Sheng Y, Rypdal KB, Salit M. 2016. Extensive sequencing of seven humangenomes to characterize benchmark reference materials. Scientific Data 3:160025DOI 10.1038/sdata.2016.25.
Edgar (2020), PeerJ, DOI 10.7717/peerj.9338 22/22