urinary system - warner pacific collegeclasspages.warnerpacific.edu/bdupriest/bio 420/unit 6...
TRANSCRIPT
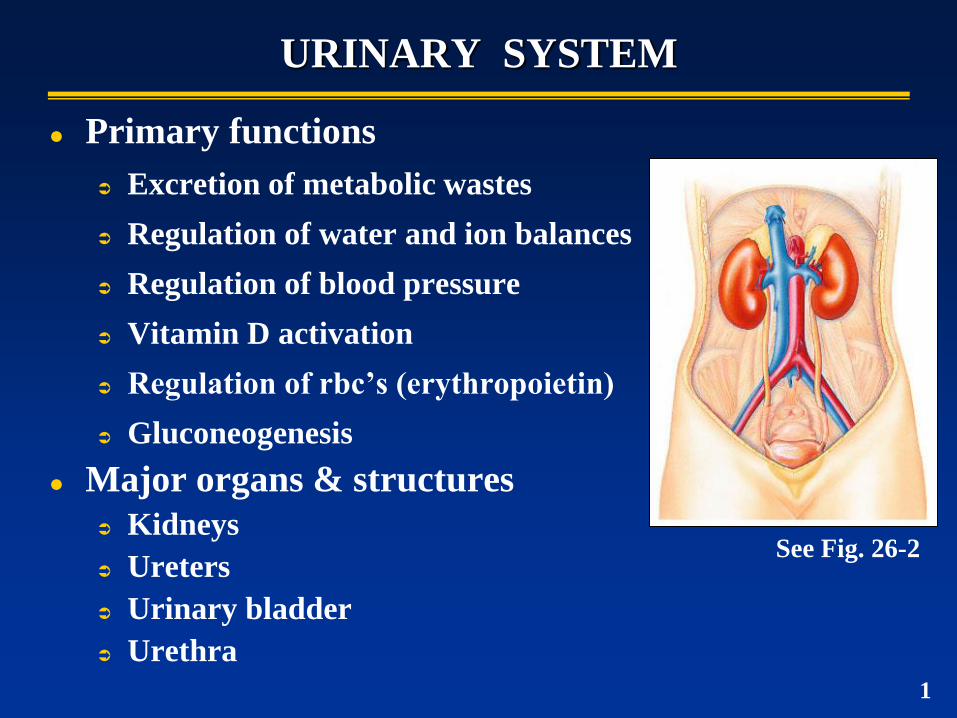
URINARY SYSTEM
Primary functions
Excretion of metabolic wastes
Regulation of water and ion balances
Regulation of blood pressure
Vitamin D activation
Regulation of rbc’s (erythropoietin)
Gluconeogenesis
Major organs & structures
Kidneys
Ureters
Urinary bladder
Urethra
See Fig. 26-2
1
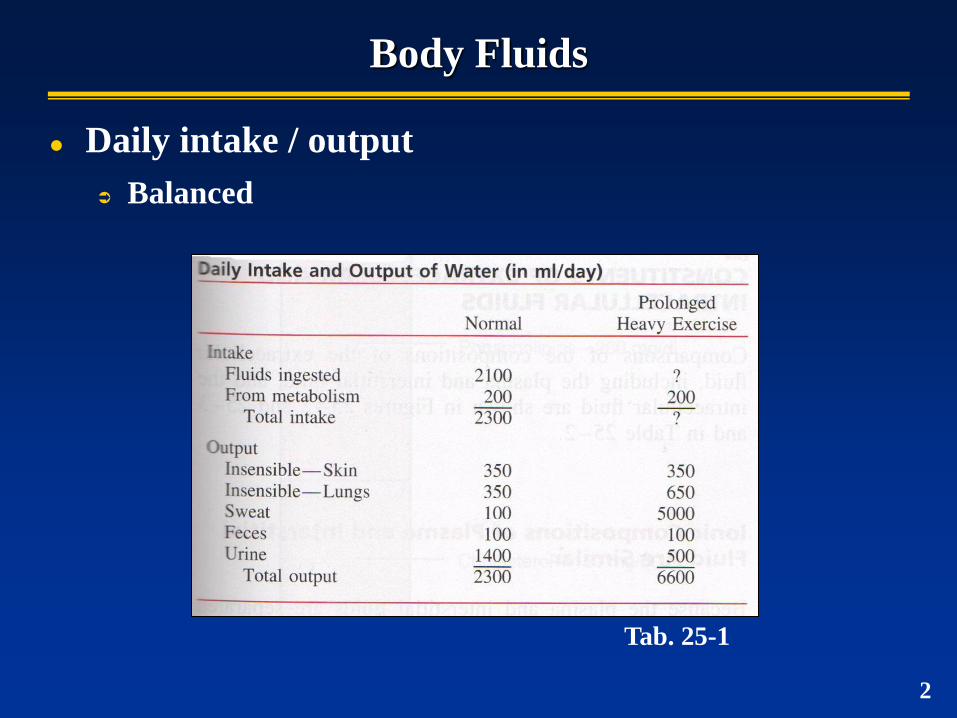
Body Fluids
Daily intake / output
Balanced
Tab. 25-1
2
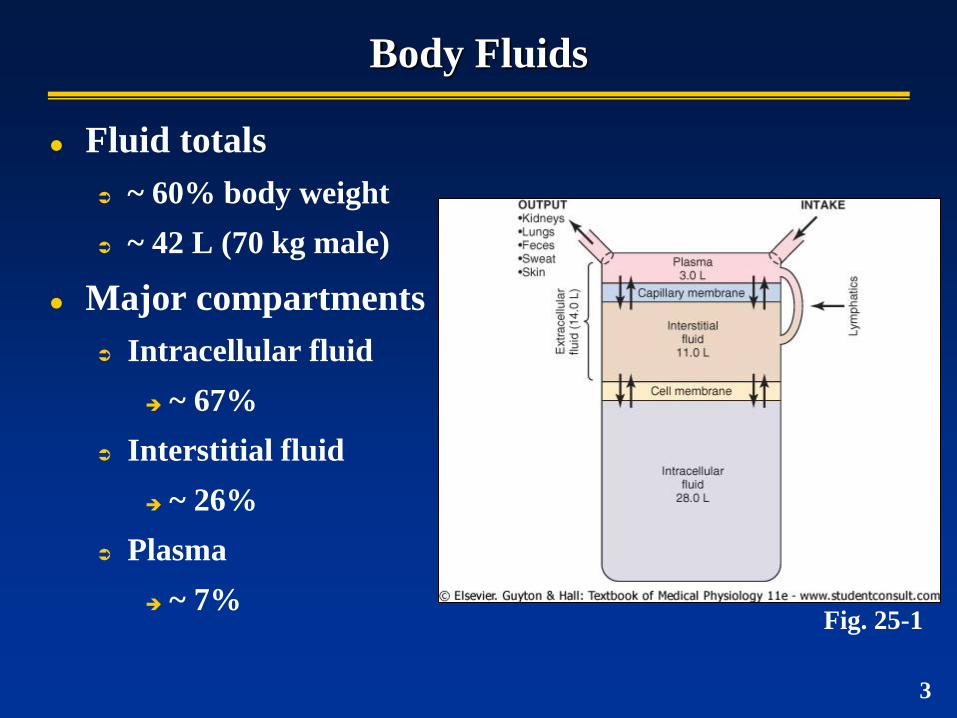
Body Fluids
Fluid totals
~ 60% body weight
~ 42 L (70 kg male)
Major compartments
Intracellular fluid
~ 67%
Interstitial fluid
~ 26%
Plasma
~ 7% Fig. 25-1
3
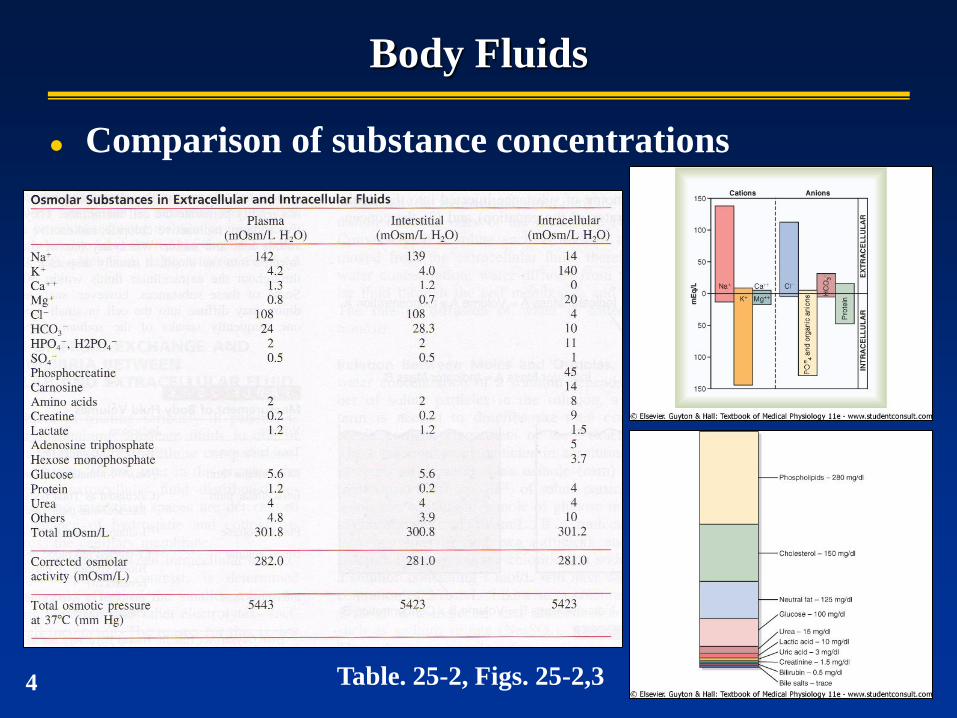
Body Fluids
Comparison of substance concentrations
Table. 25-2, Figs. 25-2,3 4
Osmosis & Osmotic Equilibrium
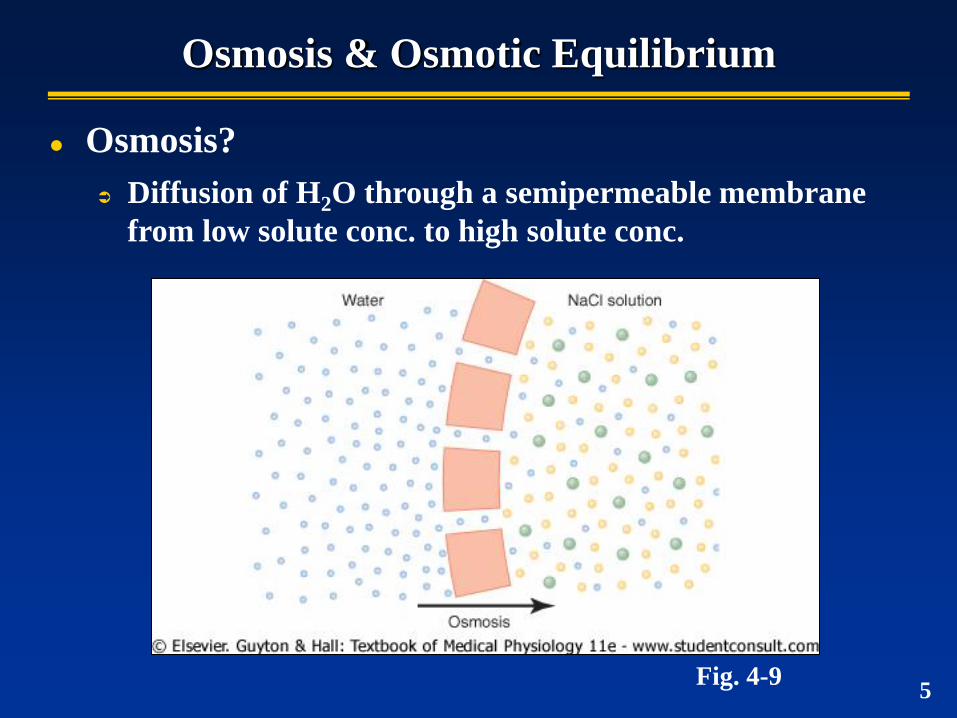
Osmosis?
Diffusion of H2O through a semipermeable membrane
from low solute conc. to high solute conc.
Fig. 4-9 5
Osmosis & Osmotic Equilibrium
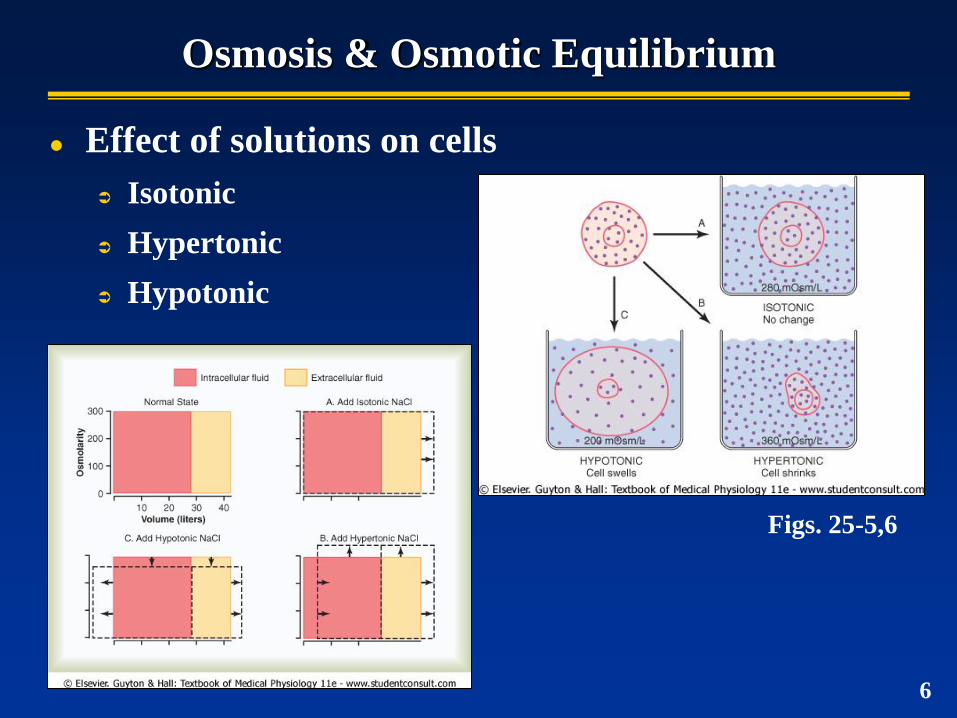
Effect of solutions on cells
Isotonic
Hypertonic
Hypotonic
Figs. 25-5,6
6
Osmosis & Osmotic Equilibrium
Osmoles
Describes total number of solute particles in solution (regardless of composition)
1 osm = 1 mole (6.02x10²³) of solute particles
Typically expressed a milliosmoles (mOsm)
1 osm = 1000 mOsm
Osmolarity
Osmolar concentration of solution = osm/L solution
Osmolality
Osmolal concentration of solution = osm/kg H20
7
Osmosis & Osmotic Equilibrium
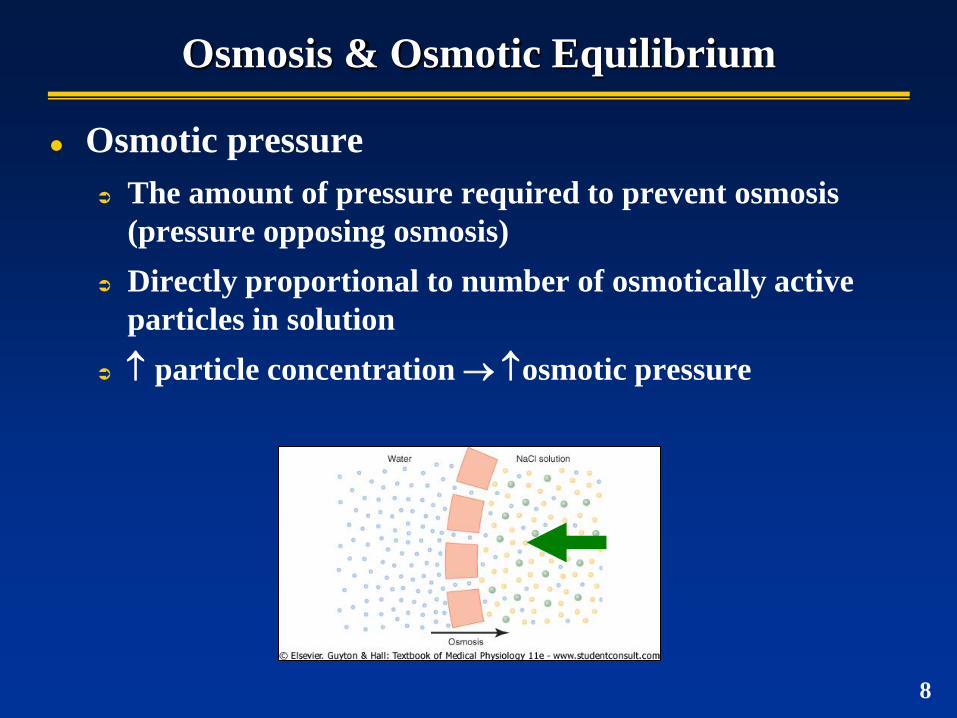
Osmotic pressure
The amount of pressure required to prevent osmosis
(pressure opposing osmosis)
Directly proportional to number of osmotically active
particles in solution
particle concentration osmotic pressure
8
Osmosis & Osmotic Equilibrium
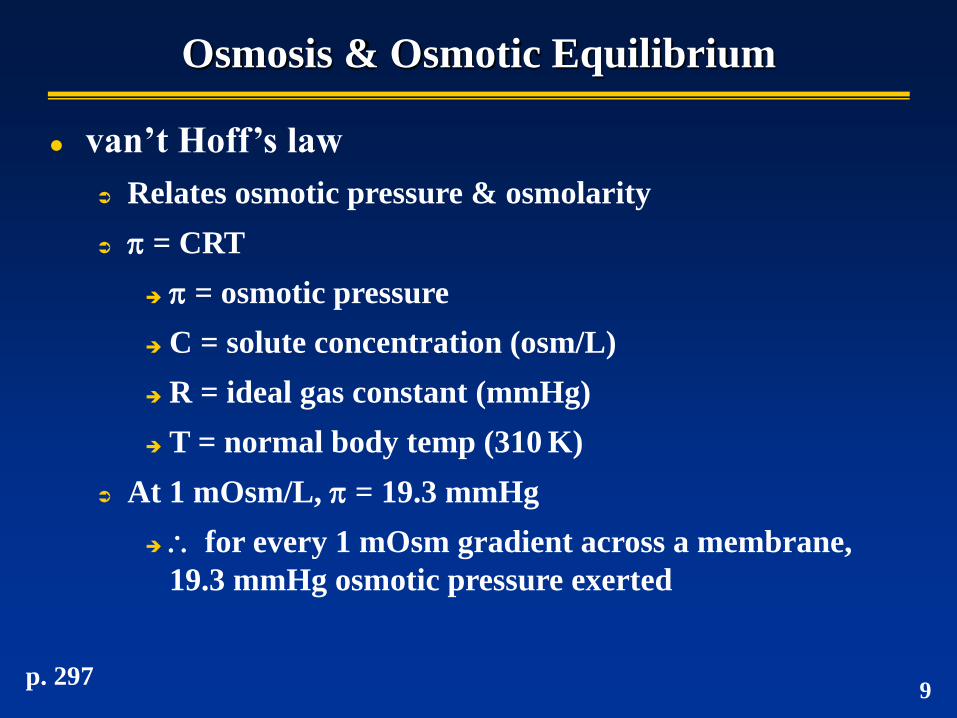
van’t Hoff’s law
Relates osmotic pressure & osmolarity
= CRT
= osmotic pressure
C = solute concentration (osm/L)
R = ideal gas constant (mmHg)
T = normal body temp (310 K)
At 1 mOsm/L, = 19.3 mmHg
for every 1 mOsm gradient across a membrane,
19.3 mmHg osmotic pressure exerted
9 p. 297
Osmosis & Osmotic Equilibrium
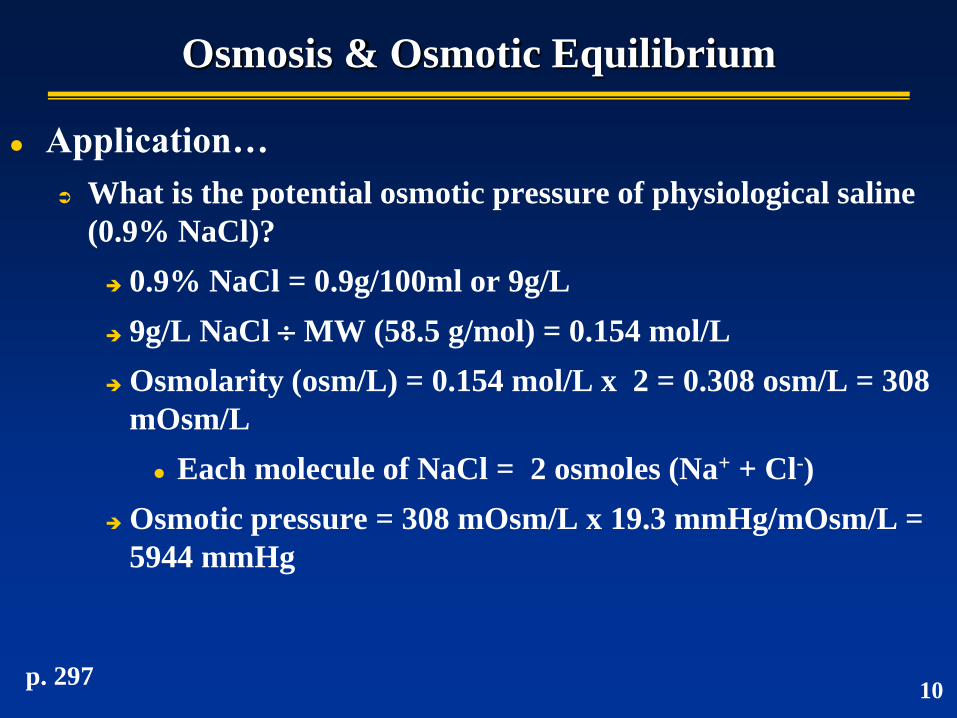
Application…
What is the potential osmotic pressure of physiological saline
(0.9% NaCl)?
0.9% NaCl = 0.9g/100ml or 9g/L
9g/L NaCl MW (58.5 g/mol) = 0.154 mol/L
Osmolarity (osm/L) = 0.154 mol/L x 2 = 0.308 osm/L = 308
mOsm/L
Each molecule of NaCl = 2 osmoles (Na+ + Cl-)
Osmotic pressure = 308 mOsm/L x 19.3 mmHg/mOsm/L =
5944 mmHg
p. 297 10
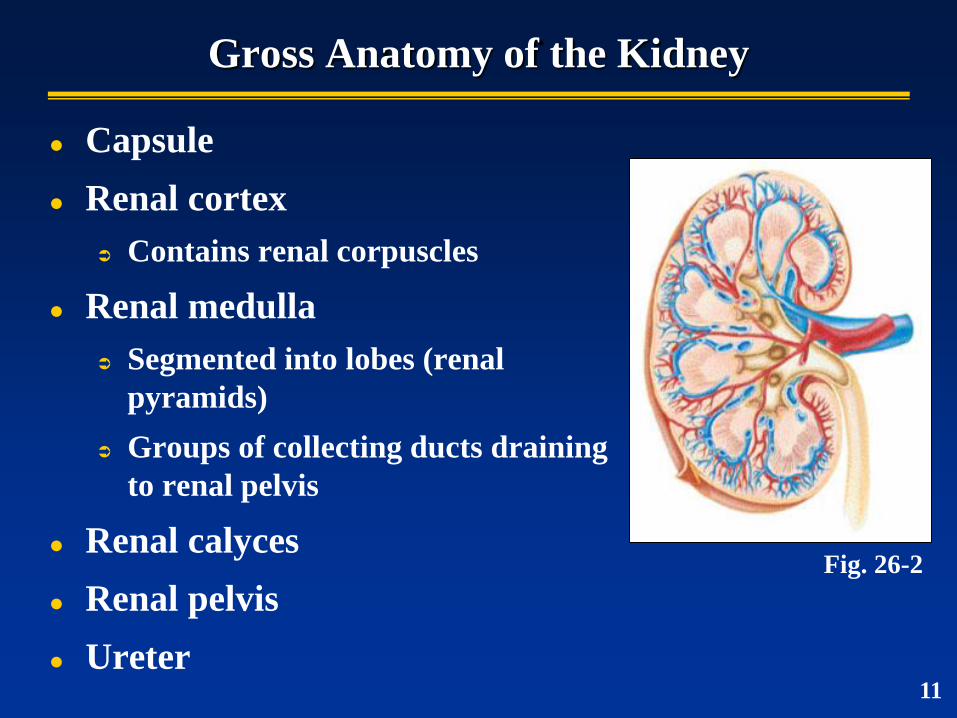
Gross Anatomy of the Kidney
Capsule
Renal cortex
Contains renal corpuscles
Renal medulla
Segmented into lobes (renal
pyramids)
Groups of collecting ducts draining
to renal pelvis
Renal calyces
Renal pelvis
Ureter
Fig. 26-2
11
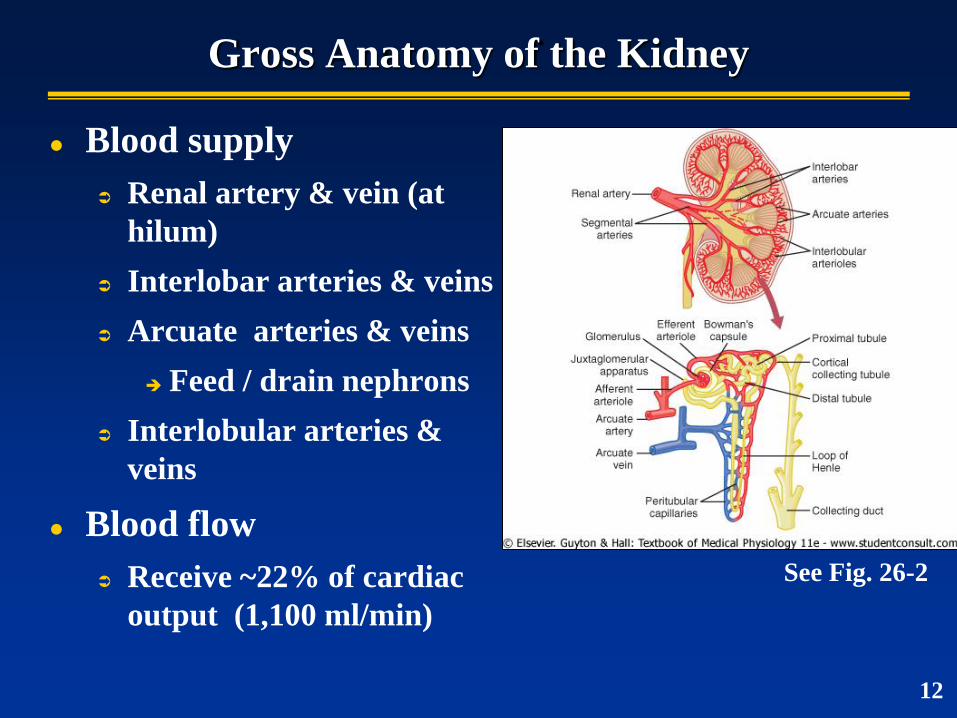
Gross Anatomy of the Kidney
Blood supply
Renal artery & vein (at
hilum)
Interlobar arteries & veins
Arcuate arteries & veins
Feed / drain nephrons
Interlobular arteries &
veins
Blood flow
Receive ~22% of cardiac
output (1,100 ml/min)
See Fig. 26-2
12
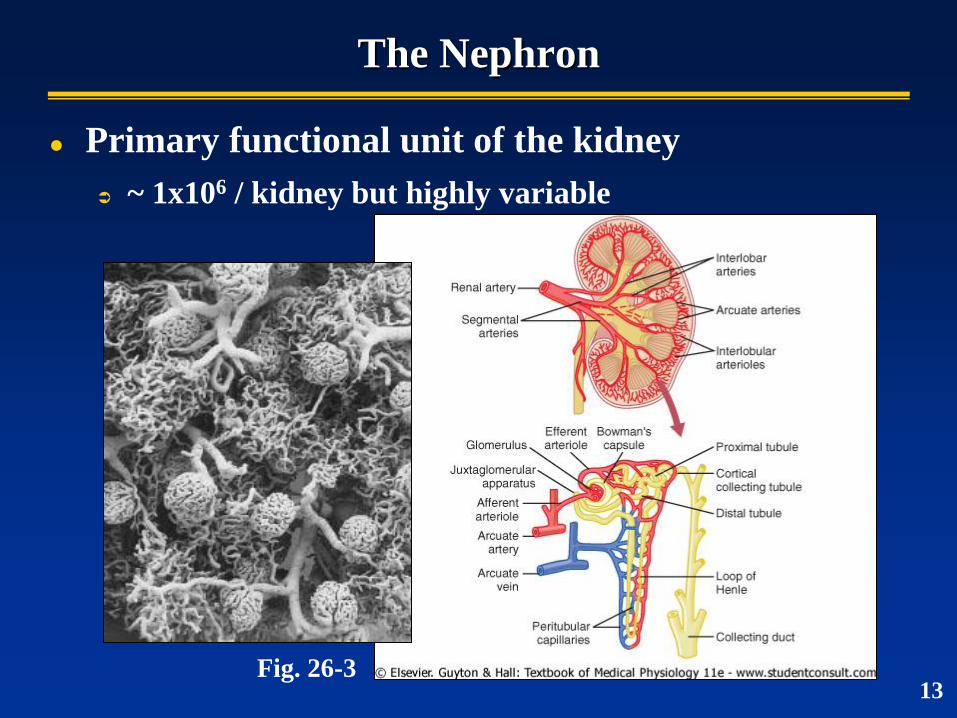
The Nephron
Primary functional unit of the kidney
~ 1x10⁶ / kidney but highly variable
Fig. 26-3 13
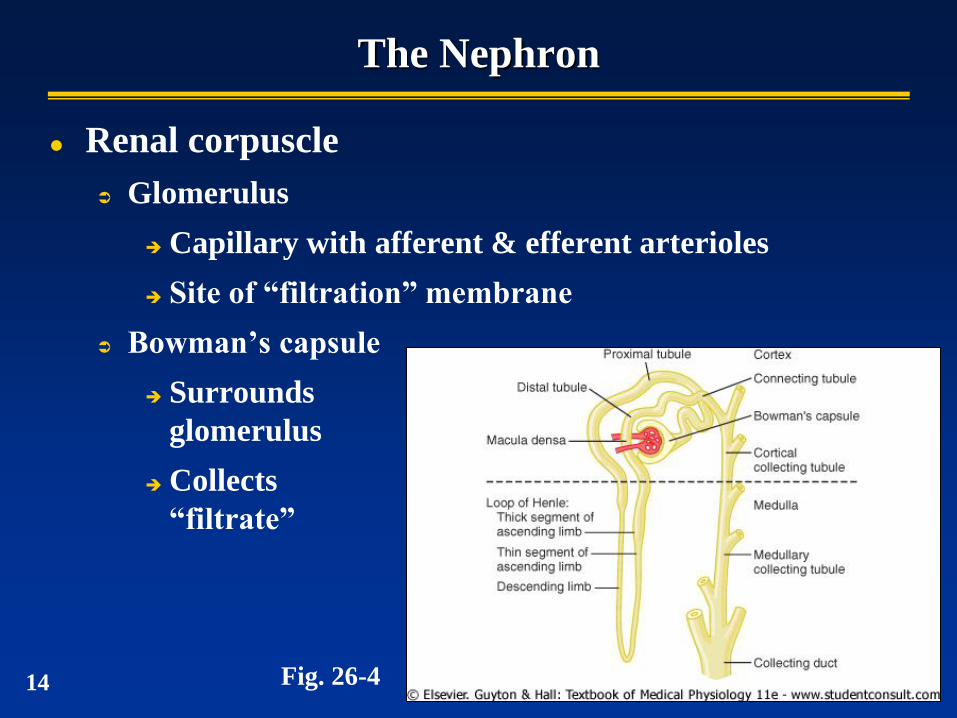
The Nephron
Renal corpuscle
Glomerulus
Capillary with afferent & efferent arterioles
Site of “filtration” membrane
Bowman’s capsule
Surrounds
glomerulus
Collects
“filtrate”
Fig. 26-4 14
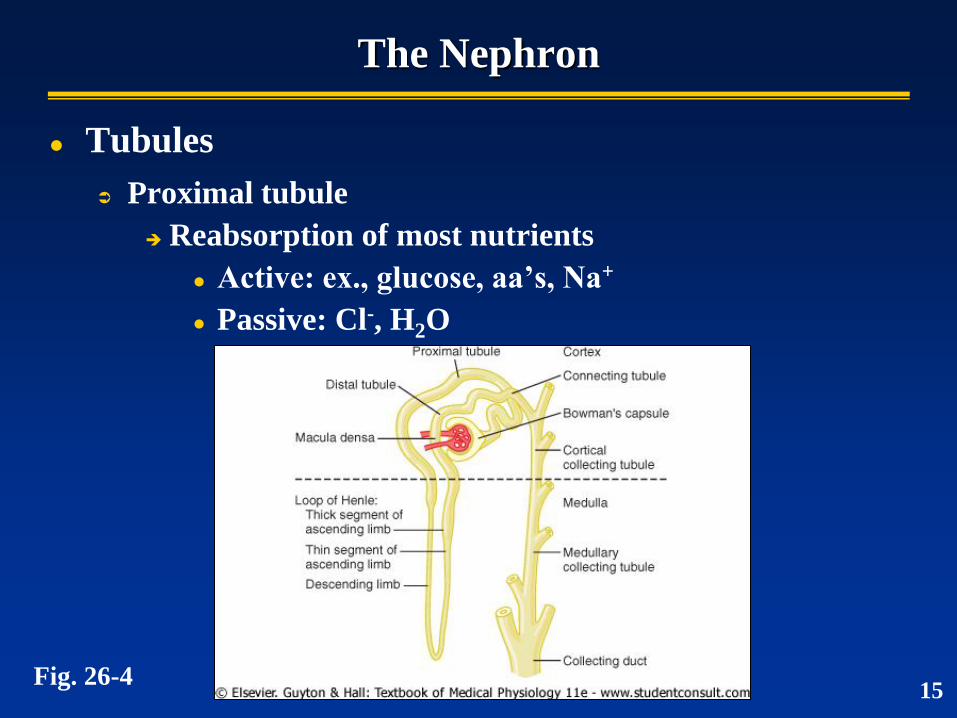
The Nephron
Tubules
Proximal tubule
Reabsorption of most nutrients
Active: ex., glucose, aa’s, Na+
Passive: Cl-, H2O
Fig. 26-4 15
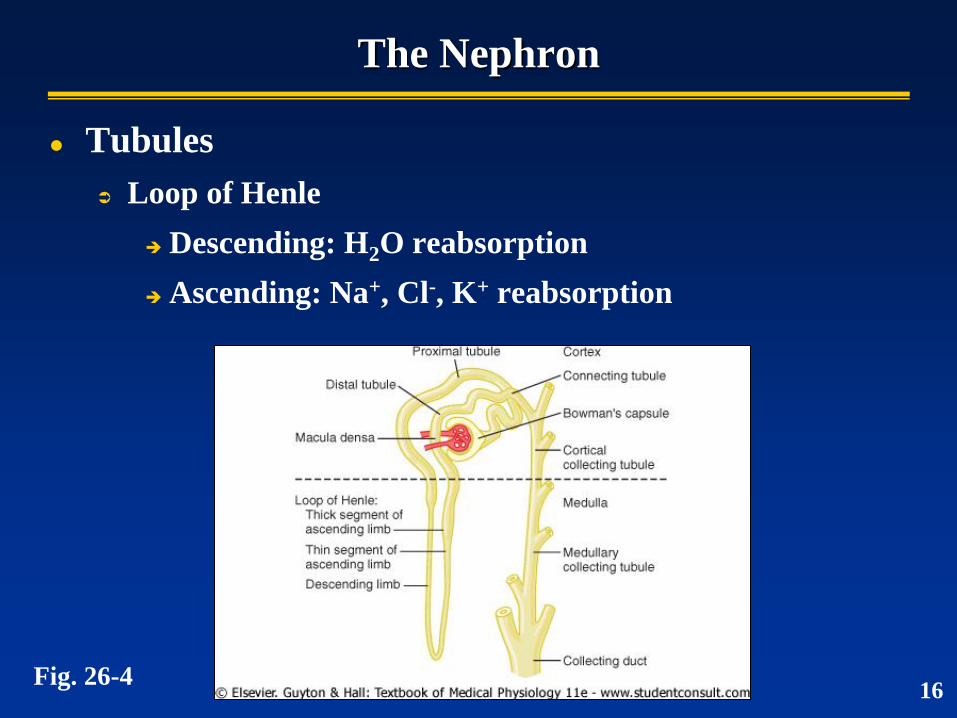
The Nephron
Tubules
Loop of Henle
Descending: H2O reabsorption
Ascending: Na+, Cl-, K+ reabsorption
16 Fig. 26-4
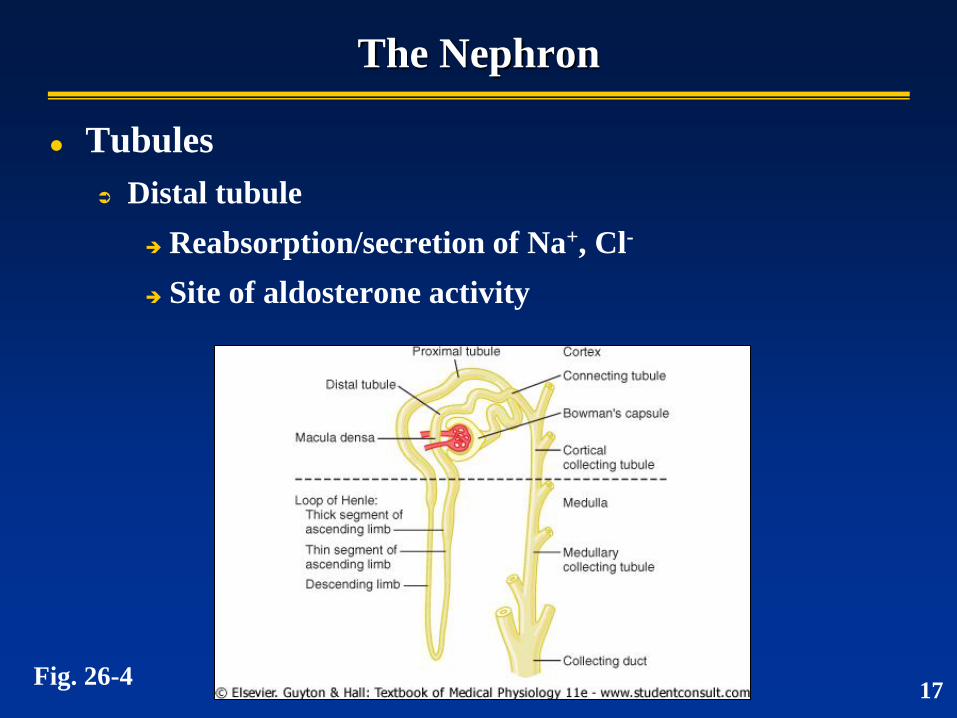
The Nephron
Tubules
Distal tubule
Reabsorption/secretion of Na+, Cl-
Site of aldosterone activity
17 Fig. 26-4
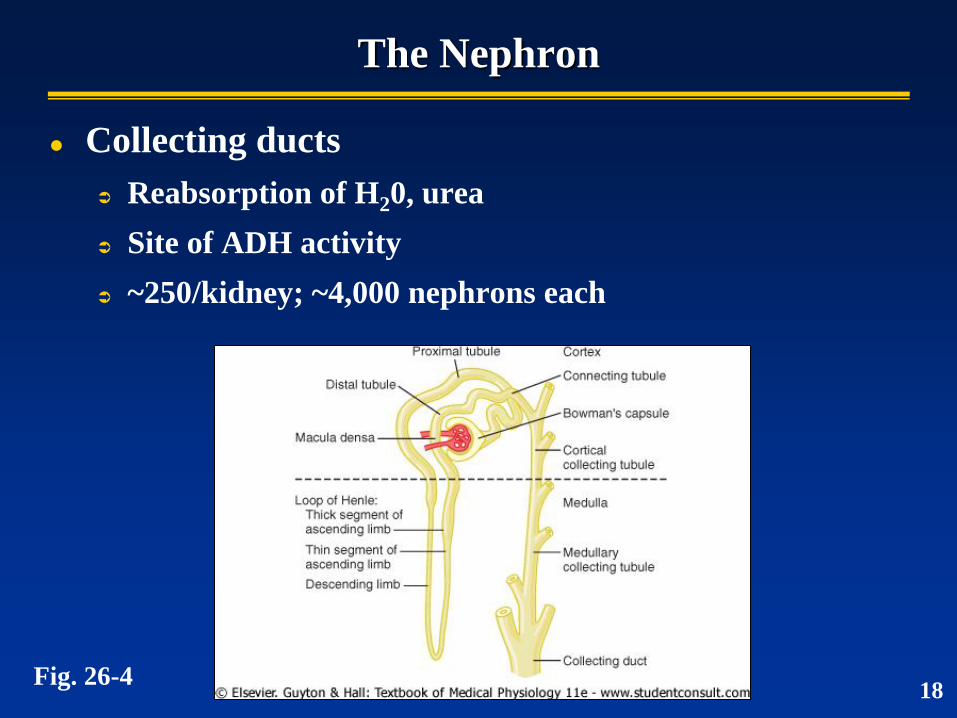
The Nephron
Collecting ducts
Reabsorption of H20, urea
Site of ADH activity
~250/kidney; ~4,000 nephrons each
18 Fig. 26-4
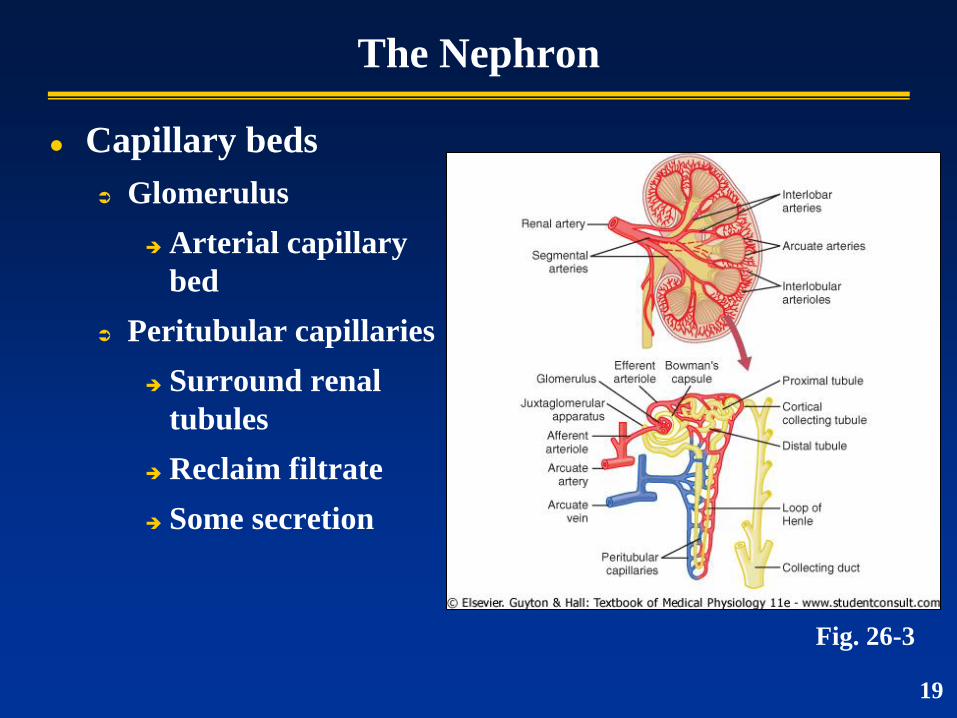
The Nephron
Capillary beds
Glomerulus
Arterial capillary
bed
Peritubular capillaries
Surround renal
tubules
Reclaim filtrate
Some secretion
Fig. 26-3
19
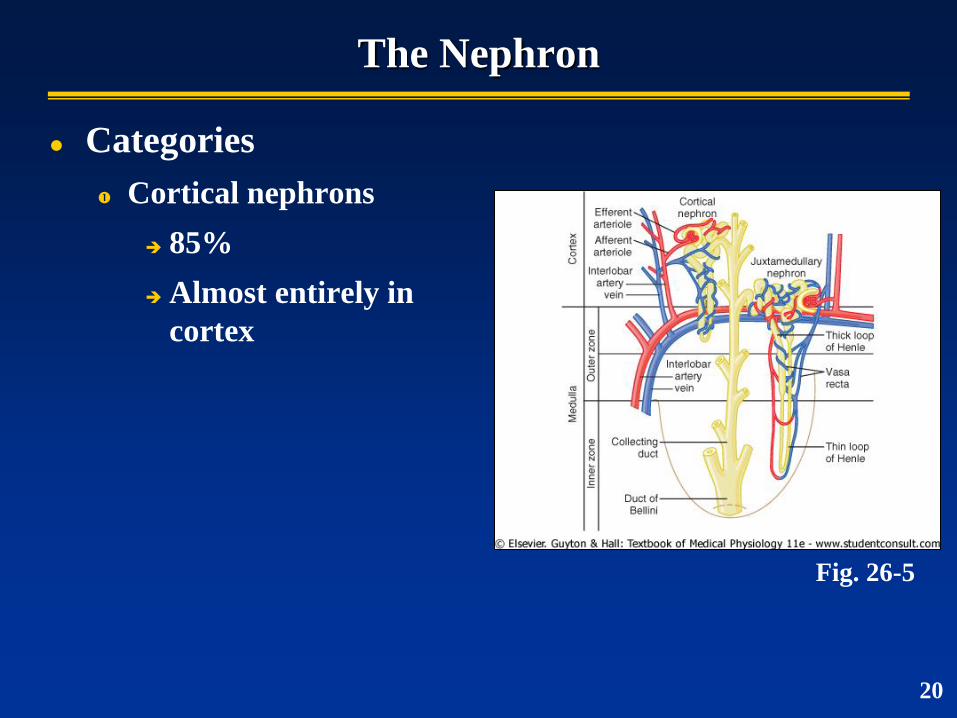
The Nephron
Categories
Cortical nephrons
85%
Almost entirely in
cortex
20
Fig. 26-5
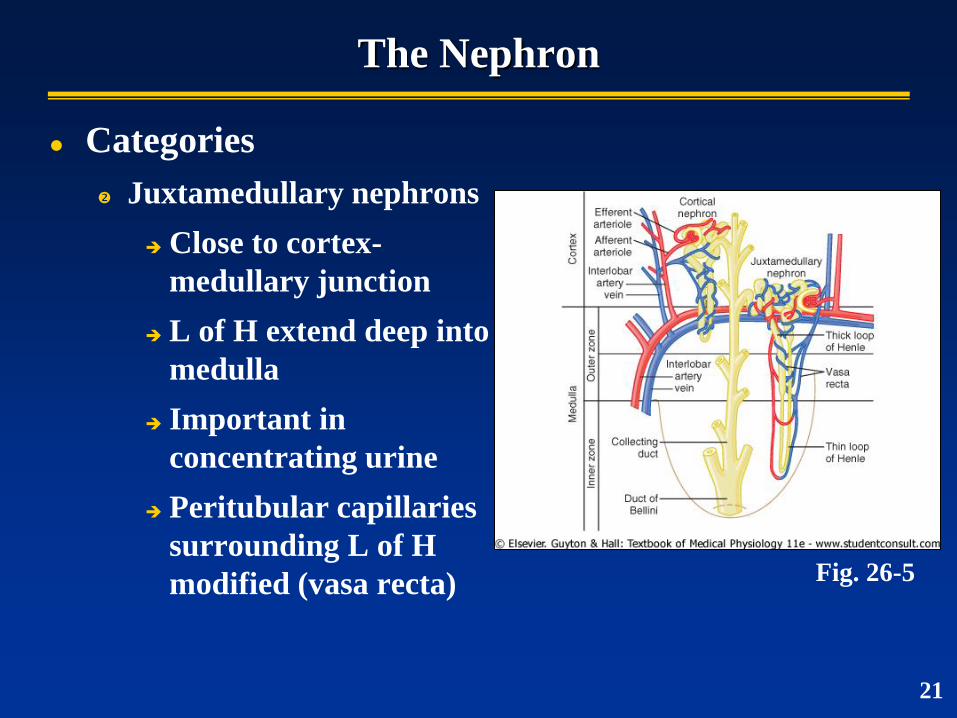
The Nephron
Categories
Juxtamedullary nephrons
Close to cortex-
medullary junction
L of H extend deep into
medulla
Important in
concentrating urine
Peritubular capillaries
surrounding L of H
modified (vasa recta) Fig. 26-5
21
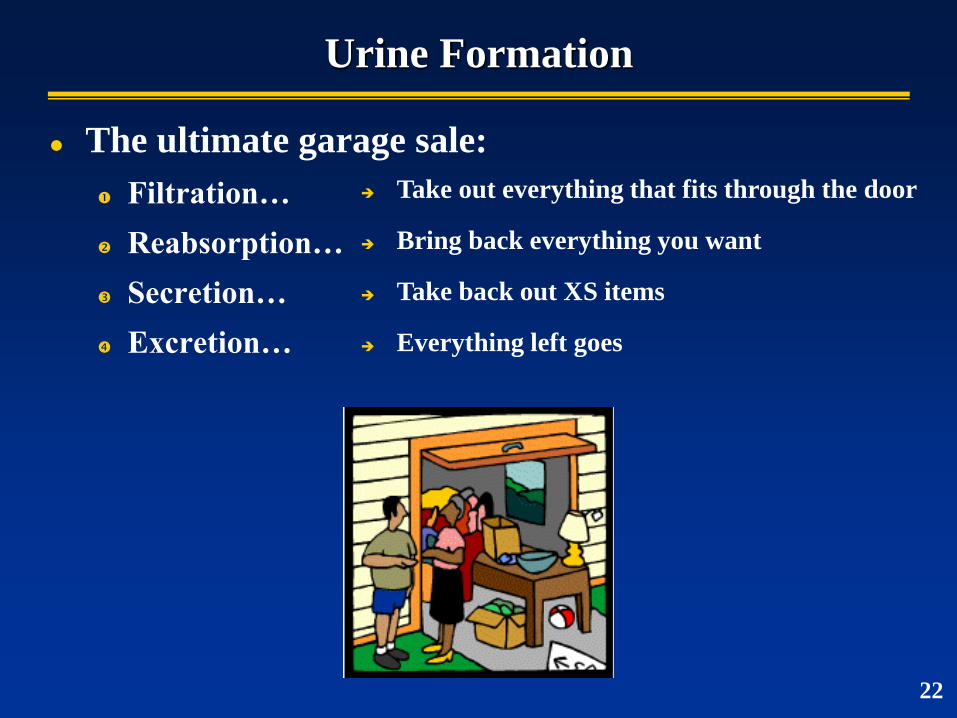
Urine Formation
The ultimate garage sale:
Filtration…
Reabsorption…
Secretion…
Excretion…
Take out everything that fits through the door
Bring back everything you want
Take back out XS items
Everything left goes
22
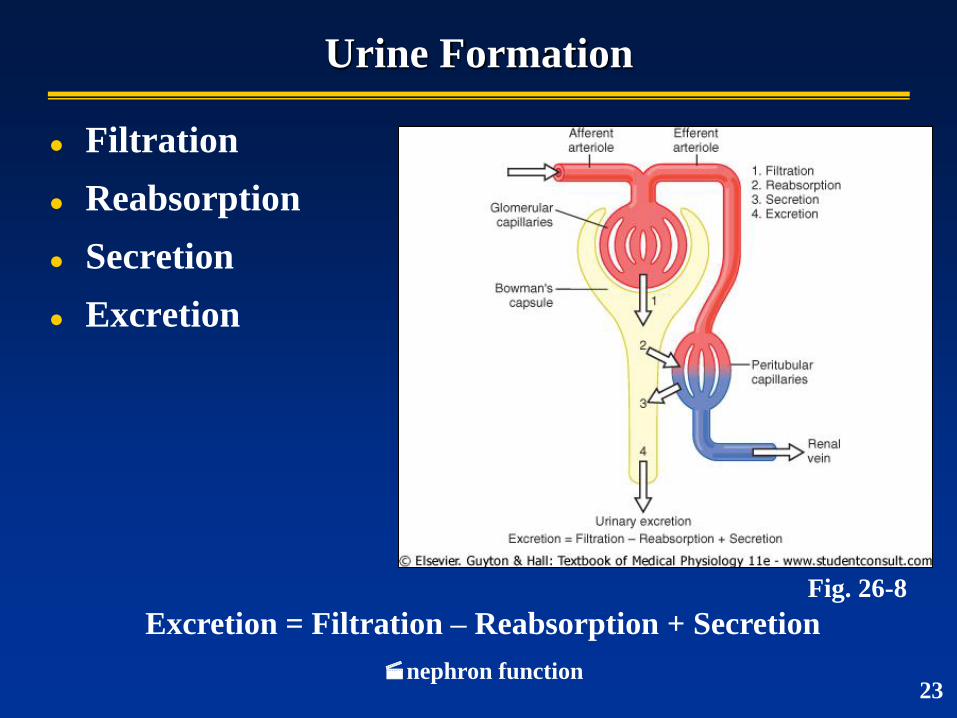
Urine Formation
Filtration
Reabsorption
Secretion
Excretion
Excretion = Filtration – Reabsorption + Secretion
nephron function
Fig. 26-8
23
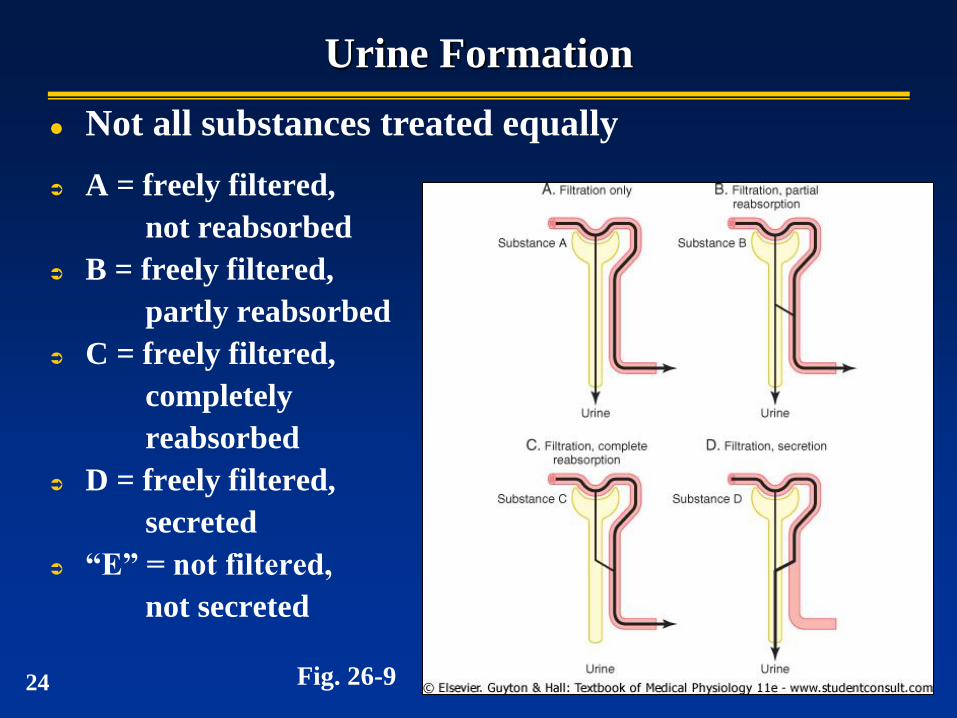
Urine Formation
A = freely filtered,
not reabsorbed
B = freely filtered,
partly reabsorbed
C = freely filtered,
completely
reabsorbed
D = freely filtered,
secreted
“E” = not filtered,
not secreted
Fig. 26-9
Not all substances treated equally
24
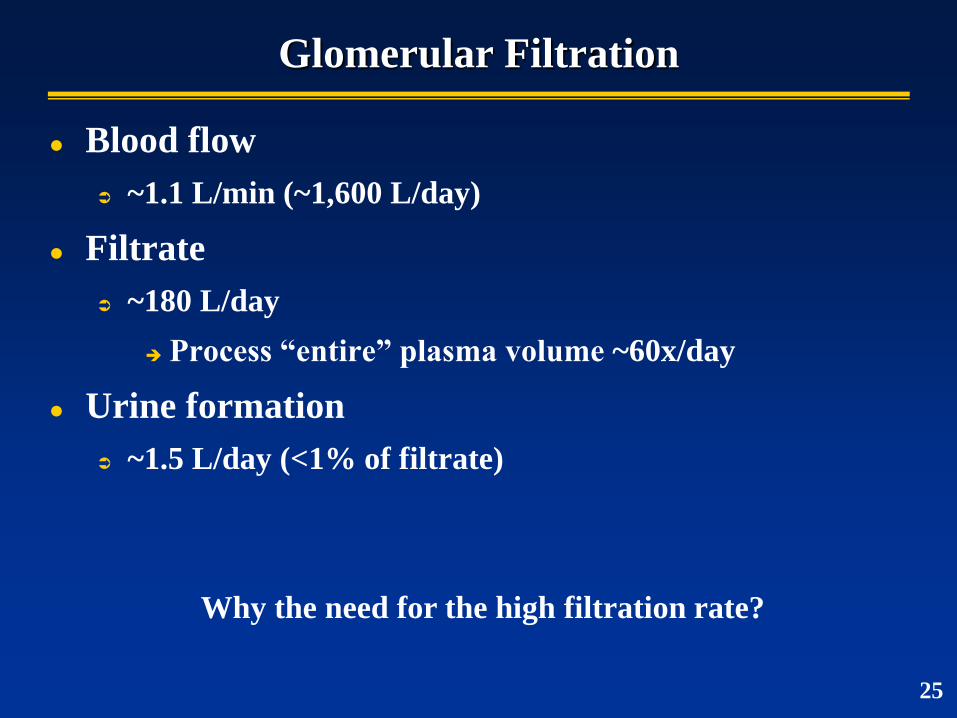
Glomerular Filtration
Blood flow
~1.1 L/min (~1,600 L/day)
Filtrate
~180 L/day
Process “entire” plasma volume ~60x/day
Urine formation
~1.5 L/day (<1% of filtrate)
Why the need for the high filtration rate?
25
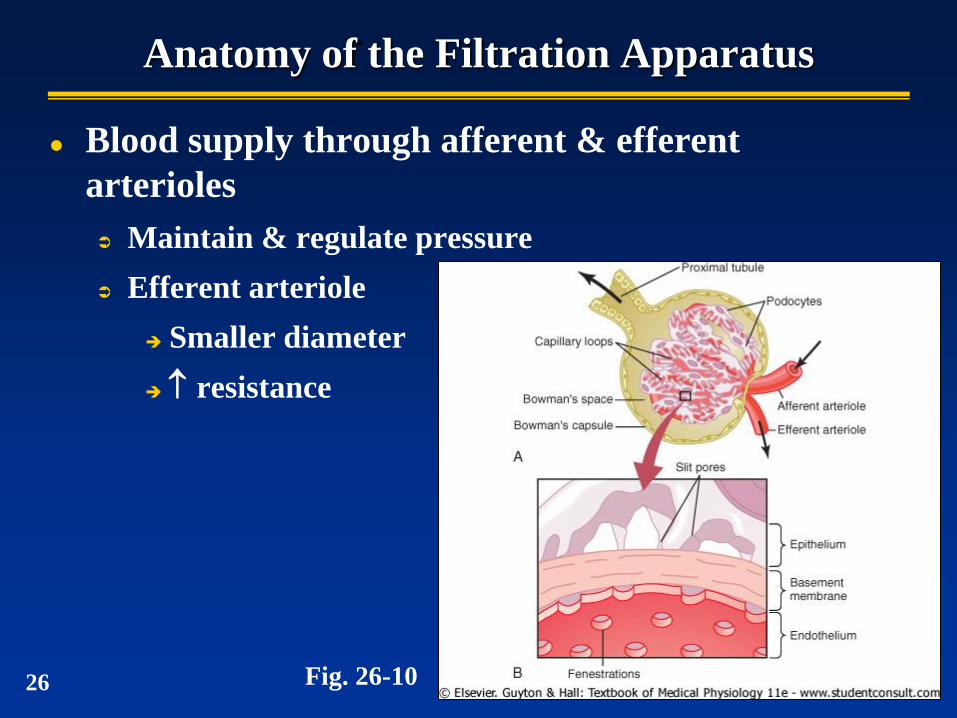
Anatomy of the Filtration Apparatus
Blood supply through afferent & efferent
arterioles
Maintain & regulate pressure
Efferent arteriole
Smaller diameter
resistance
Fig. 26-10 26
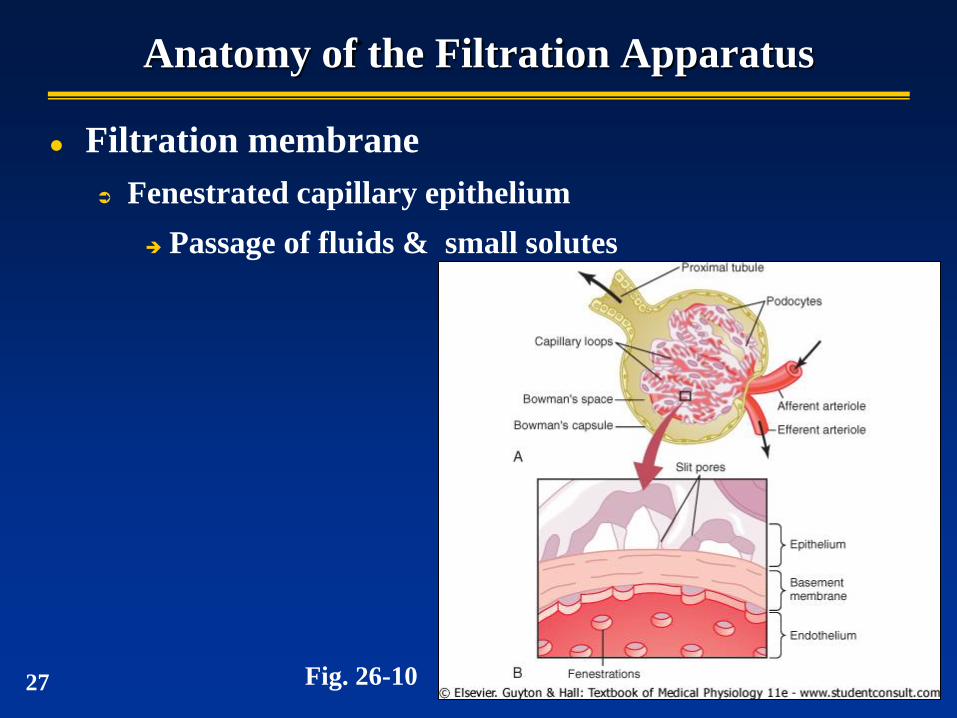
Anatomy of the Filtration Apparatus
Filtration membrane
Fenestrated capillary epithelium
Passage of fluids & small solutes
Fig. 26-10 27
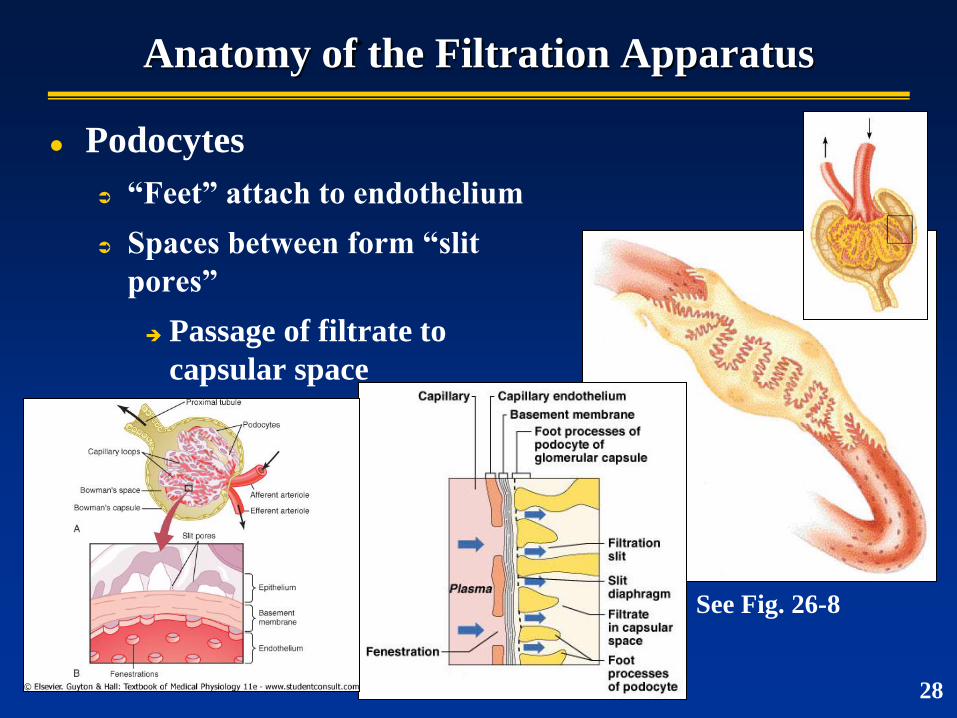
Anatomy of the Filtration Apparatus
Podocytes
“Feet” attach to endothelium
Spaces between form “slit
pores”
Passage of filtrate to
capsular space
See Fig. 26-8
28
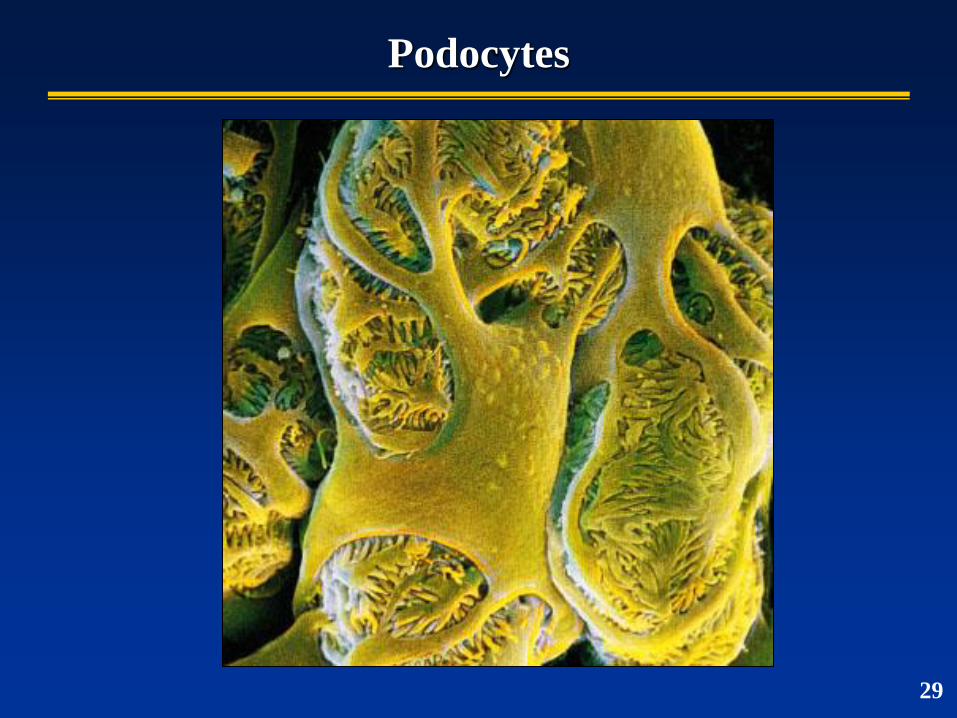
Podocytes
29
Glomerular Filtration
Essentially a passive process
Fluids/solutes forced out by hydrostatic pressure
Filterability based on…
Size of molecule
Pores ~8 nm diameter
Molecules <3 nm, freely pass
E.g., water, glucose, aa’s, N-wastes
Molecules >7-9 nm, usually blocked
30
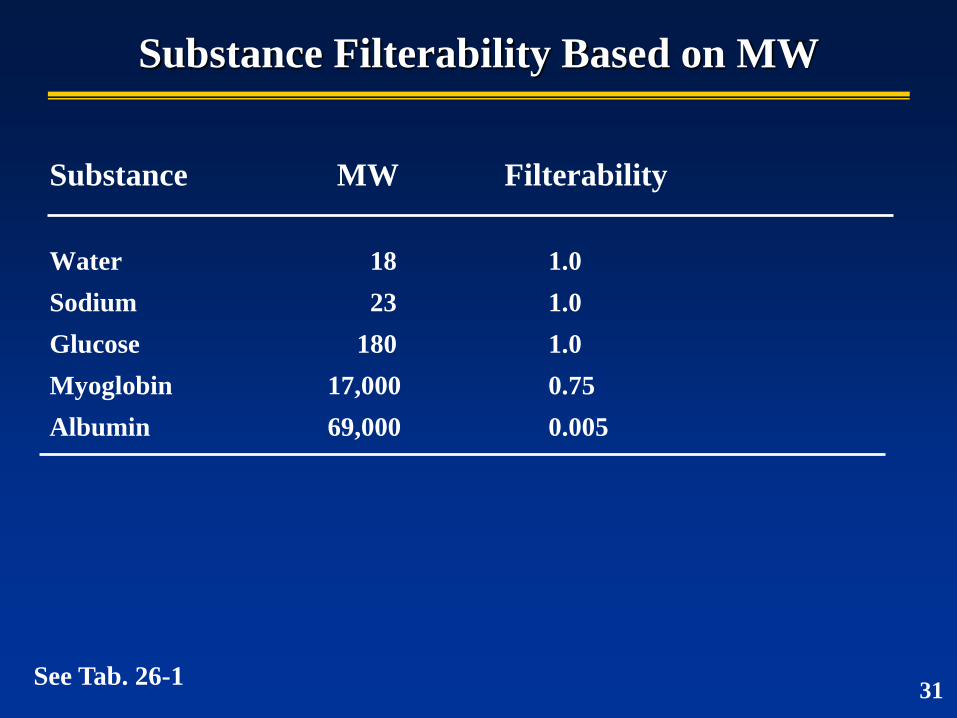
Substance Filterability Based on MW
Substance MW Filterability
Water 18 1.0
Sodium 23 1.0
Glucose 180 1.0
Myoglobin 17,000 0.75
Albumin 69,000 0.005
See Tab. 26-1 31
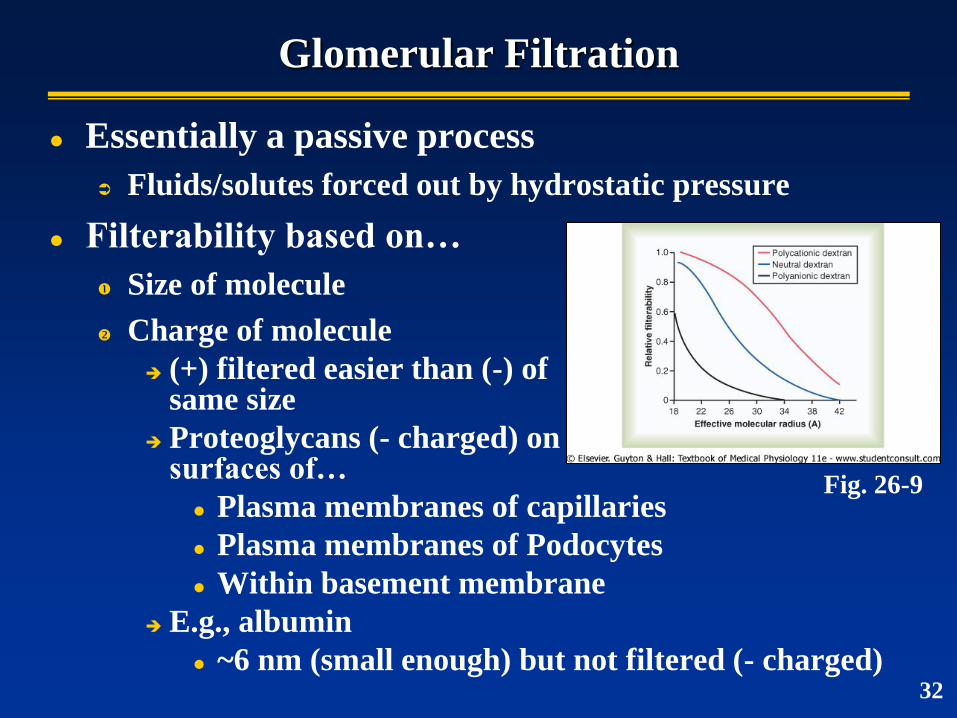
Glomerular Filtration
Essentially a passive process
Fluids/solutes forced out by hydrostatic pressure
Filterability based on…
Size of molecule
Charge of molecule
(+) filtered easier than (-) of same size
Proteoglycans (- charged) on surfaces of…
Plasma membranes of capillaries
Plasma membranes of Podocytes
Within basement membrane
E.g., albumin
~6 nm (small enough) but not filtered (- charged)
Fig. 26-9
32
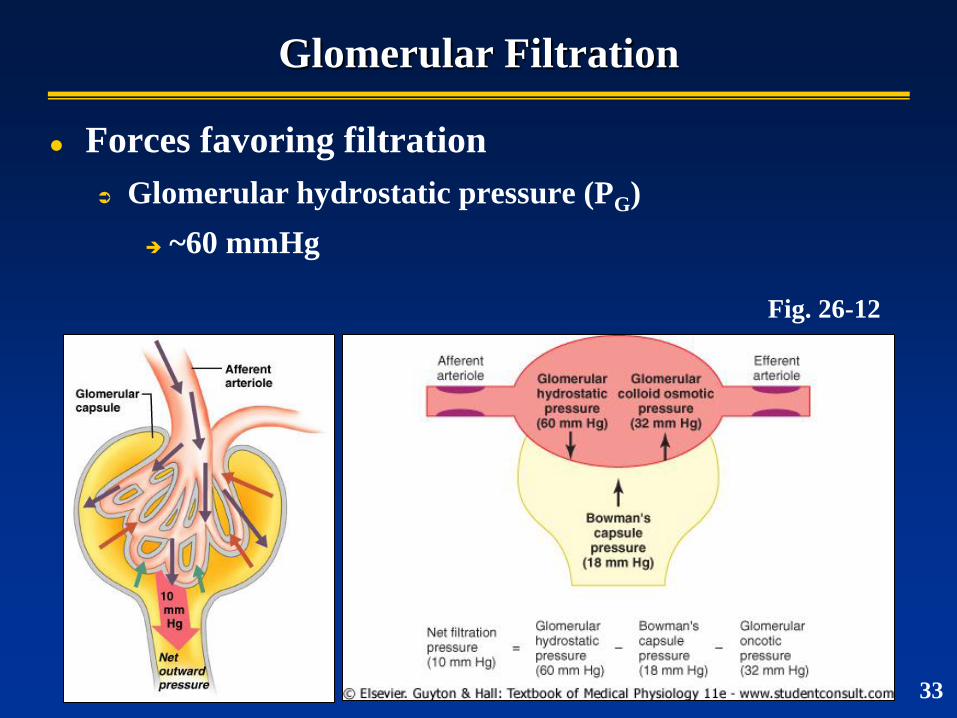
Glomerular Filtration
Forces favoring filtration
Glomerular hydrostatic pressure (PG)
~60 mmHg
Fig. 26-12
33
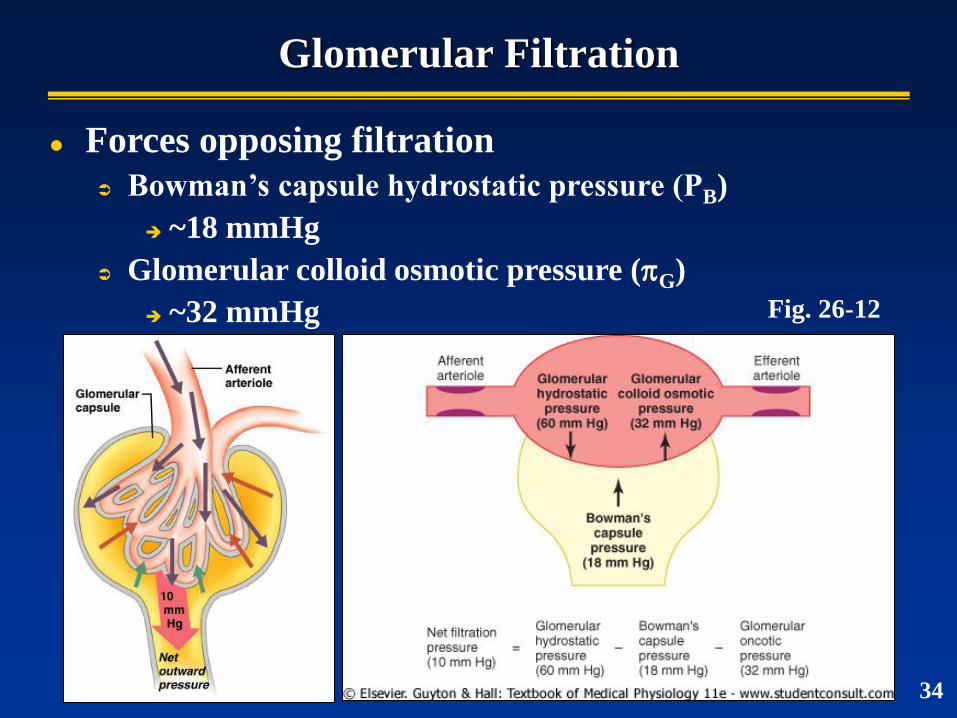
Glomerular Filtration
Forces opposing filtration
Bowman’s capsule hydrostatic pressure (PB)
~18 mmHg
Glomerular colloid osmotic pressure (G)
~32 mmHg
34
Fig. 26-12
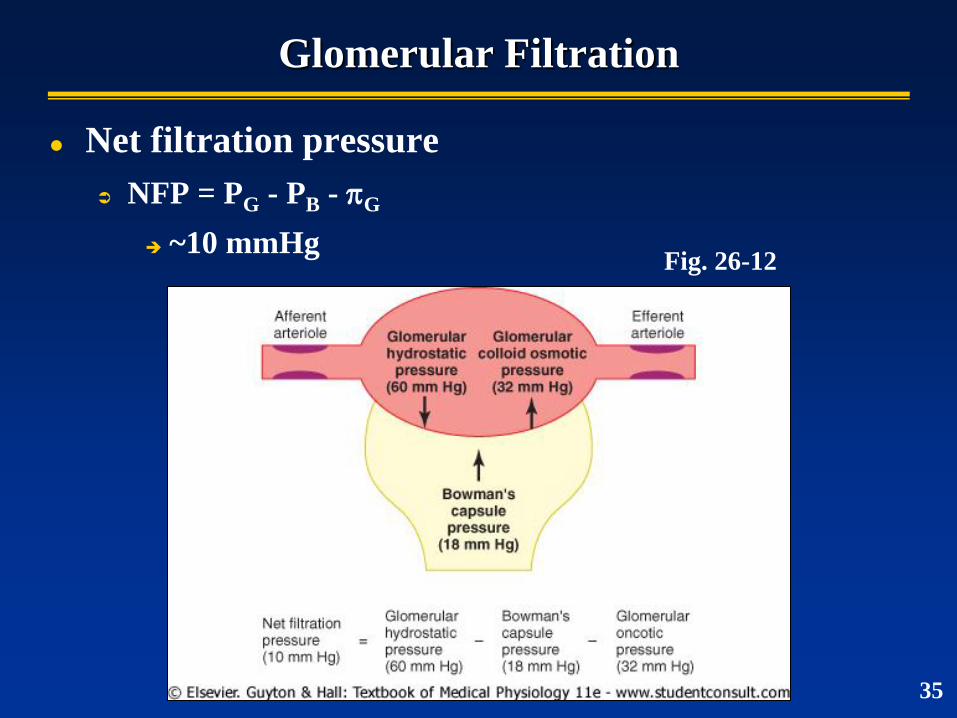
Glomerular Filtration
Net filtration pressure
NFP = PG - PB - G
~10 mmHg Fig. 26-12
35
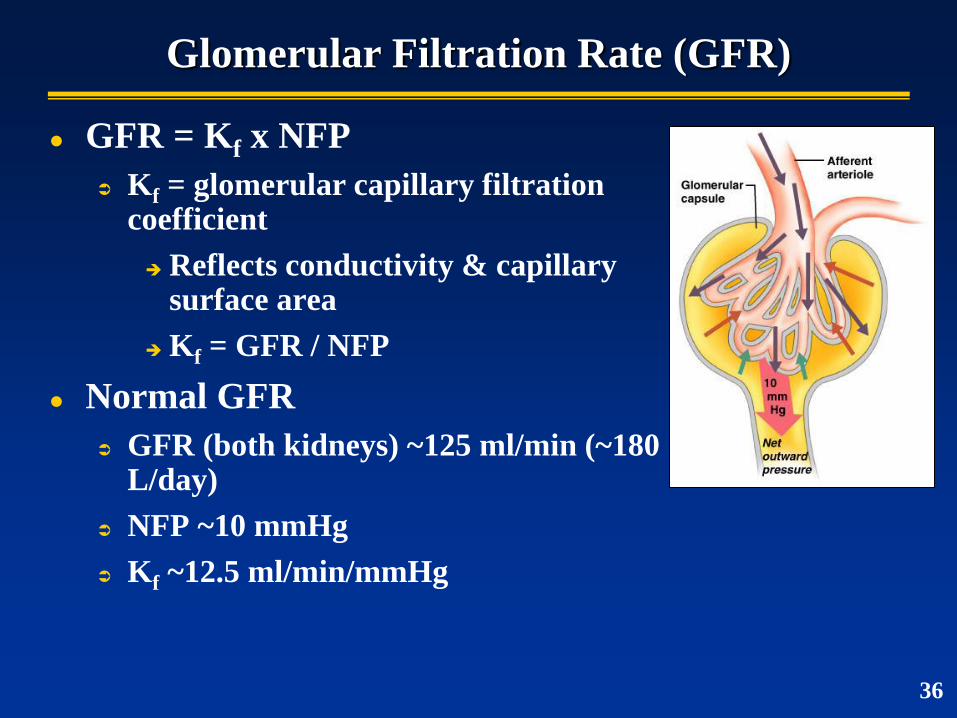
Glomerular Filtration Rate (GFR)
GFR = Kf x NFP
Kf = glomerular capillary filtration coefficient
Reflects conductivity & capillary surface area
Kf = GFR / NFP
Normal GFR
GFR (both kidneys) ~125 ml/min (~180 L/day)
NFP ~10 mmHg
Kf ~12.5 ml/min/mmHg
36
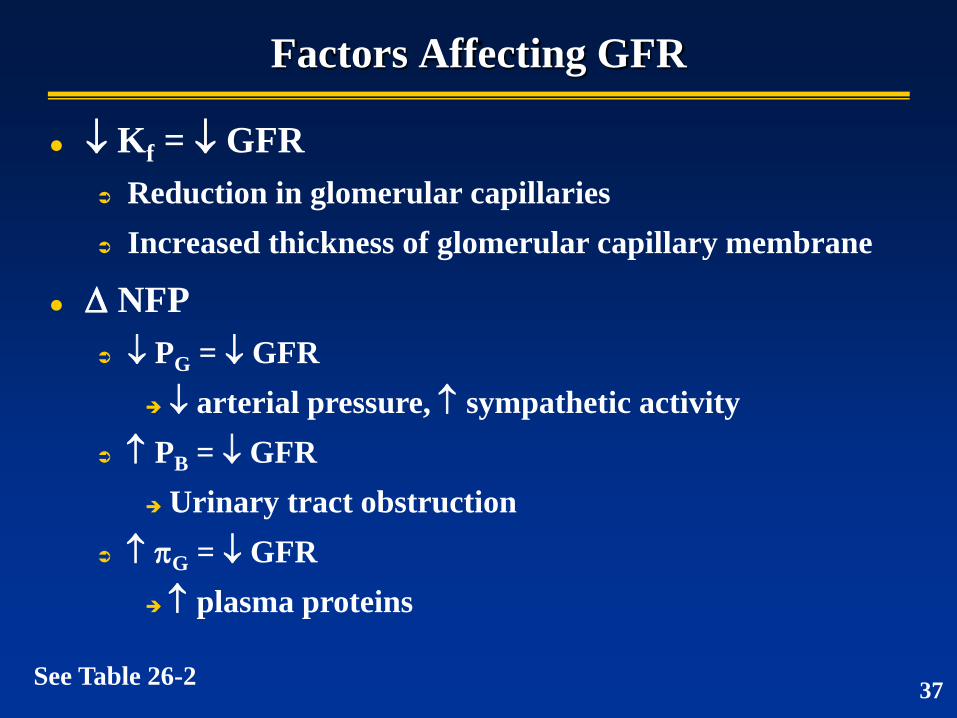
Factors Affecting GFR
Kf = GFR
Reduction in glomerular capillaries
Increased thickness of glomerular capillary membrane
See Table 26-2
NFP
PG = GFR
arterial pressure, sympathetic activity
PB = GFR
Urinary tract obstruction
G = GFR
plasma proteins
37
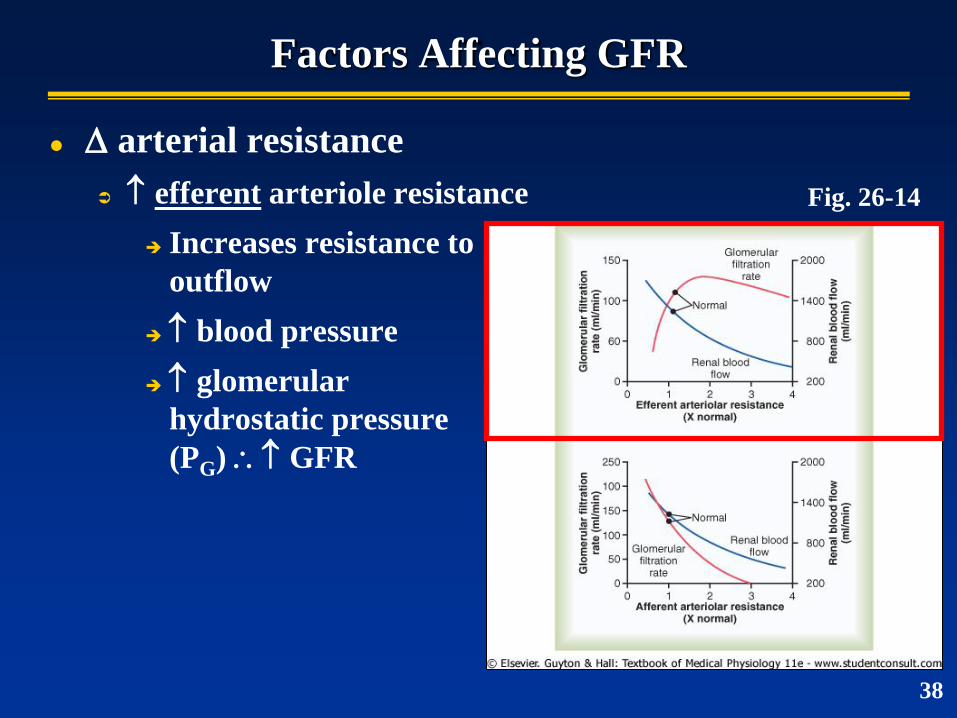
Factors Affecting GFR
arterial resistance
efferent arteriole resistance
Increases resistance to
outflow
blood pressure
glomerular
hydrostatic pressure
(PG) GFR
Fig. 26-14
38
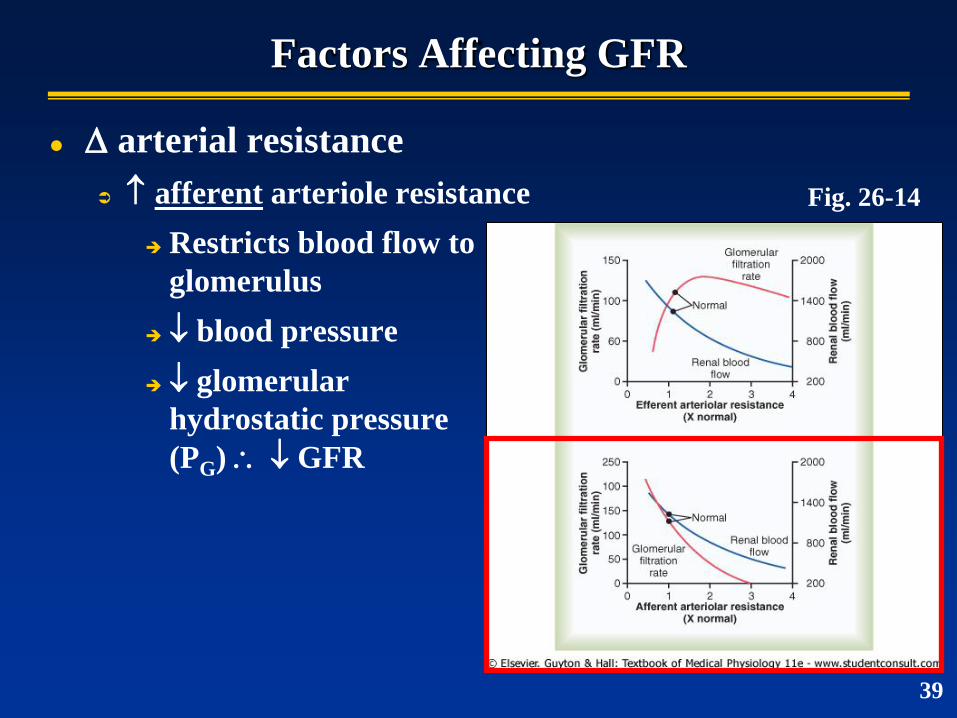
Factors Affecting GFR
arterial resistance
afferent arteriole resistance
Restricts blood flow to
glomerulus
blood pressure
glomerular
hydrostatic pressure
(PG) GFR
39
Fig. 26-14
Regulation of Filtration
Intrinsic control mechanisms (autoregulation)
Maintain relatively constant GFR under normal daily
arterial pressure fluctuations
Prevents excessive / inadequate urine production that
would accompany large changes in GFR
Tubuloglomerular feedback mechanism
Control GFR based on glomerular pressure and NaCl
concentrations
Extrinsic control mechanisms
ANS
40
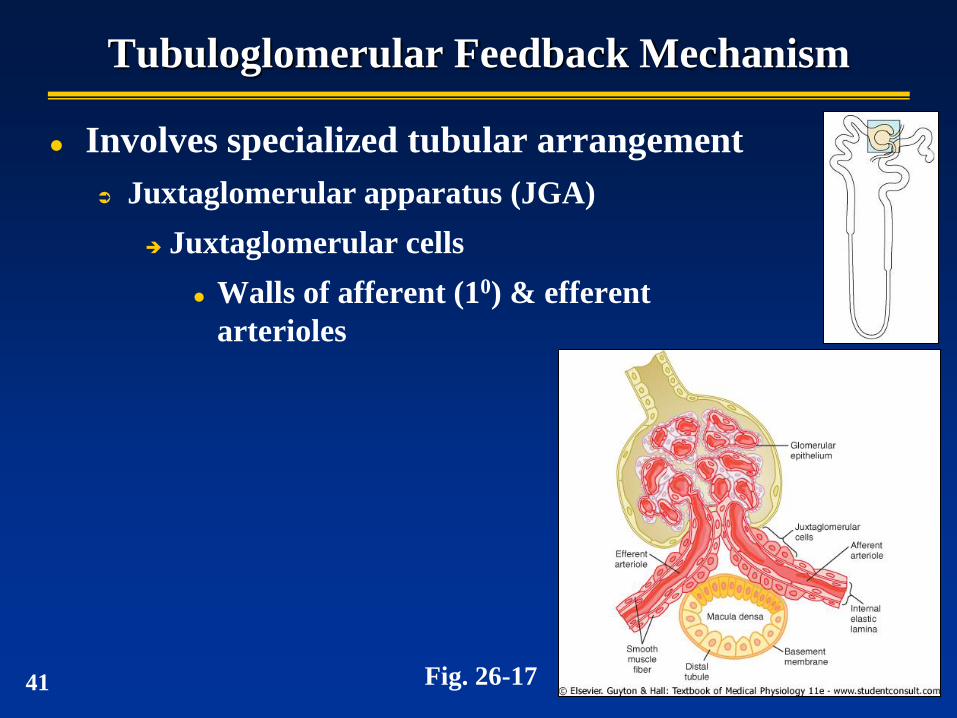
Tubuloglomerular Feedback Mechanism
Involves specialized tubular arrangement
Juxtaglomerular apparatus (JGA)
Juxtaglomerular cells
Walls of afferent (10) & efferent
arterioles
Fig. 26-17 41
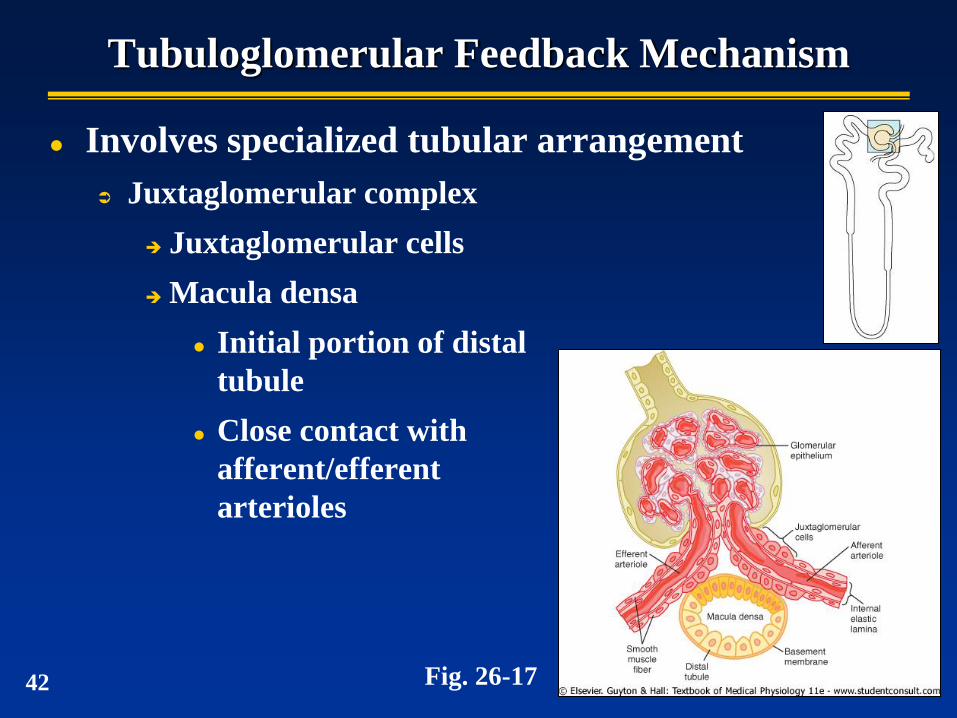
Tubuloglomerular Feedback Mechanism
Involves specialized tubular arrangement
Juxtaglomerular complex
Juxtaglomerular cells
Macula densa
Initial portion of distal
tubule
Close contact with
afferent/efferent
arterioles
Fig. 26-17 42
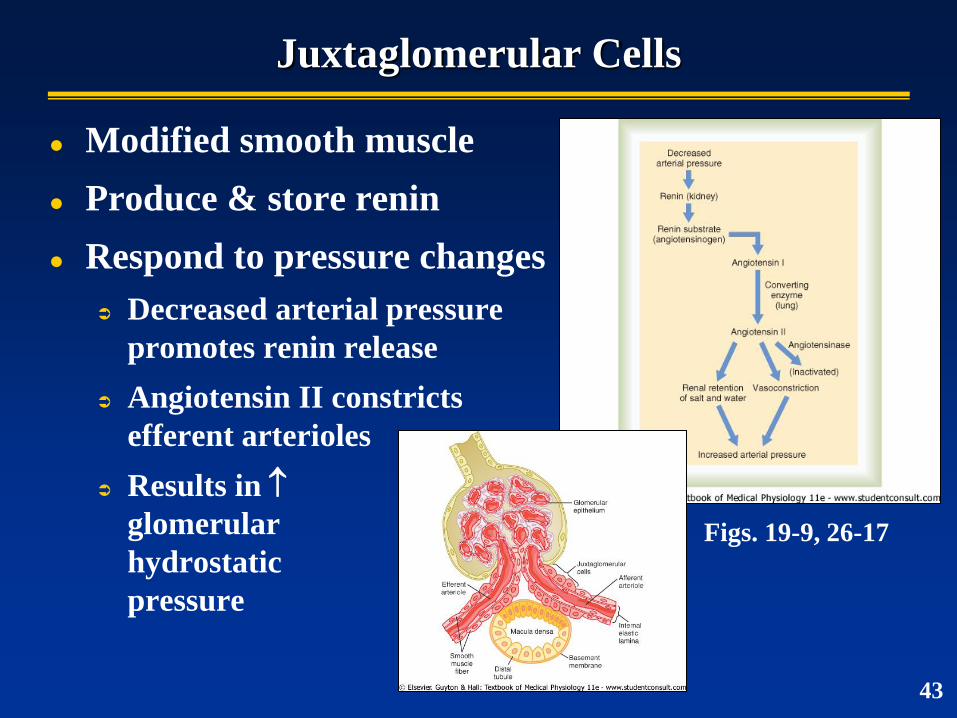
Juxtaglomerular Cells
Modified smooth muscle
Produce & store renin
Respond to pressure changes
Decreased arterial pressure
promotes renin release
Angiotensin II constricts
efferent arterioles
Results in
glomerular
hydrostatic
pressure
Figs. 19-9, 26-17
43
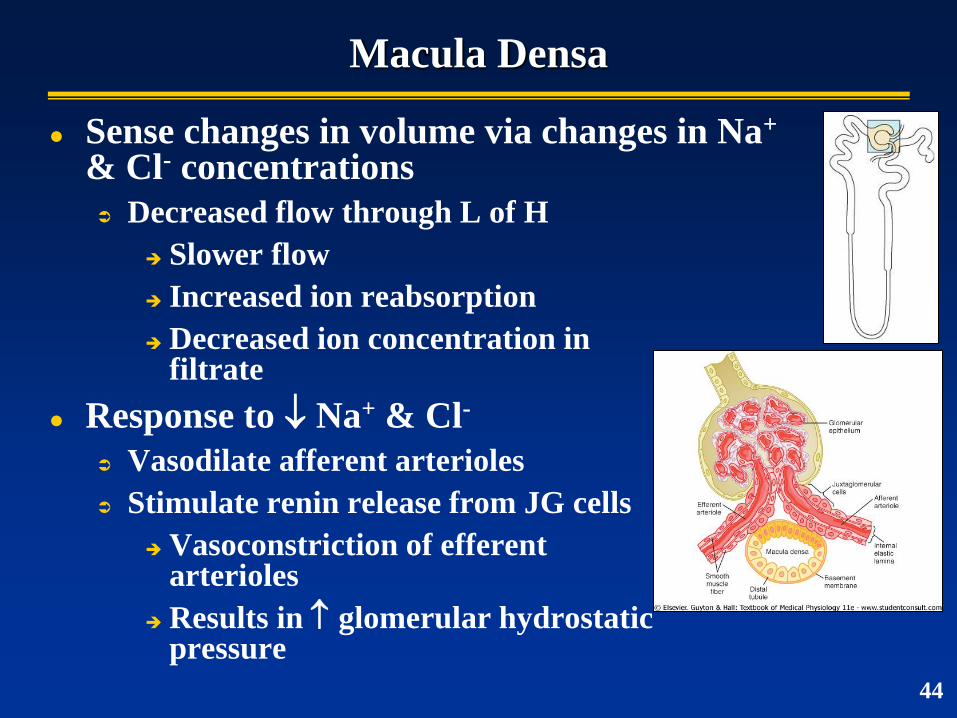
Macula Densa
Sense changes in volume via changes in Na+ & Cl- concentrations
Decreased flow through L of H
Slower flow
Increased ion reabsorption
Decreased ion concentration in filtrate
Response to Na+ & Cl-
Vasodilate afferent arterioles
Stimulate renin release from JG cells
Vasoconstriction of efferent arterioles
Results in glomerular hydrostatic pressure
44
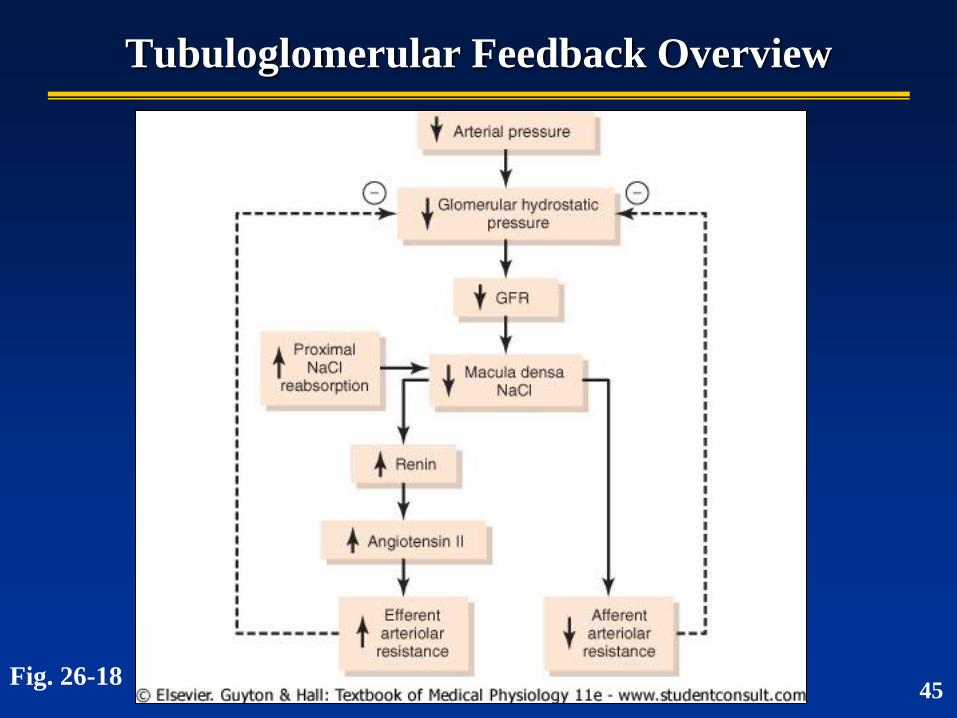
Tubuloglomerular Feedback Overview
Fig. 26-18 45
Autonomic Control of GFR
Sympathetic division
Strong stimulus = GFR
Constriction of renal arterioles
Slower flow
Parasympathetic division
Stimulus = ?
46
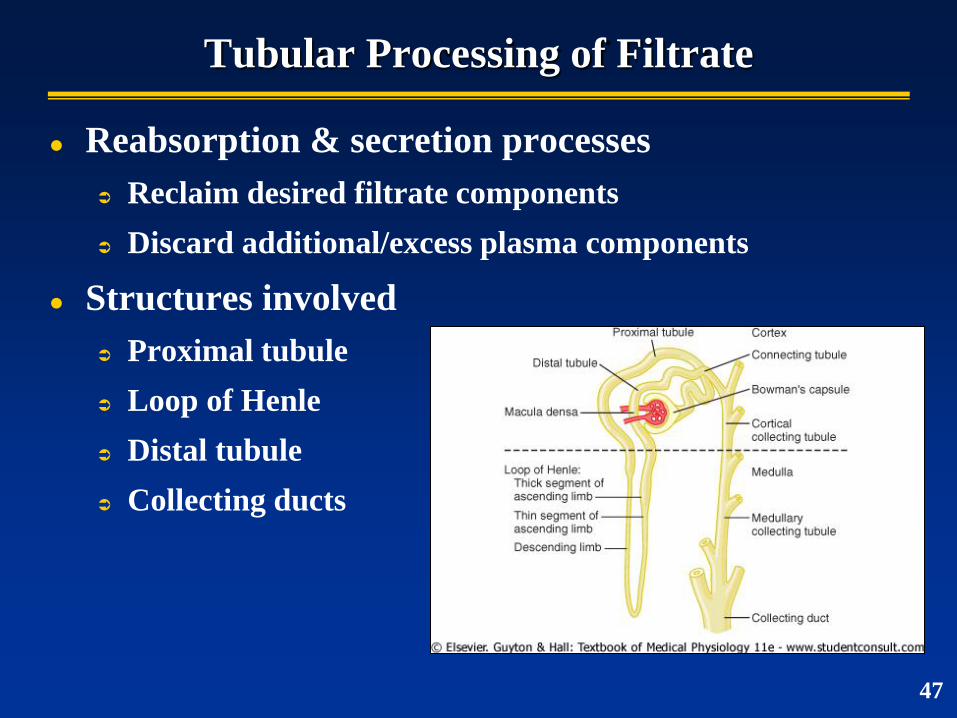
Tubular Processing of Filtrate
Reabsorption & secretion processes
Reclaim desired filtrate components
Discard additional/excess plasma components
Structures involved
Proximal tubule
Loop of Henle
Distal tubule
Collecting ducts
47
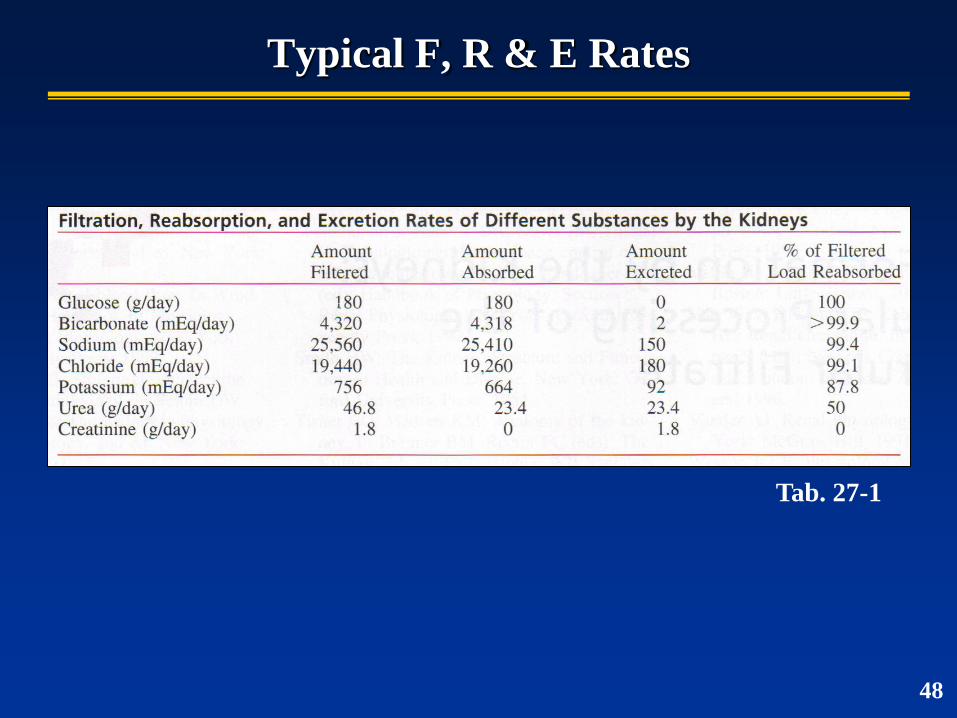
Typical F, R & E Rates
Tab. 27-1
48
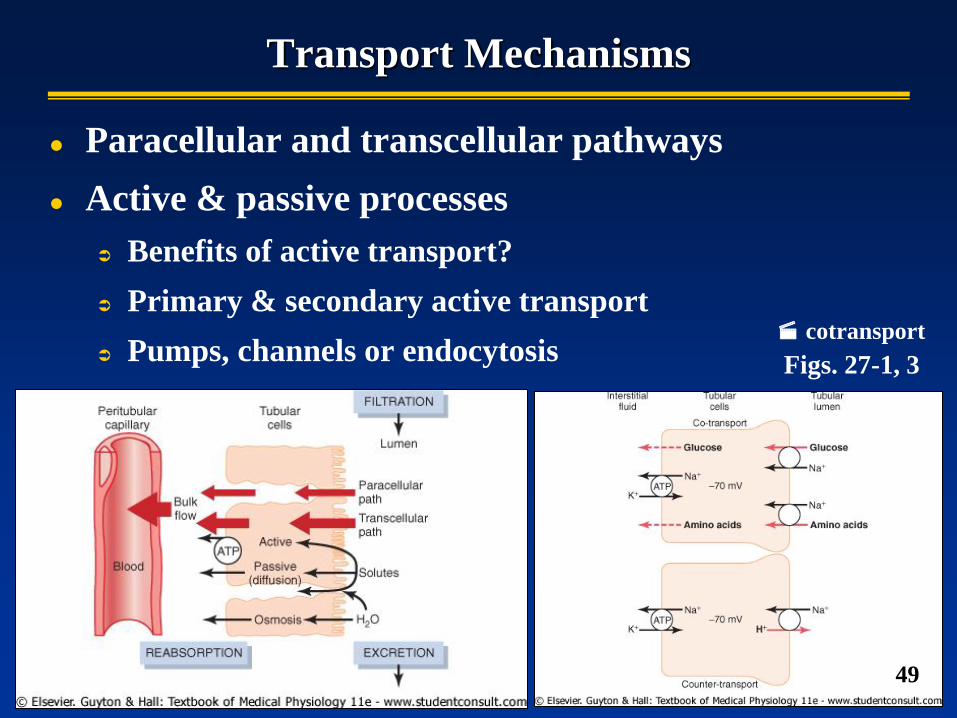
Transport Mechanisms
Paracellular and transcellular pathways
Active & passive processes
Benefits of active transport?
Primary & secondary active transport
Pumps, channels or endocytosis Figs. 27-1, 3
49
cotransport
Transport Mechanisms
Na+
Reabsorbed primarily by transcellular active transport
H2O
Reabsorbed entirely by osmosis (passive)
50
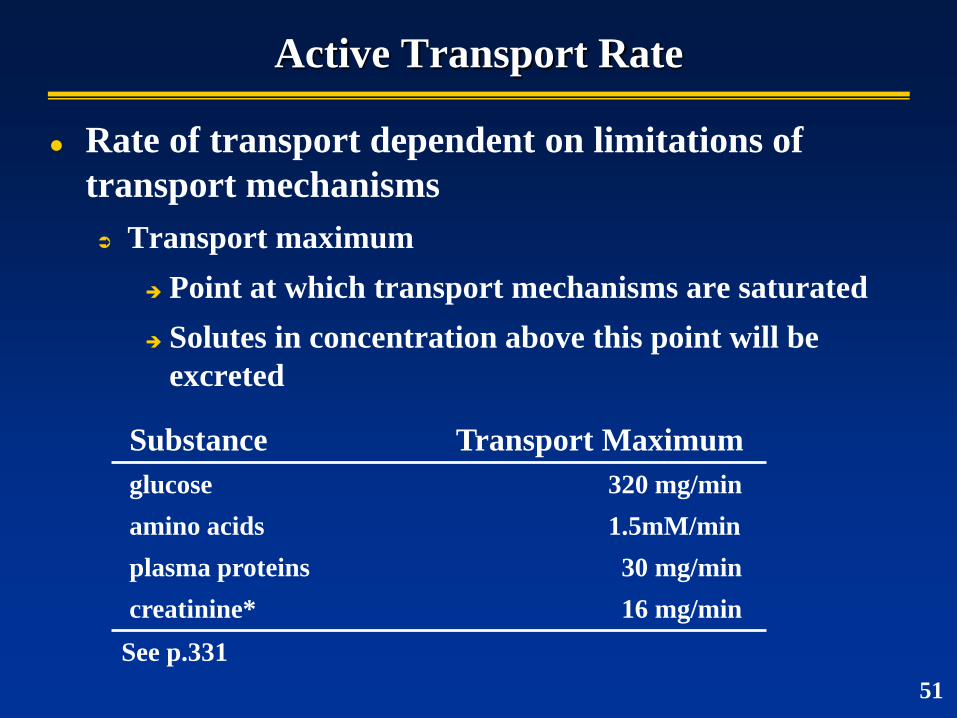
Rate of transport dependent on limitations of
transport mechanisms
Transport maximum
Point at which transport mechanisms are saturated
Solutes in concentration above this point will be
excreted
Substance Transport Maximum
glucose 320 mg/min
amino acids 1.5mM/min
plasma proteins 30 mg/min
creatinine* 16 mg/min
Active Transport Rate
See p.331
51
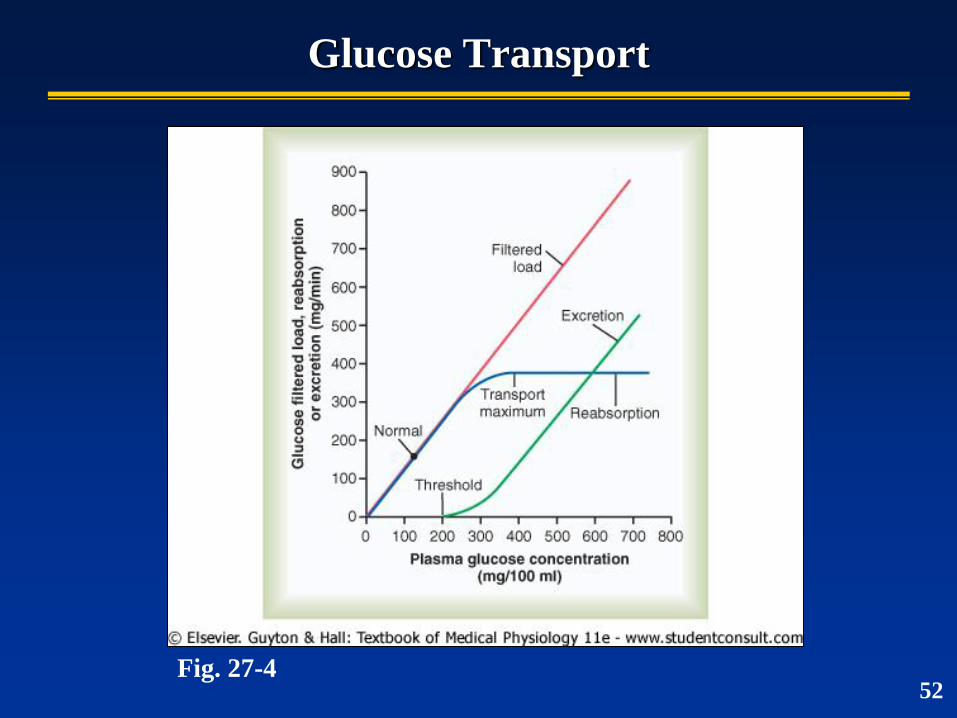
Glucose Transport
Fig. 27-4 52
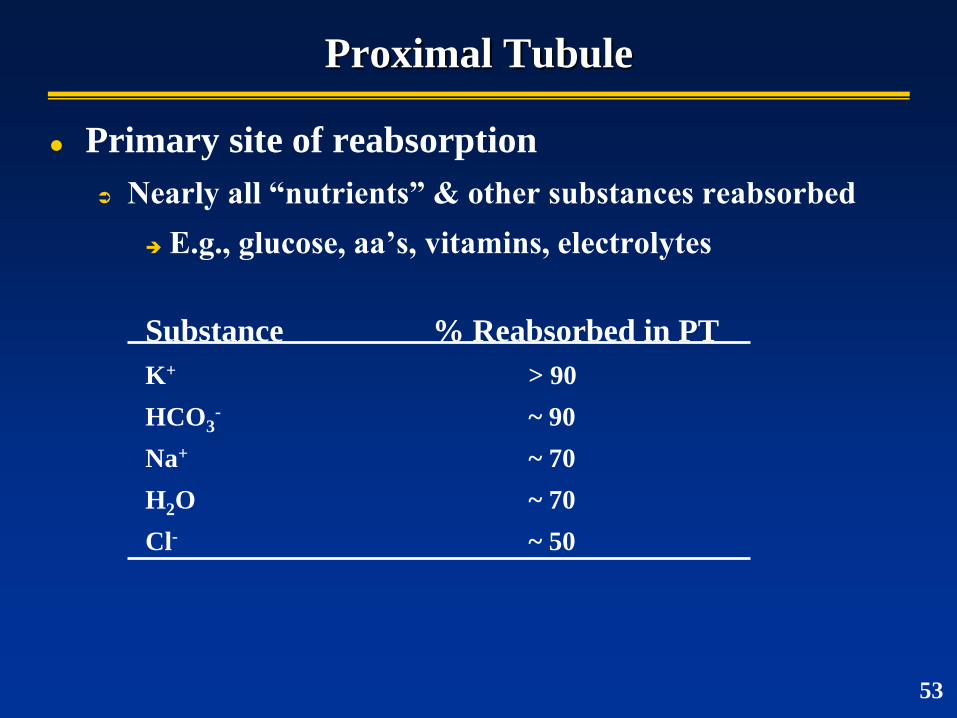
Proximal Tubule
Primary site of reabsorption
Nearly all “nutrients” & other substances reabsorbed
E.g., glucose, aa’s, vitamins, electrolytes
Substance % Reabsorbed in PT
K+ > 90
HCO3- ~ 90
Na+ ~ 70
H2O ~ 70
Cl- ~ 50
53
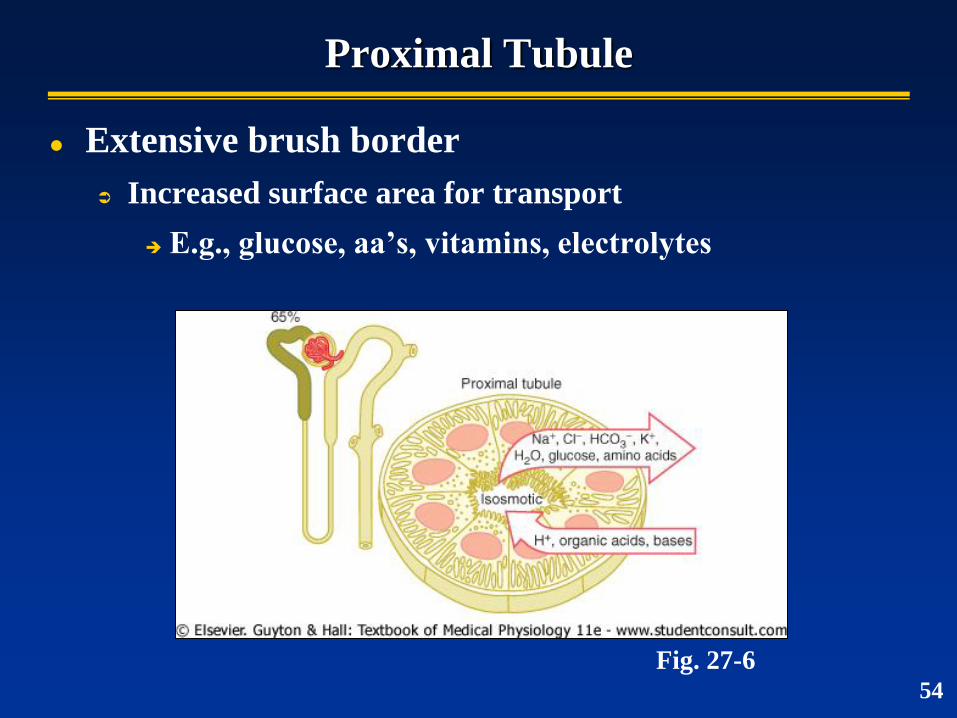
Proximal Tubule
Extensive brush border
Increased surface area for transport
E.g., glucose, aa’s, vitamins, electrolytes
Fig. 27-6 54
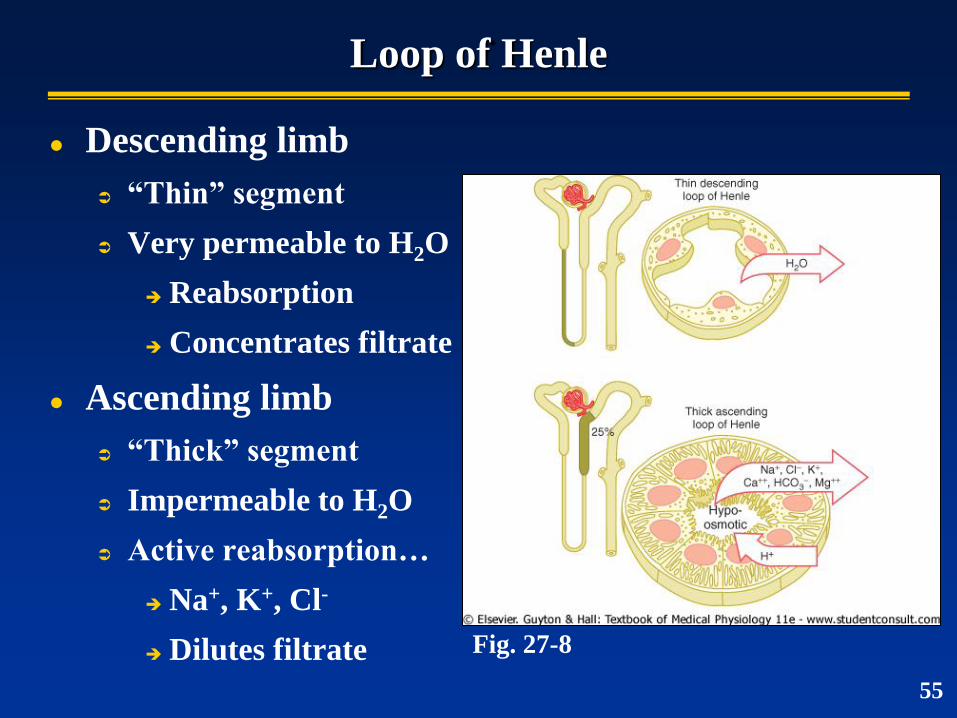
Loop of Henle
Descending limb
“Thin” segment
Very permeable to H2O
Reabsorption
Concentrates filtrate
Ascending limb
“Thick” segment
Impermeable to H2O
Active reabsorption…
Na+, K+, Cl-
Dilutes filtrate Fig. 27-8
55
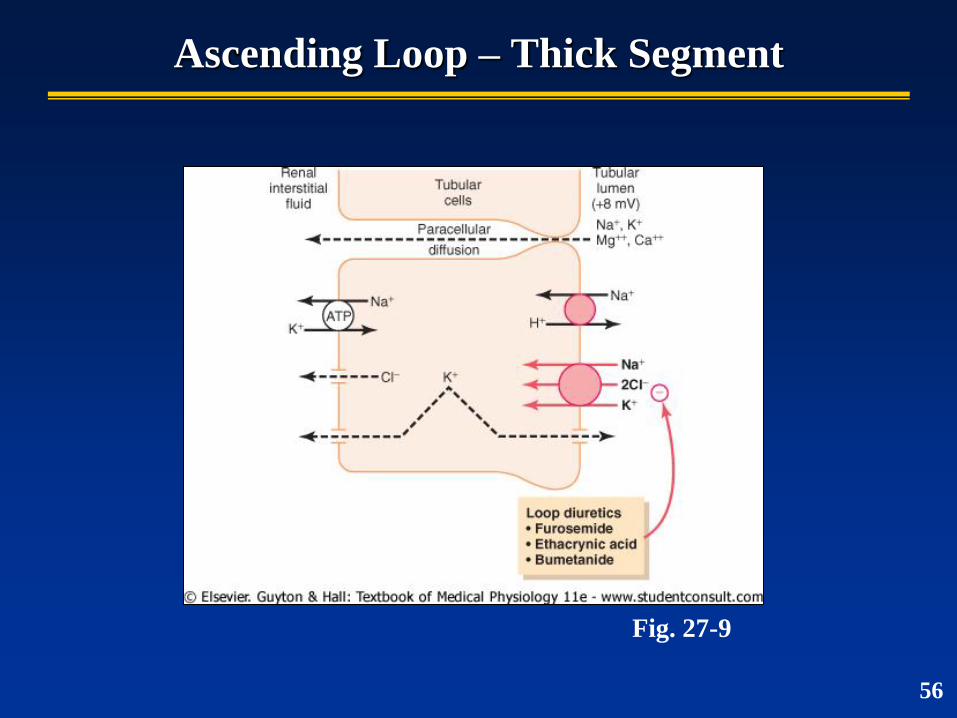
Ascending Loop – Thick Segment
Fig. 27-9
56
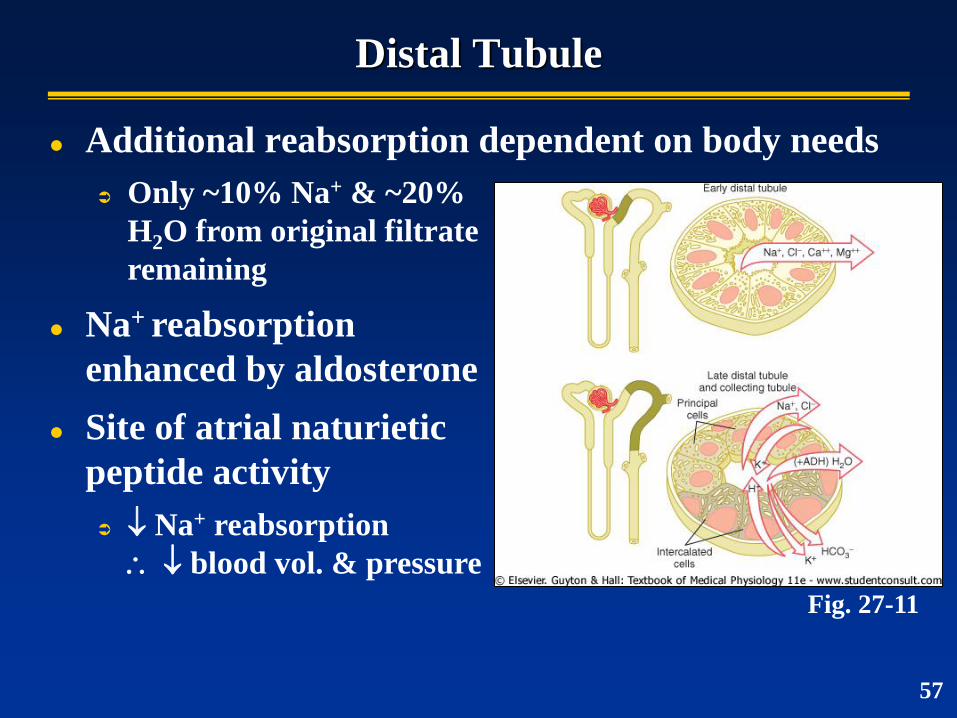
Distal Tubule
Additional reabsorption dependent on body needs
Fig. 27-11
Only ~10% Na+ & ~20%
H2O from original filtrate
remaining
Na+ reabsorption
enhanced by aldosterone
Site of atrial naturietic
peptide activity
Na+ reabsorption
blood vol. & pressure
57
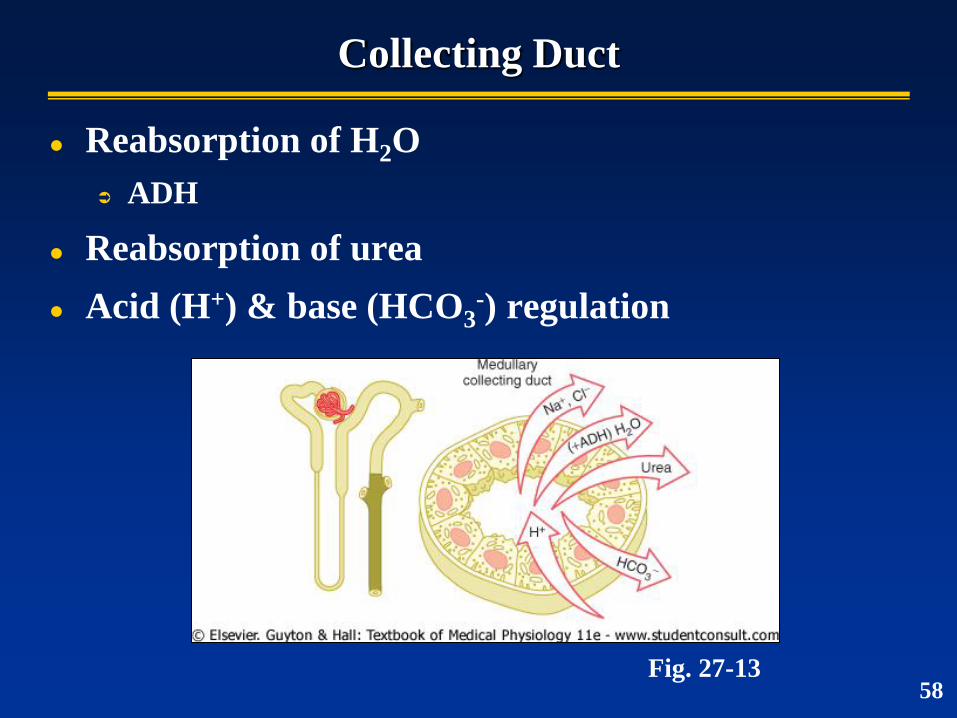
Collecting Duct
Reabsorption of H2O
ADH
Reabsorption of urea
Acid (H+) & base (HCO3-) regulation
Fig. 27-13 58

Solute Concentrations Through the Tubular System
Fig. 27-14 59
Reabsorbed
(needed)
Secreted (not
needed)
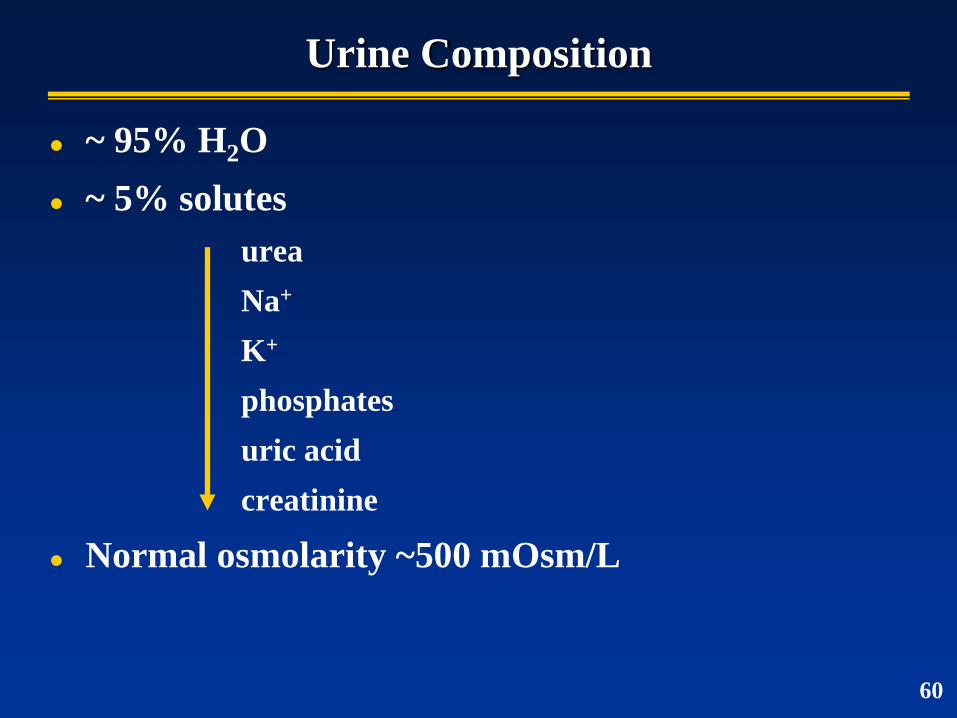
Urine Composition
~ 95% H2O
~ 5% solutes
urea
Na+
K+
phosphates
uric acid
creatinine
Normal osmolarity ~500 mOsm/L
60
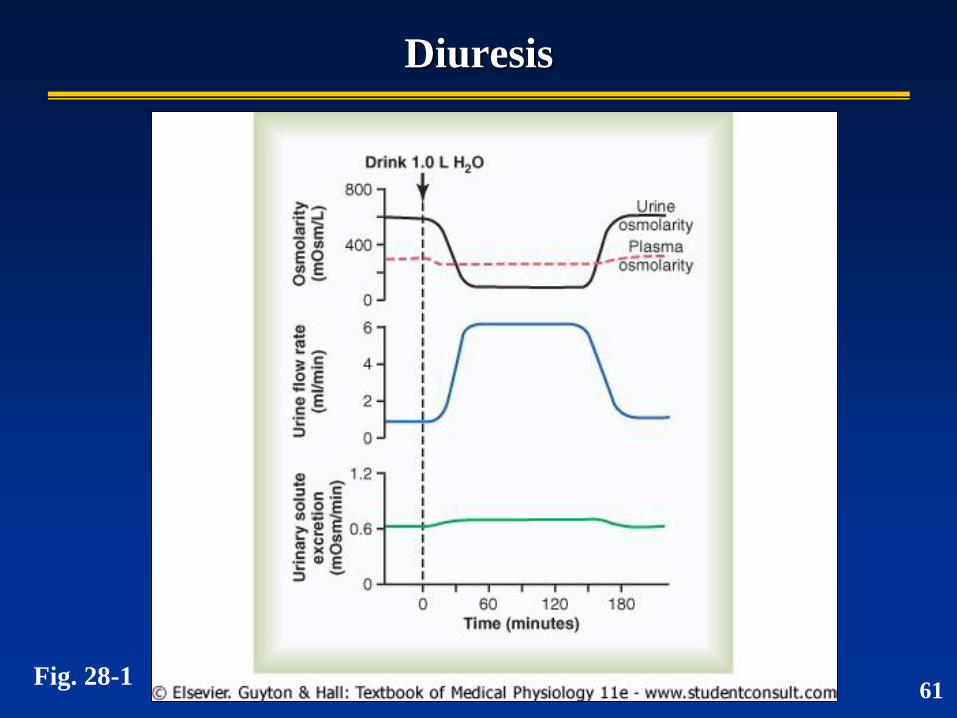
Diuresis
Fig. 28-1 61
Urine Formation
Kidneys can regulate water excretion independent
of solute excretion. Therefore…
Can excrete large volumes of dilute urine
Can excrete small volumes of concentrated urine
Can do both without major changes in rates of solute
excretion
62
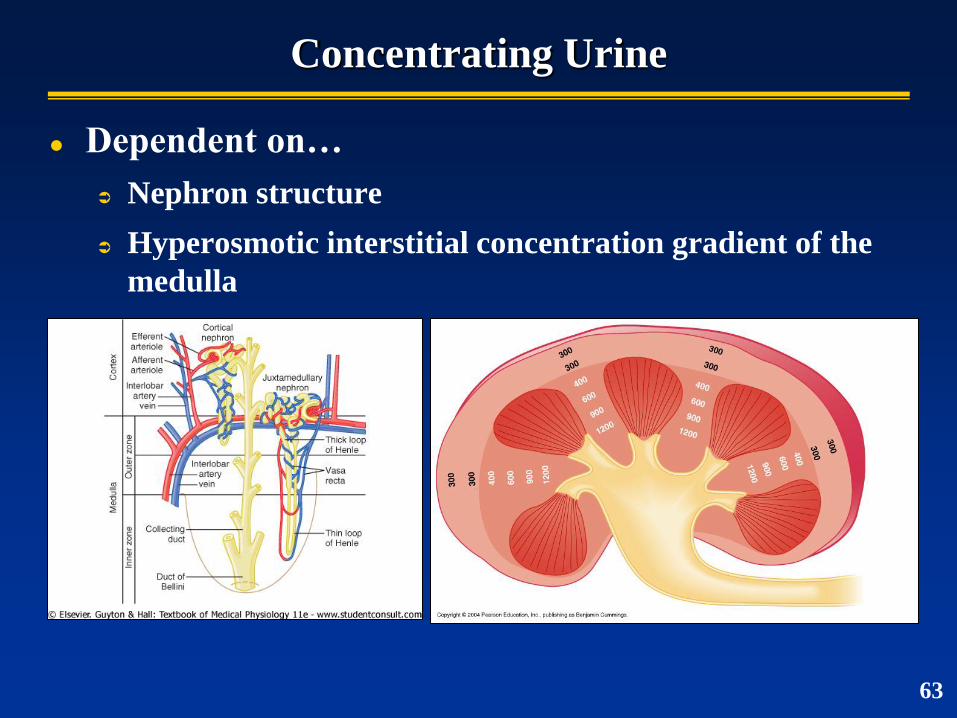
Concentrating Urine
Dependent on…
Nephron structure
Hyperosmotic interstitial concentration gradient of the
medulla
63
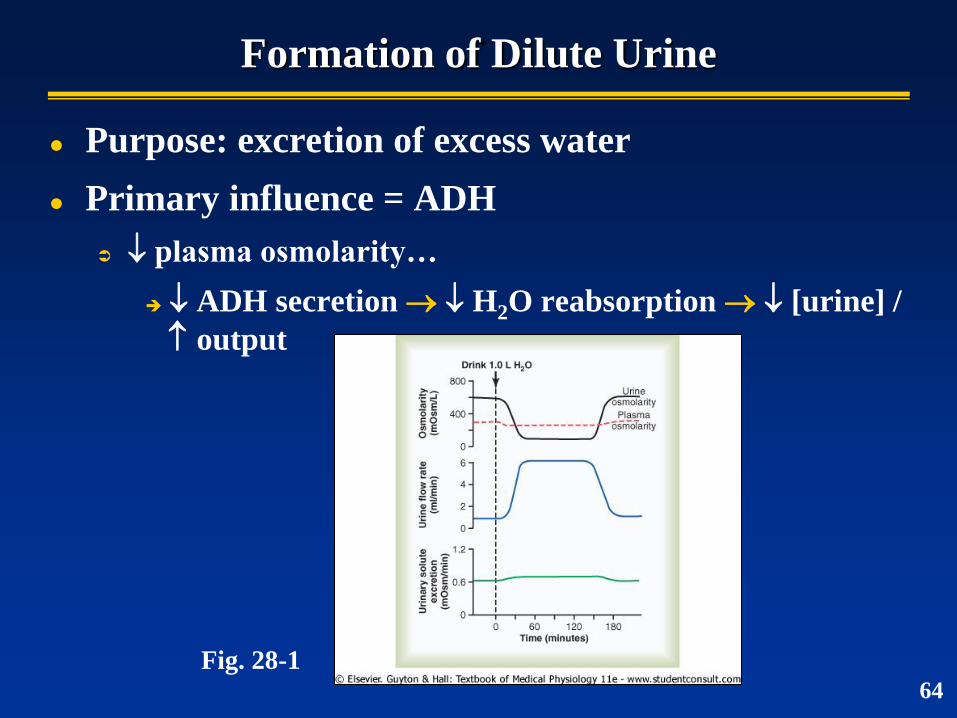
Formation of Dilute Urine
Purpose: excretion of excess water
Primary influence = ADH
plasma osmolarity…
ADH secretion H2O reabsorption [urine] /
output
Fig. 28-1 64
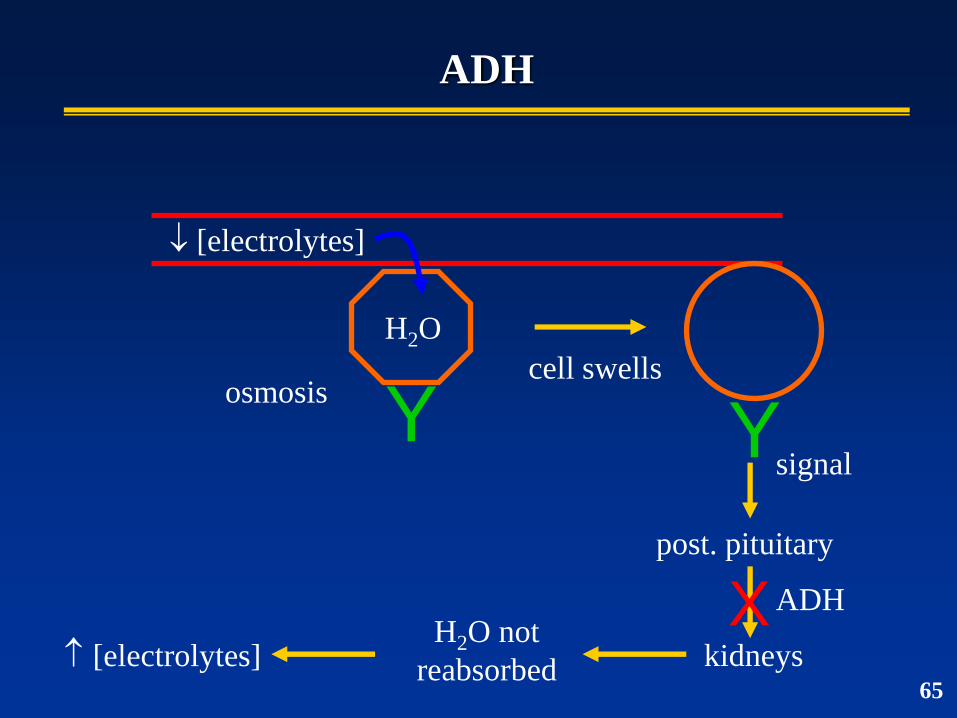
ADH
H2O
osmosis
[electrolytes]
Y Y cell swells
signal
post. pituitary
kidneys
ADH H2O not
reabsorbed [electrolytes]
X 65
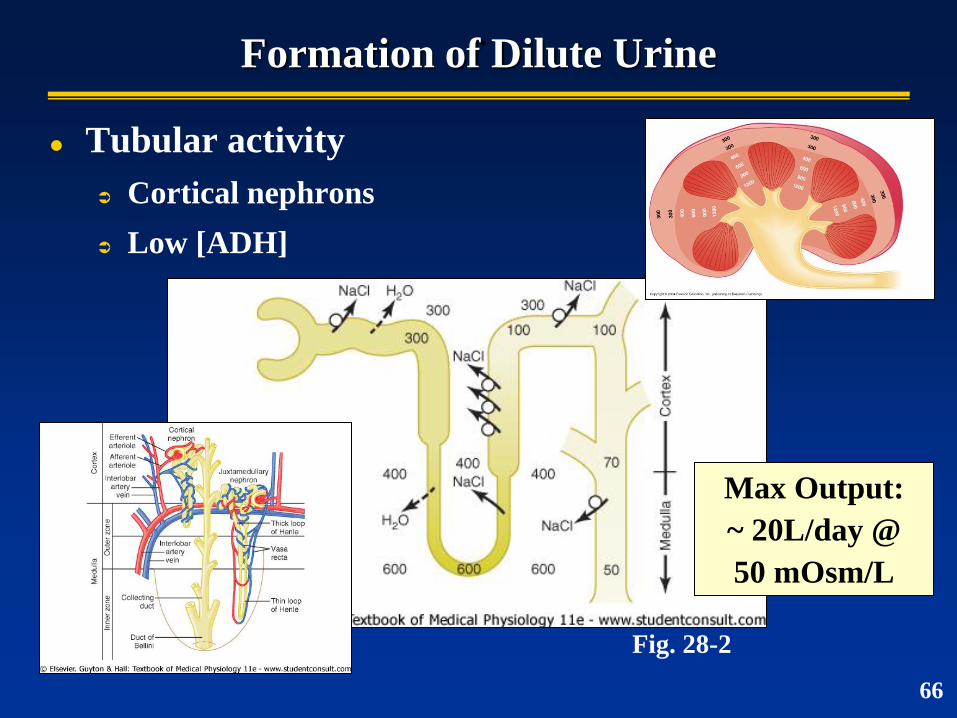
Formation of Dilute Urine
Tubular activity
Cortical nephrons
Low [ADH]
Fig. 28-2
66
Max Output:
~ 20L/day @
50 mOsm/L
Formation of Concentrated Urine
Purpose: water conservation
ADH influence
plasma osmolarity…
ADH secretion H2O reabsorption [urine]
/ output
Influence of the hyperosmotic environment of
renal medulla
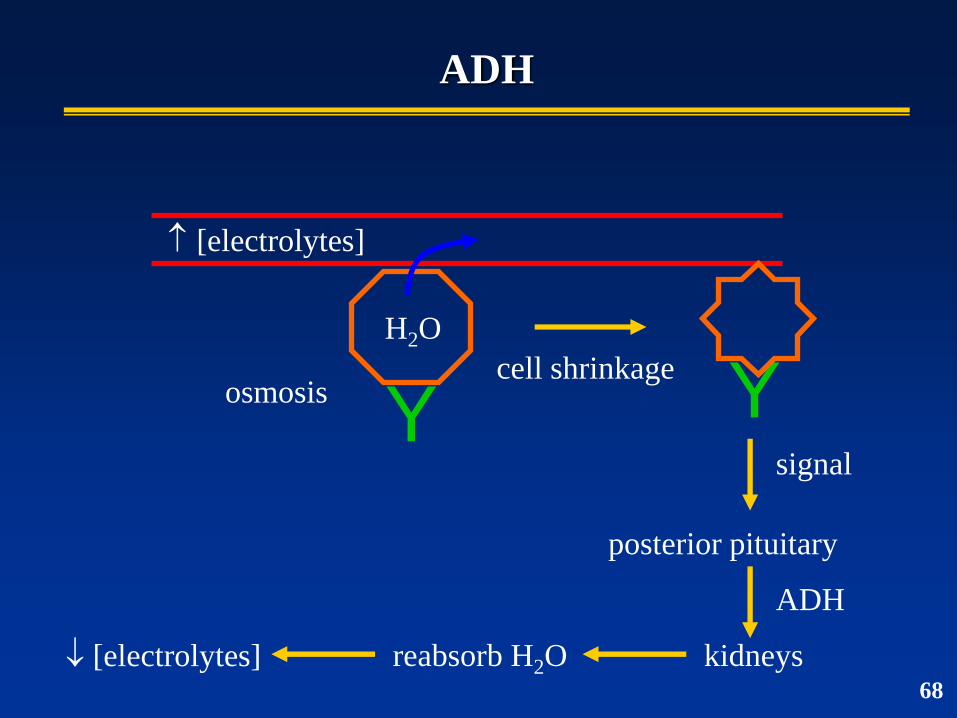
ADH
H2O
osmosis
[electrolytes]
Y Y cell shrinkage
signal
posterior pituitary
kidneys
ADH
reabsorb H2O [electrolytes] 68
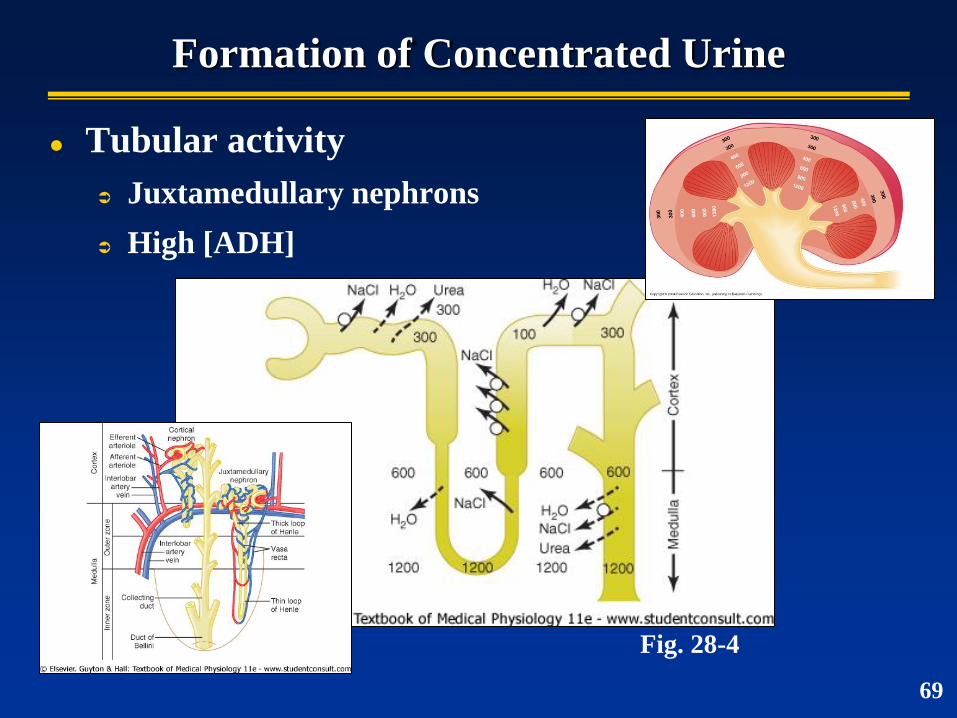
Formation of Concentrated Urine
Tubular activity
Juxtamedullary nephrons
High [ADH]
Fig. 28-4
69
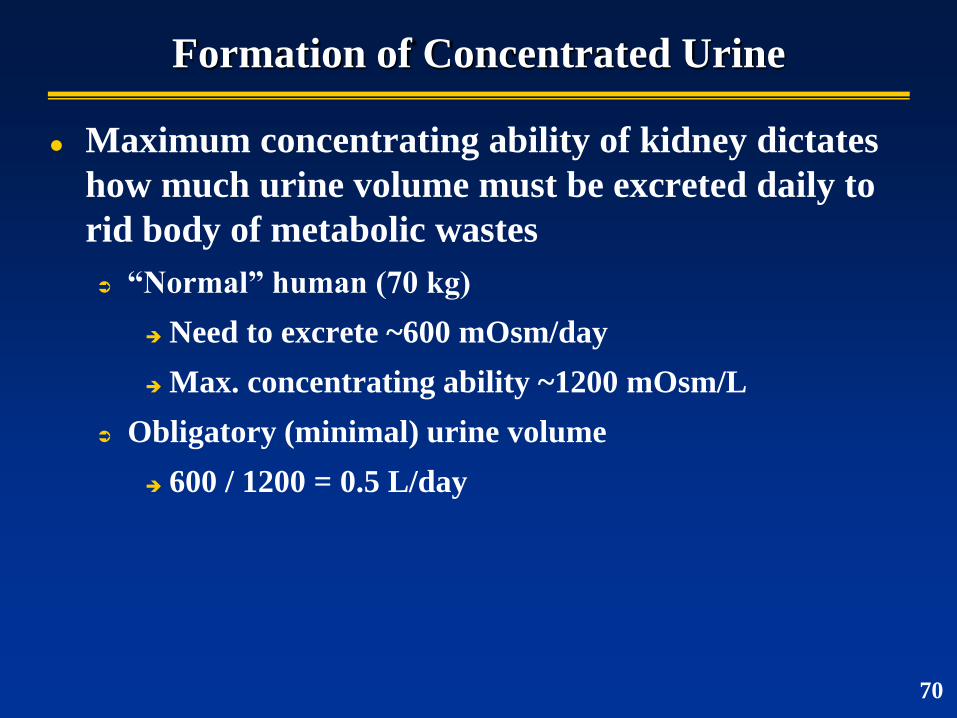
Formation of Concentrated Urine
Maximum concentrating ability of kidney dictates
how much urine volume must be excreted daily to
rid body of metabolic wastes
“Normal” human (70 kg)
Need to excrete ~600 mOsm/day
Max. concentrating ability ~1200 mOsm/L
Obligatory (minimal) urine volume
600 / 1200 = 0.5 L/day
70
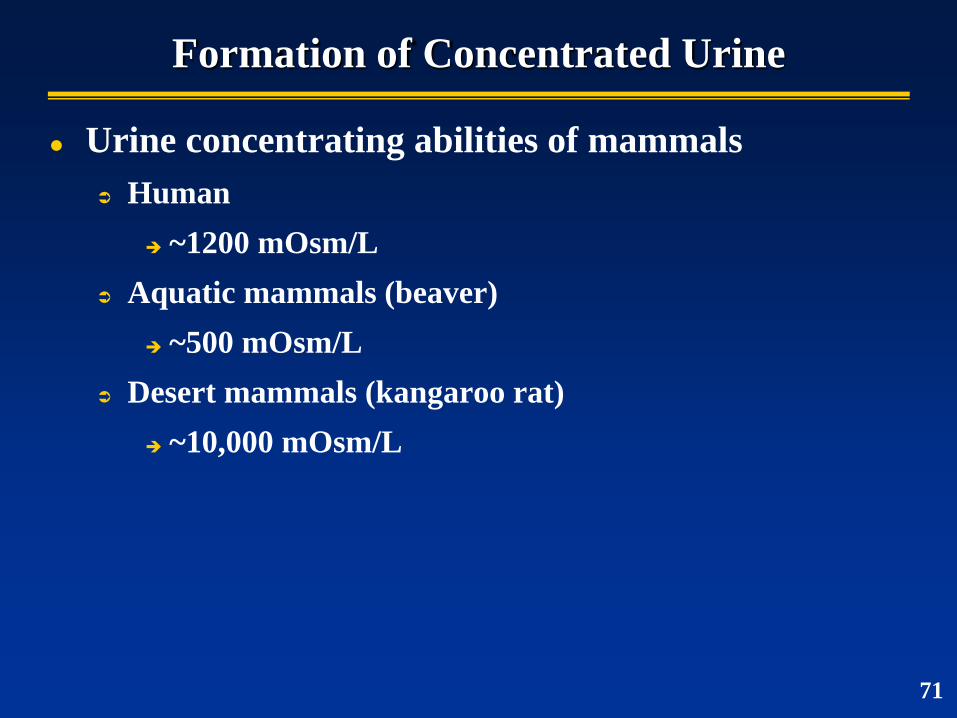
Formation of Concentrated Urine
Urine concentrating abilities of mammals
Human
~1200 mOsm/L
Aquatic mammals (beaver)
~500 mOsm/L
Desert mammals (kangaroo rat)
~10,000 mOsm/L
71
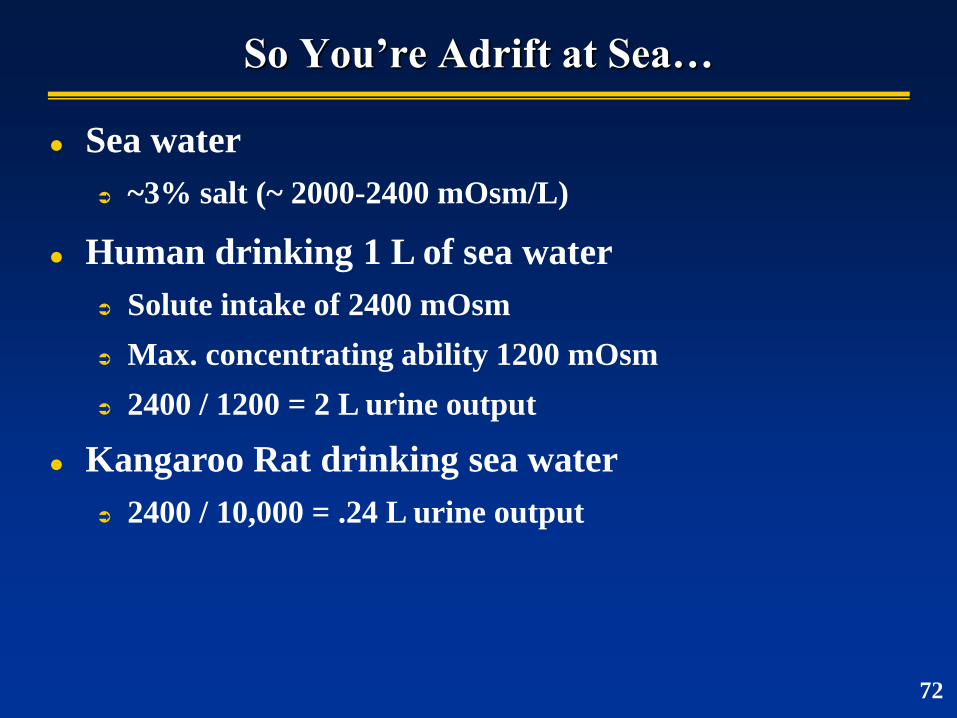
So You’re Adrift at Sea…
Sea water
~3% salt (~ 2000-2400 mOsm/L)
Human drinking 1 L of sea water
Solute intake of 2400 mOsm
Max. concentrating ability 1200 mOsm
2400 / 1200 = 2 L urine output
Kangaroo Rat drinking sea water
2400 / 10,000 = .24 L urine output
72
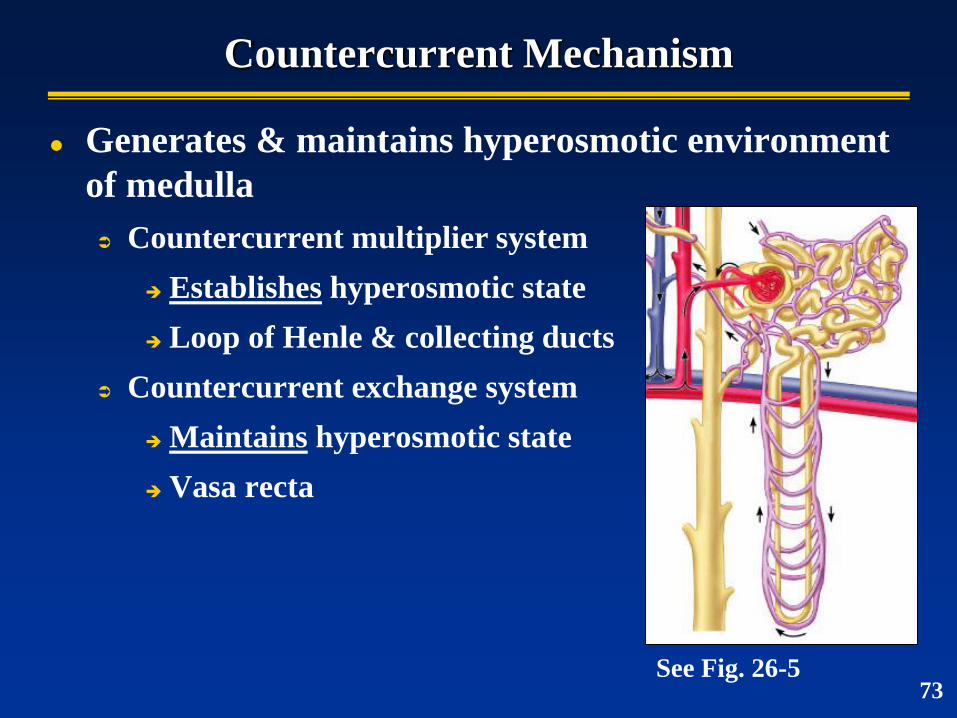
Countercurrent Mechanism
Generates & maintains hyperosmotic environment
of medulla
Countercurrent multiplier system
Establishes hyperosmotic state
Loop of Henle & collecting ducts
Countercurrent exchange system
Maintains hyperosmotic state
Vasa recta
See Fig. 26-5 73
Countercurrent Multiplier System
Major factors contributing to solute buildup in
medulla
Active transport of Na+, K+, Cl- & other ions out of the
loop of Henle (ascending limb)
Active transport of ions from collecting ducts
Diffusion of urea from collecting ducts
Diffusion of only small amounts of water relative to
reabsorption of other solutes
74
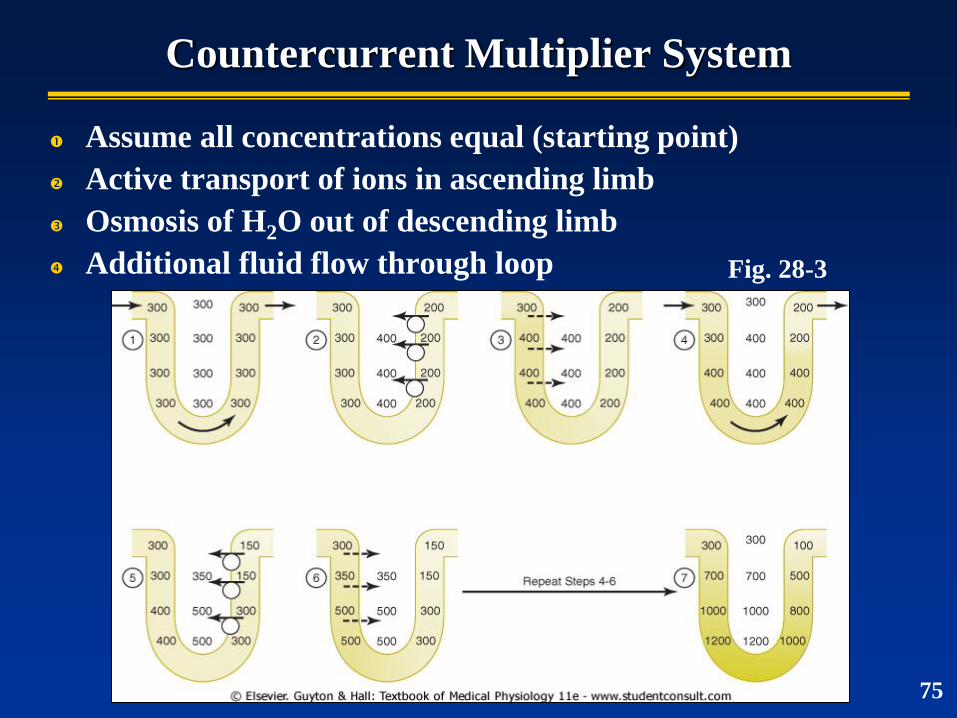
Countercurrent Multiplier System
Assume all concentrations equal (starting point)
Active transport of ions in ascending limb
Osmosis of H2O out of descending limb
Additional fluid flow through loop Fig. 28-3
75
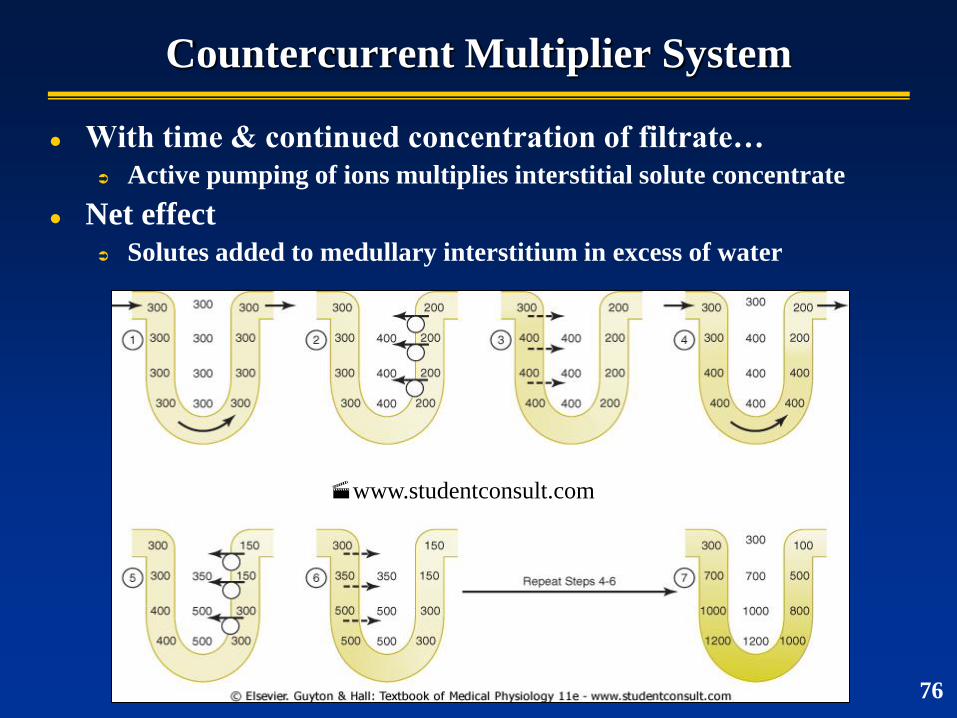
Countercurrent Multiplier System
With time & continued concentration of filtrate…
Active pumping of ions multiplies interstitial solute concentrate
Net effect
Solutes added to medullary interstitium in excess of water
76
www.studentconsult.com
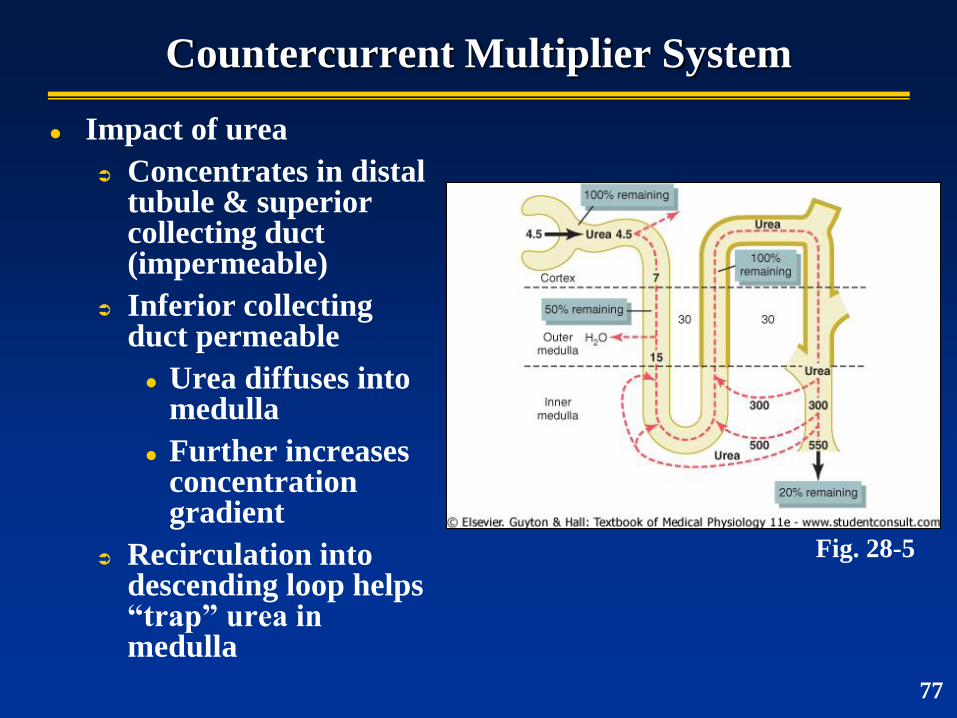
Countercurrent Multiplier System
Impact of urea
Concentrates in distal tubule & superior collecting duct (impermeable)
Inferior collecting duct permeable
Urea diffuses into medulla
Further increases concentration gradient
Recirculation into descending loop helps “trap” urea in medulla
Fig. 28-5
77
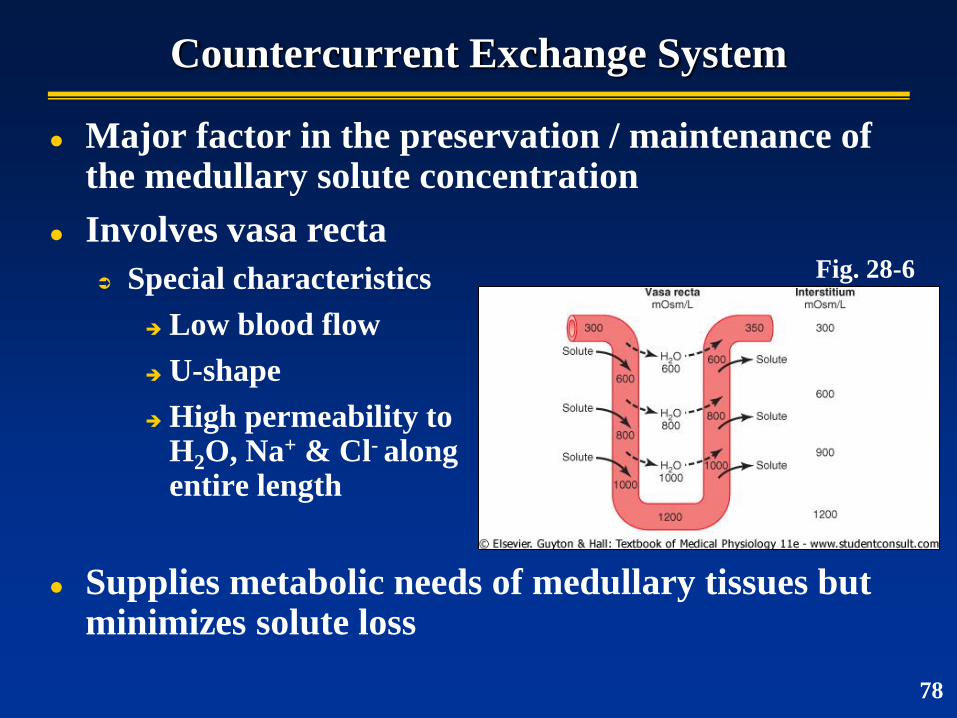
Countercurrent Exchange System
Major factor in the preservation / maintenance of the medullary solute concentration
Involves vasa recta
Special characteristics
Low blood flow
U-shape
High permeability to H2O, Na+ & Cl- along entire length
Supplies metabolic needs of medullary tissues but minimizes solute loss
Fig. 28-6
78
Renal Clearance
The volume of plasma completely cleared of a
substance per unit time
Use to quantify kidney function
79
Use to Estimate GFR
Conditions for accurate determination
Freely filterable
Not reabsorbed or secreted
GFR = Cs
Renal Clearance
Clearance rate (ml/min)
Cs = (Us x V) / Ps
Us = [urine]of substance, V = urine flow rate, PS = [plasma] of substance
80
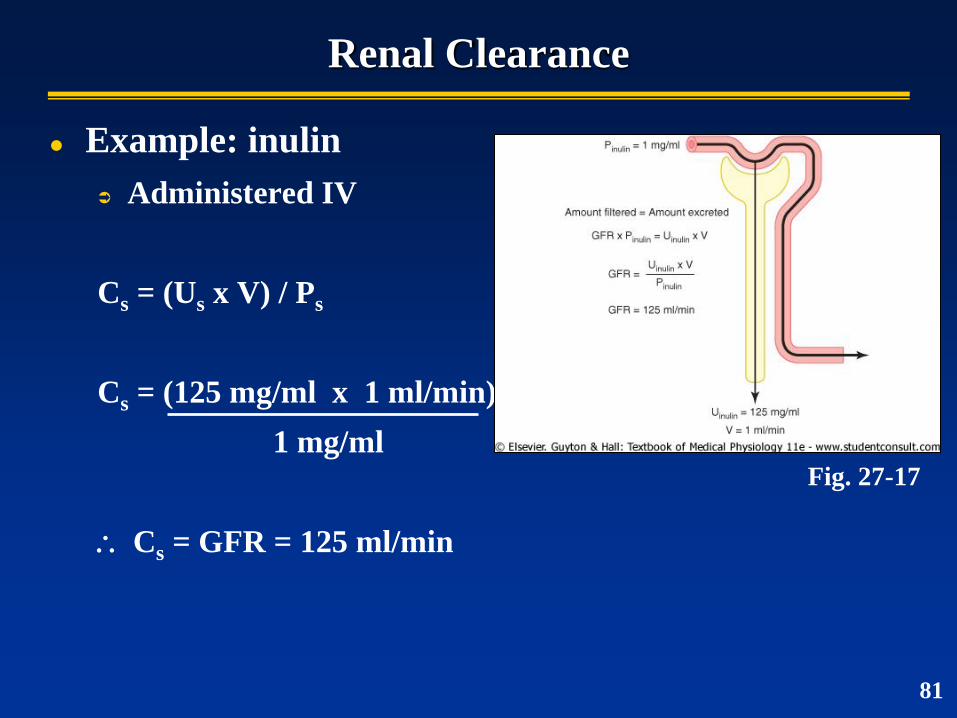
Renal Clearance
Example: inulin
Administered IV
Cs = (Us x V) / Ps
Cs = (125 mg/ml x 1 ml/min)
1 mg/ml
Cs = GFR = 125 ml/min
Fig. 27-17
81
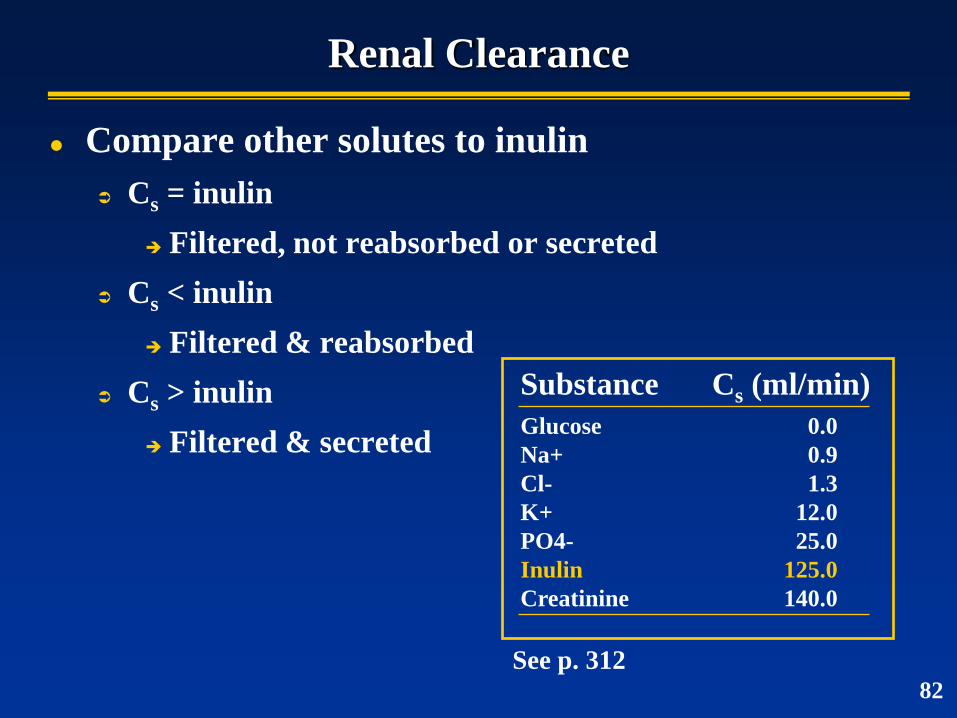
Renal Clearance
Compare other solutes to inulin
Cs = inulin
Filtered, not reabsorbed or secreted
Cs < inulin
Filtered & reabsorbed
Cs > inulin
Filtered & secreted
See p. 312
Substance Cs (ml/min)
Glucose 0.0
Na+ 0.9
Cl- 1.3
K+ 12.0
PO4- 25.0
Inulin 125.0
Creatinine 140.0
82
Kidney Failure & Hemodialysis
Loss of kidney function
Infection, trauma, toxin poisoning, inadequate blood
flow
Hemodialysis
Use semipermeable membrane to facilitate solute
transfer between patient blood and dialyzing fluid
83
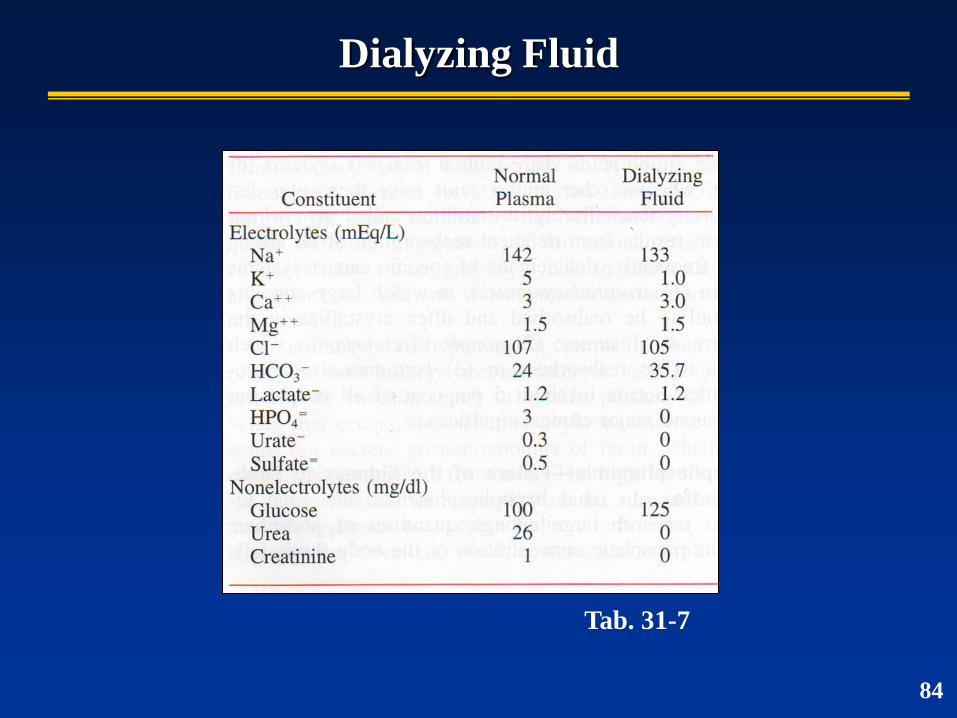
Dialyzing Fluid
Tab. 31-7
84
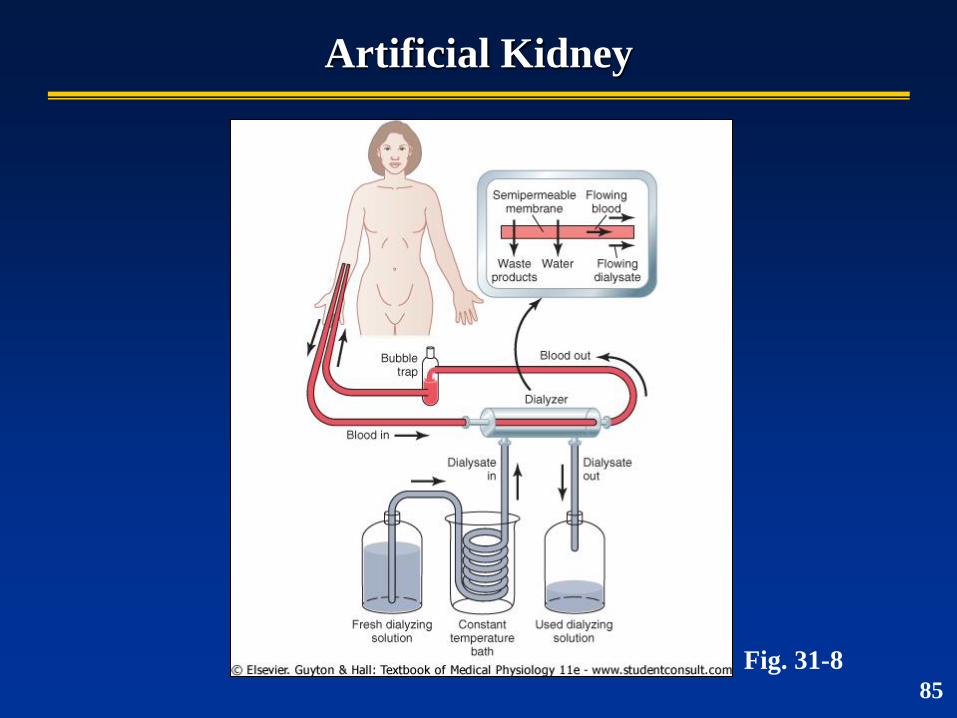
Artificial Kidney
Fig. 31-8 85