urchin embryo nih public access multiple modules to ... · as a service to our customers we are...
TRANSCRIPT

The cis-regulatory system of the tbrain gene: alternative use ofmultiple modules to promote skeletogenic expression in the seaurchin embryo
Mary E. Wahla, Julie Hahnb, Kasia Gorac, Eric H. Davidsonb, and Paola Oliverid,*a Department of Molecular and Cellular Biology, Harvard University, 16 Divinity Avenue, Cambridge,MA 02138, USAb Division of Biology, California Institute of Technology, Pasadena, CA 91125, USAc Department of Biology, Massachusetts Institute of Technology, 77 Massachusetts Avenue,Cambridge, MA 02139d Department of Genetics, Evolution and Environment, University College London, Gower Street,London WC1E 6BT, UK
AbstractThe genomic cis-regulatory systems controlling regulatory gene expression usually include multiplemodules. The regulatory output of such systems at any given time depends on which module isdirecting the function of the basal transcription apparatus, and ultimately on the transcription factorinputs into that module. Here we examine regulation of the S. purpuratus tbrain gene, a requiredactivator of the skeletogenic specification state in the lineage descendant from the embryomicromeres. Alternate cis-regulatory modules were found to convey skeletogenic expression inreporter constructs. To determine their relative developmental functions in context, we made use ofrecombineered BAC constructs containing a GFP reporter, and of derivatives from which specificmodules had been deleted. The outputs of the various constructs were observed spatially by GFPfluorescence and quantitatively over time by QPCR. In the context of the complete genomic locus,early skeletogenic expression is controlled by an intron enhancer plus a proximal region containinga HesC site as predicted from network analysis. From ingression onward, however, a dedicated distalmodule utilizing positive Ets1/2 inputs contributes to definitive expression in the skeletogenicmesenchyme. This module also mediates a newly-discovered negative Erg input which excludes non-skeletogenic mesodermal expression.
Keywordstbrain gene; Gene regulatory network; cis-Regulatory analysis; Skeletogenic micromere lineage;Recombinant BAC
© 2009 Elsevier Inc. All rights reserved.*Corresponding author. [email protected] (P. Oliveri).Publisher's Disclaimer: This is a PDF file of an unedited manuscript that has been accepted for publication. As a service to our customerswe are providing this early version of the manuscript. The manuscript will undergo copyediting, typesetting, and review of the resultingproof before it is published in its final citable form. Please note that during the production process errors may be discovered which couldaffect the content, and all legal disclaimers that apply to the journal pertain.
NIH Public AccessAuthor ManuscriptDev Biol. Author manuscript; available in PMC 2010 November 15.
Published in final edited form as:Dev Biol. 2009 November 15; 335(2): 428–441. doi:10.1016/j.ydbio.2009.08.005.
NIH
-PA Author Manuscript
NIH
-PA Author Manuscript
NIH
-PA Author Manuscript
IntroductionThe sea urchin regulatory gene tbrain (tbr) is zygotically expressed in the skeletogenicmesoderm (SM) of the cleavage and blastula stage embryo (Croce et al., 2001; Oliveri et al.,2002), and its expression is required for the postgastrular formation of the larval spicules(Fuchikami et al., 2002). Through transcriptional activation of a target gene, erg,tbr establishesan erg-hex-tgif-alx1 positive feedback circuit that maintains the regulatory state of theskeletogenic mesoderm (SM) domain from early in development, and eventually, together withother regulators, serves as a transcriptional driver of an initial set of differentiation genes(Oliveri et al., 2008). The tbr gene thus has essential roles, first in specification of the SM andthen in definitive larval skeletogenesis. Yet these roles, and the circuitry underlying them, areevolutionarily derived traits, since only modern sea urchins precociously segregate a SMlineage. In the sister group to the echinoids, the sea cucumbers, tbr is expressed in thedeveloping endomesoderm (Maruyama, 2000). This is the pleisiomorphic function of the tbrgene in embryogenesis, since it is also expressed in endomesoderm in the more distant sea staroutgroup (Hinman and Davidson, 2007; Hinman et al., 2003; Shoguchi et al., 2000). Thus froman evolutionary standpoint the tbrcis-regulatory system is of particular interest since it mustbe at least partly “new”, and since it is a key mechanistic component of the skeletogenicmicromere specification network: this, as a whole, is in itself a derived embryonic feature ofthe modern sea urchins (euechinoids).
Despite the simple pattern of tbr expression, which is confined entirely to the SM lineagethroughout embryonic development, the cis-regulatory system of the tbr gene is anything butsimple. Typically for regulatory genes (c.f. Davidson, 2006), tbr is controlled by multiple cis-regulatory modules. Regulatory modules were identified in an intron as well as proximally inthe closely related (actually congeneric) strongylotrotid known as Hemicentrotuspulcherrimus (Ochiai et al., 2008). A different, also completely specific skeletogenic cis-regulatory module exists some distance upstream of the gene in S. purpuratus, as we describebelow. A major objective of this work was to resolve the various roles of these modules. Generegulatory network analysis had shown that tbr lies under control of a double negative gate(Oliveri et al., 2002; Oliveri et al., 2003; Oliveri et al., 2008; Revilla-i-Domingo et al., 2007).Thus the early zygotically expressed micromere repressor Pmar1 acts to prevent transcriptionin micromeres of the hesC gene, which encodes a dedicated repressor zygotically expressedeverywhere in the embryo except in micromeres expressing the pmar1 gene. Among the targetsof HesC repression is tbr, along with a small number of other initial founders of the SMregulatory state. The double negative gate thus results in derepression of the tbr gene in theSM lineage. The putative site of HesC interaction in tbrcis-regulatory DNA had been identified(Ochiai et al., 2008), but there was little detailed information as to hesC effects on the tbrcis-regulatory system. In addition cis-regulatory mutations as well as other evidence indicated thatsome member(s) of the Ets family of transcription factors are required for tbr expression(Fuchikami et al., 2002; Ochiai et al., 2008). On the other hand, it had also been reported thatmorpholino-substituted antisense oligonucleotides (MASO) directed against the S.purpuratus Ets family members SpErg, SpEts1/2, and SpTel had no very significant effect (i.e.,caused <3-fold change) on tbr expression up to 24hpf (Oliveri et al., 2008). The role of Etsfactors in tbr regulation altogether was clearly in need of further investigation. An additionalmystery was that by late mesenchyme blastula stage hesC expression disappears from the non-skeletogenic mesenchyme (NSM) (Smith and Davidson, 2008b), and ets expression spreadsto include the NSM (Rizzo et al., 2006); yet tbr expression does not expand, remaining confinedto the SM. Thus there appeared to be a need for either an additional yet unidentified NSMrepressor of tbr expression, or a spatially-dedicated SM activator of tbr in later stages.
These issues are resolved in the cis-regulatory analyses described in this paper. The approachwe have taken differs from the conventional in that we have attempted to examine cis-
Wahl et al. Page 2
Dev Biol. Author manuscript; available in PMC 2010 November 15.
NIH
-PA Author Manuscript
NIH
-PA Author Manuscript
NIH
-PA Author Manuscript
regulatory modular function in the context of the complete genomic tbr locus. To this end weutilized recombineered BAC reporters bearing module deletions or site mutations. Thus wehave been able to establish the sequence of module deployment as well as determine thefunctionality of key transcription factor target sites. Perhaps not surprisingly, some of theinsights we obtained as to module function in context proved invisible from the vantage pointof the usual minimal expression constructs.
Materials and methodsBAC homologous recombination
Deletions of the γ(2), B, and C modules from an SpTbrain GFP knock-in BAC (Damle et al.,2006) by homologous recombination were performed as described by Lee et al. (2007). Theparental BAC is referred to as tbr::GFP BAC in the following. To produce a targeting cassettewith homology to the regions bordering each module, a kanamycin resistance gene flanked byfrt sites was amplified with the following primer pairs:
Δγ (2) module-Forward: 5′-GACATAGGTATTTCCTTATACATCGTCATGATTATGGTTACACTCTCTAGATAACTGATCAGCTT-3′
Δγ (2) module-Reverse: 5′-ATATATCTATAATTATATGGAATAAATTCCATGAAATCTCATGTGGAGCTATTCCAGAAGTAGTGA-3′
ΔB module-Forward: 5′-GGTAGTCACAAAGCCCAAATACCTTACAAGCTCCTCTTTTATGTCGGAGTATCTTAAGTACTCTTTGTAAAGCTGTCTAATTTTCCTGATTCTAGATAACTGATCAGCTT-3′
ΔB module-Reverse: 5′-AAATTCGTACGTTACTTTGAAATGAACCGACAATGCGGATTATAAGAGCTATTCCAGAAGTAGTGA-3′
ΔC module-Forward: 5′-CAGCTTAGGCACTTTAACAAAAAAAGAGTCTTTAGAATTCTTTGATCTAGATAACTGATCAGCTT-3′
ΔC module-Reverse: 5′-GAGCAAATCCTACATGATATCTACAGACATCATCAGATGCTTCAGGAGCTATTCCAGAAGTAGTGA-3′
Underlined sequences are homologous to the targeting cassette. Correct integration of thecassette into tbr::GFP BAC was confirmed by sequencing and diagnostic PCR. After removalof kanR by induction of flippase, a 125bp artifact of the cassette remained in the former locationof each module.
To avoid undesired flippase recombination with a frt site at the GFP insertion site, mutationof the HesC binding site on tbr::GFP BAC was performed using a GalK positive/negativeselection method (Warming et al., 2005). A targeting cassette containing galK was amplifiedwith the following primers to introduce homology to the region flanking the HesC binding site:
HesCmut-cassette-Forward: 5′-CAGACTATTTTTTCTTCTTCGTCGTCGTCTAAATGTTATTTCGAGTCGCCTGTTGACAATTAATCATC-3′
Wahl et al. Page 3
Dev Biol. Author manuscript; available in PMC 2010 November 15.
NIH
-PA Author Manuscript
NIH
-PA Author Manuscript
NIH
-PA Author Manuscript
HesCmut-cassette-Reverse: 5′-GGGCTACCAGACAATGGAGAGTCGCGCGTTGATTGGCCGCCAGGGAGGTCAGCACTGTCCTGCTCCTT-3′.
Underlined sequences are homologous to the targeting cassettes. After proper insertion wasconfirmed by sequencing and diagnostic PCR, the cassette was replaced with the mutated HesCsite through homologous recombination with the following annealed oligonucleotides:
HesCmut-cassette-removal-Forward: 5′-CAGACTATTTTTTCTTCTTCGTCGTCGTCTAAATGTTATTTCGAGTCGGACTCCTCCCT GGCGGCCAATCAACGCGCGACTCTCGATTGTCTGGTAGCCC-3′
HesCmut-cassette-removal-Reverse: 5′-GGGCTACCAGACAATCGAGAGTCGCGCGTTGATTGGCCGCCAGGGAGGAGTCCGACTCGAAATAACATTTAGACGACGACGAAGAAGAAAAAATAGTCTG-3′.
Generation of cis-regulatory reporter constructsThe γ(2)::EpGFP construct, in which the γ(2) regulatory region drives GFP expression fromthe endo16 basal promoter (Yuh and Davidson, 1996; Yuh et al., 1996), was produced by fusionPCR (Yon and Fried, 1989). The γ(2) fragment was amplified from SptbrBAC (clone 31;J08from arrayed library) using γ(2)-Forward and γ(2)-EpGFP-Reverse primers. EpGFP wasamplified from the EpGFPII expression vector (Cameron et al., 2004) using γ(2)-EpGFP-Forward and GFP-Reverse primers. The fusion product was amplified using both fragmentsand the γ(2)-Forward and GFP-Reverse primers. The resulting fragment was cloned intoPromega pGEM-T Easy vector (Catalog #A1360) and fully sequenced to confirm properfusion. The γ(2)::EpGFP reporter construct was then amplified from the plasmid using γ(2)-Forward and GFP-Reverse to produce linear fragments for injection.
γ(2)-Forward:5′-GTCTCTAGCAAGATATGTTACT-3′
γ(2)-EpGFP-Reverse: 5′-ACAGTTTAACCCGGGAGATCTACTCTATAAACCACTACTGTACTCTA-3′
γ(2)-EpGFP-Forward: 5′-TAGAGTACAGTAGTGGTTTATAGAGTAGATCTCCCGGGTTAAACTGT-3′ GFP-Reverse:5′-ACTGGGTTGAAGGCTCTCAA-3′
The Stratagene QuikChange Mutagenesis Kit (catalog #200518) was used to mutate or deleteputative transcription factor binding sites on the γ(2)::EpGFP plasmid. The resulting plasmidswere sequenced to confirm introduction of the mutation. The following primer pairs were usedto produce the otxmut γ(2)::EpGFP and complex Δγ(2)::EpGFP plasmids:
Otxmut γ(2)::EpGFP-Forward: -CTGGTGATCGGTCAACTGATTCCTTCCGGTTGGACGTGAA-3′
Otxmut γ(2)::EpGFP-Reverse: 5′-TTCACGTCCAACCGGAAGGAATCAGTTGACCGATCACCAG-3′
Complex Δγ(2)::EpGFP-Forward: 5′-TGTGCGTGCTTTACACCTGTCTGGTGATCG-3′
Complex Δγ(2)::EpGFP-Reverse: 5′-CGATCACCAGACAGGTGTAAAGCACGCACA-3′
Complex Δγ (2)::EpGFP-Reverse: 5′-CGATCACCAGACAGGTGTAAAGCACGCACA-3′. The mutated clones werechecked by sequencing.
Wahl et al. Page 4
Dev Biol. Author manuscript; available in PMC 2010 November 15.
NIH
-PA Author Manuscript
NIH
-PA Author Manuscript
NIH
-PA Author Manuscript
Ets and bHLH binding site mutations were introduced into γ(2)::EpGFP by fusion PCR. “Left”fragments (produced using γ(2)-Forward and the mutation's reverse primer) and “right”fragments (amplified with GFP-Reverse and the mutation's forward primer) were mixed toproduce a megaprimer template for fusion PCR with γ(2)-Forward and GFP-Reverse primers.The resulting full-length fragment was gel-purified and ligated into pGEM-T Easy vector forsequencing and amplification. The etsmut1+2 γ(2)::EpGFP construct was produced usingetsmut1 γ(2)::EpGFP as a template for fusion PCR with the etsmut2 mutation primers.
Etsmut1-Forward: 5′-GTCATTGACCTCAGATAGTCTGGTGATCG-3′
Etsmut1-Reverse: 5′-TCACCAGACTATCTGAGGTCAATGACCGCTT-3′
Etsmut2-Forward: 5′-CGAAGTTCACGTCCAAGAATCTGGGATTAGTT-3′
Etsmut2-Reverse: 5′-GTCAACTAATCCCAGATACTTGGACGTGAA-3′
bHLHmut-Forward: 5′-CATTGACCTCTTCCTGCTACATGATCGGTCA-3′
bHLHmut-Reverse: 5′-AGTTGACCGATCATGTAGCAGGAAGAGGT-3′
The γ(2) module was located by reiterative reporter assays as described (Smith and Davidson,2008a). εδγβα::GFP was produced by fusion PCR between the 5′ intergenic region of tbr(amplified from SptbrBAC using TbrA-Forward and TbrA-Reverse primers) and GFPamplified with primers homologous to the basal promoter of tbr (εδγβα-GFP-Forward andGFP-Reverse). εδγβα::GFP was obtained by the same scheme using a different GFP forwardprimer, εδγβα-GFP-Forward. PCR fragments were cloned into pGEM-T Easy vector andsequenced. The εδγβα::GFP, γβα::GFP, βα::GFP, and α::GFP reporter constructs wereproduced from εδγβα::GFP using GFP-Reverse and the corresponding forward primers.γα::GFP, γ::EpGFP, and γ(2)α::GFP were generated by fusion PCR using an analogousmethod.
TbrA-Forward: 5′-GGAACGATACGAAAACTTTG-3′
TbrA-Reverse:5′-CTTAGGACCGTGTTATATAC -3′
εδγβα-Forward:5′-CAGACAATCTAGATTGCCTA-3′
γβα-Forward:5′-TATAGGACCGTGTTATATACCTC-3′
βα-Forward:5′-TATGTGTGCATGACTTTGCTT-3′
α-Forward: 5′-AGATGGTTATTCTTCCAGACTA-3′
Shortened fragments of γ(2)::EpGFP were produced by PCR amplification of γ(2)::EpGFPusing GFP-Reverse as a reverse primer and the following forward primers: γ(2.1)-Forward, γ(2.2)-Forward, γ(2.3)-Forward, γ(2.4)-Forward. These fragments were cloned into pGEM-TEasy vector and sequenced. The reporter fragment γ(2.2-3)::EpGFP was produced by fusionPCR between the amplified region between the primers γ(2.2)-Forward and γ(2.3)-Forward(using γ(2.2)-Forward and γ(2.3)-Reverse) as well as amplified EpGFP with homology to γ(2.3) produced by amplification with GFP-Reverse and γ(2.3)-EpGFP-Forward.
γ(2.1)-Forward:5′-CATTTATTCGATCATCGA-3′
γ(2.2)-Forward:5′-TGCTTTACAGTGATAACA-3′
γ(2.3)-Forward:5′-TTGGACGTGAACTTCGA-3′
γ(2.4)-Forward:5′-CCATATAATTATAGATATATGA-3′
γ(2.3)-Reverse:5′-GGGAGATCTACTCCGGAAGGGATTAG-3′
γ(2.3)-EpGFP-Forward:5′-CCTTCCGGAGTAGATCTCCCGGGT-3′
Wahl et al. Page 5
Dev Biol. Author manuscript; available in PMC 2010 November 15.
NIH
-PA Author Manuscript
NIH
-PA Author Manuscript
NIH
-PA Author Manuscript

Quantitative PCREmbryos injected with recombineered BACs or reporter constructs were collected at theindicated timepoints. DNA and RNA were extracted using the Qiagen AllPrep DNA/RNAMini kit (catalog #80204). Reverse transcriptase PCR was performed on the extracted RNAusing the Biorad iScript cDNA synthesis kit (catalog #170-8890). BAC/reporter constructincorporation number and expression level were quantified by quantitative real-time PCRperformed on extracted DNA and cDNA, respectively (Revilla-i-Domingo et al., 2004). Thesingle-copy gene foxA and two genes of well-characterized expression, Spz12 (Wang et al.,1995) and ubiquitin (ubq) (Oliveri et al., 2002; Ransick et al., 2002), were also quantified forcomparison. The number of transcripts per embryo was determined by multiplying the folddifference in construct expression level (relative to Spz12 or ubq) by the number of Spz12 orubq transcripts present at that timepoint, adjusting for GFP construct incorporation relative tofoxA (Materna and Oliveri, 2008). Spz12 and ubq standardizations gave consistent results;graphs shown are standardized relative to Spz12. The QPCR primers used are available onlineat: http://sugp.caltech.edu/SUGP/resources/methods/q-pcr.php.
Culture, microinjection, and fluorescence visualizationCulture and microinjection were performed as described (Flytzanis et al., 1985; McMahon etal., 1985) with the following modifications: eggs were not filtered prior to dejellying, and noBSA was added to dejellied eggs. Zygotes were injected with 10pL of solution containing 150molecules/pL of reporter construct or 40 molecules/pL of BAC and 120 mM KCl. HindIIIfragment carrier DNA (4nM) was added to injection solutions containing small reporterconstructs. All BACs were linearized with AscI prior to injection.
Translation and splice-blocking morpholino antisense oligonucleotides (MASO) weredesigned by GeneTools. For coinjections, MASO was added to the injection solution at theindicated concentrations. Embryos injected with a randomized mixture of morpholinos(IUPAC sequence: N25) served as a mock-knockdown control.
Elk trans MASO:5′CGCTTCCGACATTGTGATGATTCTG-3′ 400μMEts1/2 trans MASO:5′-GAACAGTGCATAGACGCCATGATTG-3′ 500μMEts4 splicing MASO: 5′- GCAAACTTCGCCAGTTGAGAACATG -3′ 400μMErg trans MASO*:5′-GCATATAACAAATTGAGGAACACTG-3′ 200μMErg splicing MASO*:5′-GGCCACTTCCTGCAAAAACGAAC-3′ 200μMHesC trans MASO:5′-GTTGGTATCCAGATGAAGTAAGCAT-3′ 500μMTel trans MASO:5′-CCTGTCTGGTAGAGGCCGGGTCCAT-3′ 400μM
*Equal amounts of Erg trans and splicing MASOs were combined for Erg MASO injections (Oliveri et al., 2008).
pmar1 and ets1/2 mRNA were obtained by plasmid transcription as described (Oliveri et al.,2002). Injection solution for mRNA co-injections contained 200ng/μL ets1/2 mRNA or 10ng/μL pmar1 mRNA. The final concentration of injected transcript did not exceed the maternal(for ets1/2, (Rizzo et al., 2006) or early blastula (for pmar1, (Oliveri et al., 2002) transcriptnumber by more than tenfold, as recommended to maintain binding specificity (Materna andOliveri, 2008).
GFP expression pattern was evaluated at the indicated timepoints on an epifluorescenceAxioscope 2 Plus microscope (Zeiss, Hallbergmoos, Germany). Images were recorded withan AxioCam MRm (Zeiss) and fluorescence overlays produced in Adobe Photoshop CS 3.
Electrophoretic mobility gel shift assays and probe preparationGel shifts were performed using 12h embryonic nuclear extract as described (Yuh et al.,1994). Double-stranded oligonucleotides were annealed and 32P-labeled with Klenow DNA
Wahl et al. Page 6
Dev Biol. Author manuscript; available in PMC 2010 November 15.
NIH
-PA Author Manuscript
NIH
-PA Author Manuscript
NIH
-PA Author Manuscript
polymerase by the end-fill reaction. Underlined sequence represents overhang serving as atemplate for Klenow labeling.
H-Forward:5′-GAGAGCCCCTGTGCGTGCTTTACAGTGATAACAC-3′
H-Reverse:5′-GAGAGTGTTATCACTGTAAAGCACGCACAGGGGC-3′
I-Forward:5′-GAGAGTGCTTTACAGTGATAACACAAAGCGGTCA-3′
I-Reverse:5′-GAGATGACCGCTTTGTGTTATCACTGTAAAGCAC-3′
J-Forward:5′-GAGAGTGATAACACAAAGCGGTCATTGACCTCTT-3′
J-Reverse: 5′-GAGAAAGAGGTCAATGACCGCTTTGTGTTATCAC-3′
K-Forward: 5′-GAGAAAAGCGGTCATTGACCTCTTCCTGTCTGGT-3′
K-Reverse:5′-GAGAACCAGACAGGAAGAGGTCAATGACCGCTTT-3′
L-Forward:5′-GAGATTGACCTCTTCCTGTCTGGTGATCGGTCAA-3′
L-Reverse:5′-GAGATTGACCGATCACCAGACAGGAAGAGGTCAA-3′
M-Forward: 5′-GAGACCTGTCTGGTGATCGGTCAACTAATCCCTT-3′
M-Reverse:5′-GAGAAAGGGATTAGTTGACCGATCACCAGACAGG-3′
N-Forward:5′-GAGAGATCGGTCAACTAATCCCTTCCGGTTGGAC-3′
N-Reverse:5′-GAGAGTCCAACCGGAAGGGATTAGTTGACCGATC-3′
O-Forward:5′-GAGACTAATCCCTTCCGGTTGGACGTGAACTTCG-3′
O-Reverse:5′-GAGACGAAGTTCACGTCCAACCGGAAGGGATTAG-3′
P-Forward:5′-GAGACCGGTTGGACGTGAACTTCGACCGCTGGTT-3′
P-Reverse:5′-GAGAAACCAGCGGTCGAAGTTCACGTCCAACCGG-3′
ResultsSpatial and temporal expression pattern of recombineered tbr::GFP BAC
Abundant and ubiquitously distributed maternal transcript obscures the early zygoticexpression pattern of the endogenous tbr gene. To visualize zygotic transcription we used arecombinant BAC, in which the coding region of GFP had been inserted at the start codon oftbr exon1 (Damle et al., 2006). Figure 1B shows an expression time-course generated byquantifying GFP transcripts produced by this expression construct, tbr::GFP BAC, in embryoscollected at 6-48 hours after fertilization (hpf) and injection. GFP transcript number wasnormalized to the number of BAC DNA molecules incorporated per embryo. This wasdetermined in QPCR measurements by comparing the incorporated genomic GFP codingsequence content to that of a known single copy gene, foxa.
Expression begins between 6 and 9hpf, coincident with the disappearance of transcriptencoding HesC, the predicted tbr repressor, from the micromeres between 8 and 12 hpf(Revilla-i-Domingo et al., 2007). There were ~1000 GFP transcripts/embryo between 9 and21 hpf, increasing three-fold by 24 hpf, and remaining high at 36 and 48 hpf. This pattern ofexpression is consistent with previous time-courses for endogenous tbr transcript (Oliveri etal., 2008); and additional unpublished data). The spatial expression pattern of tbr::GFP BACwas visualized in injected embryos by fluorescence microscopy at the blastula (18hpf),mesenchyme blastula (24 hpf), and late gastrula (48 hpf) stages, as illustrated in Fig. 1C.Expression was highly specific to the SM lineage; the percentage of injected embryos
Wahl et al. Page 7
Dev Biol. Author manuscript; available in PMC 2010 November 15.
NIH
-PA Author Manuscript
NIH
-PA Author Manuscript
NIH
-PA Author Manuscript
displaying fluorescence anywhere else was ≤ 7% at all stages, and essentially zero at 18 h (Fig.1D). The tbr::GFP BAC construct recapitulates both the spatial and temporal expressionpattern of the endogenous gene with high fidelity.
The tbr gene is strikingly up-regulated by pmar1 mRNA injection (Oliveri et al., 2002) and byhesC morpholino antisense oligonucleotide (MASO) injection (Revilla-i-Domingo et al.,2007), as required by the double negative gate architecture. So indeed is the tbr::GFP BAC.Embryos coinjected with this construct and with pmar1 mRNA, with hesC MASO, or with arandom (N) MASO control were visualized by fluorescence microscopy at 18, 24, and 48 hpf.Both pmar1 mRNA and hesC MASO injection resulted in increased amount of expression andgrossly ectopic fluorescence relative to the control (Fig. S2A,C,E; Table S1). The tbr::GFPconstruct thus includes the genomic sequence required for these known regulatory inputs intothe gene.
Ectopic GFP expression following HesC binding site mutationA class C bHLH factor binding site (Iso et al., 2003) near the basal promoter is necessary forrepression of a Hemicentrotus tbr construct outside of the SM territory (Ochiai et al., 2008),and was thought to be a binding site for the HesC repressor implicated by gene network analysisin the control of tbr spatial expression in S. purpuratus (Oliveri et al., 2002; Revilla-i-Domingoet al., 2007). This sequence (CGCGTG) is conserved in the S. purpuratus tbr gene at −222−217 relative to the transcription start site (Fig. 2A). To determine whether mutation of thissingle site would suffice to induce ectopic expression in the complete genomic context, a 4bpmutation was introduced on the tbr::GFP BAC by means of homologous recombination. Themutation resulted in a significant increase in ectopic GFP expression relative to thetbr::GFP BAC control, while GFP expression in the SM lineage was unaffected (Fig. 2B,C).However, GFP misexpression was observed in only 10%, 13%, and 23% of embryos at 18hblastula, 24h mesenchyme blastula, and 48h prism stages. This suggested that there could beadditional undiscovered HesC sites: thus, by comparison, pmar1 mRNA, which works byshutting down hesC expression, produced 49% ectopic expression by mesenchyme blastulastage, and the hesC MASO treatment used in these particular experiments 24% (Table S1).Computational analysis of the whole tbr regulatory apparatus identifies several other potentialHesC sites here not investigated; however, most of these lie in non-conserved regions of thesequence. Alternatively, this difference in misexpression rate caused by the mutation and thatcaused by pmar1 mRNA and hesC MASO could be due to an indirect effect: both pmar mRNAand hesC MASO injection cause the ectopic expression of ets1/2, an activator of tbr (seeDiscussion). In addition, we note that in a MASO injection the antisense oligo must be in excessto block the translation of the continuously transcribed hesC, which is not always attained,while the pmar1 MOE produces enough transcriptional repressor to completely turn off thehesC gene.
Deletion of conserved intronic regions from tbr::GFP BACOchiai et al. (2008) reported that Snail family consensus binding sites in a conserved introniccis-regulatory module were necessary for repression of ectopic expression in a Hemicentrotustbr reporter construct. The corresponding region, here identified as the B module (Fig. 3A),was deleted from the S. purpuratus tbr::GFP BAC by homologous recombination.Quantification of GFP transcripts revealed no very significant differences in temporalexpression pattern in the ΔB module BAC relative to the control, though there may be atransient depression of the level of activity soon after ingression (Fig. 3B). More importantly,there was no change whatsoever in the accuracy of expression caused by deletion of B module(Fig. 3C). Thus in S. purpuratus, the putative Snail binding site of B module has no detectablerepressive spatial function when measured in complete genomic context.
Wahl et al. Page 8
Dev Biol. Author manuscript; available in PMC 2010 November 15.
NIH
-PA Author Manuscript
NIH
-PA Author Manuscript
NIH
-PA Author Manuscript
An additional conserved region in the first intron of the Tbrain gene was identified as anenhancer in Hemicentrotus (Ochiai et al., 2008). When this region, here the C module, wasdeleted from the tbr::GFP BAC (Fig. 4A), a very significant decrease in GFP transcript levelswas observed at all time-points examined (Fig. 4B). Although the analogous deletion from a7kb HpTbrain reporter construct caused an increase in ectopic expression (Ochiai et al.,2008), we could detect no difference in the amount of ectopic expression produced by the ΔCmodule BAC vs. the control tbr::GFP BAC (Fig. 4C,D). Thus in S. purpuratus, C module inthe context of the complete system appears to act as a quantitative enhancer of expression, butis not required for spatial accuracy of expression.
γ(2) module drives expression after ingression of the SM cellsA novel cis-regulatory module, γ(2), which also mediates skeletogenic expression, wasidentified in the 5′ intergenic region of the tbr locus (Fig.5A). It was found by means of iterativedeletions from a large expression construct that included the whole intergenic region betweentbr and the next gene upstream (Fig. S1). Successive deletions and results are shown in Fig.S3 and Table S2. To determine the function of γ(2) module in the context of the whole genomicregulatory system, this module was specifically deleted from the tbr::GFP BAC byhomologous recombination. Study of the expression of this deletion construct revealed that itis expressed quite normally temporally and spatially until the time of ingression, but between24 and 48h a major decrease in expression levels is seen; this result is shown in Fig. 5B-D. Inaddition the γ(2) deletion produced a minor but significant increase in ectopic expression duringthis period, typically in the non-skeletogenic mesoderm. Thus in genomic context, γ(2) modulefunctions after ingression. Since as shown in Fig. 4 C module also functions during this period,we conclude that these two non-contiguous cis-regulatory modules collaborate in generatingthe definitive expression of the tbr gene in differentiated skeletogenic cells.
Expression of a short γ(2) module construct lacking any other regulatory sequenceA standard minimal expression construct was created by fusing the γ(2) module (Fig. 6 andS3) to the endo16 basal promoter::GFP reporter (construct “γ(2)::EpGFP”). On its own thisbasal promoter has no specific intrinsic spatial or temporal regulatory activity, but it mediatestranscription in any domain of the embryo if provided with an exogenous cis-regulatory moduleactive in that domain (Yuh and Davidson, 1996). In a head-to-head comparison the short γ(2)::EpGFP construct is expressed just as accurately as is tbr::GFP BAC (Fig. 6B,C). We thencompared the quantitative expression of this construct across developmental time to that of thetbr::GFP BAC from which γ(2) module had been deleted, as for the experiments of Fig. 5.The simplest case we can consider is that the activity of the whole system is just the sum ofthe activities of its individual cis-regulatory modules. In this case the activity of the shortconstruct should match the calculated difference between the activities of the tbr::GFP BACand the tbr::GFP γ(2) deletion BAC. This comparison is plotted in Fig.6A.
There are two interesting aspects of the result. First, and most obviously, γ(2)::EpGFP doesnot generate nearly as much activity per incorporated construct, in the period after 24 h, as islost from the complete system when the γ(2) module is deleted. To test whether this might bedue to the exogenous endo16 promoter used in this construct, we generated a construct in whichthe γ(2) module was associated only with the endogenous tbr promoter, denoted in the mapsshown in Fig. S3 as “α” (construct “γ(2)α::GFP”). This construct was expressed spatially withthe same accuracy as γ(2)::EpGFP, and quantitatively at exactly the same level (Table S2; Fig.S3). Promoter strength or identity is therefore not the explanation for the weak expression perincorporated molecule of the short construct. There is some other reason, as discussed below,that the short construct functions far less efficiently in isolation than does the very same cis-regulatory module in context.
Wahl et al. Page 9
Dev Biol. Author manuscript; available in PMC 2010 November 15.
NIH
-PA Author Manuscript
NIH
-PA Author Manuscript
NIH
-PA Author Manuscript
The second interesting aspect of the comparison in Fig. 6A is that in the period earlier than 21h, the short construct is expressed at the same level, and also in the same skeletogenic cells asis tbr::GFP BAC. In other words, in the context of the whole system, Fig. 5B shows that γ(2)module plays no role whatsoever prior to ingression, but in isolation, as shown in Fig. 6A, itis capable of generating apparently normal spatial expression prior to ingression.
Given its accurate expression, we tested whether γ(2)::EpGFP would respond similarly totbr::GFP BAC in perturbations of the upstream regulators. And indeed, injection of bothpmar1 mRNA and hesC MASO caused gross ectopic expression of the γ(2)::EpGFP construct(Fig. S2; Table S1).
Ets family transcription factors regulate γ(2) moduleTo identify the transcriptional activator(s) of the γ(2) module, and to determine whether HesCis a direct or indirect regulator, a gel shift analysis was carried out using nuclear extract from12 h embryos. We found a 71 bp subregion of γ(2) module (Fig. 7A) which drove GFPexpression specifically in the SM, though less strongly than does the full γ(2) module whenincorporated in an expression construct (γ(2.2-3)::EpGFP; Fig. S3a; Table S3). As Fig. 7Bshows, there are three putative kinds of DNA-protein complex in this region, which are foundrespectively in oligonucleotides containing Ets family consensus binding sites (Consales andArnone, 2002), oligonucleotides containing an Otx family consensus binding site (Mao et al.,1994), and an oligonucleotide that included a 30bp upstream region which produced anunresolved additional set of complexes. The activities of the γ(2)::EpGFP construct and ofderivatives in which each of these putative binding sites were mutated are given in the chartin Fig. 7C. Mutation of the putative Otx binding site had minor effect (from 38.4% in WT to29.1% when mutated), while deletion of the 30 bp sequence (which partially overlapped anEts binding site) decreased the level of GFP expression and the number of injected embryosvisibly expressing GFP. Mutation of either Ets binding site significantly reduced the numberof GFP-expressing embryos, more strongly for site 1 than for site 2, and when both Ets bindingsites were mutated, GFP expression was abolished. But none of these mutations produced anyectopic expression (e.g., Fig. S4a-g). Although no corresponding DNA-protein complex wasobserved, a consensus bHLH binding site in this region was also considered as a candidateHesC binding site. However, mutation of this site in γ(2)::EpGFP affected neither quantitativenor ectopic expression (Fig. 7c; Fig. S4g).
There are five genes of the Ets family expressed in the SM by mesenchyme blastula stage, viz.erg, ets1/2, ets4, elk, and tel (Kurokawa et al., 1999; Rizzo et al., 2006). MASO directed againsteach of these Ets family members was co-injected with γ(2)::EpGFP. The results, alsosummarized in Fig. 7C, reveal that Ets1/2 (and possibly Elk, which had a weak effect) arerequired for normal levels of expression of γ(2)::EpGFP. This raised the possibility that thespatial control of this short construct by HesC could be indirect, since the ets1/2 gene is itselfcontrolled by the pmar1/hesC double negative gate. To test this, ets1/2 mRNA was co-injectedwith γ(2)::EpGFP or with tbr::GFP BAC. There was a striking difference in the earlyexpression (18hpf) outcome: γ(2)::EpGFP was now expressed ectopically all over the embryobut the tbr::GFP BAC was not (Fig. S2g,h: Table S1). Thus the complete system encompassedin the tbr::GFP BAC is subject to dominant repression by HesC as shown above, whereas theshort construct is regulated only by Ets1/2. In contrast, at later stages, when the γ(2) moduleis functional, both tbr::GFP BAC and γ(2)::EpGFP are ectopically expressed in ets1/2 mRNAco-injection. This distinction in behavior excludes the possibility that γ(2) module is literallyredundant with the rest of the regulatory system.
An unexpected and important result of these MASO experiments was that introduction oferg MASO caused expansion of expression of both tbr::GFP BAC (Fig. 8A,D) and γ(2)::EpGFP (Fig. 8C,D) into the NSM at 48hpf. However, the tbr::GFP BAC construct from
Wahl et al. Page 10
Dev Biol. Author manuscript; available in PMC 2010 November 15.
NIH
-PA Author Manuscript
NIH
-PA Author Manuscript
NIH
-PA Author Manuscript
which the γ(2) module had been deleted (Fig.8b,d) was immune to this effect. Thus anotherlate role of the γ(2) module in the whole system is revealed: this function is to suppresstranscription of the tbr gene in NSM in the gastrula stage embryo, a role necessitated by theexpansion of ets1/2 expression to the NSM by this stage.
DiscussionThe tbr gene lies at an essential node, high in the gene regulatory network subcircuit whichestablishes the initial lineage specific regulatory state of the future skeletogenic mesoderm(SM) (Oliveri et al., 2008). Network analysis predicts the key features of the genomic cis-regulatory code determining the transcriptional activity of this gene, and an initial motivationof this work was to explore these predictions. But it soon devolved that there are multiplecomponents of this regulatory system: Ochiai et al (2008) identified several cis-regulatorymodules in the tbr gene of a related species, while we had found a distinct tbr cis-regulatorymodule in a different region of the locus in S. purpuratus. Here we recount a system scaleanalysis that includes all known active modular units of the locus, based on recombineeredBAC constructs which cover the complete locus and extend into the territories of the flankinggenes on either side. The network prediction that tbr is a primary target of the pmar1-hesCdouble negative gate (Oliveri et al, 2002; 2008; Revilla-i-Domingo et al, 2007) wasdemonstrated true, and in this work we also solved the identity of the missing inferred controlinput that precludes tbr expression in the nonskeletogenic mesoderm (NSM). But in additionto resolving the functions of its various cis-regulatory inputs, we have gained unexpectedinsight into two other interesting aspects of the regulatory biology of the tbr gene. Wediscovered how different tbr cis-regulatory modules are deployed at different stages ofdevelopment, and how, in this case, cis-regulatory inputs affect module choice. Not much isknown about the subject of module choice, though it is obvious that the phenomenon ispervasive, as most regulatory genes appear to utilize multiple cis-regulatory modules (forreview, Davidson, 2006). A related consequence, which has sharp implications for standardoperating procedures in cis-regulatory analysis, was the demonstration that a “minimalenhancer” construct may display more functionality when introduced into an embryo than itactually executes in context, where what it does depends on whether it, rather than anothermodule, is actually deployed. Finally the whole elaborate regulatory system we have revealedis cast into a particularly interesting light by the evolutionary novelty of this derived system,for as reviewed briefly in Introduction, only in echinoids is the tbr gene utilized at all in anembryonic SM cell lineage.
The early tbr control systemDisruption of the single HesC site in the α region of the tbr::GFP BAC produces a significantamount of ectopic expression in 18 and 24 h embryos, which though quantitatively minor isto be compared with the almost completely accurate expression of the parental BAC (Fig.2,Table S1). A higher rate of ectopic expression was produced at these times by treatment withhesC MASO, using the wild type tbr::GFP BAC. The hesC MASO is clearly active as shownin earlier work (Revilla-i-Domingo et al., 2007), and as noted below, it sufficed in this studyto produce 100% ectopic expression from the short γ(2)::EpGFP construct later in development(Table S1). However, early in development when hesC is intensely transcribed everywhere inthe embryo (except in the SM pmar1 domain), it may be relatively difficult to block the presenceof all HesC protein. We were mainly concerned to test in full genomic context the function ofthe single α module HesC site discovered by Ochiai et al (2008), and as noted above it is verypossible that additional functional HesC sites exist elsewhere in the tbr locus.
The positive early control system consists of modules α plus C, as shown in the BAC deletionsof Figs. 4 and 5. However, Fig. 4C,D show that of these, C module is not required to produce
Wahl et al. Page 11
Dev Biol. Author manuscript; available in PMC 2010 November 15.
NIH
-PA Author Manuscript
NIH
-PA Author Manuscript
NIH
-PA Author Manuscript
accurate expression in the whole BAC. C module appears to contribute only a quantitativebooster input since there is no increase in ectopic expression whatsoever when it is deleted,though there is a great decrease in level of expression (Fig. 4B). α module and its HesC siteare able to do the job of ensuring that what expression remains is accurate. The location of anyadditional repressive HesC sites elsewhere in the locus would not have been tested in thesedeletions. Nonetheless, the significant destabilization of the very tight control executed by theearly system operating in tbr::GFP BAC prior to ingression when the single known α moduleHesC site is destroyed, justifies the placement of this gene downstream of the pmar1-hesCdouble negative gate.
tbr regulation after ingressionAs shown very clearly in Fig. 5, when the upstream γ(2) module is deleted from the completesystem carried in tbr::GFP BAC, there is no effect of any kind on expression prior to ingression(21-22hpf), either quantitative or spatial. But thereafter, the level of expression is greatlycompromised; and in addition ectopic expression increases significantly, particularly in NSMcells (examples in Figs. 5C, 24 and 48h embryos). The γ(2) module is thus a late acting driverof expression in cells executing active skeletogenesis. It does not act alone, however, and againmodule C functions as a booster. These two modules interact cooperatively, since the sum ofthe expression in the late phase when C is deleted plus when γ(2) is deleted does not equal thelevel of late expression when neither is deleted (Figs. 4,5).
The γ(2) module has two different regulatory inputs, which probably use the same target sites.The experiments in Fig. 7 and Table S.3 prove that the activating driver is indeed Ets1/2,interactions with which account entirely for its activity. We also demonstrated that the shortγ(2) module construct, γ(2)::EpGFP, responds sharply to hesC MASO; in fact by late gastrulathis treatment causes 100% of embryos to mis-express the GFP reporter (Table S.1). So alsodoes global expression of the Ets1/2 driver (Table S.1). But γ(2) module has no functionalHesC site, and the effect of HesC on its expression is indirect. We can understand this at onceby reference to the network architecture, for the ets1/2 gene is itself a primary target of HesCrepression immediately downstream of the pmar1 double negative gate. Thus HesC MASOcauses global ectopic expression of Ets1/2 which in postgastrular embryos is normally confinedto SM and NSM cells. That is why it causes global expression of γ(2)::EpGFP, the same effecton expression as direct injection into the egg of ets1/2 mRNA (Table S.1).
The experiments in Fig. 8 show that the reason the γ(2) module does not express in the NSMeven though the Ets1/2 driver is present in these cells is that another NSM Ets family factor,Erg, acts to repress the activation potential of the module. After gastrulation erg is nottranscribed in SM but continues to be expressed in NSM (Rizzo et al., 2006). Erg and Ets bindsimilar DNA target sites and so this is likely a case of competitive binding at the Ets sites, suchthat if the repressor Erg is present it wins. Thus erg MASO produces ectopic NSM expressionof both the γ(2)::EpGFP short construct and of tbr::GFP BAC (Fig. 8). But, the additionalstriking result in Fig. 8 is that erg MASO produces no ectopic NSM expression in the derivativeof tbr::GFP from which γ(2) module has been deleted. This reveals another late regulatoryrole of γ(2) module in its normal context: not only does it cooperatively (with module C) driveexpression in the SM, but it also represses it in the NSM.
Minimal module illusions, and the mechanism of γ(2) module exclusion in early developmentγ(2)::EpGFP is a typical “minimal” expression construct, consisting of only the module itselfand a promiscuous basal promoter-reporter apparatus. It gave near perfect expression bothearly and late (Fig. 6C), though as pointed out above, the short construct is quantitatively muchless active per copy relative to its function in context. This could be due to the much greaterflexibility of the longer DNA “arm” separating the module from the promoter in the normal
Wahl et al. Page 12
Dev Biol. Author manuscript; available in PMC 2010 November 15.
NIH
-PA Author Manuscript
NIH
-PA Author Manuscript
NIH
-PA Author Manuscript
context, allowing a greater variety of productive contact conformations, or to a greater tendencyof the individual construct units to interfere with one another in the incorporated concatenate,or to titration of activators by the large number of short construct copies, or to a combinationof these. The main point is not this, but the shocking discovery that in context the γ(2) moduleapparently produces no output whatsoever prior to ingression, while when isolated in γ(2)::EpGFP it does function prior to ingression. We see immediately that in the short construct,where there is no other option, the basal promoter will use whatever it can get, so to speak.The short construct does not exactly “lie” about γ(2) module functionality; rather it“exaggerates”: only a part of what it displays may be utilized in context, because there is anotherlayer of control, module choice. The fact that the complete system minus the γ(2) modulefunctions the same in early development as when γ(2) module is present shows directly that γ(2) module provides no significant input while the early plus C module system is running. Itoperates differently, not redundantly with the α plus C module system, as shown by thestrikingly different response to Ets overexpression in pre-ingression embryos. The interactionscontrolling γ(2) module revealed in this study can also explain why it is silent in the earlyembryo.
In the pre-ingression SM we believe that the same thing happens to γ(2) module as happens inthe post-ingression NSM. As network analysis has shown (Oliveri et al., 2008), justdownstream of the regulatory targets activated by the pmar1-hesC double negative gate (i.e.,ets1/2, alx1, tel, and tbr), a positive feedback subcircuit is activated by inputs from theseprimary responders. The first gene in this subcircuit is none other than erg. It receives an inputfrom tbr itself as well as from ets1/2, then forges interactions with hex and tgif, including afeedback onto erg from hex. As we have seen, in the context of the whole system the γ(2)module is dominantly repressed by Erg in the presence of Ets1/2, and so in the pre-ingressionSM, once erg is turned on and kept on, γ(2) module should be inactive. This is a case of shortrange repression (Gray et al., 1994) since the gene is not silenced, only the γ(2) module. Thecircuitry, summarized in Fig. 9A, is fascinating. Essentially, tbr expression is the cause of γ(2) module repression, via the negative feedback from the tbr target erg. Or in other words thetbr gene itself ends up controlling which regulatory module will be deployed actively, and theexclusion of γ(2) module activation potential is probably the cause of deployment of the α-Cmodule system that operates in the early embryo rather than γ(2) module. Later when ergexpression is extinguished in the SM (for reasons not yet known, as this occurs later than ourcomprehensive network analysis so far extends), γ(2) module is called into action, also incollaboration with C. The alternative conformations implied by these deployments arediagrammed in Fig. 9B. This is our preferred model, but it is also possible that an insulatorcontributes to silencing γ(2) module in the complete construct, since we observed thatinterposition of a large stretch of upstream sequence in γ(2) expression constructs preventsexpression (Table S2; Fig. S3).
There are at least two possible reasons that the short γ(2)::EpGFP construct does not respondto Erg repression in the early SM: first, the Ets activator may have a competitive advantagewhen its target sites are brought into immediate proximity of the basal transcription apparatus,forming a stable activation complex; second, the γ(2)::EpGFP construct runs on an exogenous,promiscuous promoter from the endo16 gene, and Erg repression may require elements of theendogenous promoter. As usual, negative results are subject to various interpretations, and itis what the γ(2)::EpGFP construct does that is more informative than what it does not do.
Evolutionary considerations: how could all this have happened?Almost all of the embryonic SM specification and differentiation gene regulatory networkappears also to be utilized in the skeletogenic centers in which the initial spines and test platesof the adult body plan are constructed during mid-late larval life (Gao and Davidson, 2008).
Wahl et al. Page 13
Dev Biol. Author manuscript; available in PMC 2010 November 15.
NIH
-PA Author Manuscript
NIH
-PA Author Manuscript
NIH
-PA Author Manuscript
This includes the ets1/2 and alx genes, as well as the triple feedback erg, hex, tgif subcircuitgenes, and downstream regulators as well. Since the same apparatus is evidently deployed inthe skeletogenesis centers of the sea star larva (which has no embryonic skeletogenic mesodermlineage whatsoever), all of these genes appear to be components of a pleisiomorphicechinoderm skeletogenic network (Gao and Davidson, 2008). This network was evidentlylinked in toto into the embryonic specification system defining the micromere lineage in theevolutionary branch leading to the euechinoids, the modern sea urchins which display aprecociously-ingressing skeletogenic micromere lineage. But none of this pertains to the tbrgene, because this gene is not part of the adult skeletogenic apparatus in either sea urchins orsea stars (Gao and Davidson, 2008). As reviewed in Introduction, tbr is expressed in theembryonic endoderm in other echinoderm classes and in euechinoid embryos exclusively inthe SM.
The acquisition of tbr by the embryonic skeletogenic control apparatus of the euechinoids is aclassic case of co-option, here seen directly at the network level. The switch away from itspleisiomorphic endodermal function may have had nothing to do directly with the tbr co-optionprocess, since many regulatory genes participate in multiple developmental processes. Thereis some evidence that a key role of tbr in sea star embryonic specification, to provide a necessaryfeed into the otx gene, an essential endoderm regulator, has been supplanted by a different genein the euechinoids, viz. blimp1 (Hinman et al., 2007; Hinman et al., 2003). But this could havehappened before, during or after tbr acquired its skeletogenic role. One essential step we caninfer in the co-option process was placing tbr under control of the pmar1-hesC double negativegate, as pointed out earlier (Gao and Davidson, 2008). This gate is not part of the adultskeletogenic apparatus either, and it is the definitive initiator of micromere specification. Theother three first tier regulators answering to the double negative gate also had to be placedunder HesC control. Cis-regulatory studies on several double negative gate targets (Smith andDavidson, 2008b) and unpublished data) show that one or two HesC sites does the job, andthis aspect of the co-option process is easy to imagine.
But there is something special about tbr co-option, just because this gene is not part of thepleisiomorphic skeletogenic network apparatus, and the characteristics of γ(2) module mayhold the answer to the conundrum. The tbr gene has acquired several downstream targets inthe SM, and so it is presumably useful as a differentiation driver. However unlike most othersof these, tbr is never expressed in the NSM, as are ets1/2, erg, hex, etc. The reason, as we haveseen, lies in the Erg repression function of the γ(2) module. SM and NSM regulatory statesgreatly overlap but, because of γ(2) module, tbr is an exception. In the evolutionary processleading to establishment of the embryonic euechinoid SM, γ(2) module thus provided amechanism for building a unique, non-skeletogenic mesodermal regulatory state. It is not theonly one, for there is one other regulatory gene just downstream of the double negative gatethat is also never expressed in the NSM, viz. alx1. The evolutionary role of γ(2) modulesuggested here fits with its amazingly simple cis-regulatory construction, which dependsessentially only on a couple of Ets1/2 target sites.
In summary, evolutionary co-option of tbr may have provided the special function ofdifferentiating the SM from the NSM, just because the means of co-option included theappearance of γ(2) module. Two other parts of this same function were provided by the stillunknown mechanism by which transcription of the erg repressor is shut off in the SM, and bythe equally SM-specific cis-regulatory apparatus of the alx1 gene.
Supplementary MaterialRefer to Web version on PubMed Central for supplementary material.
Wahl et al. Page 14
Dev Biol. Author manuscript; available in PMC 2010 November 15.
NIH
-PA Author Manuscript
NIH
-PA Author Manuscript
NIH
-PA Author Manuscript

AcknowledgmentsWe would like to thank Prof. Andrew Murray and anonymous reviewers for critical reading and helpful suggestions.Research was supported by the Caltech SURF program, the Camilla Chandler Frost Fellowship, the US Departmentof Defense NDSEG Fellowship Program, and NIH grants HD037105 and GM075089.
REFERENCESCameron RA, Oliveri P, Wyllie J, Davidson EH. cis-Regulatory activity of randomly chosen genomic
fragments from the sea urchin. Gene Expr. Patterns 2004;4:205–13. [PubMed: 15161101]Consales C, Arnone MI. Functional characterization of Ets-binding sites in the sea urchin embryo: three
base pair conversions redirect expression from mesoderm to ectoderm and endoderm. Gene2002;287:75–81. [PubMed: 11992725]
Croce J, Lhomond G, Lozano JC, Gache C. ske-T, a T-box gene expressed in the skeletogenicmesenchyme lineage of the sea urchin embryo. Mech. Dev 2001;107:159–62. [PubMed: 11520672]
Damle S, Hanser B, Davidson EH, Fraser SE. Confocal quantification of cis-regulatory reporter geneexpression in living sea urchin. Dev. Biol 2006;299:543–50. [PubMed: 16919620]
Davidson, EH. The Regulatory Genome: Gene Regulatory Networks in Development and Evolution.Academic Press; San Diego, CA: 2006.
Flytzanis CN, McMahon AP, Hough-Evans BR, Katula KS, Britten RJ, Davidson EH. Persistence andintegration of cloned DNA in postembryonic sea urchins. Dev. Biol 1985;108:431–42. [PubMed:3000855]
Fuchikami T, Mitsunaga-Nakatsubo K, Amemiya S, Hosomi T, Watanabe T, Kurokawa D, Kataoka M,Harada Y, Satoh N, Kusunoki S, Takata K, Shimotori T, Yamamoto T, Sakamoto N, Shimada H,Akasaka K. T-brain homologue (HpTb) is involved in the archenteron induction signals of micromeredescendant cells in the sea urchin embryo. Development 2002;129:5205–16. [PubMed: 12399312]
Gao F, Davidson EH. Transfer of a large gene regulatory apparatus to a new developmental address inechinoid evolution. Proc Natl Acad Sci U S A 2008;105:6091–6. [PubMed: 18413604]
Gray S, Szymanski P, Levine M. Short-range repression permits multiple enhancers to functionautonomously within a complex promoter. Genes Dev 1994;8:1829–38. [PubMed: 7958860]
Hinman VF, Davidson EH. Evolutionary plasticity of developmental gene regulatory networkarchitecture. Proc. Natl. Acad. Sci. U S A 2007;104:19404–9. [PubMed: 18042699]
Hinman VF, Nguyen A, Davidson EH. Caught in the evolutionary act: precise cis-regulatory basis ofdifference in the organization of gene networks of sea stars and sea urchins. Dev. Biol 2007;312:584–95. [PubMed: 17956756]
Hinman VF, Nguyen AT, Cameron RA, Davidson EH. Developmental gene regulatory networkarchitecture across 500 million years of echinoderm evolution. Proc. Natl. Acad. Sci U S A2003;100:13356–61. [PubMed: 14595011]
Iso T, Kedes L, Hamamori Y. HES and HERP families: multiple effectors of the Notch signaling pathway.J. Cell Physiol 2003;194:237–55. [PubMed: 12548545]
Kurokawa D, Kitajima T, Mitsunaga-Nakatsubo K, Amemiya S, Shimada H, Akasaka K. HpEts, an ets-related transcription factor implicated in primary mesenchyme cell differentiation in the sea urchinembryo. Mech. Dev 1999;80:41–52. [PubMed: 10096062]
Lee PY, Nam J, Davidson EH. Exclusive developmental functions of gatae cis-regulatory modules in theStrongylocentrorus purpuratus embryo. Dev. Biol 2007;307:434–45. [PubMed: 17570356]
Longabaugh WJ, Davidson EH, Bolouri H. Visualization, documentation, analysis, and communicationof large-scale gene regulatory networks. Biochim. Biophys. Acta 2009;1789:363–74. [PubMed:18757046]
Mao CA, Gan L, Klein WH. Multiple Otx binding sites required for expression of the Strongylocentrotuspurpuratus Spec2a gene. Dev. Biol 1994;165:229–42. [PubMed: 8088441]
Maruyama YK. A Sea Cucumber Homolog of the Mouse T-Brain-1 is Expressed in the Invaginated Cellsof the Early Gastrula in Holothuria leucospilota. Zoolog Sci 2000;17:383–7. [PubMed: 18494594]
Materna SC, Oliveri P. A protocol for unraveling gene regulatory networks. Nat. Protoc 2008;3:1876–87. [PubMed: 19008874]
Wahl et al. Page 15
Dev Biol. Author manuscript; available in PMC 2010 November 15.
NIH
-PA Author Manuscript
NIH
-PA Author Manuscript
NIH
-PA Author Manuscript
McMahon AP, Flytzanis CN, Hough-Evans BR, Katula KS, Britten RJ, Davidson EH. Introduction ofcloned DNA into sea urchin egg cytoplasm: replication and persistence during embryogenesis. Dev.Biol 1985;108:420–30. [PubMed: 3000854]
Ochiai H, Sakamoto N, Momiyama A, Akasaka K, Yamamoto T. Analysis of cis-regulatory elementscontrolling spatio-temporal expression of T-brain gene in sea urchin, Hemicentrotus pulcherrimus.Mech. Dev 2008;125:2–17. [PubMed: 18065210]
Oliveri P, Carrick DM, Davidson EH. A regulatory gene network that directs micromere specification inthe sea urchin embryo. Dev. Biol 2002;246:209–28. [PubMed: 12027443]
Oliveri P, Davidson EH, McClay DR. Activation of pmar1 controls specification of micromeres in thesea urchin embryo. Dev. Biol 2003;258:32–43. [PubMed: 12781680]
Oliveri P, Tu Q, Davidson EH. Global regulatory logic for specification of an embryonic cell lineage.Proc. Natl. Acad. Sci. U S A 2008;105:5955–62. [PubMed: 18413610]
Ransick A, Rast JP, Minokawa T, Calestani C, Davidson EH. New early zygotic regulators expressed inendomesoderm of sea urchin embryos discovered by differential array hybridization. Dev. Biol2002;246:132–47. [PubMed: 12027439]
Revilla-i-Domingo R, Minokawa T, Davidson EH. R11: a cis-regulatory node of the sea urchin embryogene network that controls early expression of SpDelta in micromeres. Dev. Biol 2004;274:438–51.[PubMed: 15385170]
Revilla-i-Domingo R, Oliveri P, Davidson EH. A missing link in the sea urchin embryo gene regulatorynetwork: hesC and the double-negative specification of micromeres. Proc. Natl. Acad. Sci. U S A2007;104:12383–8. [PubMed: 17636127]
Rizzo F, Fernandez-Serra M, Squarzoni P, Archimandritis A, Arnone MI. Identification anddevelopmental expression of the ets gene family in the sea urchin (Strongylocentrotus purpuratus).Dev. Biol 2006;300:35–48. [PubMed: 16997294]
Shoguchi E, Satoh N, Maruyama YK. A starfish homolog of mouse T-brain-1 is expressed in thearchenteron of Asterina pectinifera embryos: possible involvement of two T-box genes in starfishgastrulation. Dev. Growth Differ 2000;42:61–8. [PubMed: 10831044]
Smith J, Davidson EH. A new method, using cis-regulatory control, for blocking embryonic geneexpression. Dev. Biol 2008a;318:360–5. [PubMed: 18423438]
Smith J, Davidson EH. Gene regulatory network subcircuit controlling a dynamic spatial pattern ofsignaling in the sea urchin embryo. Proc. Natl. Acad. Sci. U S A 2008b;105:20089–94. [PubMed:19104065]
Wang DG, Britten RJ, Davidson EH. Maternal and embryonic provenance of a sea urchin embryotranscription factor, SpZ12-1. Mol. Mar. Biol. Biotechnol 1995;4:148–53. [PubMed: 7773332]
Warming S, Costantino N, Court DL, Jenkins NA, Copeland NG. Simple and highly efficient BACrecombineering using galK selection. Nucleic Acids Res 2005;33:e36. [PubMed: 15731329]
Yon J, Fried M. Precise gene fusion by PCR. Nucleic Acids Res 1989;17:4895. [PubMed: 2748349]Yuh CH, Davidson EH. Modular cis-regulatory organization of Endo16, a gut-specific gene of the sea
urchin embryo. Development 1996;122:1069–82. [PubMed: 8620834]Yuh CH, Moore JG, Davidson EH. Quantitative functional interrelations within the cis-regulatory system
of the S. purpuratus Endo16 gene. Development 1996;122:4045–56. [PubMed: 9012524]Yuh CH, Ransick A, Martinez P, Britten RJ, Davidson EH. Complexity and organization of DNA-protein
interactions in the 5′-regulatory region of an endoderm-specific marker gene in the sea urchin embryo.Mech. Dev 1994;47:165–86. [PubMed: 7811639]
Wahl et al. Page 16
Dev Biol. Author manuscript; available in PMC 2010 November 15.
NIH
-PA Author Manuscript
NIH
-PA Author Manuscript
NIH
-PA Author Manuscript
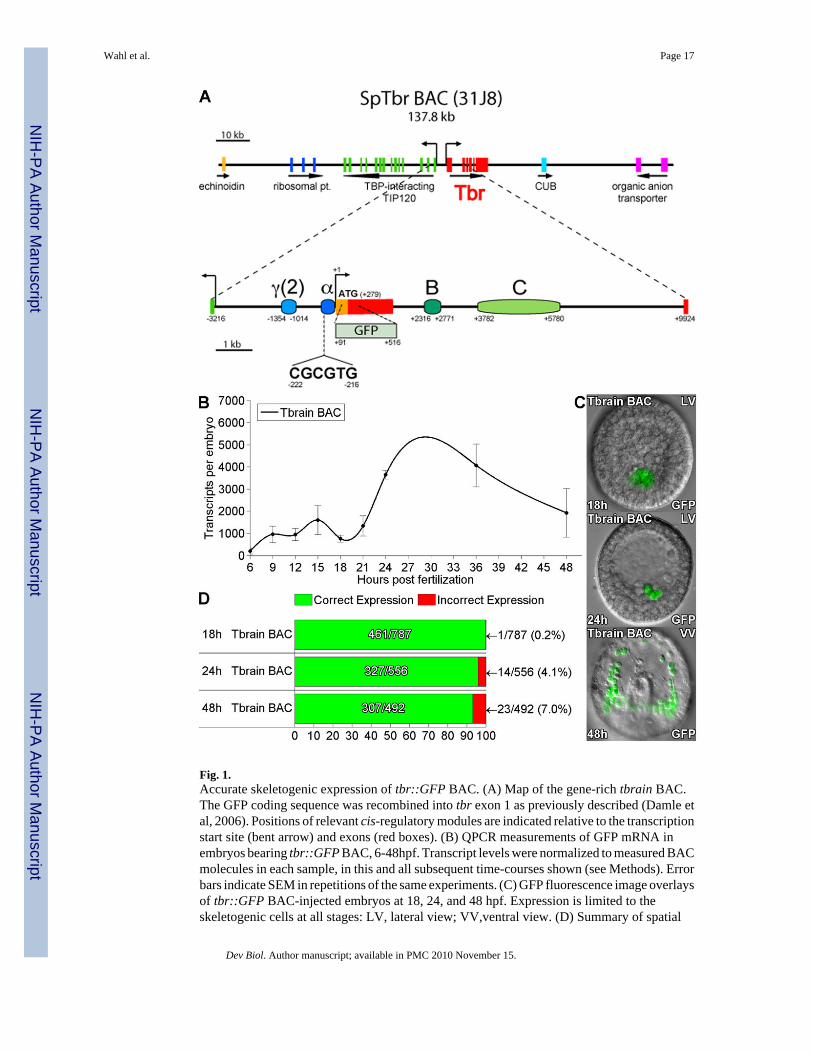
Fig. 1.Accurate skeletogenic expression of tbr::GFP BAC. (A) Map of the gene-rich tbrain BAC.The GFP coding sequence was recombined into tbr exon 1 as previously described (Damle etal, 2006). Positions of relevant cis-regulatory modules are indicated relative to the transcriptionstart site (bent arrow) and exons (red boxes). (B) QPCR measurements of GFP mRNA inembryos bearing tbr::GFP BAC, 6-48hpf. Transcript levels were normalized to measured BACmolecules in each sample, in this and all subsequent time-courses shown (see Methods). Errorbars indicate SEM in repetitions of the same experiments. (C) GFP fluorescence image overlaysof tbr::GFP BAC-injected embryos at 18, 24, and 48 hpf. Expression is limited to theskeletogenic cells at all stages: LV, lateral view; VV,ventral view. (D) Summary of spatial
Wahl et al. Page 17
Dev Biol. Author manuscript; available in PMC 2010 November 15.
NIH
-PA Author Manuscript
NIH
-PA Author Manuscript
NIH
-PA Author Manuscript

expression statistics. Green and red bars indicate the fraction of embryos expressing GFP thatshowed fluorescence restricted to the SM cells (correct expression) vs. partially or completelyectopic fluorescence (incorrect expression), respectively. The total number of embryos injectedis given in the denominators of these fractions.
Wahl et al. Page 18
Dev Biol. Author manuscript; available in PMC 2010 November 15.
NIH
-PA Author Manuscript
NIH
-PA Author Manuscript
NIH
-PA Author Manuscript
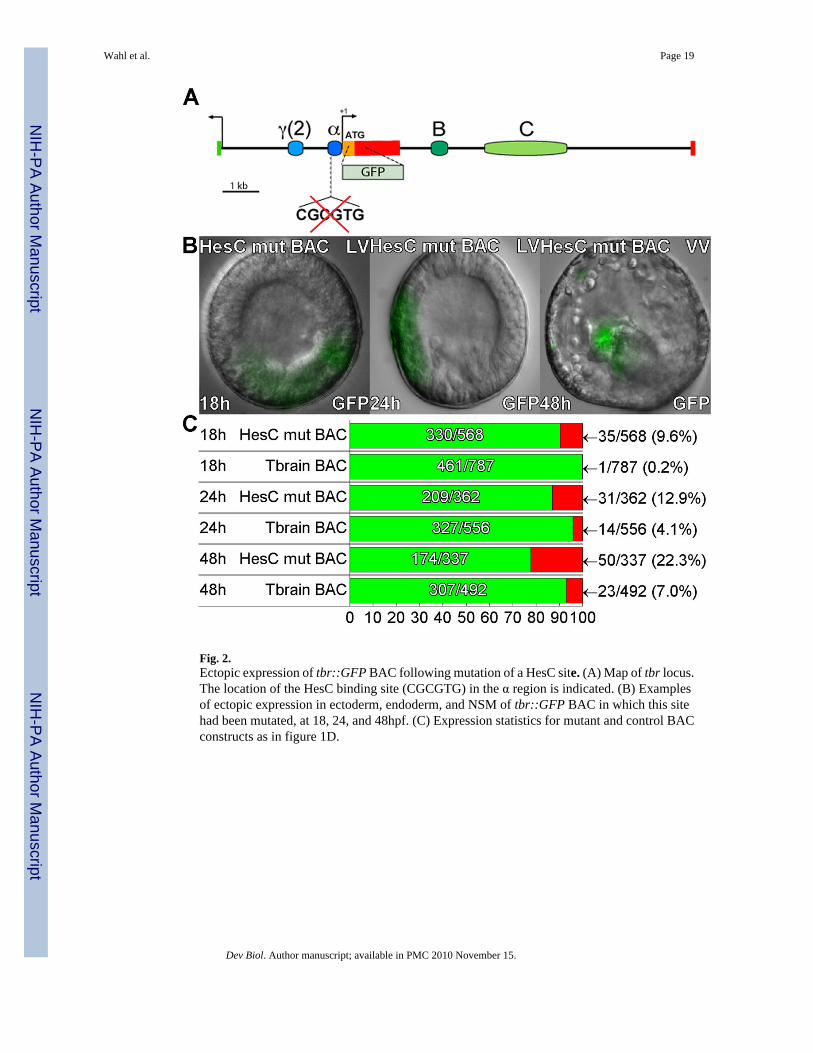
Fig. 2.Ectopic expression of tbr::GFP BAC following mutation of a HesC site. (A) Map of tbr locus.The location of the HesC binding site (CGCGTG) in the α region is indicated. (B) Examplesof ectopic expression in ectoderm, endoderm, and NSM of tbr::GFP BAC in which this sitehad been mutated, at 18, 24, and 48hpf. (C) Expression statistics for mutant and control BACconstructs as in figure 1D.
Wahl et al. Page 19
Dev Biol. Author manuscript; available in PMC 2010 November 15.
NIH
-PA Author Manuscript
NIH
-PA Author Manuscript
NIH
-PA Author Manuscript
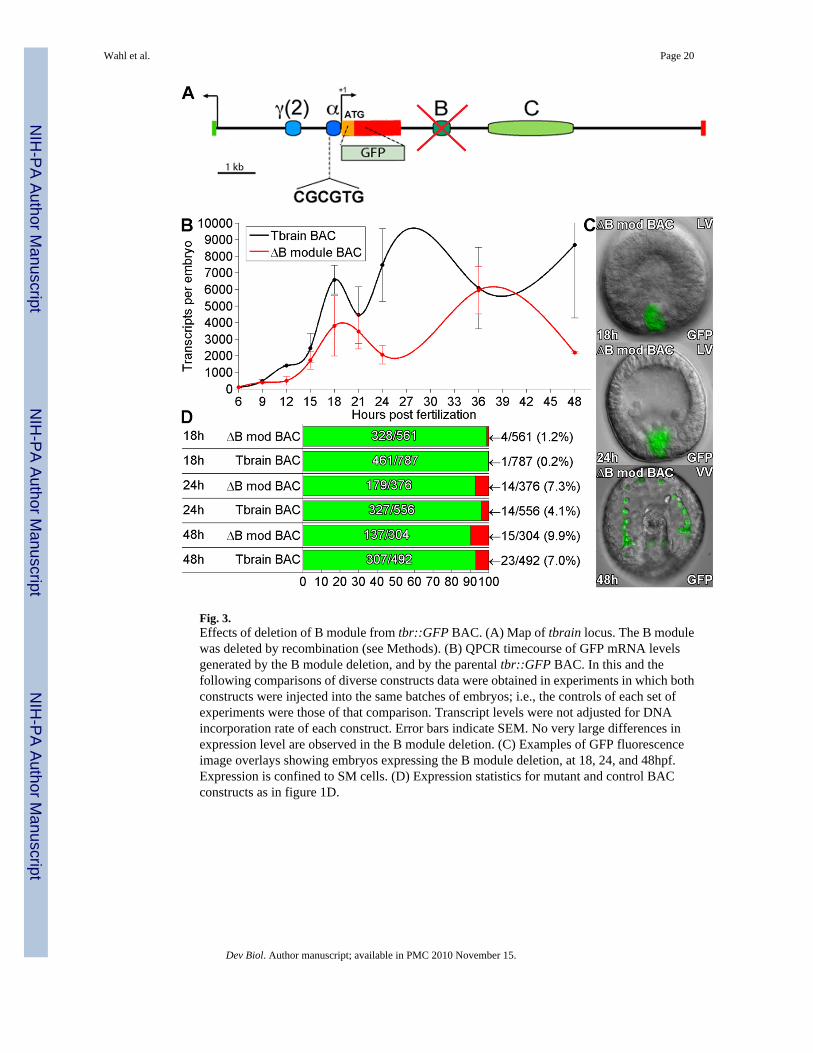
Fig. 3.Effects of deletion of B module from tbr::GFP BAC. (A) Map of tbrain locus. The B modulewas deleted by recombination (see Methods). (B) QPCR timecourse of GFP mRNA levelsgenerated by the B module deletion, and by the parental tbr::GFP BAC. In this and thefollowing comparisons of diverse constructs data were obtained in experiments in which bothconstructs were injected into the same batches of embryos; i.e., the controls of each set ofexperiments were those of that comparison. Transcript levels were not adjusted for DNAincorporation rate of each construct. Error bars indicate SEM. No very large differences inexpression level are observed in the B module deletion. (C) Examples of GFP fluorescenceimage overlays showing embryos expressing the B module deletion, at 18, 24, and 48hpf.Expression is confined to SM cells. (D) Expression statistics for mutant and control BACconstructs as in figure 1D.
Wahl et al. Page 20
Dev Biol. Author manuscript; available in PMC 2010 November 15.
NIH
-PA Author Manuscript
NIH
-PA Author Manuscript
NIH
-PA Author Manuscript

Fig. 4.Effects of deletion of C module from tbr::GFP BAC. (A) Map of tbrain locus. The C modulewas deleted by recombination (see Methods). (B) QPCR timecourse of GFP mRNA levelsgenerated by the C module deletion, and by the parental tbr::GFP BAC. Sharply decreasedexpression is observed relative to the control tbr::GFP BAC. Error bars indicate SEM ofrepeated experiments. (C) Examples of GFP fluorescence image overlays showing embryosexpressing the B module deletion, at 18, 24, and 48hpf. (D) Expression statistics for mutantand control BAC constructs as in figure 1D.
Wahl et al. Page 21
Dev Biol. Author manuscript; available in PMC 2010 November 15.
NIH
-PA Author Manuscript
NIH
-PA Author Manuscript
NIH
-PA Author Manuscript
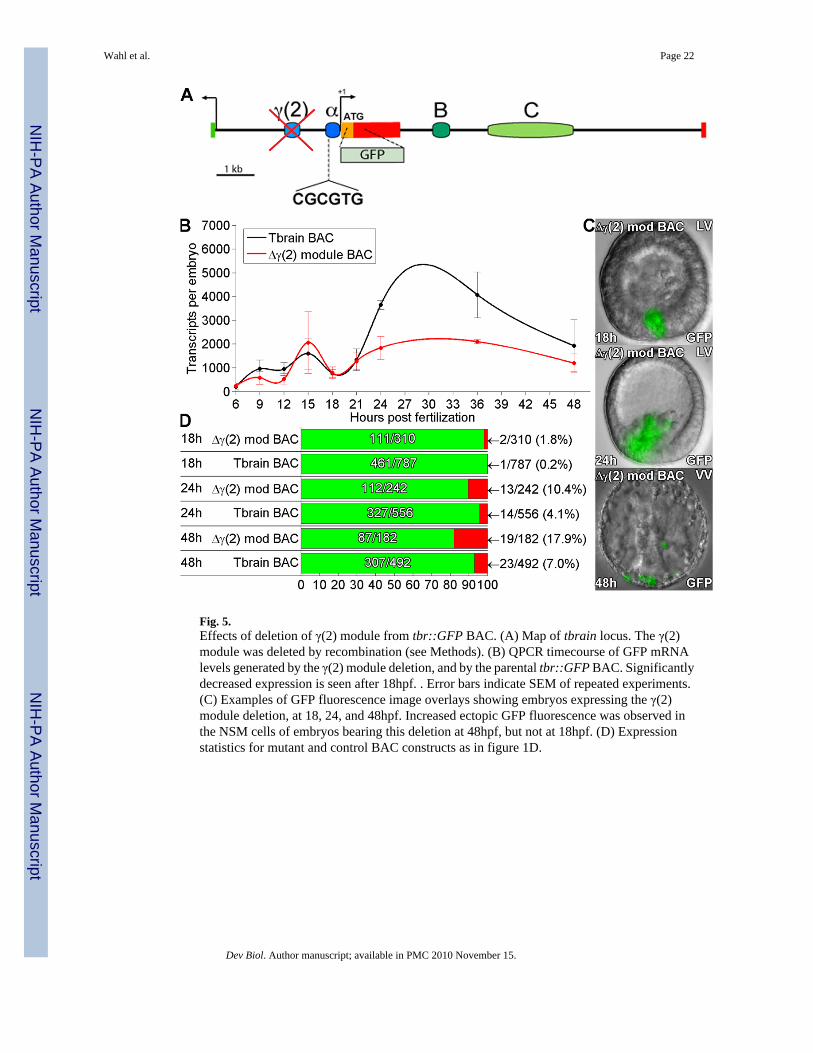
Fig. 5.Effects of deletion of γ(2) module from tbr::GFP BAC. (A) Map of tbrain locus. The γ(2)module was deleted by recombination (see Methods). (B) QPCR timecourse of GFP mRNAlevels generated by the γ(2) module deletion, and by the parental tbr::GFP BAC. Significantlydecreased expression is seen after 18hpf. . Error bars indicate SEM of repeated experiments.(C) Examples of GFP fluorescence image overlays showing embryos expressing the γ(2)module deletion, at 18, 24, and 48hpf. Increased ectopic GFP fluorescence was observed inthe NSM cells of embryos bearing this deletion at 48hpf, but not at 18hpf. (D) Expressionstatistics for mutant and control BAC constructs as in figure 1D.
Wahl et al. Page 22
Dev Biol. Author manuscript; available in PMC 2010 November 15.
NIH
-PA Author Manuscript
NIH
-PA Author Manuscript
NIH
-PA Author Manuscript

Fig. 6.Expression of a minimal γ(2) module construct. A short construct consisting of the isolated γ(2) module associated with our standard endo16-GFP expression vector was constructed asdescribed in Methods (construct γ(2)::EpGFP). (A) QPCR timecourse of GFP mRNA levelsgenerated by γ(2)::EpGFP (red), and co-plotted with the calculated difference between thetimecourse produced by the control tbr::GFP BAC and that produced by tbr::GFP BAC fromwhich γ(2) module had been deleted (blue). All data are after normalization to the numbers ofcopies of the respective vectors incorporated at each timepoint, as above. . Error bars indicateSEM. (B) Examples of GFP fluorescence image overlays showing embryos expressing γ(2)::EpGFP, at 18, 24, and 48hpf. (C) Expression statistics for γ(2)::EpGFP together withcontrol tbr::GFP BAC as in figure 1D.
Wahl et al. Page 23
Dev Biol. Author manuscript; available in PMC 2010 November 15.
NIH
-PA Author Manuscript
NIH
-PA Author Manuscript
NIH
-PA Author Manuscript

Fig. 7.Transcription factor binding sites in a subregion of γ(2) module. (A) Map of a 71bp subregionof γ(2) module, showing the positions of oligonucleotides (H-P) used in the electrophoretic gelmobility shift assay. The inferred locations of putative target sites are indicated: Ets, blue; Otx,yellow; a possible bHLH site is underlined. (B) Gel shift results with oligonucleotides (H-P).Similar banding patterns are observed on oligonucleotides containing a putative Otx bindingsite (M-O, yellow arrowheads) and Ets factor binding sites (K-L and N-O, blue arrows). (C)Summary of expression results obtained with indicated site mutations and MASO treatments.Data are for 24h embryos. All constructs, if they expressed at all, expressed accurately, andonly quantitative expression results are shown. Embryos with ectopic GFP expression wererare and omitted from this figure for clarity; a full tally is provided in Table S.3. Mutation ofthe putative Otx site had a minor effect and mutation of the bHLH sites had no effect onexpression of γ(2)::EpGFP. However, mutation of either Ets binding site or deletion of the30bp region overlapping an Ets site (gray in (A)) dramatically decreased the number of embryosexpressing GFP without affecting the spatial expression pattern. Mutation of both Ets siteseliminated almost all expression. Coinjection of γ(2)::EpGFP with a random MASO (N MO)or MASOs directed against Ets family members Ets4 or Tel had no effect on expression, but−ets1/2 MASO and elk MASO dramatically decreased the number of embryos expressing GFP.
Wahl et al. Page 24
Dev Biol. Author manuscript; available in PMC 2010 November 15.
NIH
-PA Author Manuscript
NIH
-PA Author Manuscript
NIH
-PA Author Manuscript
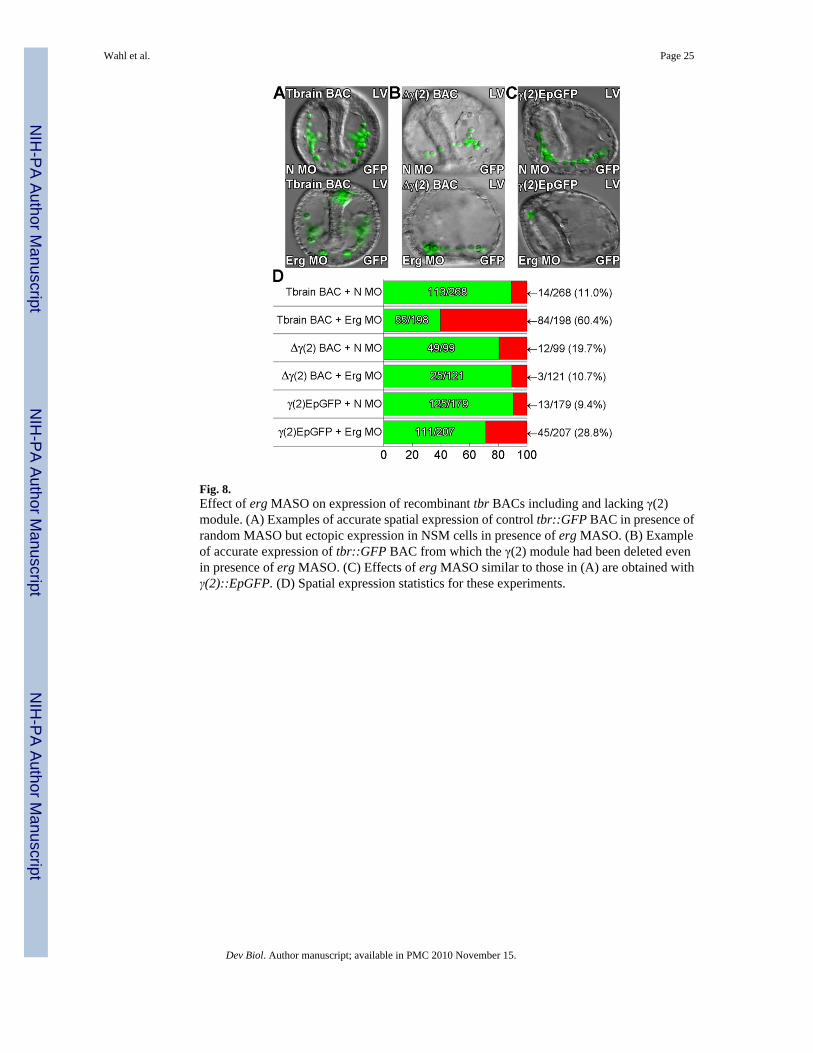
Fig. 8.Effect of erg MASO on expression of recombinant tbr BACs including and lacking γ(2)module. (A) Examples of accurate spatial expression of control tbr::GFP BAC in presence ofrandom MASO but ectopic expression in NSM cells in presence of erg MASO. (B) Exampleof accurate expression of tbr::GFP BAC from which the γ(2) module had been deleted evenin presence of erg MASO. (C) Effects of erg MASO similar to those in (A) are obtained withγ(2)::EpGFP. (D) Spatial expression statistics for these experiments.
Wahl et al. Page 25
Dev Biol. Author manuscript; available in PMC 2010 November 15.
NIH
-PA Author Manuscript
NIH
-PA Author Manuscript
NIH
-PA Author Manuscript
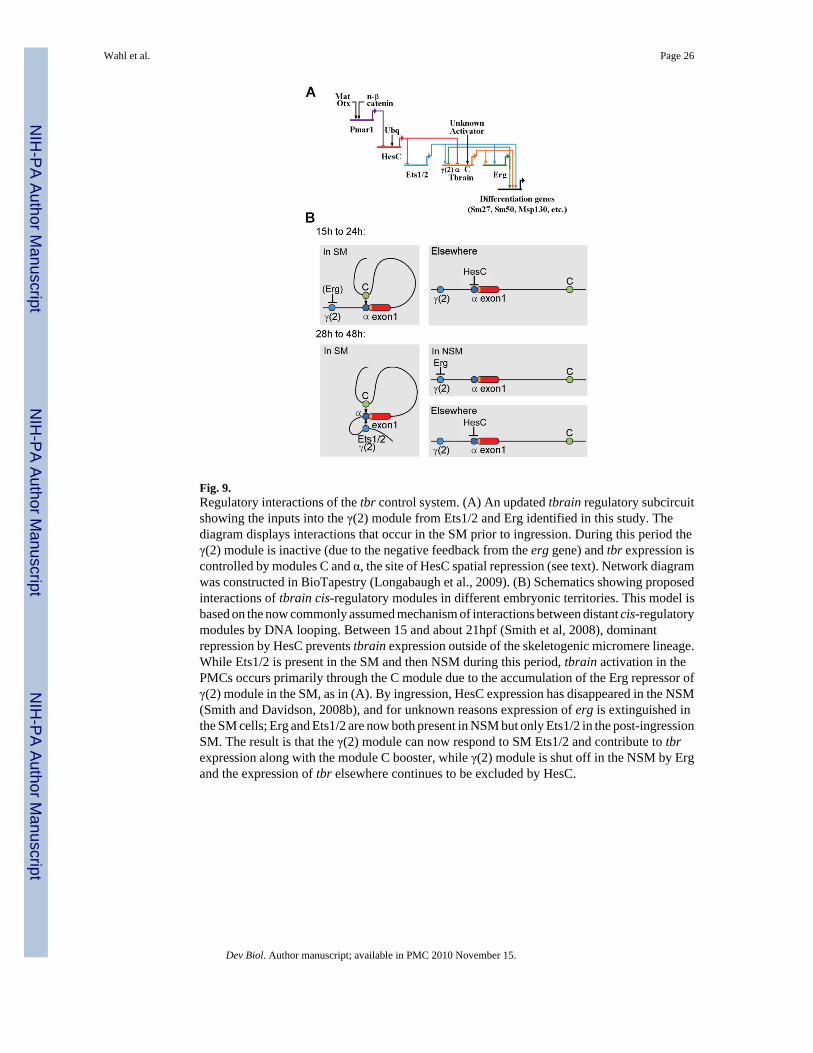
Fig. 9.Regulatory interactions of the tbr control system. (A) An updated tbrain regulatory subcircuitshowing the inputs into the γ(2) module from Ets1/2 and Erg identified in this study. Thediagram displays interactions that occur in the SM prior to ingression. During this period theγ(2) module is inactive (due to the negative feedback from the erg gene) and tbr expression iscontrolled by modules C and α, the site of HesC spatial repression (see text). Network diagramwas constructed in BioTapestry (Longabaugh et al., 2009). (B) Schematics showing proposedinteractions of tbrain cis-regulatory modules in different embryonic territories. This model isbased on the now commonly assumed mechanism of interactions between distant cis-regulatorymodules by DNA looping. Between 15 and about 21hpf (Smith et al, 2008), dominantrepression by HesC prevents tbrain expression outside of the skeletogenic micromere lineage.While Ets1/2 is present in the SM and then NSM during this period, tbrain activation in thePMCs occurs primarily through the C module due to the accumulation of the Erg repressor ofγ(2) module in the SM, as in (A). By ingression, HesC expression has disappeared in the NSM(Smith and Davidson, 2008b), and for unknown reasons expression of erg is extinguished inthe SM cells; Erg and Ets1/2 are now both present in NSM but only Ets1/2 in the post-ingressionSM. The result is that the γ(2) module can now respond to SM Ets1/2 and contribute to tbrexpression along with the module C booster, while γ(2) module is shut off in the NSM by Ergand the expression of tbr elsewhere continues to be excluded by HesC.
Wahl et al. Page 26
Dev Biol. Author manuscript; available in PMC 2010 November 15.
NIH
-PA Author Manuscript
NIH
-PA Author Manuscript
NIH
-PA Author Manuscript